MPRA The Impact of the US Subprime Mortgage Crisis on the World and East Asia
←
→
Page content transcription
If your browser does not render page correctly, please read the page content below

M PRA
                            Munich Personal RePEc Archive

The Impact of the US Subprime
Mortgage Crisis on the World and East
Asia

Sayuri Shirai

Keio University

2. April 2009

Online at http://mpra.ub.uni-muenchen.de/14722/
MPRA Paper No. 14722, posted 19. April 2009 04:34 UTC
The Impact of the US Subprime Mortgage Crisis

                              on the World and East Asia
             -Through Analyses of Cross-Border Capital Movements-

                                          April 2009
                                       Keio University
                                     Prof. Sayuri SHIRAI

                                              Abstract
The world economy currently suffers from a global financial and economic crisis that has become
severe since the second half of 2008. This global financial situation was triggered by the advent of
the subprime mortgage crisis in the United States that became apparent from the mid-2007s. Europe
was the next affected, thereafter its contagion spread to the rest of the world. East Asia did not
escape. The nature of the current global financial crisis is unprecedented in terms of (1) the scale of
the problems in the financial sector (particularly in the United States and Europe), (2) the depth and
speed of contagion worldwide (through financial sector and trade linkages), and (3) the severity of
the recession (particularly in emerging market economics, small countries, and East Asia). This
paper analyzes, mainly, cross-border capital movements by looking at the pre-crisis features of the
United States as the crisis hypocenter and its relationships with other countries. Detailed
observations are conducted with respect to cross-border investment in stocks and debt securities, as
well as banking activities. The paper then sheds light on the impact of the subprime mortgage crisis
on cross-border capital movements in the United States, the United Kingdom, and East Asia. Other
performance indicators such as exchange rates, economic growth and international trade are also
discussed in the case of East Asia. The paper examines several challenges the recent crisis poses for
East Asia.

                                                  1
The Impact of the US Subprime mortgage Crisis on the World and East Asia
                     -Through Analyses of Cross-Border Capital Movements-
                                              April 2009
                                            Keio University
                                         Prof. Sayuri SHIRAI

I.       INTRODUCTION
The world economy currently suffers from a global financial and economic crisis that has become
severe since the second half of 2008. This global financial situation was triggered by the advent of
the subprime mortgage crisis in the United States that became apparent from the mid-2007s. Europe
was the next affected, thereafter its contagion spread to the rest of the world. East Asia did not
escape. The nature of the current global financial crisis is unprecedented in terms of the scale of the
problems in the financial sector (particularly in the United States and Europe), the depth and speed
of the worldwide contagion (through financial sector linkages as well as trade linkages), and the
severity of the recession (particularly in emerging market economics, small countries, and East
Asia).

The subprime mortgage crisis in the United States is far more complicated than any series of crises
in the past (e.g., the Great Depression of 1929-1930s, the Savings and Loan [S&L] crisis in the
United States in the 1980s-90s, the Long Term Capital Management [LTCM] crisis in the United
States in 1998, and the IT bubble bust of 2000-01) for several reasons.

First, many securitized assets and derivatives had been transacted in the over-the-counter market;
thus there was a paucity of information, and hence counterparty, credit, liquidity risks were more
severe than the cases of exchange-traded products. This absence of precise information about the
reality of the financial conditions of many financial institutions in the midst of the crisis enhanced
the anxiety felt by financial institutions and investors. This has lead to the curtailing of investments
and financial flows, adversely affecting the financial and real sectors to an even greater extent.

Second, capital adequacy requirements were applicable only to deposit-taking banks (commercial
banks), not to other financial institutions (such as investment banks, financial companies, and hedge
funds). While other financial institutions would not be protected under the deposit insurance system
in the event of a financial crisis, they enjoyed exemptions from the stringent monitoring and capital
adequacy requirement imposed by regulatory authorities. This enabled them to expand businesses
related to subprime mortgage origination, securitization, and derivatives. They got, mostly,
short-term funds from the market and invested in longer-term illiquid financial assets, such as ABSs
(asset-backed securities) and CDOs (collateralized debt obligations).

                                                   2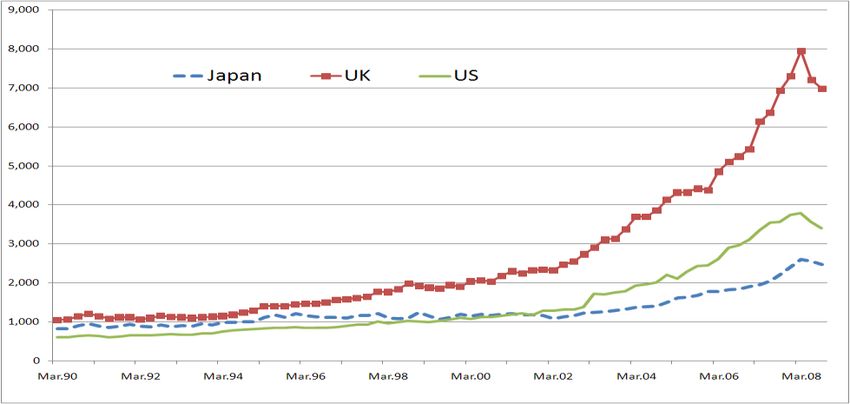
Third, commercial banks attempted to circumvent regulatory monitoring and the capital adequacy
requirements by establishing SIVs (structured investment vehicles) as off-balance units. The SIVs
issued short-term commercial paper to invest in longer-term and lower-quality ABSs and CDOs. The
commercial paper is called ABCPs (asset-backed commercial papers). Its collateral assets largely
consisted of mortgages originating from commercial banks and mortgage finance companies.
Commercial banks offered back-up lines of credit and guarantees to their SIVs (which functioned as
a credit enhancement for SIVs) in exchange for a share of profits generated by them. Commercial
banks and mortgage finance companies arranged mortgages without carefully considering the
affordability to borrowers or the credit rating of the borrowers. They could do this because they
could transfer these mortgages from their balance sheets by packaging and securitizing them and
then distributing the product to final investors. Commercial banks also used mortgage brokers by
outsourcing some of their mortgage businesses (such as negotiations with borrowers) and paying
fees. These off-balance sheet activities, or an ―originate-to-distribute‖ business model, expanded in
the 2000s, particularly in regard to subprime mortgages. However, the regulatory arbitrage and
resultant potential risks borne by commercial banks (such as the difficulty to roll-over commercial
papers by SIVs as a result of declining values of the collateral assets) were underestimated by
commercial banks and by regulatory authorities.1

Fourth, credit rating agencies failed to capture the risks involved in MBSs (mortgage-backed
securities) and CDOs. Since their risk rating practices have been based largely on historical data, a
forward-looking analysis of risks related to newly-innovated financial assets was a difficult task.
Without any real deep understanding of the correlations between various collateralized assets and
associated default probabilities, these securitized assets were rated highly. The rating agencies’
sudden decisions to downgrade the ratings of these products occurred in the midst of market turmoil,
further raising investors’ anxiety and promoting a fire sales of these products. Since the Basel II
capital adequacy requirement has allowed regulatory authorities to utilize credit ratings in the case
that banks have no internal risk models, banks used these ratings without seriously considering the
appropriateness of the rating methods. Credit rating agencies also benefitted from their substantial
charges related to advisory services over the development of structured credit assets. Thus there were
severe internal conflicts of interest that emerged between the advisory businesses and the rating

1  According to OECD (2007), as of June 2007, US ABSs outstanding amounted to about $4.2
trillion. About 56% of these ABSs were comprised of residential MBSs. Some of these ABSs were
sold directly to investors, while others were sold to conduits established by the parent commercial
banks or other financial institutions for further re-packaging of ABSs. Such conduits are SIVs and
CDOs. About half of the estimated $1.3 billion CDOs were purchased by hedge funds, about a
quarter by banks, and the rest by insurance firms and asset managers. Commercial banks invested
heavily in mezzanine (BB to BBB) and equity tranches. About three quarters of CDOs were
purchased in the United States, with less than 20% in Europe.
                                                   3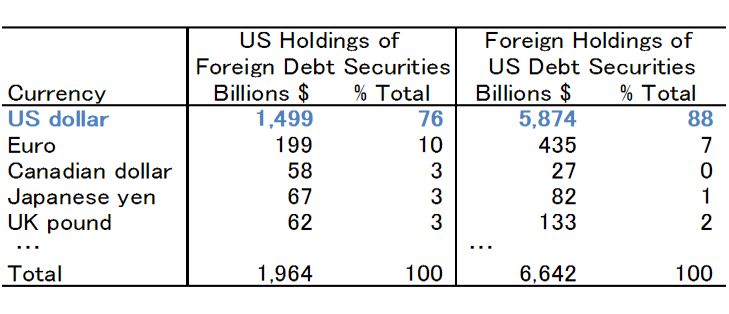
services within the rating agencies.

While the current crisis has been compared with the Great Depression of the 1930s, real sector
damage remains relatively mild to date as compared with that resulting in the 1930s. For example, as
at February 2009 the unemployment rate in the United States was 8.1%, whereas the unemployment
level reached 25% in 1933. Rather, the current crisis has brought on severe problems with respect to
the capital and financial markets. Banks and other financial institutions have faced large losses that
have impaired their own capital. The rapid loss in their creditworthiness caused a sharp decline in
transactions in the interbank markets and a plunge in their stock prices, which further deteriorated
their financial stability. Amid growing financial uncertainty, the money, debt securities, and stock
markets shrank rapidly, making it extremely difficult for financial and non-financial firms to obtain
funds.

The deepening of financial problems has led many central banks to lower interest rate policies to the
historically low levels, supply ample liquidity to the financial institutions (and also directly and
indirectly to non-financial firms in some countries by purchasing commercial papers and bonds),2 as
well as to provide them with US dollars (through a reduction in foreign reserves and an
establishment of swap arrangements with the US Federal Reserve Board [FRB]). 3 Some
governments have also made purchases of MBSs and other NPLs (non-performing loans) from
major banks to help them maintain liquidity in their lending activities. Moreover, many governments
have been forced to recapitalize or nationalize major financial institutions, as well as instituting
expansionary fiscal policies (tax cuts and increased expenditure) to stimulate aggregate demand. The
total amount of capital injected by governments (including the scheduled amount) recorded nearly
$1 trillion. Of this amount, $765 billion was injected into over 300 financial institutions in the
United States.

The current crisis appears unique in the sense that the US dollar, the currency at the hypocenter of
the current global crisis, has strengthened against almost all foreign currencies, except the Japanese
yen and the Chinese yuan (see Section III). This differs from past experiences when the currencies of
the crisis-originating countries tended to reduce their values against other currencies. This unique
situation reflected the increased demand for the US dollar in the de-leveraging process—mainly
through a withdrawal by US investors from global stock investment and a decline in

2The  Bank of Japan began to purchase commercial paper (up to ¥3 trillion) and corporate bonds (up
to ¥1 trillion) in 2009 from banks. Meanwhile, the United Kingdom formed a fund of £50 billion to
purchase corporate bonds and treasury securities in 2009.
3 For example, major swap arrangements with the FRB were made by the European Central Bank,

Bank of Japan, Swiss National Bank, Bank of England, Reserve Bank of Australia, Reserve Bank of
New Zealand, Bank of Canada, Sweden’s Riksbank, Norway’s Norges Bank, and Bank of Korea.
                                                  4
dollar-denominated funds for banks in Europe (and other regions). It also reflect that the crisis’
contagion reduced the prices of almost all financial assets worldwide, so that investors could have
regarded some US financial assets (such as US treasury securities) as safer than other foreign assets.
This paper consists of 4 sections. Section II analyzes cross-border capital flows by looking at the
pre-crisis features of the United States as the hypocenter of the global crisis. Detailed observations
are conducted with respect to cross-border stocks and debt securities investments, as well as banking
activities prior to the crisis. Section III sheds light on the impact of the subprime mortgage crisis on
cross-border capital movements in the United States, the United Kingdom, and East Asia. Other
performance indicators such as exchange rates, economic growth and international trade are also
discussed in the case of East Asia. Section IV examines several challenges posed to East Asia by the
recent crisis.
II. CROSS-BORDER CAPITAL FLOWS BEFORE THE SUBPRIME MORTGAGE
CRISIS
2-1. Features of Cross-Border Stock Investment Flows
Before the subprime mortgage crisis arose, the United States was an active investor in world stock
markets. US Investors held foreign stocks of about $5 trillion as of end-2007 (Table I), while foreign
investors held US stocks of about $3.1 trillion as of end-June 2007 (Table II). This indicates that the
United States was a net investor in foreign stocks, despite its position as the largest net external
debtor in the world. That means that the United States contributed to the development of global stock
markets to a significant degree by expanding the investor base of other countries.
The United States actively invested in European stocks, accounting for half of its total foreign stock
investment. The country in which the United States had its largest investment was the United
Kingdom (accounting for 18% of the UK stock market capitalization), followed by Japan (12% of
Japanese stock market capitalization), France (12% of French stock market capitalization), and
Germany (15% of German stock market capitalization). Indeed, US investors were the largest
external investor in the United Kingdom (accounting for 43% of the value of total UK stocks held by
foreign investors), Germany (32%), and France (34%), based on IMF data. The dominance of the
United Kingdom as an investment destination country is not surprising given that London has one of
the world’s most attractive stock markets. The number of listed firms there exceeds 3,300 (the New
York Stock Exchange has just over 2,300). As well, ―principle-based‖ regulation applied in the
United Kingdom is regarded as less rigid than the ―rule-based regulation‖ practiced in the United
5States.4
The amount of East Asian stocks held by US investors was much smaller than that of European
stocks. Nevertheless, US investors had a large presence in East Asian stock markets. IMF data shows
that US investors were the largest external source of investment in a number of East Asian countries;
Hong Kong (accounting for about 36% of the total value of Hong Kong stocks held by foreign
investors), Indonesia (38%), Japan (50%), Korea (50%), Malaysia (33%), Singapore (43%), and
Thailand (34%).
Table I. Amount of Foreign Stocks Held by US Investors (As of end-2007)
Source: Based on US Treasury data
Regarding foreign investment in US stock market, European investors were more active than East
Asian ones (Table II). Investment from Europe in the United States reached $1.6 trillion and
accounted for half of the total US stocks held by foreign investors. This amount was far greater than
that held by East Asia (which accounted for 18% of US stocks held by foreign investors). The United
Kingdom was the most active investor, holding $421 billion of US stocks as of June 2007. Japan was
the most active East Asian investor, but its scale ($220 billion) was considerably smaller than the
United Kingdom and Luxemburg.
While foreign investors held a substantial amount of US stocks ($3.1 trillion), this was only 11% of
the total US stock market. This reflects the large number of domestic individual and institutional
4 ―Principle-based‖ regulation emphasizes supervision and prevention by promoting good practices
that rely on basic principles—such as market confidence, public awareness, consumer protection, as
well as a reduction in financial crimes. Self-regulation by securities industry participants (e.g.,
securities firms) is also encouraged. By contrast, ―rule-based‖ regulation emphasizes enforcement
actions through actively prosecuting corporate scandals as crimes. The Sarbanes-Oxley Act of 2002,
which was introduced after the accounting scandals of Enron and World Com, can be regarded as an
example of rule-based regulation. The Act imposes strict guideless regarding reporting in securities
markets to enhance corporate responsibility and financial disclosure as well as to minimize
accounting frauds. It has been pointed out that this costly regulation has induced many firms to raise
funds on the UK stock market.
6investors in the United States. The amount of financial assets of US households was $50 trillion in
2007, the largest in the world and much greater than that of Japan’s individually held financial assets
($13 trillion). US households held 28% of the total US stocks. US mutual funds, with financial assets
of over $8 trillion, were the second largest investor as a group, holding 22% of US stocks
outstanding. The ratio of foreign ownership in the United States was then smaller than the ratios of
Indonesia (about 20%), Japan (about 30%), Korea (about 35%), and Thailand (about 30%) in 2006.
This suggests that the US has a lower degree of dependence on foreign investors than does East Asia.
Table II. The Amount of US Stocks Held by Foreign Investors (As of June 2007)
Source: Based on US Treasury data.
In the case of China, foreign investors held $388 billion of Chinese stocks in 2007 (according to the
IMF data). Investors from Hong Kong were the largest group ($153 billion), followed by the United
States ($96 billion). Since 2002, foreign investors have been allowed to invest in China’s capital
market through the system of ―Qualified Foreign Institutional Investors (QFII)‖. A QFII license is
issued by the China Securities Regulatory Commission and the People’s Bank of China to applicant
entities that meet certain requirements. For example, a fund management institution must have over
5 years experience of operating a fund business and have managed assets of not less than $5 billion.
A securities firm must have over 30 years experience of operating a securities business, have paid-in
capital of not less than $1 billion, and manage securities assets of not less than $10 billion. In 2008,
24 foreign institutions were granted QFII status with total permitted investment of $2.9 billion (a
total of 76 institutions had been granted QFII status with total permitted investment of $30 billion as
of January 2008).
2-2. Features of Cross-Border Debt Securities Investment Flows
Compared with stocks ($4.95 trillion), US investors invested less actively in foreign debt securities
($1.96 trillion) as at end-2007 (Table III). The most of US investment in foreign debt securities were
allocated to foreign private sector debt securities ($1.2 trillion as compared with $737 billion for
government ones) and long-term debt securities ($1.6 trillion as opposed to $357 billion for
7short-term ones). The small amount of investment in foreign government securities partly reflects
that the United States hold only a small amount of foreign reserves (about $74 billion) as it hardly
intervenes in the foreign exchange markets. The United States held a substantial amount of UK debt
securities ($427 billion), followed by securities issued in Cayman Islands ($312 billion), Canadian
securities ($207 billion), French securities ($100 billion) and German securities ($97 billion). Most
of these bonds were private sector debt securities. The United States remained the largest foreign
investor of UK debt securities, accounting for 27% of the total value of UK debt securities held by
foreign investors (according to IMF data).
Table III. The Amount of Foreign Debt Securities Held by US Investors
(As of end-2007, Billions of US dollars)
Source: Prepared based on US Treasury data.
While US investors were not active in investing in foreign debt securities, foreign investors actively
invested in the US debt securities market. As of June 2007, foreign investors held US debt securities
equivalent to $6.6 trillion (Table IV), which exceeded the amount of US stocks ($3.1 trillion) held by
them. Japan and China stood out as the largest investors in US debt securities, $976 billion and $894
billion, respectively. Their debt securities were mostly longer-term ones such as treasury securities
and agency-related securities, and were relatively risk-free. Agency-related securities include bonds
and mortgaged-backed securities issued by government-sponsored enterprises (e.g., Fannie Mae and
Freddie Mac). The US treasury securities held by Japan and China constitute a substantial part of
their foreign reserves.
UK investors, the third largest group of foreign investors, purchased a substantial amount ($405
billion) of corporate debt securities; corporate bonds and ABSs of $263 billion and $142 billion,
respectively. Investors from other European countries, such as Luxembourg, Belgium, Ireland,
8Switzerland, and Netherlands, had investment tendencies similar to those of UK investors. These
countries hold few foreign reserves and thus were less keen than East Asia on holding foreign
government securities. This could be because most of these countries have adopted the euro as a
single currency and thus were largely precluded from intervening in the foreign exchange market.
The United Kingdom, which still has its own currency, also rarely intervenes in the foreign exchange
market, similar to the United States. This view is supported by Figure 1, which shows that East Asia
accounts for more a half of the total foreign reserves accumulated worldwide.
Based on the above observations, it can be concluded that European investors were greater
risk-takers than East Asian investors. It can be said that East Asian investors contributed to lowering
US long-term interest rates by holding large amounts of US treasury securities. But East Asian
investors were less willing to hold other debt securities, such as corporate bonds and ABSs. By
contrast, European investors were more interested in holding riskier assets, contributing to financing
firms and private sector issuers of securitized assets in the United States. This suggests that
European investors would suffer most in the event of a US-led financial crisis and resultant plunge in
financial asset prices.
Table IV. US Debt Securities Held by Foreign Investors
(As of June 2007, Billions of US dollars)
Source: Based on US Treasury data.
9Figure 1. Foreign Reserves (% of World Foreign Reserves)
Source: Based on World Bank data.
An important point regarding US debt securities is that US issuers issued debt securities largely in
US dollars, regardless of whether the issuers were public or private sector. About 88% of
foreign-held US debt securities were denominated in US dollars (Table V). Moreover, US investors
could purchase a large amount of foreign debt securities that were also denominated in US dollars.
About 76% of foreign debt securities held by US investors were denominated in US dollars. Since
most of the foreign securities held by US investors in Europe were private sector securities, this
supports the view that the US dollar remains the most important hard currency in cross-border bond
market transactions. These data also indicate that both US issuers as well as investors faced little
exchange rate risk.
Table V. Currency Denomination of Foreign Debt Securities Held by US Investors and US Debt
Securities Held by Foreign Investors (As of end-2007 and June 2007, respectively)
Source: Based on US Treasury data.
Regarding East Asian debt securities, the nationalities of foreign investors were diverse (based on
IMF data). As for Japanese debt securities (the outstanding amount of $382 billion in 2007),
investors in France were the largest group (holding $87 billion), followed by the United States ($53
10billion). Chinese debt securities (with $20 billion held by foreign investors) were owned largely by
investors in Hong Kong ($13 billion). Hong Kong debt securities, $16.3 billion held by foreign
investors, were largely held by investors in Singapore ($3.5 billion) and Mauritius ($3.1 billion).
Korean debt securities ($93 billion held by foreign investors) were held largely by investors in Hong
Kong ($17 billion), France ($16 billion), and Singapore ($14 billion).
2-3. Features of Cross-Boarder Banking Activities
Cross-border banking activities expanded globally in the early 2000s and became dominated by
banks in the United States, the United Kingdom, and other European countries. Banks increased
cross-border claims not only to other banks and their affiliates operating abroad, but also to
non-bank firms (including loans, corporate bonds, ABSs, MBSs, CDOs, and stocks). In particular,
UK nationality (local) banks and affiliates of foreign nationality banks operating in the United
Kingdom were the most active players in cross-border banking activities around the world. Foreign
bank affiliates operating in the United Kingdom primarily originated from the United States, France,
Germany, Switzerland, and other European countries.
According to the BIS data, external (on-balance) assets and liabilities of banks (including local
banks as well as affiliates of foreign nationality banks residing in the country under consideration)
were largest in the United Kingdom. The amount of external assets and liabilities recorded as at
December 2007 were $6,843 billion (2.4 times larger than UK GDP) and $7,305 billion (2.6 times)
(Table VI). The absolute size of external assets and liabilities was substantial and indeed the largest
in the world, so the net external assets resulted in only minus value of $462 billion. This indicates
that the United Kingdom offered the best location for both local and foreign banks to engage in
cross-border bank lending and borrowing activities.
Table VI. Cross-Border Banking Activities (Billions of US Dollars)
Source: Based on BIS data.
About 54% of external assets held by banks in the United Kingdom were made up of external assets
vis-à-vis banks abroad (including foreign affiliates). Almost all were in the form of loans and
11deposits. The remaining 46% of external assets comprised assets against nonbanks abroad (Table
VII). Of this amount, 65% were in the form of loans and deposits, while 35% were largely debt
securities issued by non-bank firms in the United States (including structured credit products, and
corporate bonds). In particular, local banks as well as affiliates of German and Swiss nationality
banks operating in the United Kingdom were keen on this pattern of investment. On the other hand,
affiliates of US nationality banks operating in the United Kingdom did not engage much in this
pattern of investment and were more actively engaged in loan and deposit activities.
Table VII. External Assets and Liabilities of Banks
Operating in Designated Countries (%)
Source: Based on BIS data.
On the other hand, about 70% of the external liabilities of banks in the United Kingdom were
generated from banks abroad (including foreign affiliates). These were largely from funds provided
by banks in the oil-exporting countries, Switzerland, Singapore, Hong Kong, and the euro area (BIS,
2008a). These external asset and liability features indicate a transformation of international money
12through the intermediation of banks in the United Kingdom; from diverse interbank funding sources
worldwide to nonbank claims in the United States (Figure 2). This phenomenon is consistent with
Table IV in that investors (including banks) in the United Kingdom were most active in investing in
US long-term corporate debt securities.
Figure 2. Cross-Border Banking Activities in the United Kingdom
Source: Prepared by the Author.
Compared with banks in the United Kingdom, banks based in the United States had smaller external
assets and liabilities. The amounts of their external assets and liabilities were $2,989 billion and
$3,735 billion, respectively. These amounts accounted for only 22% and 27%, respectively, of US
GDP, far below the ratios for banks in the United Kingdom. These facts support the view that the
United Kingdom (namely, London) was a more important place for cross-border banking activities
(where both local banks and foreign bank affiliates were active players) than the United States
(namely, New York). It is clear that one of the strong advantages of London as a competitive
international financial centre is the presence of the internationally-active banking sector that
circulates global money from oil-exporting and other countries to the United States and other regions
of the world.
The data on the United States, shown in Tables VI and VII, indicate cross-border claims of banks
located in the United States. These banks include both local (US nationality) banks and affiliates of
foreign nationality banks located in the United States. In order to view the data with respect to
foreign claims by US nationality banks and their foreign affiliates, one should look at ―consolidated
foreign claims‖ of US nationality banks (compiled by BIS). The data cover cross-border claims by
US nationality banks and their foreign affiliates, as well as local claims of US nationality banks’
foreign affiliates with local residents, with positions between affiliates of the same bank having been
netted out. The data include both domestic and foreign currency-denominated claims. The amount of
consolidated foreign claims of US nationality banks amounted to $6,484 billion as at December
2007. This amount was the largest in the world, suggesting that US nationality banks performed
aggressively in the international business environment by extending business through foreign
13affiliates. In particular, their foreign affiliates’ claims were conducted actively with local residents in
local currencies. US nationality banks’ foreign affiliates were most active in the United Kingdom,
followed by their activities in Germany, France, Japan, and Switzerland. In the case of the United
Kingdom, the amount of consolidated foreign claims of UK nationality banks recorded $4,546
billion—the second largest in the world, but much smaller than that of US nationality banks.5
Banks in the United States held 77% of their external financial assets in the form of loans and
deposits vis-à-vis banks abroad (including foreign affiliates), as shown in Table VII. Similarly, about
72% of their external financial liabilities were comprised of loans and deposits obtained from banks
abroad. Banks in the United States also obtained funds from overseas nonbank entities (mainly
through loans and deposits). This pattern is illustrated in Figure 3 and contrasts with that of banks in
the United Kingdom. Banks in the United Kingdom actively engaged in financing nonbank
borrowers in the United States, whereas banks in the United States did not actively engage in
financing nonbank borrowers in other countries. This difference could be explained by the fact that
the United States offered the biggest market for structured credit assets, thus attracting foreign
investors and banks. US nationality banks naturally invested in these assets through the utilization of
domestic SIVs.
Figure 3. Cross-Border Banking Activities in the United States
Source: Prepared by the Author.
Banks in Germany and France also actively engaged in cross-border banking activities, as evidenced
by the relatively large sizes of their external assets and liabilities. Over 60% of their external assets
comprised assets vis-à-vis banks abroad (including foreign affiliates) in Germany and France (Table
5 The data on the consolidated claims of reporting banks and the data reported in Table VI are
compiled from very different reports that each country’s central banks receive from their resident
commercial banks. In addition, the former excludes cross-border positions between affiliates of the
same bank, while the latter includes them. Thus, the direct comparison between these data is not
desirable. Nonetheless, it can be said that there were numerous foreign bank affiliates operating in
the United Kingdom (as compared with the United States), while US nationality banks were highly
active in international banking businesses through establishing numerous foreign affiliates in many
countries (as compared with UK nationality banks).
14VII). Of this amount, more than 70% was in the form of loans and deposits vis-à-vis banks abroad
and less than 30% was in the form of debt securities issued by banks abroad. The rest (over 30%) of
external assets were invested in loans and debt securities issued by nonbank firms residing mainly in
the United States. Regarding external liabilities, the reliance of banks in Germany and France on
sources of funds from banks abroad was large (about 78% for banks in Germany and nearly all for
banks in France). Although their patterns of cross-border activities were not as distinctive as the case
of the United Kingdom, they shared similar features.
The amounts of consolidated foreign claims of German nationality banks and French nationality
banks recorded $2,288 billion and $1,977 billion, respectively. These amounts were much smaller
than those of US and UK nationality banks. Foreign affiliates of German and French nationality
banks actively engaged in business in the United Kingdom, the United States, and other regions.
Similar to local banks located in the United Kingdom, foreign affiliates of German and French
nationality banks operating in the United Kingdom had substantial exposure to nonbank financing,
mainly in the United States, by raising US dollar-denominated funds from the interbank market.
Compared with banks in the United States and Europe, the amounts of external assets and liabilities
of East Asia remained much smaller. This could imply that East Asian cross-border banking
businesses are still in a premature stage. Banks in Japan had external assets of sizes comparable to
banks in Europe and the United States, but their external liabilities were much smaller, even smaller
than banks in Singapore. This meant that banks in Japan did not play an active role in the
intermediation of foreign money. Moreover, their external assets and liabilities accounted for only
53% and 16% of Japan’s GDP, respectively. These relatively small sizes may be attributed to the fact
that Japanese nationality banks were cautious after experiencing serious domestic banking sector
problems in the 1990s. These had been caused by the collapse of real estate and stock price bubbles
in 1991. Banks in Japan began to increase their cross-border activities from 2002, particularly in the
United States, followed by the United Kingdom, France, and Germany. However, the pace of their
activities did not match that of banks in the United Kingdom and the United States, as seen in the
case of external assets (Figure 4).
15Figure 4. External Assets of Banks in Japan, UK and US (Billion of US dollars)
Source: Based on BIS data.
For banks in Japan, external assets vis-à-vis banks abroad (including foreign affiliates) accounted for
only 37% of total external assets (Table VII). Nearly all were in the form of loans and deposits. The
remaining 63% of external assets comprised claims against nonbanks abroad. The greater exposure
to nonbanks abroad reflects the increased preference of banks in Japan toward foreign debt securities
(accounting for 77% of external assets vis-à-vis nonbanks abroad). In particular, Japanese nationality
banks had the largest exposure to US treasury securities and agency-related bonds among banks in
the world, about $200 billion in 2007 (BIS, 2008a). Banks both in Japan and the United Kingdom
invested substantially in debt securities. However, their risk attitudes were different: banks in the
United Kingdom had large exposures to structured credit products and corporate bonds.. This
indicates that banks in the United Kingdom would suffer more than those in Japan in the event of a
US-led financial crisis. This pattern of cross-border banking activities is illustrated in Figure 5.
Figure 5. Cross-Border Banking Activities in Japan
Source: Prepared by the Author.
In Japan, the size of consolidated foreign claims of Japanese nationality banks was only $934 billion
as at December 2007. This amount was smaller than those of banks with US, UK, German, and
French nationalities. This indicates that Japanese nationality banks were not active players in
16cross-border activities (after excluding cross-border claims between affiliates of the same Japanese
nationality bank), as well as financing activities vis-à-vis local residents.
Banks in Hong Kong had small external assets ($798 billion) and external liabilities ($477 billion).
However, these were large in terms of GDP, being about 4 times and 2.3 times, respectively, the
Hong Kong GDP. Singapore had a pattern similar to that of Hong Kong: its external assets and
liabilities as a share of GDP were 4.7 times and 4.8 times, respectively. These data suggest that
Singapore particularly, like the United Kingdom, participated in intermediating global money more
actively than did banks in Japan. Their activities stagnated somewhat during the economic crisis of
1997-98, but began to expand again from the early 2000s (Figure 6). Meanwhile, the external assets
and liabilities of banks in Korea and Malaysia remained relatively small, both in absolute terms and
as a share of GDP (less than 21% in Korea and less than 24% in Malaysia).
As for banks in Hong Kong, about 80% of their external assets comprised loans and deposits
vis-à-vis banks abroad (Table VII). Nearly all their external liabilities were external loans and
deposits. Of this amount, about 66% were allocated to banks abroad and the rest to nonbanks abroad.
In the case of banks in Singapore, external loans and deposits accounted for more than 90% of
external assets (about 75% allocated to banks abroad and the rest to nonbanks abroad). Also, about
90% of the external liabilities were external loans and deposits (67% allocated to banks abroad and
the rest to nonbanks abroad). Banks in Hong Kong and Singapore could obtain substantial deposits
from regional investors and used these proceeds to hold large claims to banks operating in the United
Kingdom, United States, and other places. They were not really engaged in investment in structured
credit assets in the United States, and their cross-border transactions were more traditional, based on
the loan and deposit activities, similar to banks in the United States.
Figure 6. External Assets of Banks in Hong Kong and Singapore (Billion of US dollars)
Source: Based on BIS data.
17The amounts of consolidated foreign claims of Hong Kong nationality banks and Singaporean
nationality banks mounted to $375 billion and $261 billion as at December 2007. These amounts
were even smaller than Japanese nationality banks. This seems understandable given that affiliates of
foreign nationality banks dominate their domestic banking sectors, so that the sizes of their
nationality banks remain limited (thereby restricting their overseas activities through affiliates).
Indeed, foreign banks dominated cross-border claims from Hong Kong and Singapore, accounting
for more than 80% of total claims (BIS, 2006).
Prior to the East Asian crisis, Hong Kong and Singapore functioned as intermediaries to circulate
foreign money from Japan, the United States, and Europe (through affiliates operating in Hong Kong
and Singapore) to emerging East Asian countries (such as Korea, Thailand, Indonesia, China), in
addition to direct financing by Japanese, US, and European headquarter banks to emerging East Asia.
After experiencing a decline in the activities during the East Asian crisis, these two locations
emerged again as regional financial centres. However, their role in intermediation was transformed
from being a provider of net claims against Emerging East Asia (from Japan, the United States and
Europe) to being a provider of net claims against the United States, United Kingdom and other
European countries (from emerging East Asia). The shift of their current account balances from
deficit to surplus for a number of East Asian countries after the crisis of 1997-98 promoted investors
and banks in East Asia to place deposits and extend loans to banks in Hong Kong and Singapore.
These proceeds were in turn extended to financing for banks in the United States, United Kingdom,
and other European countries (Figure 7).
Figure 7. Cross-Border Banking Activities in East Asia
Source: Prepared by the Author.
18With respect to the type of currency used, the US dollar and euro were the most frequently-used
currencies for cross-border banking activities. The US dollar and euro accounted for 38% and 39%,
respectively, of external assets as of December 2007. The US dollar and euro accounted for 42% and
33%, respectively, of external assets. However, when only the currencies used in transactions as
foreign currencies were considered, it is clear that the US dollar was the most dominant foreign
currency in cross-border banking activities. The US dollar accounted for 78% of external assets and
74 % of external liabilities. This indicated that substantial cross-border transactions were conducted
in the euro zone; as actually occurred among banks in Belgium, France, Germany, Italy, and
Netherlands.
Both borrowing and lending conducted by banks operating in the United Kingdom were dominated
by US dollars. Even though the euro was the next most important currency, its use was relatively
limited (BIS, 2008a). In particular, banks in the United Kingdom (mainly UK banks and other
European bank affiliates) obtained largely US dollar-denominated funds from the global interbank
market. These US dollar-denominated funds were then invested mainly in financing nonbank
borrowers and banks in the United States, as pointed out earlier. Thus, their dependence on US dollar
funding was large. If a credit squeeze occurred in the US dollar-denominated interbank market (such
as LIBOR), it was obvious that this would trigger serious US dollar shortages among European
banks.
2-4. Summary of Cross-Border Capital Flows Before the Subprime Mortgage Crisis
Based on the afore-mentioned observations, Section II can be summarized as follows: First, the scale
of US investors’ investment in foreign stocks was large and was dominant around the world. The
amount of their investment in foreign stocks was even greater than the amount of foreign investors’
investment in US stocks. Meanwhile, the United States obtained external financing mainly through
issuing debt securities. US government, agency, non-financial firms, and ABS issuers were able to
issue a large amounts of bonds internationally. Thus, it may be concluded that investors in the United
States were risk-takers in the sense that they preferred investment in foreign stocks (while raising
funds internationally through issuing debt securities). Stocks are generally considered riskier than
bonds as they could potentially give rise to substantial capital gains or loses without any assurances
on the repayment of their principals. The strong preference towards stocks investments by US
investors is confirmed in Table VIII. Table VIII shows that foreign stocks were the largest
investment items in the United States, accounting for 29% of total foreign assets. This ratio was
much smaller in East Asia—11% in Japan, only 1% in China, 19% in Hong Kong, 18% in Korea and
14% in Singapore.
19Table VIII. Composition of Foreign Assets in the United States and East Asia (2007)
Source: Based on IMF data.
Second, investors in Europe could be regarded as risk-takers, since they actively invested in riskier
stocks, corporate bonds, ABSs, MBSs, and CDOs in the United States. By contrast, investors in East
Asia could be regarded as risk-averse, as foreign reserves were one of their largest foreign assets
(invested largely in US treasury securities and agency-related bonds). Moreover, Japanese private
sector investors preferred investing in foreign bonds to foreign stocks (Table VIII). Thus, the United
States and Europe together contributed to the rapid growth in the structured finance industry in the
2000s. While this investment generated substantial returns and profits to US and European investors,
the risks (such as credit, counterparty, liquidity risks) borne by them were substantial and
underestimated.
The features pointed out above are summarized in Figure 8.
Figure 8. Capital Flows before the Subprime Mortgage Crisis
Source: Prepared by the Author.
20Third, the debt securities issued by debtors in the United States were mostly denominated in US
dollars. Thus, US creditors faced only a limited degree of currency mismatch. Meanwhile, US
investors also faced little currency mismatch. Although US investors’ investment in foreign debt
securities was smaller than that in foreign stocks, these bonds were largely denominated in US dollar.
Most foreign bonds held by US investors were issued in the United Kingdom, the Cayman Islands,
and Canada. The fact that both US creditors and investors bore scant currency mismatches indicates
that European counterparts took the foreign exchange risks. Moreover, it indicates that the US dollar
was the preferred hard currency in cross-border debt securities transactions.
Fourth, cross-border banking activities were undertaken largely by US and European nationality
banks. The United Kingdom offered the most important intermediary place in terms of circulating
global banking money. These funds were managed by local banks and European nationality banks’
affiliates operating in the United Kingdom. These were then allocated largely to nonbank borrowers
in the United States, as already shown in Figure 2. Compared with the United Kingdom, the United
States was a less important place for cross-border banking activities. Instead, US nationality banks
actively engaged in international activities through establishing subsidiaries and branches residing in
the United Kingdom, the European continent, and other regions (such as East Asia). US banks’
foreign affiliates were less exposed to financing nonbank borrowers in the United States, as
compared with UK and other European banks.
Fifth, Japanese banks were the most active players in cross-boarder banking activities among the
East Asian banks, but their activities were largely concentrated on the external asset side. In addition
to deposits and loans, they also invested in a large mount of US treasury securities and
agency-related bonds. Given that the amount of external assets substantially exceeded external
liabilities, it appears that Japan did not offer a place to intermediate global money. It can also be said
that the role of Japanese nationality banks in the intermediation of global money was limited.
Meanwhile, Singapore and Hong Kong have become important places for cross-border banking
activities in East Asia (like the United Kingdom) by circulating regional money to other regions in
the world. Most of active players there were affiliates of US and European nationality banks.
Sixth, Hong Kong’s role as an intermediary for FDI has become increasingly important and more
international. This is evidenced by the large share of FDI in Hong Kong’s foreign assets (38%) in
2007, as shown in Table VIII. IMF (2008a) points out that bilateral FDI flows (both asset and
liability sides) involving Hong Kong were second to (mainland) China, amounting to 20% of
intra-Asian FDI flows (compared with 36% in China). The largest FDI flows were from Hong Kong
to China and from China to Hong Kong; namely, Hong Kong’s intermediary role for FDI flows was
21mostly linked to China. While FDI flows related to China dominated, Hong Kong’s FDI flows with
other East Asian countries were growing.
III. IMPACT OF THE SUBPRIME MORTGAGE CRISIS
3-1. Impact of the Crisis on Cross-border Capital Movements in the United States and Europe
The subprime mortgage crisis erupted in the United States and then had a contagious effect on
Europe. Many banks in the United States and Europe saw an immediate deterioration of their assets,
leading to the impairment of their capital. For example, German IKB Deutsche Industriebank faced
large losses from exposure to US subprime mortgage-related assets in July 2007. This resulted in it
being rescued by a fund formed by its major shareholder, the KfW Group (a state-owned
development bank) and other public and private banks. In August 2007, the French banking group
BNP Paribas suspended withdrawals from affiliated funds that were exposed to US subprime
mortgage-related assets; because of the difficulty valuing these assets in an environment of declining
prices. In September 2007, the British bank Northern Rock, which had raised short-term funds from
the wholesale market to finance longer-term residential mortgages, encountered funding difficulties
and deposit runs after it became known to the public that the Bank of England was providing
liquidity to the bank (it was nationalized in February 2008). European banks have since announced
large losses from subprime mortgage –related investment.
According to the Asian Development Bank (2008), the total amount of world-wide write-downs of
financial institutions amounted to $965 billion as of December 3, 2008. Of this amount, the United
States had the largest write-downs of $664 billion. Europe was next with $271 billion as a result of
its active investment in US capital markets and lively cross-border banking relationships, as
described in Section II. In particular, bank losses were large for UK and Swiss banks. East Asia
wrote down only $30 billion, thanks to its limited exposure to investment in structured credit assets
in the United States. The total amount of capital raised by financial institutions was $871 billion
($525 billion in the United States, $299 billion in Europe, and $46 billion in East Asia).
Among US banks, Citigroup and Merrill Lynch incurred the largest write-downs (Table IX). As of
October 2008, Citigroup, which had been the world’s largest bank in terms of assets before the
financial crisis, made large losses from investment in mortgage-related CDOs. As a result, Citigroup
had to accept capital injections of a total of $45 billion (one in November 2007 and another in
January 2009) from the US government. This was conducted under the $700 billion TARP (Troubled
Asset Relief Program), originally aimed at purchasing illiquid mortgage-related assets from financial
institutions; but its aim was partly shifted to bank recapitalization (as it became clear that purchases
of such assets were difficult to conduct). Merrill Lunch incurred major losses from subprime
22mortgage-related assets. Merrill Lynch’s rapidly declining performance resulted in the purchase of
the firm by Bank of America in September 2008 with effect in January 2009. UBS, the largest Swiss
bank, had a large exposure to US subprime mortgage-related assets and faced the largest
write-downs among European banks.
Table IX. Write-Downs by Major Financial Institutions
(As at Oct. 2008, Billions of US Dollars)
Source: Ghon Rhee (2008).
The financial sector problems had an immediate impact on US cross-border banking activities.
Figure 9 indicates the asset-side flows for US financial accounts. Prior to the subprime mortgage
crisis, the United States recorded about minus $300 billion on account of loans and deposits in the
first and second quarters of 2007, suggesting a net increase in foreign assets for the United States.
Banks in the United States, to a large extent, financed non-affiliated as well as affiliated banks
abroad. Since then, these activities have substantially declined; indeed, they shifted to plus $200
billion in the second quarter of 2008, leading to a net decline in foreign assets. This reflected that US
banks and foreign banks’ affiliates in the United States curtailed the cross-border activities, mainly
through cutting US dollar-denominated claims. This result is consistent with BIS stock data, which
indicates a mild decline in external assets of banks in the United States from $2,989 billion at
end-2007 to $2,924 billion in September 2008 (Table X).
While US investors’ investment in foreign debt securities and stocks dropped over the same period,
the scale of the decline remained mild as compared with the accounts for loans and deposits. The
limited impact on foreign debt securities may be explained by a shift of investment by US investors
from European private sector debt securities to safer European treasury securities (such as German
treasury securities).
23Figure 9. US Financial Accounts (External Asset Side, Billions of US Dollars)
Note: A minus indicates a net increase in foreign assets.
Source: Based on IMF data.
Table X. Change in Cross-Border Banking Activities (Billions of US Dollars)
Source: Based on BIS data.
Similarly, the impact of the subprime mortgage crisis on the liability side of US financial accounts
was most pronounced for the loan and deposit accounts. Figure 10 shows that the loan and deposit
accounts each recorded about $300 billion in the first and second quarter of 2007, leading to an
increase in US foreign liabilities. However, there has been a drastic decline since then, reaching
minus $300 billion and so recording a decline in US foreign liabilities in the second quarter of 2008.
This reflected the fact that banks operating in the United Kingdom and other European countries
reduced their long position vis-à-vis the United States. BIS stock data also indicate a decline in
external liabilities of banks in the United States, from $3,735 billion at end-2007 to $3,402 billion in
September 2008.
24Foreign capital inflows for US debt securities declined sharply to about $100 billion in the third
quarter of 2007. However, it has since made a recovery. This reflects a shift of foreign investors’
investment in the United States from corporate bonds and ABSs to treasury securities. Both foreign
monetary authorities and private sector investors expanded their investment in US treasury securities,
suggesting a ―flight to quality‖ (a shift from risky and illiquid assets to risk-free and liquid assets).
China, the United Kingdom, oil-exporting countries, and Switzerland increased their holdings of US
treasury securities between 2007 and 2008. In particular, China’s holdings of treasury securities rose
from $459 billion in November 2007 to $587 billion in September 2008, exceeding those of Japan
($570 billion) and becoming largest holdings. As of November 2008, China’s holdings of US
treasury securities amounted to $682 billion.
Figure 10. US Financial Accounts (External Liability Side, Billions of US Dollars)
Note: A plus indicates a net increase in foreign liabilities.
Source: Based on IMF data.
Similar patterns were observed in the case of UK cross-border capital movements. The biggest
impact of the subprime mortgage crisis can be traced from the loan and deposit accounts (Figures 11
and 12). Since the second quarter of 2007, loan and deposit accounts experienced a substantial
change with respect to the pace of increase in foreign assets (indicating a smaller minus number), as
shown in Figure 11. Nevertheless, the pace of increase in foreign assets rose in the first quarter of
2008, as a result of increased cross-border lending by banks in the United Kingdom (possibly from
foreign bank affiliates to their headquarter banks). However, BIS stock data indicate that a decline in
the external assets of banks in the United Kingdom commenced after this period: a decline from
$6,843 billion at end-2007 to $6,404 billion in September 2008 (Table X).
25The debt securities account shifted from an increase to a decline in foreign assets. This reflected that
investors and banks in the United Kingdom (such as UK banks and foreign affiliates of French and
German banks) reduced their investment in US structured credit assets, corporate bonds, and other
private sector financial assets.
Figure 11. UK Financial Accounts (External Asset Side, Billions of US Dollars)
Note: A minus indicates a net increase in foreign assets.
Source: Based on IMF data.
Regarding the foreign liability side of UK financial accounts, capital inflows declined drastically
(Figure 12). The amount dropped from $939 billion in the first quarter of 2007 to $464 billion in the
second quarter of the same year. This was driven by loans and deposits. This partly was a mirror
image of the behavior of banks in the United States (namely, a cut in their dollar-denominated
cross-border claims against banks operating in the United Kingdom). Moreover, a decline in the
UK’s foreign liabilities was attributed to a cut in interbank financing by banks in oil-exporting
countries, Switzerland, Hong Kong, Singapore, and the euro area. Given that most of these funds
were denominated in US dollars, as pointed out in Section II, this led to a serious shortage of US
dollars among banks in the United Kingdom (and other European countries). BIS data indicate a
larger decline in external liabilities of banks in the United Kingdom after the first quarter of 2008: a
decline from $7,305 billion at end-2007 to $6,982 billion in September 2008. This is coincided with
a sharp rise in the LIBOR (for example, 3-month LIBOR rose from around 3% to 4% in September
2008).
26Figure 12. UK Financial Accounts (External Liability Side, Billions of US Dollars)
Note: A plus indicates a net increase in foreign liabilities.
Source: Based on IMF data.
3-2. The Impact of the Crisis on Japan’s Cross-Border Capital Movements
Generally, East Asia could be said to have managed to escape from direct damage caused by the US
subprime mortgage crisis. This was because East Asian investors and banks had not invested much
in US structured credit products, which included subprime mortgage-related products, compared
with European investors and banks. This is attributable to the risk-averse investment behavior of
East Asia in general, as pointed out in Section II.
In the case of Japan, the book value of structured credit products held by Japanese (nationality)
banks (including major banks, regional banks, and cooperative financial institutions) amounted to
only a little more than $210 billion as of September 2008 (Table XI). Of this book value, unrealized
losses amounted to $14 billion. Cumulative realized losses since April 2007 amounted to only $17
billion. Moreover, their exposure to subprime mortgage-related products was only $8 billion (of
which, cumulative realized losses reached only $8 billion). This explains why the amount of
Japanese banks’ write-downs related to such assets was much smaller than those of US and
European banks.
27You can also read