Interim Report 2018 - Irasia
←
→
Page content transcription
If your browser does not render page correctly, please read the page content below

Interim Report 2018

Contents
 2   Financial Highlights
 4   Management’s Discussion and Analysis
13   Report on Review of Condensed Consolidated
     Financial Statements
14   Condensed Consolidated Financial Statements
31   Corporate Governance and Other Information
40   Corporate Information
Company Profile
Techtronic Industries Company Limited (the “Company”, the “Group” or “TTI”) is a fast growing world leader in
Power Tools, Accessories, Hand Tools, Outdoor Power Equipment, and Floor Care and Appliances for Do-It-Yourselfer (DIY),
professional and industrial users in the home improvement, repair, maintenance, construction and infrastructure industries.
TTI is accelerating the transformation of these industries through environmentally friendly cordless technology.

An unrelenting strategic focus on Powerful Brands, Innovative Products, Operational Excellence and Exceptional People drives
our culture. The TTI brands like MILWAUKEE, RYOBI, and HOOVER, and their products are recognized worldwide for their
deep heritage, superior quality, outstanding performance and compelling innovation. Through an ongoing company-wide
commitment to cordless technology, innovation and strong customer partnerships, TTI consistently delivers exciting new
products that enhance customer satisfaction and productivity. This focus and drive provides TTI with a powerful platform
for sustainable leadership and strong growth.

Founded in 1985 in Hong Kong, TTI has a portfolio of industry leading brands, a worldwide customer reach, and over
23,000 staff. TTI maintains a healthy financial position and is listed on the Stock Exchange of Hong Kong and in 2017
had worldwide annual sales of over US$6 billion.

Power Equipment, Accessories and Hand Tools                                                                  Floor Care and Appliances

 Industrial    Professional      DIY          Outdoor       Layout and      Hand Tools     Hand Tools         Premium     Professional       High    Consumer
Power Tools       Tools       Power Tools     Products    Measuring Tools                                     Cleaning     Cleaning      Performance
Accessories                    Outdoor                                                                       Commercial   Commercial
Hand Tools &                   Products
  Storage

Global Operations
Canada                                                                                                                              Europe
Power Equipment,                                                                                                                    Power Equipment
Floor Care & Appliances                                                                                                             • Sales & Marketing
• Sales & Marketing                                                                                                                 • Research & Development
                                                                                                                                    • Manufacturing

                                                                                                                                    Floor Care & Appliances
                                                                                                                                    • Sales & Marketing

United States
Milwaukee Industrial Tools                                                                                                          Asia TTI Worldwide
• Sales & Marketing                                                                                                                 Headquarters
• Research & Development                                                                                                            • Sales & Marketing
• Manufacturing                                                                                                                     • Research & Development
                                                                                                                                    • Manufacturing
DIY & Professional Tools                                                                                                            • Global Sourcing
• Sales & Marketing
• Research & Development

Outdoor Products
• Sales & Marketing
• Research & Development
• Manufacturing
                                                                     Middle East, Africa,
Floor Care & Appliances              Latin America                   Indian Subcontinent                Australasia
• Sales & Marketing                  Power Equipment,                Power Equipment,                   Power Equipment,
• Research & Development             Floor Care & Appliances         Floor Care & Appliances            Floor Care & Appliances
• Manufacturing                      • Sales & Marketing             • Sales & Marketing                • Sales & Marketing

                                                                                                           Techtronic Industries Interim Report 2018          1
Financial Highlights

• Organic growth delivers record results

• Sales grew 19.1% and net profits expanded 24.6%

• Gross margin improved for the tenth consecutive year in the first half from 36.6% to 37.1%

• MILWAUKEE continued strong growth momentum with an outstanding 29.8% sales increase

• RYOBI ONE+ sustained double-digit sales growth

• Floor Care and Appliances business delivered double digit sales growth of 12.9%

9th
                                                 Revenue
                                                 US$m

consecutive year
                                                 3,500

of record first                                  3,000

half revenue                                     2,500

                                                 2,000
                                                                                                        US$    3,431 million
                                                 1,500                                                                            +19.1%

                                                 1,000
                                                         '10      '11     '12         '13         '14         '15         '16       '17     '18
                                                         1H       1H      1H          1H          1H          1H          1H        1H      1H

10th
                                                 Gross Profit Margin
                                                 %

consecutive year
                                                  40

of record first                                   38

half gross margin                                 36

                                                  34
                                                                                                                                37.1%
                                                  32                                                                              +50 bps

                                                  30
                                                         '09     '10    '11     '12         '13         '14         '15     '16      '17    '18
                                                         1H      1H     1H      1H          1H          1H          1H      1H       1H     1H

2    Techtronic Industries Interim Report 2018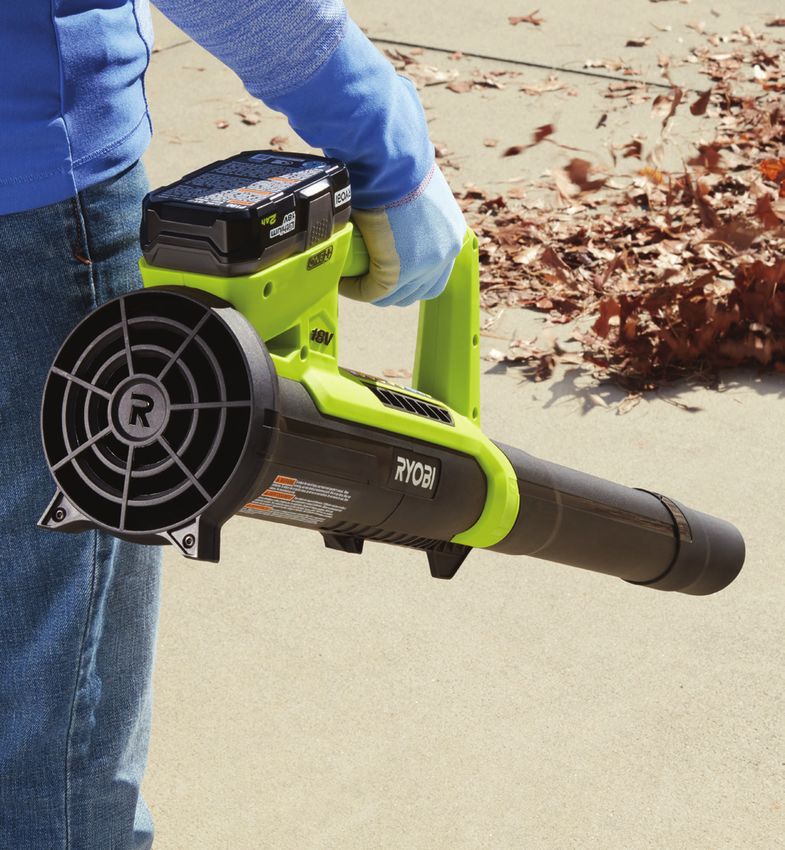
2018                               2017
                                                                                         US$’                               US$’
                                                                                        million                            million                            Changes

Revenue                                                                                  3,431                              2,882                             +19.1%

Gross profit margin                                                                     37.1%                              36.6%                              +50 bps

EBIT                                                                                           281                              233                           +20.7%

Profit attributable to Owners of the Company                                                   255                              204                           +24.6%

EPS (US cents)                                                                           13.89                              11.17                             +24.4%

Interim dividend per share (approx. US cents)                                                  4.89                             3.57                          +36.9%

EBIT                                 Net Profit                            EPS                                              Interim Dividend per Share

US$    281 million                   US$    255 million                    US   13.89 cents                                 US   4.89 cents
+20.7%                               +24.6%                                +24.4%                                           +36.9%

US$m                                 US$m                                  US cents                                         US cents

300                                  250                                   14                                               5
                                                                     255

                                                                                                               13.89

                                                                                                                                                               4.89
                               281

                                                                           12
250
                                     200                                                                                    4
                                                               204

                                                                                                       11.17
                         233

                                                                           10
200
                                                                                                                                                       3.57
                                                         177

                                                                                                9.69
                   201

                                     150                                                                                    3
                                                   159

                                                                            8
                                                                                        8.67
             181

150
       162

                                             136

                                                                                 7.45

                                                                                                                                                2.57

                                                                            6
                                     100                                                                                    2
                                                                                                                                         2.06

100
                                                                            4
                                                                                                                                  1.61

                                      50                                                                                    1
 50
                                                                            2

  0                                    0                                    0                                               0
       '14   '15   '16   '17   '18          '14    '15   '16   '17   '18         '14    '15     '16    '17     '18                '14    '15    '16    '17     '18
       1H    1H    1H    1H    1H           1H     1H    1H    1H    1H          1H     1H      1H     1H      1H                 1H     1H     1H     1H      1H

                   EBIT                             Net Profit                                  EPS                                    Interim dividend 3
                                                                                                               Techtronic Industries Interim Report 2018
                                                                                                                                           per Share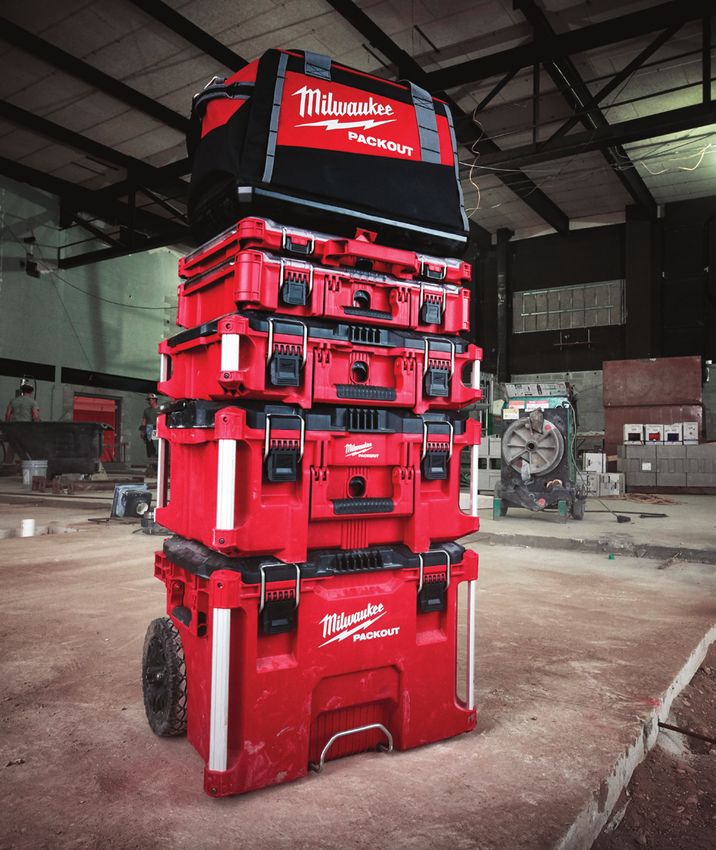
Management’s Discussion and Analysis

Power Equipment, Accessories and Hand Tools

                                       86.3%
                                       Power Equipment,
                                                          Delivered an excellent first half with
                                                          US$3.0 billion in global sales, representing
                                       Accessories and
                                                          a 20.1% increase compared with the same
         Sales by
         Business                      Hand Tools         period in 2017

                                       13.7%
                                       Floor Care and
                                                          EBIT increased 20.7% for the business in the
                                       Appliances         first half of the year

                                                          The MILWAUKEE industrial business continued
                                                          to lead the charge with outstanding 29.8%
                                                          growth in sales

                                                          The Consumer Power Tool and the Outdoor
                                                          Product businesses both grew by double digits

Floor Care and Appliances

                                       13.7%
                                       Floor Care and
                                                          Delivered 12.9% overall sales growth

         Sales by                      Appliances         Driven by 45.0% growth in cordless, expansion
         Business                                         of carpet washing and cleaning solutions, and
                                       86.3%              selling off legacy products
                                       Power Equipment,
                                       Accessories and
                                       Hand Tools         Our cordless products delivered exceptional
                                                          growth across all markets

                                                          EBIT improved for the business in the first half
                                                          of the year

4      Techtronic Industries Interim Report 2018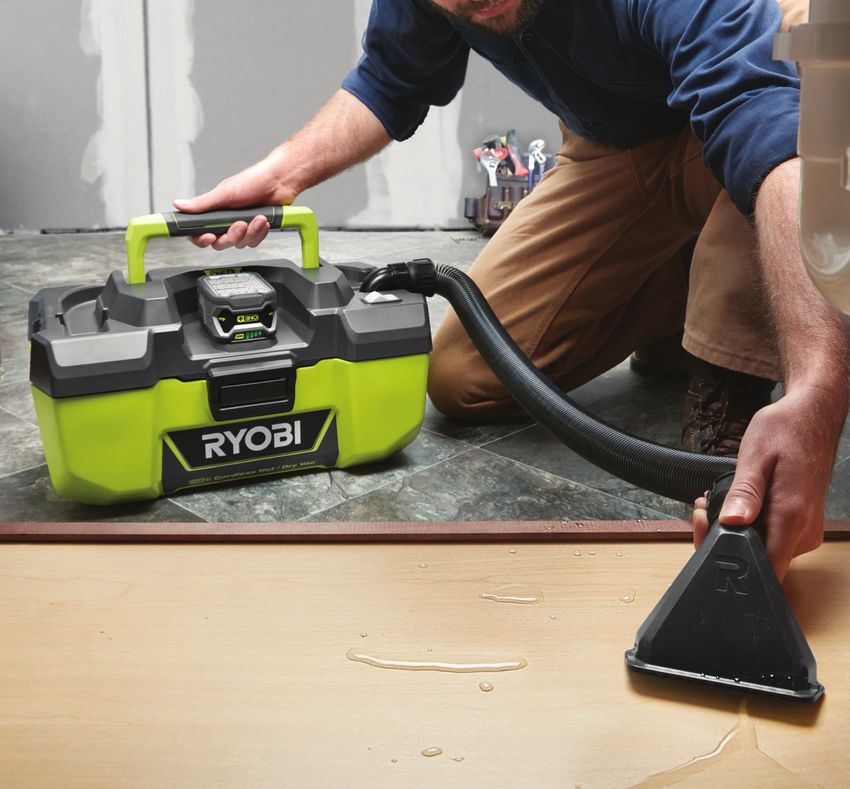
Review of Operations                                                    2018 with sales growth of 20.1%. The MILWAUKEE industrial business
                                                                        continued to lead the charge with outstanding 29.8% growth in sales.
Organic Growth Delivers Record Results                                  The Consumer Power Tool and the Outdoor Product businesses both
TTI’s ability to deliver record revenue and net profit for the ninth    grew by double digits primarily from the expansion of the RYOBI ONE+
consecutive first half is a result of our strategic foundation of       and 40V cordless platforms. The early phase of our strategic direction
relentless innovation, continuous operational improvement,              of the Floor Care and Appliances segment is slowly and encouragingly
exceptional people, and a powerful brand portfolio. As we continue      gaining traction with sales growing 12.9%.
to lead the cordless revolution, our expertise in lithium-ion battery
technology, advanced system electronics and brushless motors is         Gross profit margin improved for the tenth consecutive year on
driving superior products with disruptive innovation. This strategy     positive gains from the ongoing flow of new products and productivity.
has generated new levels of revenue, gross profit, and net income.      Our dedication to operational excellence with continuous
Revenue in the first half was US$3.4 billion, a 19.1% increase over     improvements in lean manufacturing, global purchasing, and supply
the previous period, while net profit margin improved by 30 basis       chain efficiencies has aided in driving profitability through eliminating
points. With six manufacturing facilities in the US, two in both        waste, reducing costs, and improving service to our customers.
Europe and Asia, we are geographically diversified. Additionally,       TTI’s diversified and nimble supply chain network is designed to
we have innovation centers and sales networks across four               quickly adapt to changing market dynamics. To support our future,
continents. Our product development process drives innovative           we continued to invest even further in our Leadership Development
solutions at a speed that exceeds the pace of the market while          Program, end user conversions, product development, product
further increasing market share. TTI’s cordless technology and flow     managers, increased sales coverage, and geographic expansion with
of product innovation continue to accelerate the conversion from        an increase in R&D spend of 20 basis points from 2.7% to 2.9% of
legacy power systems such as pneumatic, corded and gas-powered          sales. These strategic initiatives are yielding unprecedented organic
products as well as opening up new market segments as our               growth while further enhancing gross margin. Through relentless
technological advancements now enable us to design applications         execution, the TTI organization has driven top line revenue growth of
in new product categories that previously did not exist.                19.1% while increasing earnings before interest and taxes by 20.7%
                                                                        to US$281 million and continuing to efficiently manage working
The Power Equipment business is an excellent example of our highly      capital at 17.0% of sales compared to 19.1% last year in the first
focused strategy to be the leader in cordless innovation that changes   half. Net profit attributable to shareholders was US$255 million,
the way people work and live. Sustained above market growth has         a 24.6% increase from the prior year, and a basic earnings per share
been the TTI standard and holds true once again for the first half of   increase of 24.4% to US13.89 cents.

                                                                                                 Techtronic Industries Interim Report 2018     5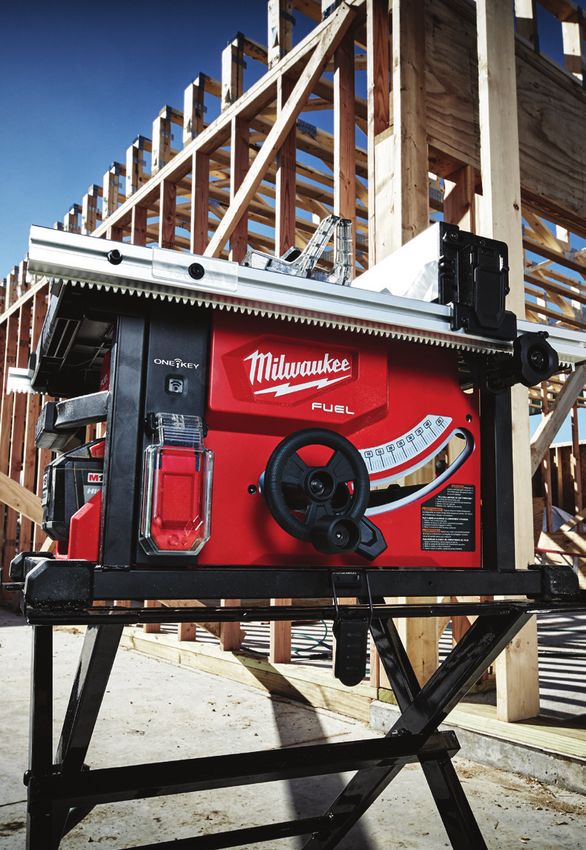
Management’s Discussion and Analysis

Business Review                                                               M18 battery platforms. The expanding global reach of the MILWAUKEE
                                                                              brand is evidenced by double-digit growth in the targeted geographic
Power Equipment, Accessories and Hand Tools                                   markets of North America, Europe, ANZ, and across Asia.
The Power Equipment business, the largest segment accounting for
86.3% of total sales, delivered an excellent first half with US$3.0 billion   Our product development processes are designed to deliver meaningful
in global sales, representing a 20.1% increase compared with the              product development and systematic introduction of disruptive new
same period in 2017. The strong growth was fueled by the flow of              products aimed at electrical, mechanical, plumbing, HVAC,
new product introductions, expanding new product categories like              infrastructure, and remodeling. The M18 system, the fastest-growing
cordless lawn mowers, leveraging strong customer partnerships,                cordless system for the professional end user, will offer over 165
adding new distribution channels, geographic expansion, and focused           compatible tool and lighting solutions on a single battery platform
end-user conversions. EBIT increased 20.7% for the business in the            by year-end. Milwaukee is also the leader in the global sub-compact
first half of the year.                                                       cordless space, with the M12 cordless system offering over 95
                                                                              compatible tools and lighting solutions by year-end. The industry’s
                                                                              most advanced high performance FUEL line of products will reach
Industrial Tools
                                                                              80 tools by year end. The M12 FUEL and M18 FUEL product lines
The multifaceted approach of aggressive product introductions,                continue to disrupt the industry with first-to-market innovations
jobsite solutions teams, relentless operational improvements,                 reinforcing the Milwaukee leadership in the important drilling and
and our Leadership Development Program led to a commanding                    fastening solutions categories. The Milwaukee new product cycle is
29.8% growth in the first half for the Milwaukee industrial business.         robust, and the pipeline is full of new trade specific solutions such
Milwaukee has remained at the forefront of the cordless revolution,           as our expansion into lighting, hydraulic, and drain cleaning tools.
developing solutions for professionals with superior products working
off the M12 and M18 battery platforms, while also targeting disruptive
                                                                              High Output Lighting
innovation for specific trade verticals.
                                                                              Milwaukee has organically developed into an industry leader in
                                                                              the cordless high output lighting category by introducing product
Power Tools
                                                                              innovations and leveraging the installed base of M12 and M18
The Milwaukee Power Tool business began the first half of the year            users. Our strategic approach of redefining the lighting market with
exceeding the market with double digit sales growth with substantial          break-through products that provide unmatched versatility with area
market share gains through new category expansion and continued               and task lighting solutions is capturing strong market share across
entry into new markets. MILWAUKEE, with the vast M12, M18 and                 core end users and channels of distribution. Break-through products
FUEL product ranges, continues to be the fastest growing, most                like the new M18 RADIUS Site Light with Flood Mode is one of the most
innovative, and leading brand of tools for the industrial and professional    complete lighting products on the market delivering 360 degrees of
user. Depending on the application, most of the Milwaukee cordless            area lighting, concentrated flood lighting, and full coverage overhead
tools now outperform and replace the competitive power systems of             lighting. With an impact-resistant polycarbonate lens to protect
pneumatic, corded electric, and gas-powered products, accelerating            against drops, the M18 RADIUS Site Light with Flood Mode provides
the cordless revolution. Our first half performance was driven by             2,200 lumens of TRUEVIEW high definition light.
Milwaukee launching a range of new, best-in-class power tools,
significantly broadening the product offering of tools on the M12 and

6       Techtronic Industries Interim Report 2018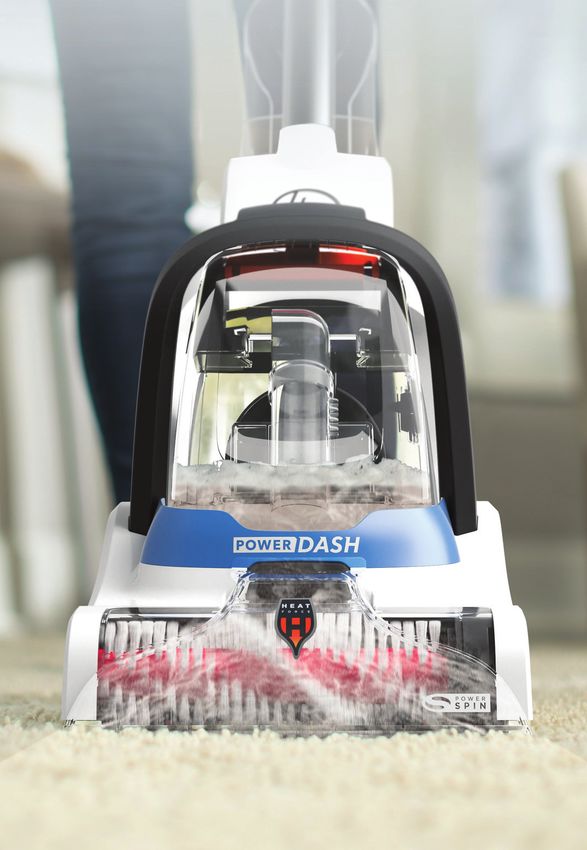
Accessories                                                               market plan of converting distribution and users by delivering a
MILWAUKEE accessories continued to deliver double-digit growth in         consistent flow of innovative layout products for core professional
the first half and reach record sales levels. The results were achieved   trades. ULTRAVIEW LED and DIGITAL levels continue to outpace
through significant end user conversions in cutting, drilling, and dust   expectations as users migrate to these better technology solutions.
collection applications. The DUST TRAP attachment was developed
to provide a unique and economical solution for managing dust on          DIY and Professional Tools
the job site, exceeding OSHA silica dust management requirements
                                                                          Ryobi DIY Power Tools
and positioning Milwaukee at the forefront in this growing segment
of the market. Milwaukee also delivered significant upgrades to our       The Ryobi DIY Power Tool business delivered outstanding
BiMetal technology with the launch of multiple products with Carbide      double-digit growth in the first half and continues to be the dominant
Teeth. The growing range of Milwaukee concrete drilling, coring, and      DIY brand in its served markets of North America, Western Europe,
demolition accessories for SDS rotary hammer drills is driving end        Australia and New Zealand. During the first half, new product
user conversions to the complete Milwaukee line of accessories.           introductions and aggressive marketing programs drove share gains
Milwaukee remains committed to expanding the range of Shockwave           leveraging the overarching reach of the RYOBI ONE+ system with
Impact Rated accessories and will launch new Impact Rated Step            over 120 power tools and outdoor products for use around the home
bits in the back half to address the growth of cordless impact drivers    and jobsite. The RYOBI ONE+ system has not changed in compatibility
globally. We are focused on being a leader in power tool accessories      since its introduction, generating a powerful network effect allowing
through the continuous investment in breakthrough technologies and        existing users to upgrade and expand and new users to join the system
in developing creative solutions to everyday problems faced by our        with confidence. Innovative new products continue to attract new
core users.                                                               users to the system with breakout products like the RYOBI ONE+ 3
                                                                          Gallon Wet/Dry Project Vacuum that doubles as a directional blower,
                                                                          the Drywall Screwgun with QUIETDRIVE, a unique feature which
Hand Tools and Storage
                                                                          automatically starts the motor on contact with drywall, and the
The Milwaukee Hand Tool and Storage business delivered strong             first-to-market Color Range LED Worklight with variable color
growth in the first half with a key focus on our innovative ranges of     temperature to provide the most accurate view of the workspace.
tape measures and PACKOUT modular storage. The STUD tape
measure will revolutionize durability standards in this category with     During the period, the Ryobi Power Tool business also introduced
EXO360 blade technology, protecting the blade from ripping and            a new series of high performance lithium-ion batteries featuring
wearing, and delivering the longest-lasting tape measure blade on         advanced electronics that maximize tool performance with added
the market. This game-changing product has a fully reinforced body        capacity to all 18-Volt RYOBI ONE+ tools. The new battery line can
with an impact-resistant frame able to survive up to an 80-foot drop      handle more demanding applications with superior run time, power,
onto packed soil. The popular PACKOUT storage system continues            and overall performance through HP communication technology
to expand with low-profile organizers, duffle bags, a flat dolly,         which maximizes performance of RYOBI high performance brushless
and a new mounting plate enabling users to secure their current           tools in all applications.
PACKOUT products in service vans, trucks, and shop walls. Sales of
EMPIRE again delivered strong growth by executing on its strategic

                                                                                                  Techtronic Industries Interim Report 2018     7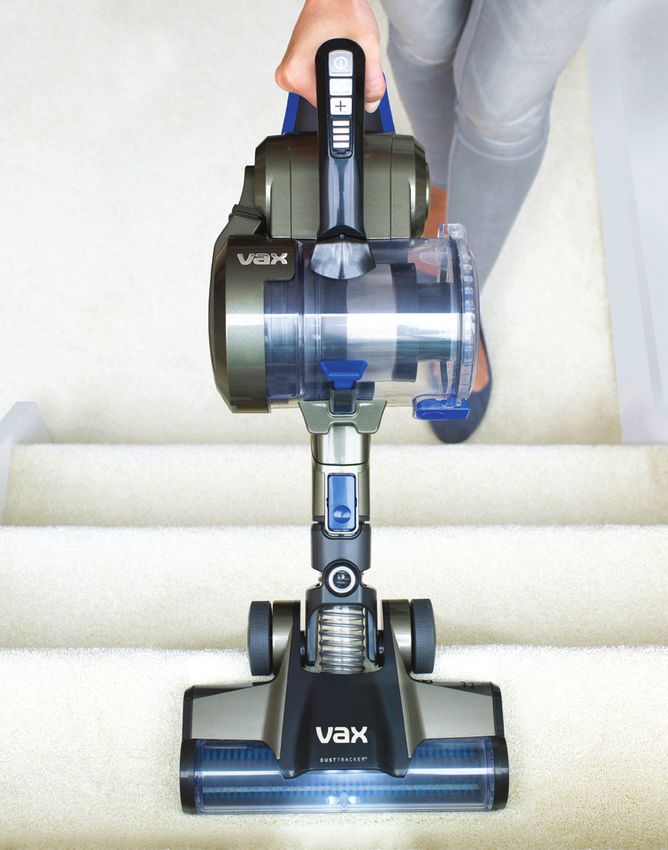
Management’s Discussion and Analysis

Professional Tools                                                        RYOBI outdoor products are driving the revolution from gas powered
Our professional tool business continued its strategy of bringing         to environmentally friendly cordless technology which is quieter and
cordless innovations to demanding users for the workplace through         easier to use. With our advanced technology, the RYOBI cordless
targeted distribution channels. Globally we delivered double digit        products often equal and in many cases even surpass the
growth in the first half on the strength of the North American business   performance of gas powered alternatives.
and new product launches. We expanded our AEG 18V range with
the recent launch of the powerful AEG Brushless Handheld Dust             Floor Care and Appliances
Extractor and new high-performance FORCE Lithium 9.0Ah battery.
                                                                          The Floor Care and Appliance business delivered 12.9% overall
There are now over 50 products on the platform and we have a strong
                                                                          sales growth driven by 45.0% growth in cordless, expansion of
pipeline of cordless innovations to be introduced later in the year.
                                                                          carpet washing and cleaning solutions, and selling off legacy
                                                                          products. Our cordless products delivered exceptional growth across
Outdoor Products                                                          all markets while simultaneously expanding our innovative cordless
The first half produced very positive results for Outdoor Products        product portfolio as we are on course to transforming into a global
with double digit global growth. This performance was the result of       cordless leader. We are pleased to see that the strategic revitalization
key initiatives including new product launch execution, investments       of our floor care businesses across our brand portfolio is delivering
in merchandising, promotion and marketing, and continued battery          sales and operational improvements. Although the operating margin
platform product expansions. Our fast growing RYOBI ONE+                  is not yet where we plan for it to be, we made progress in managing
and RYOBI 40V cordless business continued to outperform the               working capital, selling down legacy corded products, and cutting
competition with an increase in share across all battery platforms.       non-strategic costs out of the system. Our EBIT improved for the
We introduced new outdoor products to the RYOBI ONE+ system,              business in the first half of the year and we are confident that the
continuing to capitalize on the synergies with the extensive user         positive results momentum will continue going forward.
penetration and installed base of RYOBI ONE+ power tools. New in
                                                                          Our North America floor care business had encouraging first half
the first half for RYOBI ONE+ were products ranging from combo kits,
                                                                          growth as it continues to execute its strategy of transitioning from
bare tools, high performance brushless string trimmer, an innovative
                                                                          older corded platforms into strategic categories of cordless stick vacs
blower, and a new lawn mower. The RYOBI 40V battery program had
                                                                          and innovative carpet washing and cleaning solutions with several of
continued success led by the innovative 20” brushless lawn mower,
                                                                          our cordless stick vacs being top sellers at our key retail customers.
a self-propelled 20” brushless lawn mower, and increased add-on
                                                                          We continue to focus on inventory reduction and product rationalization,
battery sales. Sales more than doubled on the RYOBI 48V riding
                                                                          delivering significant progress which resulted in distribution facility
mower that will mow over 2 hours and 2 acres or nearly 8,100 square
                                                                          closures and streamlining the supply chain. As we continue driving
meters on a single charge.
                                                                          growth and selling off legacy products, we will start to see the benefit
                                                                          of operating leverage which will translate into improved earnings in
                                                                          the years to come.

8       Techtronic Industries Interim Report 2018
The Floor Care business in Europe generated solid growth with witnessing a transformational shift in our DIY segment, particularly
cordless being the driving force and the UK being the best in the lawn and garden category with the revolution of ultra-high
performing market. The VAX Blade cordless stick vac represents powered, extra-long runtime lithium battery powered products, while
a large part of this growth as distribution and sales velocity continues the same holds true for our Floor Care segment.
to build across the region. Alongside cordless, the carpet washing
category was expanding nicely after a product line refresh resulting in Looking into the second half and beyond, it is clear that the
a smaller, more focused range. We are pleased with the successful momentum is increasing at an exciting rate throughout TTI.
introduction of the new VAX Platinum Powermax Pro, our best ever We expect our cordless business to continue being the key driver
carpet washer and Platinum carpet washing solution. and to grow at unprecedented levels because of our leading edge
technology. Our long term vision at TTI is to build an unassailable
competitive advantage through cordless product leadership,
Outlook for Growth outstanding organizational development, and superior operational
We are extremely excited about our future and growth trajectory excellence. We are highly confident our business will continue to
in our leadership cordless platform, category, and geographic outperform in the coming years.
expansion. Our momentum continues to accelerate as we
aggressively invest in our core businesses. TTI’s spectacular growth
in hand tools and tool storage are both excellent examples of our
Recent Developments
ability to grow new categories beyond our core and we are excited No important events affecting the Group have occurred since
about the long term prospects of our Floor Care business. At TTI, June 30, 2018 that are material or otherwise require disclosure
we focus on the things we can control such as product development, or commentary.
marketing, and investing in our people. We view the global economic
outlook to be very strong in our target verticals.
In the second half of the year, Milwaukee will be launching
the most powerful line of M18 FUEL products ever introduced.
These new products are a testament to our dedication of delivering
productivity-enhancing solutions that provide the right blend of
power, run-time and performance. True to all M18 FUEL solutions,
each of these tools combine three exclusive innovations – the
POWERSTATE brushless motor, REDLITHIUM battery pack,
and REDLINK PLUS intelligence – all specifically re-designed to
increase power and performance. With the further improvement in
our battery, electronics, motor, and charging technologies, we are
Techtronic Industries Interim Report 2018 9Management’s Discussion and Analysis
Financial Review
Revenue Gross Profit Margin EBITDA
US$ 3,431 million 37.1% US$ 398 million
+19.1% +50 bps +19.5%
US$m % US$m
3,500
3,500 37
37 400
400
37.1
37.1
398
3,431
3,431
36.6
36.6
36
36 350
350
36.1
36.1
3,000
3,000
333
300
300
35.6
35.6
35
35
2,882
2,882
293
35.0
35.0
250
250
2,686
2,686
2,500
2,500
262
34
34
2,474
2,474
229
200
200
2,250
2,250
33
33
2,000
2,000
150
150
32
32
100
100
1,500
1,500
31
31 50
50
1,000
1,000 30
30 00
'14
'14 '15
'15 '16
'16 '17 '18
'17 '18 '14
'14 '15
'15 '16
'16 '17
'17 '18
'18 '14
'14 '15
'15 '16
'16 '17
'17 '18
'18
1H1H 1H1H 1H1H 1H1H 1H1H 1H
1H 1H
1H 1H
1H 1H
1H 1H
1H 1H
1H 1H
1H 1H
1H 1H
1H 1H
1H
Revenue
Revenue Gross
Gross Profit
Profit Margin
Margin EBITDA
Capex R&D Spent Effective Tax Rate
US$ 86 million 2.9% of revenue 7.5%
(2017 1H: US$72 million) (2017 1H: 2.7% of revenue) (2017 1H: 8.5%)
Cash and Cash Equivalents Net Gearing Working Capital as a Percentage of Sales
US$ 863 million Improved to 1.8% 17.0%
(2017 1H: US$816 million) (2017 1H: 8.8%) (2017 1H: 19.1%)
10 Techtronic Industries Interim Report 2018Financial Review Liquidity and Financial Resources
Financial Results Shareholders’ Funds
Reported revenue for the period grew by 19.1% as compared to Total shareholders’ funds amounted to US$2.9 billion, an increase
the same period last year, amounting to US$3,431 million. Profit of 6.1% as compared to December 31, 2017. Book value per share
attributable to Owners of the Company amounted to US$255 million was US$1.59 as compared to US$1.49 at December 31, 2017,
as compared to US$204 million reported last year, an increase an increase of 6.7%.
of 24.6%. Basic earnings per share was at US13.89 cents
(2017: US11.17 cents). Financial Position
The Group continued to maintain a strong financial position. As at
EBITDA amounted to US$398 million, an increase of 19.5% as June 30, 2018, the Group’s cash and cash equivalents amounted
compared to the US$333 million reported in the same period last year. to US$863 million (US$864 million at December 31, 2017) after the
payment of US$93.8 million dividend during the period (US$70.8 million
EBIT amounted to US$281 million, an increase of 20.7% as compared
in first half 2017), of which 45.6%, 30.1%, 12.6%, and 11.7% were
to the US$233 million reported in the same period last year.
denominated in US$, RMB, EUR and other currencies respectively.
Result Analysis The Group’s net gearing, expressed as a percentage of total net
Gross Margin borrowings (excluding bank advance from factored trade receivables
Gross margin improved to 37.1% as compared to 36.6% in the same which are without recourse in nature) to equity attributable to
period last year. The margin improvement was the result of new Owners of the Company, improved to 1.8% as compared to 8.8%
product introduction, product mix, category expansion, improvements as at June 30, 2017. The gearing improvement is the result of
in operational efficiency and supply chain productivity. very disciplined and focused management over working capital.
The Group remains confident that gearing will further improve by
end of the year.
Operating Expenses
Total operating expenses for the period amounted to US$996 million
Bank Borrowings
as compared to US$826 million reported for the same period last
year, representing 29.0% of revenue (2017: 28.7%). During the Long term borrowing accounted for 60.5% of total debts (66.5% at
period under review, R&D spent increased by 20 bps from 2.7% December 31, 2017).
revenue to 2.9% to maintain the high velocity growth momentum.
The Group’s major borrowings continued to be in US$. Borrowings
Excluding this increase, SG&A as a percentage to Sales was at
are predominantly LIBOR based. There is a natural hedge mechanism
28.8%, comparable to that of last year.
in place as the Group’s major revenues are in US Dollars and currency
Net interest expenses for the period amounted to US$5 million as exposure therefore is low. Currency, interest rate exposure, and cash
compared to US$9 million reported for the same period last year, management functions are all being closely monitored and managed
representing 0.2% of revenue (2017: 0.3%). The decrease in by the Group’s treasury team.
net interest expenses is the result of our efficient management
Amongst the bank borrowings, fixed rate debts account for 11.5%
of financial resources. Interest cover, expressed as a multiple of
of the total debt, the balance being floating rate debts.
EBITDA to total interest was at 22.3 times (2017: 26.6 times).
Effective tax rate for the period was at 7.5% (2017: 8.5%).
The Group will continue to leverage its global operations to further
improve overall tax efficiencies.
Techtronic Industries Interim Report 2018 11Management’s Discussion and Analysis
Working Capital Human Resources
Total inventory was at US$1,578 million as compared to The Group employed a total of 23,226 employees (21,857 employees
US$1,415 million as at June 30, 2017. Days inventory maintained as at June 30, 2017) in Hong Kong and overseas. Total staff cost for
at 88 days. The Group will continue to focus on managing the the period under review amounted to US$514 million as compared to
inventory level and improve inventory turns. US$465 million in the same period last year.
Trade receivables turnover days were at 67 days as compared The Group regards human capital as vital for the Group’s continuous
to 69 days as at June 30, 2017. Excluding the gross up of the growth and profitability and remains committed to improve the quality,
receivables factored which is without recourse in nature, receivables competence and skills of all employees. It provides job related training
turnover days was at 63 days as compared to 65 days as at and leadership development programs throughout the organization.
June 30, 2017. The Group is comfortable with the quality of the The Group continues to offer competitive remuneration packages,
receivables and will continue to exercise due care in managing discretionary share options, share awards and bonuses to eligible staff,
credit exposure. based on the performance of the Group and the individual employee.
Trade payables days increased to 93 days as compared to 87 days
as at June 30, 2017 but comparable to the 95 days full year 2017. Interim Dividend
The Directors have resolved to declare an interim dividend of
Working capital as a percentage of sales was at 17.0% as compared HK38.00 cents (approximately US4.89 cents) (2017: HK27.75 cents
to 19.1% for the same period last year. (approximately US3.57 cents)) per share for the six-month period ended
June 30, 2018. The interim dividend will be paid to shareholders listed
Capital Expenditures on the register of members of the Company on September 7, 2018.
Total capital expenditures for the period amounted to US$86 million It is expected that the interim dividend will be paid on or about
(2017: US$72 million). September 21, 2018.
Capital Commitments and Contingent Liabilities Closure of Register of Members
As at June 30, 2018, total capital commitments for the acquisition The register of members of the Company will be closed from
of property, plant and equipment contracted for but not provided September 6, 2018 to September 7, 2018, both days inclusive,
amounted to US$30 million (2017: US$28 million), and there were during which period no transfer of shares will be effected. In order
no material contingent liabilities or off balance sheet obligations. to qualify for the interim dividend, all transfers accompanied by the
relevant share certificates must be lodged with the Company’s share
Charges registrars, Tricor Secretaries Limited, at Level 22, Hopewell Centre,
183 Queen’s Road East, Hong Kong for registration not later than
None of the Group’s assets are charged or subject to encumbrance.
4:00 p.m. on September 5, 2018.
12 Techtronic Industries Interim Report 2018Report on Review of Condensed Consolidated Financial Statements
To the Board of Directors of
Techtronic Industries Company Limited
(incorporated in Hong Kong with limited liability)
Introduction
We have reviewed the condensed consolidated financial statements of Techtronic Industries Company Limited (the “Company”) and its
subsidiaries (collectively referred to as the “Group”) set out on pages 14 to 30, which comprise the consolidated statement of financial position
as of June 30, 2018 and the related consolidated statement of profit or loss and other comprehensive income, statement of changes in equity
and statement of cash flows for the six-month period then ended, and certain explanatory notes. The Rules Governing the Listing of Securities
on The Stock Exchange of Hong Kong Limited require the preparation of a report on interim financial information to be in compliance with the
relevant provisions thereof and Hong Kong Accounting Standard 34 “Interim Financial Reporting”(“HKAS 34”) issued by the Hong Kong
Institute of Certified Public Accountants. The directors of the Company are responsible for the preparation and presentation of these condensed
consolidated financial statements in accordance with HKAS 34. Our responsibility is to express a conclusion on these condensed consolidated
financial statements based on our review, and to report our conclusion solely to you, as a body, in accordance with our agreed terms of
engagement, and for no other purpose. We do not assume responsibility towards or accept liability to any other person for the contents of this
report.
Scope of Review
We conducted our review in accordance with Hong Kong Standard on Review Engagements 2410 “Review of Interim Financial Information
Performed by the Independent Auditor of the Entity” issued by the Hong Kong Institute of Certified Public Accountants. A review of these
condensed consolidated financial statements consists of making inquiries, primarily of persons responsible for financial and accounting matters,
and applying analytical and other review procedures. A review is substantially less in scope than an audit conducted in accordance with Hong
Kong Standards on Auditing and consequently does not enable us to obtain assurance that we would become aware of all significant matters
that might be identified in an audit. Accordingly, we do not express an audit opinion.
Conclusion
Based on our review, nothing has come to our attention that causes us to believe that the condensed consolidated financial statements are not
prepared, in all material respects, in accordance with HKAS 34.
DELOITTE TOUCHE TOHMATSU
Certified Public Accountants
Hong Kong
August 15, 2018
Techtronic Industries Interim Report 2018 13Condensed Consolidated Financial Statements
Consolidated Statement of Profit or Loss and Other Comprehensive Income (Unaudited)
For the six-month period ended June 30, 2018
2018 2017
Notes US$’000 US$’000
(Unaudited) (Unaudited)
Revenue 4 3,430,828 2,881,620
Cost of sales (2,157,198) (1,825,797)
Gross profit 1,273,630 1,055,823
Other income 3,252 2,271
Interest income 13,156 3,561
Selling, distribution and advertising expenses (522,233) (430,307)
Administrative expenses (374,791) (318,131)
Research and development costs (99,111) (77,181)
Finance costs (18,470) (12,653)
Profit before taxation 275,433 223,383
Taxation charge 5 (20,657) (18,988)
Profit for the period 6 254,776 204,395
Other comprehensive income (loss):
Item that will not be reclassified subsequently to profit or loss, net of related income tax:
Remeasurement of defined benefit obligations 135 (193)
Items that may be reclassified subsequently to profit or loss:
Fair value gain (loss) on foreign currency forward contracts in hedge accounting 40,758 (30,082)
Exchange differences on translation of foreign operations (22,871) 31,997
Other comprehensive income for the period 18,022 1,722
Total comprehensive income for the period 272,798 206,117
Profit (loss) for the period attributable to:
Owners of the Company 254,737 204,433
Non-controlling interests 39 (38)
254,776 204,395
Total comprehensive income (loss) attributable to:
Owners of the Company 272,759 206,155
Non-controlling interests 39 (38)
272,798 206,117
Earnings per share (US cents) 8
Basic 13.89 11.17
Diluted 13.84 11.14
14 Techtronic Industries Interim Report 2018Condensed Consolidated Financial Statements
Consolidated Statement of Financial Position (Unaudited)
As at June 30, 2018
June 30 December 31
2018 2017
Notes US$’000 US$’000
(Unaudited) (Audited)
ASSETS
Non-current assets
Property, plant and equipment 9 & 17 699,297 688,868
Lease prepayments 30,145 30,836
Goodwill 554,882 555,350
Intangible assets 9 587,793 580,424
Interests in associates 2,906 2,780
Available-for-sale investments — 3,697
Financial assets at fair value through profit or loss 5,265 —
Derivative financial instruments 9,558 9,558
Deferred tax assets 85,416 92,939
1,975,262 1,964,452
Current assets
Inventories 1,577,696 1,467,420
Trade and other receivables 10 1,235,241 1,136,876
Deposits and prepayments 126,495 112,627
Bills receivable 10 15,049 8,008
Tax recoverable 15,359 6,698
Trade receivables from an associate 11 1,380 2,790
Derivative financial instruments 18,500 3,798
Held-for-trading investments — 32,293
Financial assets at fair value through profit or loss 45,488 —
Bank balances, deposits and cash 863,127 863,515
3,898,335 3,634,025
Current liabilities
Trade and other payables 12 1,665,304 1,574,402
Bills payable 12 45,025 54,952
Warranty provision 99,204 97,268
Tax payable 22,663 23,912
Derivative financial instruments 7,632 43,830
Obligations under finance leases – due within one year 2,921 2,895
Discounted bills with recourse 222,302 87,837
Unsecured borrowings – due within one year 13 201,170 260,342
2,266,221 2,145,438
Net current assets 1,632,114 1,488,587
Total assets less current liabilities 3,607,376 3,453,039
Techtronic Industries Interim Report 2018 15Condensed Consolidated Financial Statements
Consolidated Statement of Financial Position (Unaudited)
As at June 30, 2018
June 30 December 31
2018 2017
Notes US$’000 US$’000
(Unaudited) (Audited)
CAPITAL AND RESERVES
Share capital 14 654,604 653,918
Reserves 2,252,589 2,087,307
Equity attributable to Owners of the Company 2,907,193 2,741,225
Non-controlling interests (468) (507)
Total equity 2,906,725 2,740,718
NON-CURRENT LIABILITIES
Obligations under finance leases – due after one year 7,352 8,722
Unsecured borrowings – due after one year 13 553,267 564,678
Retirement benefit obligations 125,671 124,517
Deferred tax liabilities 14,361 14,404
700,651 712,321
Total equity and non-current liabilities 3,607,376 3,453,039
16 Techtronic Industries Interim Report 2018Condensed Consolidated Financial Statements
Consolidated Statement of Changes in Equity (Unaudited)
For the six-month period ended June 30, 2018
Attributable
to non-
controlling
Attributable to Owners of the Company interests
Shares Employee Defined benefit Share
held for share-based obligations of net
share award Translation compensation remeasurement Hedging Retained assets of
Share capital scheme reserve reserve reserve reserve profits Total subsidiaries Total
US$’000 US$’000 US$’000 US$’000 US$’000 US$’000 US$’000 US$’000 US$’000 US$’000
At January 1, 2017 (audited) 649,214 (10,476) (156,729) 7,010 (13,096) 18,152 1,905,463 2,399,538 (606) 2,398,932
Profit (loss) for the period — — — — — — 204,433 204,433 (38) 204,395
Remeasurement of defined benefit obligations — — — — (193) — — (193) — (193)
Fair value loss on foreign currency forward contracts in
hedge accounting — — — — — (30,082) — (30,082) — (30,082)
Exchange differences on translation of foreign
operations — — 31,997 — — — — 31,997 — 31,997
Other comprehensive income (loss) for the period — — 31,997 — (193) (30,082) — 1,722 — 1,722
Total comprehensive income (loss) for the period — — 31,997 — (193) (30,082) 204,433 206,155 (38) 206,117
Shares issued at premium on exercise of options 1,419 — — (277) — — — 1,142 — 1,142
Buy-back of shares — — — — — — (5,388) (5,388) — (5,388)
Vesting of awarded shares — 45 — (45) — — — — — —
Recognition of equity-settled share-based payments — — — 1,898 — — — 1,898 — 1,898
Final dividend – 2016 — — — — — — (70,778) (70,778) — (70,778)
At June 30, 2017 (unaudited) 650,633 (10,431) (124,732) 8,586 (13,289) (11,930) 2,033,730 2,532,567 (644) 2,531,923
Profit for the year — — — — — — 265,992 265,992 137 266,129
Remeasurement of defined benefit obligations — — — — 2,217 — — 2,217 — 2,217
Fair value loss on foreign currency forward contracts in
hedge accounting — — — — — (17,403) — (17,403) — (17,403)
Deferred tax liability on remeasurement of defined
benefit obligation — — — — (9,349) — — (9,349) — (9,349)
Deferred tax liability on hedging reserve — — — — — 549 — 549 — 549
Exchange differences on translation of foreign
operations — — 30,674 — — — — 30,674 — 30,674
Other comprehensive income (loss) for the period — — 30,674 — (7,132) (16,854) — 6,688 — 6,688
Total comprehensive income (loss) for the period — — 30,674 — (7,132) (16,854) 265,992 272,680 137 272,817
Shares issued at premium on exercise of options 3,285 — — (640) — — — 2,645 — 2,645
Vesting of awarded shares — 3,325 — (3,325) — — — — — —
Shares for share award scheme — (3,455) — — — — — (3,455) — (3,455)
Recognition of equity-settled share-based payments — — — 2,295 — — — 2,295 — 2,295
Lapse of share options — — — (14) — — 14 — — —
Interim dividend – 2017 — — — — — — (65,507) (65,507) — (65,507)
At December 31, 2017 (audited) 653,918 (10,561) (94,058) 6,902 (20,421) (28,784) 2,234,229 2,741,225 (507) 2,740,718
Adjustment (Note: 2.2.1) — — — — — — 1,570 1,570 — 1,570
At January 1, 2018 (restated) 653,918 (10,561) (94,058) 6,902 (20,421) (28,784) 2,235,799 2,742,795 (507) 2,742,288
Profit for the period — — — — — — 254,737 254,737 39 254,776
Remeasurement of defined benefit obligations — — — — 135 — — 135 — 135
Fair value gain on foreign currency forward contracts in
hedge accounting — — — — — 40,758 — 40,758 — 40,758
Exchange differences on translation of foreign
operations — — (22,871) — — — — (22,871) — (22,871)
Other comprehensive income (loss) for the period — — (22,871) — 135 40,758 — 18,022 — 18,022
Total comprehensive income (loss) for the period — — (22,871) — 135 40,758 254,737 272,759 39 272,798
Shares issued at premium on exercise of options 686 — — (128) — — — 558 — 558
Buy-back of shares — — — — — — (12,764) (12,764) — (12,764)
Vesting of awarded shares — 637 — (637) — — — — — —
Shares for share award scheme — (4,674) — — — — — (4,674) — (4,674)
Recognition of equity-settled share-based payments — — — 2,346 — — — 2,346 — 2,346
Lapse of share options — — — (6) — — 6 — — —
Final dividend – 2017 — — — — — — (93,827) (93,827) — (93,827)
At June 30, 2018 (unaudited) 654,604 (14,598) (116,929) 8,477 (20,286) 11,974 2,383,951 2,907,193 (468) 2,906,725
Techtronic Industries Interim Report 2018 17Condensed Consolidated Financial Statements
Consolidated Statement of Cash Flows (Unaudited)
For the six-month period ended June 30, 2018
June 30 June 30
2018 2017
US$’000 US$’000
(Unaudited) (Unaudited)
Operating Activities
Profit before taxation 275,433 223,383
Adjustments for:
Amortization/write-off of intangible assets 55,134 47,116
Amortization of lease prepayments 182 174
Depreciation on property, plant and equipment 62,962 54,933
Employee share-based payments expense 2,346 1,899
Fair value (gain) loss on foreign currency forward contracts (7,399) 7,266
Fair value gain on listed equity securities (6,647) —
Finance costs 18,470 12,653
Impairment loss on trade receivables 7,955 12,353
Interest income (13,156) (3,561)
Loss on disposal of property, plant and equipment 5,447 3,486
Loss on disposal of listed equity securities (120) —
Reversal of impairment loss on trade receivables (1,387) (621)
Write down of inventories 18,346 3,228
Operating cash flows before movements in working capital 417,566 362,309
Increase in inventories (140,085) (112,315)
Increase in trade and other receivables, deposits and prepayments (124,226) (188,116)
(Increase) decrease in bills receivable (7,041) 5,402
Decrease in trade receivables from an associate 1,410 2,571
Increase in trade and other payables 96,749 64,609
Decrease in bills payable (9,927) (10,415)
Increase in warranty provision 3,388 2,837
Increase in retirement benefit obligations 1,289 2,772
Net payment for purchase of shares for share award scheme (4,673) —
Cash generated from operations 234,450 129,654
Interest paid (18,470) (12,653)
Hong Kong Profits Tax paid (6,152) (2,621)
Overseas tax paid (18,214) (9,755)
Net Cash from Operating Activities 191,614 104,625
18 Techtronic Industries Interim Report 2018June 30 June 30
2018 2017
US$’000 US$’000
(Unaudited) (Unaudited)
Investing Activities
Additions to intangible assets (62,511) (65,977)
Interest received 13,156 3,561
Proceeds from disposal of listed equity securities 2,108 —
Proceeds from disposal of property, plant and equipment 1,669 100
Purchase of listed equity securities (8,536) —
Purchase of property, plant and equipment (85,407) (71,818)
Advance to associates (126) —
Net Cash used in Investing Activities (139,647) (134,134)
Financing Activities
Increase in discounted bills with recourse 134,465 10,739
Dividends paid (93,827) (70,778)
New bank loans obtained 1,140,933 1,088,744
Proceeds from issue of shares 558 1,142
Repayment of bank loans (1,211,517) (993,678)
Repayment of obligations under finance leases (1,491) (1,667)
Buy-back of shares (12,764) (5,388)
Net Cash (used in) from Financing Activities (43,643) 29,114
Net Increase (Decrease) in Cash and Cash Equivalents 8,324 (395)
Cash and Cash Equivalents at Beginning of the Period 863,515 803,085
Effect of Foreign Exchange Rate Changes (8,712) 13,247
Cash and Cash Equivalents at End of the Period 863,127 815,937
Analysis of the Balances of Cash and Cash Equivalents
Represented by:
Bank balances, deposits and cash 863,127 818,142
Bank overdrafts — (2,205)
863,127 815,937
Techtronic Industries Interim Report 2018 19Condensed Consolidated Financial Statements
Notes to the Condensed Consolidated Financial Statements (Unaudited)
1. Basis of preparation
The condensed consolidated financial statements have been prepared in accordance with Hong Kong Accounting Standard 34 (“HKAS
34”) “Interim Financial Reporting” issued by the Hong Kong Institute of Certified Public Accountants (“HKICPA”) and the applicable
disclosure requirements of Appendix 16 to the Rules Governing the Listing of Securities on The Stock Exchange of Hong Kong Limited
(the “Stock Exchange”).
The financial information relating to the year ended December 31, 2017 that is included in these condensed consolidated financial
statements as comparative information does not constitute the Company’s statutory annual consolidated financial statements for that year
but is derived from those financial statements. Further information relating to these statutory financial statements is as follows:
• The Company has delivered the financial statements for the year ended December 31, 2017 to the Registrar of Companies as
required by section 662(3) of, and Part 3 of Schedule 6 to, the Hong Kong Companies Ordinance.
• The Company’s auditor has reported on those financial statements. The auditor’s report was unqualified; did not include a reference
to any matters to which the auditor drew attention by way of emphasis without qualifying its report, and did not contain a statement
under sections 406(2), 407(2) or (3) of the Hong Kong Companies Ordinance.
2. Significant accounting policies
The condensed consolidated financial statements have been prepared on the historical cost basis except for certain financial instruments
which are measured at fair value.
Other than changes in accounting policies resulting from application of new Hong Kong Financial Reporting Standards (“HKFRSs”), the
accounting policies and method of computations used in the condensed consolidated financial statements for the six-month ended June
30, 2018 are the same as those followed in the preparation of the Group’s annual financial statements for the year ended December 31,
2017.
Application of new and amendments to HKFRSs
In the current interim period, the Group has applied, for the first time, the following new and amendments to HKFRSs issued by the
HKICPA which are mandatorily effective for the annual period beginning on or after January 1, 2018 for the preparation of the Group’s
condensed consolidated financial statements:
HKFRS 9 Financial Instruments
HKFRS 15 Revenue from Contracts with Customers and the related Amendments
HK(IFRIC)-Int 22 Foreign Currency Transactions and Advance Consideration
Amendments to HKFRS 2 Classification and Measurement of Share-based Payment Transactions
Amendments to HKFRS 4 Applying HKFRS 9 Financial Instruments with HKFRS 4 Insurance Contracts
Amendments to HKAS 28 As part of the Annual Improvements to HKFRSs 2014-2016 Cycle
Amendments to HKAS 40 Transfers of Investment Property
The new and amendments to HKFRSs have been applied in accordance with the relevant transition provisions in the respective standards
and amendments which results in changes in accounting policies, amounts reported and/or disclosures as described below.
20 Techtronic Industries Interim Report 20182. Significant accounting policies (continued)
2.1 Impacts and changes in accounting policies of application on HKFRS 15 Revenue from Contracts
with Customers
The Group has applied HKFRS 15 for the first time in the current interim period. HKFRS 15 superseded HKAS 18 Revenue, HKAS
11 Construction Contracts and the related interpretations.
The Group recognizes revenue from the trading of electrical and electronic products. The Group has applied HKFRS 15
retrospectively with the cumulative effect of initially applying this Standard recognized at the date of initial application, January 1,
2018. In accordance with the transition provisions in HKFRS 15, the Group has elected to apply the Standard retrospectively only to
contracts that are not completed at January 1, 2018.
2.1.1 Key changes in accounting policies resulting from application of HKFRS 15
HKFRS 15 introduces a 5-step approach when recognizing revenue:
• Step 1: Identify the contract(s) with a customer
• Step 2: Identify the performance obligations in the contract
• Step 3: Determine the transaction price
• Step 4: Allocate the transaction price to the performance obligations in the contract
• Step 5: Recognize revenue when (or as) the Group satisfies a performance obligation
Under HKFRS 15, the Group recognizes revenue when (or as) a performance obligation is satisfied, i.e. when “control” of the
goods or services underlying the particular performance obligation is transferred to the customer.
A performance obligation represents a good and service (or a bundle of goods or services) that is distinct or a series of
distinct goods or services that are substantially the same.
Control is transferred over time and revenue is recognized over time by reference to the progress towards complete
satisfaction of the relevant performance obligation if one of the following criteria is met:
• the customer simultaneously receives and consumes the benefits provided by the Group’s performance as the Group
performs;
• the Group’s performance creates and enhances an asset that the customer controls as the Group performs; or
• the Group’s performance does not create an asset with an alternative use to the Group and the Group has an
enforceable right to payment for performance completed to date.
Otherwise, revenue is recognized at a point in time when the customer obtains control of the distinct good or service.
A contract asset represents the Group’s right to consideration in exchange for goods or services that the Group has
transferred to a customer that is not yet unconditional. It is assessed for impairment in accordance with HKFRS 9. In
contrast, a receivable represents the Group’s unconditional right to consideration, i.e. only the passage of time is required
before payment of that consideration is due.
A contract liability represents the Group’s obligation to transfer goods or services to a customer for which the Group has
received consideration (or an amount of consideration is due) from the customer.
Warranties
The Group accounts for the warranty in accordance with HKAS 37 Provisions, Contingent Liabilities and Contingent Assets unless
the warranty provides the customer with a service in addition to the assurance that the product complies with agreed-upon
specifications (i.e. service-type warranties).
Techtronic Industries Interim Report 2018 21Condensed Consolidated Financial Statements
Notes to the Condensed Consolidated Financial Statements (Unaudited)
2. Significant accounting policies (continued)
2.2 Impacts and changes in accounting policies of application on HKFRS 9 Financial Instruments
In the current period, the Group has applied HKFRS 9 Financial Instruments and the related consequential amendments to other
HKFRSs. HKFRS 9 introduces new requirements for 1) the classification and measurement of financial assets and financial
liabilities, 2) expected credit losses (“ECL”) for financial assets and 3) general hedge accounting.
The Group has applied HKFRS 9 in accordance with the transition provisions set out in HKFRS 9. i.e. applied the classification and
measurement requirements (including impairment) retrospectively to instruments that have not been derecognized as at January 1,
2018 (date of initial application) and has not applied the requirements to instruments that have already been derecognized as at
January 1, 2018. The difference between carrying amounts as at December 31, 2017 and the carrying amounts as at January 1,
2018 are recognized in the opening retained profits and other components of equity, without restating comparative information.
The Group continues to apply HKAS 39 Financial Instruments: Recognition and Measurement for hedge accounting.
Accordingly, certain comparative information may not be comparable as comparative information was prepared under HKAS 39.
Classification and measurement of financial assets
Trade receivables arising from contracts with customers are initially measured in accordance with HKFRS 15.
All recognized financial assets that are within the scope of HKFRS 9 are subsequently measured at amortized cost or fair value,
including unquoted equity investments measured at cost less impairment under HKAS 39.
Debt instruments that meet the following conditions are subsequently measured at amortized cost:
• the financial asset is held within a business model whose objective is to hold financial assets in order to collect contractual
cash flows; and
• the contractual terms of the financial asset give rise on specified dates to cash flows that are solely payments of principal and
interest on the principal amount outstanding.
Debt instruments that meet the following conditions are subsequently measured at fair value through other comprehensive income
(“FVTOCI”):
• the financial asset is held within a business model whose objective is achieved by both collecting contractual cash flows and
selling the financial assets; and
• the contractual terms of the financial asset give rise on specified dates to cash flows that are solely payments of principal and
interest on the principal amount outstanding.
All other financial assets are subsequently measured at fair value through profit or loss (“FVTPL”), except that at the date of initial
recognition of a financial asset the Group may irrevocably elect to present subsequent changes in fair value of an equity investment
in other comprehensive income (“OCI”) if that equity investment is neither held for trading nor contingent consideration recognized
by an acquirer in a business combination to which HKFRS 3 Business Combinations applies.
Financial assets at FVTPL
Financial assets that do not meet the criteria for being measured at amortized cost or FVTOCI or designated as FVTOCI are
measured at FVTPL.
Financial assets at FVTPL are measured at fair value at the end of each reporting period, with any fair value gains or losses
recognized in profit or loss. The net gain or loss recognized in profit or loss includes any dividend or interest earned on the financial
asset.
The directors of the Company reviewed and assessed the Group’s financial assets as at January 1, 2018 based on the facts and
circumstances that existed at that date. Changes in classification and measurement on the Group’s financial assets and the impacts
thereof are detailed in Note 2.2.1.
22 Techtronic Industries Interim Report 2018You can also read