APURVA PRASAD AMIT CHANDRA - VALUEPICKR FORUM

Page created by Mario Mcgee
 
CONTINUE READING
APURVA PRASAD AMIT CHANDRA - VALUEPICKR FORUM
Apurva Prasad               Amit Chandra               Vinesh Vala
         IT Sector                   IT Sector                 IT Sector
apurva.prasad@hdfcsec.com   amit.chandra@hdfcsec.com   vinesh.vala@hdfcsec.com
     +91-22-6171-7327            +91-22-6171-7345          +91-22-6171-7332
APURVA PRASAD AMIT CHANDRA - VALUEPICKR FORUM
17 December 2020             HSIE India Internet Conference

  Internet Sector
   India Internet: the stage is set                                                 Listed Corporate
   In collaboration with HDFC Bank (IB), we recently hosted the leading             Company
                                                                                                   CMP*          Mcap
                                                                                                                            Reco
   Indian internet companies (both listed and unlisted) cutting across                              (Rs)        (Rs bn)

   multiple industries at our Internet conference. Most internet companies          Info Edge       4,601            589        NR

   are on a hyper-compounding trajectory, powered by their business moat            IndiaMART       5,504            159        NR

   and supported by the industry drivers of rising internet/smartphone              Affle           4,026            102        NR
   penetration, the democratisation of technology, and seamless payment             Matrimony       841              19         NR
   ecosystem. With customer cohorts expanding and overlapping with the              *CMP as on 16th Dec 2020
   economy, we list key highlights and lead indicators across sectors.
   A quick check on global internet for growth/size/valuation threshold
                                                                                    Unlisted Corporate
   unveils (1) ~T100 US and China-listed Internet companies have a median
                                                                                    Company                 Sector
   growth of 20% and revenue of USD 2bn, (2) listed global tech software
                                                                                    Amazon Pay              FinTech
   and services (n=1540) have median growth of 10% and revenue of ~USD
                                                                                    BoAt                    Consumer/wearables
   100mn, (3) 3-Y growth estimates (consensus) across leaders in sub-
   segments categories are 29% (e-commerce), 13% (Ad and Social), 20%               CarDekho                Car e-marketplace

   (Entertainment), 23% (Gaming), 17% (Classified & Web Hosting), 25%               Grofers                 e-Commerce

   (Food & Mobility), >35% (EduTech & HealthTech), and 21% (FinTech).               Paytm Money             FinTech
   Given (1) global precedent, (2) Indian ecosystem drivers (e-retail               Pepperfry               e-Commerce
   expected to grow 3.6x in five years, digital payments 10x in the next five       PharmEasy               ePharma
   years), (3) expected broad-basing of the capital base (disparity between         Pine Labs               FinTech
   listed Indian internet at
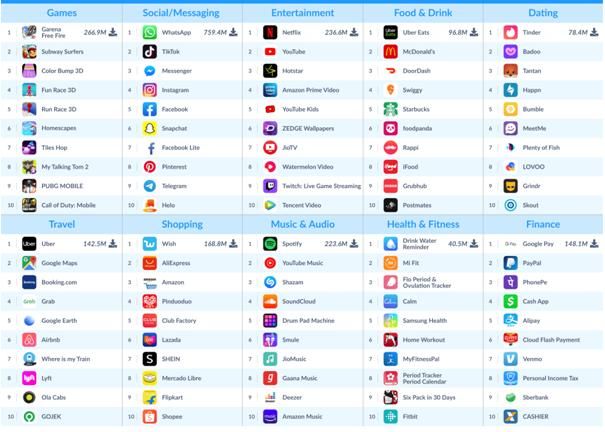
APURVA PRASAD AMIT CHANDRA - VALUEPICKR FORUM
HSIE India Internet

                      Contents
                      Industry Overview ............................................................................................................... 3
                      Powering the marketplace .................................................................................................. 5
                      Powering commerce ............................................................................................................. 8
                      Charting the global tech landscape ................................................................................. 10
                      Listed Corporates
                            Info Edge (India) .......................................................................................................... 12
                            IndiaMART InterMESH .............................................................................................. 14
                            Affle India ..................................................................................................................... 16
                            Matrimony.com ............................................................................................................ 18
                      Unlisted Corporates
                            Amazon Pay ................................................................................................................. 20
                            BoAt .............................................................................................................................. 21
                            CarDekho ..................................................................................................................... 22
                            Grofers .......................................................................................................................... 23
                            Paytm Money............................................................................................................... 24
                            Pepperfry...................................................................................................................... 25
                            PharmEasy ................................................................................................................... 26
                            Pine Labs ...................................................................................................................... 28
                            PolicyBazaar ................................................................................................................ 29
                            Razorpay ...................................................................................................................... 31
                            Upstox.......................................................................................................................... 32
                            Urban Company .......................................................................................................... 33
                            Zerodha ........................................................................................................................ 34
                      Global Internet Valuation ................................................................................................ 36
                      India Internet Valuation charts ....................................................................................... 38

                                                                                                                                                      Page | 2
APURVA PRASAD AMIT CHANDRA - VALUEPICKR FORUM
HSIE India Internet

Industry Overview
India Internet key stats
                                                                                                                                                        Monthly
    App                Wirless                                                                                           E-commerce
                                         Internet             Smartphone     Social                Daily                                                  UPI
 downloads             Phone                                                                                                market
                                       subscribers              devices    media users           mobile time                                          transactions
  (2QCY20)           subscribers                                                                                            (CY20)
                                                                                                                                                          vol.
        7bn          1.15 billion      749 million            500million    376million                   4.8hrs           USD 54bn                      2billion
Source: Company, HSIE Research

Growth trend in Indian internet subscriber base: 3%                             Growth trend in data usage: 9% CQGR
CQGR
                         Internet subscribers (mn)                               (mn GB)                Total wireless data usage (million GB)
  (mn)
  800                                                                            28,000
                                                                                             Avg 12GB/month -
  750                                                                            26,000
                                                                                             higher by 25% YoY

                                                                                                                                                           25,979
                                                                749
                                                  743

  700                                                                            24,000
                                      719

                                                                                                                                             23,403
                                                                                 22,000
                         688

  650
               665

                                                                                                                           21,402
                                                                                 20,000
  600

                                                                                                                20,315
                                                                                 18,000

                                                                                               18,371
  550
                                                                                 16,000
  500                                                                            14,000
  450                                                                            12,000
  400                                                                            10,000
          2QCY19      3QCY19       4QCY19     1QCY20          2QCY20                        2QCY19          3QCY19       4QCY19            1QCY20       2QCY20

Source: TRAI, HSIE Research                                                     Source: TRAI, HSIE Research

Data consumption drivers: Drop in data cost (93%) & Rise in data consumption (4x)

                                 Cost of data (Rs/GB)                                     Data consumption per user (GB/month)

          160              152                                             12
                                                                                                                                    10.4
          140
                                                                           10         4x rise in data
          120                                                                         consumption
                                                                           8
          100

              80                                                           6

              60
                                                                           4
                                                                                             2.7
              40
                                                                           2
              20                                         10

              0                                                            0
                          CY16                          CY19                                CY16                                CY19

Source: ICEA, HSIE Research

                                                                                                                                                          Page | 3
APURVA PRASAD AMIT CHANDRA - VALUEPICKR FORUM
HSIE India Internet

India smartphone shipments trends (mn): sharp recovery
                                                                                                                                                                                                             Sharp rise
  (mn)
                                                                                                                                                                                                             in shipments
  60
                                                           1Y: +17%                                                                                                                                          post-COVID                                 54.3
                                                           3Y: +39%
  50                                                                                                                                                                                                                       46.6
                                                           5Y: +92%                                                                                                                           42.6
                                                                                                                                                                 39.0
  40
                                                                                                                                    32.3
                                                                                                       28.3
  30
                                                                          23.3

  20
                                            12.8

  10
                3.9

   0
         2Q12
                3Q12

                                     2Q13

                                                            1Q14

                                                                                  4Q14

                                                                                                        3Q15

                                                                                                                             2Q16
                                                                                                                                     3Q16

                                                                                                                                                   1Q17
                                                                                                                                                          2Q17

                                                                                                                                                                         4Q17
                                                                                                                                                                                1Q18

                                                                                                                                                                                                      4Q18

                                                                                                                                                                                                                            3Q19

                                                                                                                                                                                                                                                 2Q20
                       4Q12
                              1Q13

                                             3Q13
                                                    4Q13

                                                                   2Q14
                                                                           3Q14

                                                                                         1Q15
                                                                                                2Q15

                                                                                                               4Q15
                                                                                                                      1Q16

                                                                                                                                            4Q16

                                                                                                                                                                  3Q17

                                                                                                                                                                                       2Q18
                                                                                                                                                                                               3Q18

                                                                                                                                                                                                             1Q19
                                                                                                                                                                                                                    2Q19

                                                                                                                                                                                                                                   4Q19
                                                                                                                                                                                                                                          1Q20

                                                                                                                                                                                                                                                         3Q20
Source: IDC, HSIE Research

Shift to the app ecosystem; top downloaded apps globally (2019)

Source: Apptopia

                                                                                                                                                                                                                                                                Page | 4
APURVA PRASAD AMIT CHANDRA - VALUEPICKR FORUM
HSIE India Internet

Powering the marketplace
India Retail market (USD bn)                                                           Indian E-Retail Market by Gross GMV: 30% CAGR
                                                                                       over CY20-25E
  (USD bn)                                                                              (USD bn)
                                                                                         160
 900                                                                                                                                                   140.0
 800                                                                                     140

 700                                                                                     120
 600                                                                                     100
 500
                                                                                            80
 400           857
                                                                                            60
 300
                                                                                                                                                38.0
 200                                                                                        40                                         27.1
                                                                                                                           21.7
                                                                                                   12.4        16.0
 100                                                                                        20
                                          90                     20
   0                                                                                         0
          Overall Retail        Organised Retail            E-retail                              CY16         CY17    CY18            CY19     CY20   CY25E

Source: Avenue Supermarts (Jan '20), HSIE Research                                     Source: RedSeer, HSIE Research

Grocery Retail Market: Online grocery 59% CAGR CY19-24E

                      Online Grocery                        Modern Retail Grocery                              Traditional Retail Grocery

       CY24E              50                                                                722

        CY19     24                                                    577

                                                                                    Online grocery expected to increase from 0.3% of
        CY13     5                         295                                      Grocery Retail to 2.3% over CY19-24E

                0                   100               200             300             400               500           600                700           800
                                                                                                                                         (USD bn)

Source: RedSeer, HSIE Research

Rising share of e-commerce revenue (%) for consumer goods
                                                                             FY20     FY21E
         10%

                                                                                                                                  8%
          8%

                               6%                                                       6%                            6%
          6%
                                                     5%                                                       5%

          4%                                                          3%
                     3%                   3%                                                       3%
                                                                                                                                                 2%
                                                            2%                 2%
          2%
                                                                                                                                          1%

          0%
                      HUL                      ITC           Nestle                 Dabur            GCPL              Marico                 Emami

Source: Company, HSIE Research

                                                                                                                                                        Page | 5
HSIE India Internet

India furniture market trend                                                   Online furniture market trend: WFH has accelerated
                                                                               B2C
                         Organised         Unorganised                          (USD mn)
 (USD bn)
 30.0                                                                              800

                                                                                   700
 25.0
                                                                                   600
 20.0
                                                                                   500
                                                                     22.0
 15.0                                                                              400
                                                                                                                                         700
                                                             17.0                  300
 10.0                                          14.5
                                      14.0
                  11.0      12.0                                                   200
  5.0       9.5                                                                                                          310
                                                                                   100                      200
                                                             3.0      6.0                   104
            0.5                                 2.5
   -                                                                                0
        CY15      CY16     CY17       CY18     CY19    CY20E CY23E                         CY17          CY18            CY19           CY20E

Source: RedSeer, HSIE Research                                                 Source: RedSeer, HSIE Research

India Pharma Retail market

                         Unorganised           Organised                                 Online (organised)       Offline (organised)

                                   USD
                                   2.5bn
                                                                                                                          USD
                                                                                                                          0.9bn

                                                                                          USD
                                                                                          1.6bn
                                            USD
                                           22.5bn

Source: RedSeer, HSIE Research

                                              E-Pharmacy market trend

                                               FY25E                                                                                           13.3

                                                FY20                0.9
                                                                                                              71% CAGR

                                                         0                2    4            6           8           10            12            14

                                                                                                                                       (USD bn)

                                              Source: RedSeer, HSIE Research

                                                                                                                                           Page | 6
HSIE India Internet

Rise in EdTech usage (mn)                                                                          Online education market: 10x growth potential
 (mn)                                                                                              (USD bn)              Higher education        Lifelong learning
120                                                                                                 6
                                                                          100
100                                                                                                  5

  80                                                                                                 4                                                          1.2

  60                        45                                                                       3

  40                                                                                                 2
                                                                                                                                                                3.6
                                                                                                                                          0.3
  20                                                                                                 1
                                                                                                                   0.1                    1.3
                                                                                                     0             0.4
   0
                                                                                                                   FY20                  FY21E                FY25E
                            2019                                   Aug-20

Source: Zinnov, HSIE Research                                                                      Source: RedSeer, HSIE Research

Surge in online gaming market in India                                                             Rise in OTT consumption: Netflix India revenue trend
 (USD bn)                                                                                                (Rs bn)
 10                                                                                                 10.00                                                        9.24
                                                                                   9.0

  8                                                                                                  8.00                CAGR of 299%
                     CAGR of 448%
  6                                                                                                  6.00
                                                                                                                                            4.71

  4                                                                                                  4.00
                                                  2.6

  2                                                                                                  2.00
                                                                                                                         0.58
                    0.3
                                                                                                         -
  0
                                                                                                                     FY18                   FY19                FY20
                    2014                          2020                          2024E

Source: RedSeer, HSIE Research                                                                     Source: Entrackr, HSIE Research

Consequently a rising share of digital advertising                                                 Digital Ad by verticals (FY19)
   (Rs bn)                  Traditional Adex               Digital Adex                                                         Others                      Search
 800                                                                                                                             3%                         Spends
                                                                                                               Display
                                                                                                                                                             23%
 700                                                                                                           Spends
                                                                                                                22%
                                                                                            199
                                                                                     155

 600
                                                                            117
                                                                   93

 500
                                                            73
                                                    51
                                           40

 400
                                    31
                             23
                     15
             10

 300
                                                                                            548
                                                                                     521
                                                                            492
                                                                   438
                                                            422
                                                    389

 200
                                           334
                                    291
                             266
                     259
             240

 100
                                                                                                                Video                                         Social
   -                                                                                                           Spends                                          22%
             FY10

                     FY11

                             FY12

                                    FY13

                                           FY14

                                                    FY15

                                                            FY16

                                                                   FY17

                                                                            FY18

                                                                                     FY19

                                                                                            FY20

                                                                                                                 30%

Source: Pitch Madison, HSIE Research                                                               Source: Pitch Madison, HSIE Research

                                                                                                                                                                        Page | 7
HSIE India Internet

Powering commerce
Payments market by Transaction volume: 92mn daily                                                                                        Payments market by Transaction value: USD 12bn
                                                                                                                                         daily
                                                                                  Credit Card,                                                                                Credit Card,
                                                                                       5                                                               UPI, 125                   17
                                                                                                                                                                                                Debit Card,
                                                                                                         Debit Card,                                                                                18
                                                                                                             12

                                                                                                                  NEFT, 9

          UPI, 67
                                                                                                                                                                                             NEFT, 721

Source: RBI Data; Credit/Debit card, NEFT, UPI                                                                                           Source: RBI Data; Credit/Debit card, NEFT, UPI

India Digital Payment industry: 10x opportunity in 5                                                                                     India P2M Digital Payment industry: 8x opportunity
years                                                                                                                                    in 5 years
                                        Mobile transactions (Rs trn)                                                                                            P2M Mobile payments (Rs trn)

 FY25E                                                                                                         245                        FY25E                                                     33

  FY20                     25                                            58% CAGR in Mobile                                                 FY20          4                     53% CAGR in Mobile
                                                                         transactions                                                                                           transactions

          0                  50                100                 150                 200                   250       300                         0              10          20              30            40
                                                                                                                (Rs trn)                                                                              (Rs trn)

Source: RedSeer, HSIE Research                                                                                                           Source: RedSeer, HSIE Research

Monthly UPI transactions (mn): +56% since pre-covid                                                                                      UPI transactions share by volume (mn)
high
     (mn)                                                                                                                                                Amazon         Others, 47
                                                                                                                                                         Pay, 125
 2,500
                                                                                                                           2,072
                                                                1Y: +80%                                                                        Paytm, 245
 2,000
                                                                3Y: 25x                                                                                                                             PhonePe,
                                                                                                                                                                                                      835
 1,500

 1,000

  500

    -
                  Oct-17

                                                       Oct-18

                                                                                           Oct-19

                                                                                                                                Oct-20
                                                                         Apr-19

                                                                                                              Apr-20
                                     Apr-18
                            Jan-18

                                                                Jan-19

                                                                                                    Jan-20
         Jul-17

                                              Jul-18

                                                                                  Jul-19

                                                                                                                       Jul-20

                                                                                                                                                   GooglePay,
                                                                                                                                                      819

Source: RBI Data, HSIE Research                                                                                                          Source: Entrackr, HSIE Research; Oct '20 data

                                                                                                                                                                                                      Page | 8
HSIE India Internet

POS Terminals trend                                                                                     Insurance renewal premium sourced digitally (%)
 (mn)                                                                                                          (%)
  6                                                                                                      100
                                                                       5.1                                                                        88
  5
                                         3.4x
                                                                                                          80                                                               74
  4                                                                                                                           70

  3                                                                                                       60

  2                       1.5
                                                                                                          40
  1

  0                                                                                                       20
             Pre-Demonet (Oct'16)                       Post-Demonet (Apr'20)                                           SBI Life               HDFC Life          ICICI Pru Life

Source: RedSeer, HSIE Research                                                                          Source: Company, HSIE Research

Active customers trend ('000s)
                                                                                     Zerodha    RKSV       Others

  Oct'20              2,603                     1,389                                                     10,103

      FY20        1,414         619                                          8,137

      FY15                            4,636
             30

             0                   2,000                  4,000                6,000              8,000                10,000           12,000           14,000              16,000

                                                                                                                                                                 ('000s)

Source: Company, HSIE Research

                                                           India Internet (listed) Revenue & EBITDA growth trend
                                                                (Rs bn)                                  Revenue (Rs bn)           EBITDA (Rs bn)

                                                                30.00
                                                                                Revenue & EBITDA at 20% & 24% CAGR
                                                                25.00
                                                                                                                                                       26.17

                                                                20.00                                                 22.03

                                                                                18.29
                                                                15.00

                                                                10.00

                                                                 5.00                                                                                                  7.14
                                                                                                                                      5.68
                                                                                                 4.67
                                                                   -
                                                                                         FY18                                  FY19                             FY20

                                                           Source: Company, HSIE Research; Aggregate of Info Edge, IndiaMART, Affle, Matrimony

                                                                                                                                                                                Page | 9
HSIE India Internet

Charting the global tech landscape
Growth & Scale distribution of Global Listed Tech (Software & services)
 (3Y Revenue Growth
      CAGR %)

   100.0%

    10.0%

     1.0%

     0.1%
               1                  10                      100                   1,000                      10,000                1,00,000

                                                                                                                        (Revenue USD bn)

Source: Bloomberg, HSIE Research; Logscale, n=1176

Countries with top active unicorns                                        Global unicorns by industry
  SR NO.        Countries                         Unicorns (Nos)            SR NO. Industry                                     No. of Unicorns
     1          USA                                     233                    1       E-commerce                                     89
     2          China                                   227                    2       Artificial Intelligence                        63
     3          UK                                      24                     3       FinTech                                        63
     4          India                                   21                     4       SaaS                                           53
     5          South Korea                             11                     5       Shared Economy                                 33
     6          Germany                                 10                     6       Health Tech                                    28
     7          Brazil                                   8                     7       Big Data                                       20
     8          Israel                                   8                     8       EdTech                                         20
     9          France                                   7                     9       Media & Entertainment                          19
    10          Switzerland                              5                     10      BioTech                                        17
Source: Hurun Global Unicorn Index 2020                                   Source: Hurun Global Unicorn Index 2020

Growth & Scale distribution of US + China Listed Internet companies
   (3Y Revenue Growth
        CAGR %)

     1000%

         100%

         10%

          1%

          0%
                10                 100                       1,000                  10,000                   1,00,000              10,00,000

                                                                                                                         (Revenue USD mn)

Source: Bloomberg, HSIE Research; Note: Logscale, n=106 constituents include from Nasdaq Internet & CSI Global China indices

                                                                                                                                       Page | 10
HSIE India Internet

Indian unicorns
                                                     Year of
  SR
         Company              Segment                entry in Key investors
  NO.
                                                    USD 1bn+
   1     InMobi               Mobile Ads              2011    KPCB, Sherpalo Ventures, SoftBank
   2     Mu Sigma             Analytics               2013    Accel, Sequoia Capital, General Atlantic
   3     Flipkart             E-commerce              2012    Accel, Tiger Global, Naspers, SoftBank, Tencent
   4     Snapdeal             E-commerce              2014    Kalaari Capital, Nexus Ventures, Bessemer, SoftBank, Alibaba
   5     Ola                  Ride hailing            2015    Tiger Global, Matrix Partners, Steadview, SoftBank, Tencent
   6     Paytm                FinTech                 2015    Saama Capital, SAIF, Alibaba, Berkshire Hathway
   7     Quikr                Classifieds             2015    Matrix Partners, Omidyar Network, Norwest, Kinnevik
   8     Zomato               FoodTech                2015    Info Edge, Sequoia Capital, Vy Capital, Alibaba
   9     Hike                 Messaging               2016    Tiger Global, Tencent, Foxconn
   10    Shopclues            E-commerce              2016    Nexus Ventures, Helion Ventures, Beenos, Tiger Global, Others
                                                              Aarin Capital, Sequoia Capital, Lightspeed Ventures, Tencent, General
   11    Byjus                EdTech                  2018
                                                              Atlantic, Tiger Global
   12    Paytm Mall           E-commerce              2018    SAIF, Alibaba, SoftBank, eBay
   13    Swiggy               FoodTech                2018    Accel, SAIF, Norwest, Naspers, Tencent
   14    Policy Bazaar        FinTech                 2018    Info Edge, Intel, Inventus Capital, Tiger Global, SoftBank, Tencent
   15    Oyo Rooms            Hotel                   2018    Lightspeed Ventures, Sequoia Capital, SoftBank
   16    Udaan                E-commerce              2018    Lightspeed Ventures, DST Global, Tencent
   17    Freshworks           SaaS - CRM              2018    Accel, Tiger Global, Google, Sequoia Capital
   18    Bill Desk            FinTech                 2018    SIDBI VC, TA Associates, General Atlantic
                                                              Nexus Ventures, Multiples PE, Tiger Global, Carlyle, SoftBank Corp, Fosun
   19    Delhivery            Logistics               2019
                                                              Group
   20    Dream11              Gaming                  2019    Kalaari Capital, Tencent, Multiples PE, Steadview
   21    Big Basket           Groceries               2019    Ascent Capital, Helion Ventures, Bessemer, IFC, Alibaba
   22    Rivigo               Trucking                2019    SAIF, Warburg Pincus
   23    Druva Software       Data management         2019    WestBridge, Nexus Ventures, Sequoia Capital
   24    Icertis              Contract management     2019    Eight Roads, B Capital, PremjiInvest
   25    Citius Tech          Healthcare              2019    General Atlantic, Baring Asia
   26    Ola Electric         Mobility                2019    SoftBank Corp, Tiger Global, Matrix Partners
   27    Lenskart             E-commerce              2019    SoftBank Corp, Kedaara Capital, TPG, Chiratae Ventures, TR Capital
                                                              Sequoia Capital India, New Atlantic Ventures, Altimeter Capital, Temasek,
   28    Pine Labs            FinTech                 2020
                                                              Mastercard
   29    Nykaa                E-commerce              2020    Techpro Ventures, TVS Capital, Sharrp Ventures, TPG Growth
   30    Postman              SaaS                    2020    Nexus Ventures, Charles River Ventures, Insight Venture Partners
                                                              Blume Ventures, Nexus Venture Partners, Sequoia Capital India, SAIF,
   31    Unacademy            EdTech                  2020
                                                              General Atlantic, SoftBank
   32    Razorpay             FinTech                 2020    Matrix Partners India, Tiger Global, Sequoia Capital India, DST Global
   33    Cars24               Auto                    2020    Asia Venture Group, Apoletto, Unbound, DST Global, Sequoia Capital India
Source: Ventureintelligence

                                                                                                                                    Page | 11
HSIE India Internet

Info Edge (India)                                                                                                    Not Rated
Info Edge (India) Ltd is an internet company that operates India's largest online               CMP (as on 16 Dec 2020)          Rs 4,601
job portal Naukri.com (71% of the revenue), real estate platform 99Acres.com (14%
                                                                                                Target Price                           NA
of rev), matrimony platform Jeevansathi.com (third-largest player in the market),
and education services (Shiksha.com). The company also holds a stake in 23                      NIFTY                                13,683
online companies, including two unicorns - the food-tech company Zomato and
insurance aggregator PolicyBazaar.
                                                                                                KEY STOCK DATA
Key takeaways:
                                                                                                Bloomberg code                   INFOE IN
Naukri
                                                                                                No. of Shares (mn)                       129
     The pandemic impacted the recruiter/jobseeker traffic on Naukri.com by 70-                MCap (Rs bn) / ($ mn)            592/8,040
      80%. The traffic has now returned to pre-COVID level, supported by a revival
                                                                                                6m avg traded value (Rs mn)           1,869
      in the IT-ITes sector (32% of Naukri). Other verticals like BFSI, Manufacturing,
      and Pharma have started to revive.                                                        52 Week high / low           Rs 4,740/1,580

     Travel and Hospitality were the most impacted verticals during the pandemic
                                                                                                STOCK PERFORMANCE (%)
      (down 80-90% in Apr-May). Currently, it is down 40-45% YoY and is likely to
      remain in stress over the medium term.                                                                            3M     6M      12M

                                                                                                Absolute (%)         30.0     63.5     74.1
99Acres
                                                                                                Relative (%)         11.2     24.7     60.1
     Traffic on 99acres.com has returned to pre-COVID levels, although builders are
      still cautious over advertising spend. Brokers have started focus on the resale
                                                                                                SHAREHOLDING PATTERN (%)
      and rental category, but realisations are still down 28% YoY.
                                                                                                                        Jun-20       Sep-20
     New project launches have come down, and buyer preference has changed to
      ready-to-move homes. Higher activity is witnessed in Tier-2/3 cities, and broker          Promoters                40.37        38.47

      recovery is better than the builder category.                                             FIs & Local MFs          12.56        12.82

Jeevansathi                                                                                     FPIs                     37.01        39.16

     Profile growth accelerated due to higher traffic on the platform as most of the           Public & Others          10.06         9.55

      people were at home. InfoEdge has steeped up marketing spends which have                  Pledged Shares            0.00         0.00
      resulted in higher sales growth (better than pre-COVID level).                            Source : BSE

     New features like video calling, video profiles, and video-based online                   Pledged shares as % of total shares
      meetings are driving profile growth. Around 60-70% of the profiles are created
      by parents and have a higher conversion ratio.
     Jeevansathi has a dominant position in the North and Western market, while
      Matrimony has a 70% market share in the south market.
Zomato
     With the ease in lockdown, billing has reached pre-COVD levels; however, the
                                                                                                Amit Chandra
      number of food orders is still struggling to reach pre-COVID levels.
                                                                                                amit.chandra@hdfcsec.com
Financial summary                                                                               +91-22-6171-7345
YE March (Rs bn)                   FY15      FY16       FY17    FY18    FY19    FY20    TTM
Net Sales                           6.11      7.18       8.02    9.15   10.98   12.73   11.80
EBITDA                              1.79      1.36       2.27    2.97    3.41    4.03    3.59   Apurva Prasad
APAT                                1.65      1.37       2.08    2.74    3.15    3.29    3.04   apurva.prasad@hdfcsec.com
Diluted EPS (Rs)                    13.7      11.3       17.2    22.5    25.8    26.9    24.8   +91-22-6171-7327
P/E (x)                            335.5     406.7      267.3   204.4   178.2   171.0   185.6
EV / Revenue (x)                    12.8      11.9       11.0    12.8    51.1    44.2    48.5
EV / EBITDA (x)                     43.7      62.9       38.7    39.6   164.5   139.7   159.7
                                                                                                Vinesh Vala
RoE (%)                             13.3       7.8       11.0    13.4    14.2    13.8     8.9   vinesh.vala@hdfcsec.com
Source: Company, HSIE Research, Standalone Financials                                           +91-22-6171-7332

                                                                                                                             Page | 12
HSIE India Internet

Revenue segment contribution                                                                                                                                               Increasing trend of resumes in Naukri
                 Recruitment Solutions                                                   99acres                                Others                                                                             Number of resumes in Naukri (Mn)
  100                                                                                                                                                                      80

                                                                         10

                                                                                                                     10
                                                                                                          10
                                                                                    11
                                11

                                                              11

                                                                                                                                11
                                          12

                                                                                               12
                      12

                                                    13

                                                                                                                                            13
            14

                                                                                                                                                               15
   90                                                                                                                                                                                                                                                                                                                            71
                                                                                                                                                                                                                                                                                                           69 69
                                                                                                                                                                           70                                                                                                        66 67
                                15

                                                                         18

                                                                                                                     18
                                                                                                                                                                                                                                                               63 64
                                          15

                                                                                                          18
                                                              17
                      14

                                                                                                                                17
                                                                                    19
   80

                                                                                               18

                                                                                                                                            15
                                                    16
            14

                                                                                                                                                               14
                                                                                                                                                                                                                                    61
                                                                                                                                                                                                                              59 60
   70                                                                                                                                                                      60                           56 57
                                                                                                                                                                                  53 54
   60
                                74
                      73

                                          73

                                                                         72
                                                                                                                                                                           50
                                                              72

                                                                                                                     72
            72

                                                                                                          72

                                                                                                                                            71
                                                                                                                                71

                                                                                                                                                               71
                                                    71

                                                                                    71
   50                                                                                          70

   40                                                                                                                                                                      40

                                                                                                                                                                                  1QFY18

                                                                                                                                                                                                        3QFY18
                                                                                                                                                                                                                   4QFY18
                                                                                                                                                                                                                              1QFY19
                                                                                                                                                                                                                                         2QFY19
                                                                                                                                                                                                                                                    3QFY19
                                                                                                                                                                                                                                                               4QFY19
                                                                                                                                                                                                                                                                          1QFY20
                                                                                                                                                                                                                                                                                     2QFY20
                                                                                                                                                                                                                                                                                                3QFY20
                                                                                                                                                                                                                                                                                                           4QFY20
                                                                                                                                                                                                                                                                                                                      1QFY21
                                                                                                                                                                                                                                                                                                                                 2QFY21
                                                                                                                                                                                             2QFY18
            1QFY18
                      2QFY18
                                3QFY18
                                          4QFY18
                                                    1QFY19
                                                              2QFY19
                                                                         3QFY19
                                                                                    4QFY19
                                                                                               1QFY20
                                                                                                          2QFY20
                                                                                                                     3QFY20
                                                                                                                                4QFY20
                                                                                                                                            1QFY21
                                                                                                                                                               2QFY21
Source: Company, HSIE Research                                                                                                                                             Source: Company, HSIE Research

Recovery started in Recruitment                                                                                                                                            as well as Real estate billings
                                              Recruitment Billing (Rs Mn)                                                                                                                                                      99acres Billing (Rs Mn)
                                                                                                                                                                           800
 3,000
                                                                                                                                                                           700

 2,500                                                                                                                                                                     600
                                                                                                                                                                           500

 2,000                                                                                                                                                                     400

                                                                                                                                                                                                                                                                 667
                                                                                      2,598
                                                                                                 2,517

                                                                                                                                                                                                                                                                                       605
                                                                                                                                  2,400

                                                                                                                                                                           300
                                                                                                                                                                                                                     562

                                                                                                                                                                                                                                                                                                  543
                                                                                                                                                                                                                                                                                                             507
                                                                                                                                                                                                                                           501

                                                                                                                                                                                                                                                                            484
                                           2163

                                                                                                                                                                                                                                                                                                                                   467
                                                                                                                       2,100
                                                     2,101

                                                                                                            2,098

                                                                                                                                                                                                                                                      460
                                                                                                                                                                                                                                409
                                                                           1,936

                                                                                                                                                                                                          378

                                                                                                                                                                           200
                                                                1,841

 1,500
             1821

                                                                                                                                                                                               333
                                                                                                                                                                  1,673

                                                                                                                                                                                    298
                                 1632
                       1464

                                                                                                                                                1QFY21 1,403

                                                                                                                                                                           100

                                                                                                                                                                                                                                                                                                                        140
 1,000                                                                                                                                                                       0
                                                                                                                                                                                    1QFY18
                                                                                                                                                                                               2QFY18
                                                                                                                                                                                                          3QFY18
                                                                                                                                                                                                                     4QFY18

                                                                                                                                                                                                                                           2QFY19
                                                                                                                                                                                                                                                      3QFY19
                                                                                                                                                                                                                                                                 4QFY19
                                                                                                                                                                                                                                                                            1QFY20
                                                                                                                                                                                                                                                                                       2QFY20
                                                                                                                                                                                                                                                                                                  3QFY20
                                                                                                                                                                                                                                                                                                             4QFY20
                                                                                                                                                                                                                                                                                                                        1QFY21
                                                                                                                                                                                                                                                                                                                                   2QFY21
                                                                                                                                                                                                                                1QFY19
             1QFY18
                       2QFY18
                                 3QFY18
                                           4QFY18
                                                     1QFY19
                                                                2QFY19
                                                                           3QFY19
                                                                                      4QFY19
                                                                                                 1QFY20
                                                                                                            2QFY20
                                                                                                                       3QFY20
                                                                                                                                  4QFY20

                                                                                                                                                                  2QFY21

Source: Company, HSIE Research                                                                                                                                             Source: Company, HSIE Research

Total revenue trend                                                                                                                                                        EBITDA margin (%) trend
             Total Revenue (Rs Mn) - LHS                                                                  Growth (YoY %) - RHS
                                                                                                                                                                             35
 14,000                                                                                                                                                            25.0                                                                   32.5
                                                                                                          12,727                                                             33                                                                                    31.1                       31.6
                                                                                                                                11,796                                                                                                                                                                                30.4
                       17.4

 12,000                                                                             10,983                                                                                   31
                                                                                                                                                                   20.0                                            28.4
                                                                                                                                                                             29
                                                                                       20.0

 10,000                                                       9,155
                                         8,021                                                                                                                     15.0      27
                                                                                                               15.9

  8,000          7,176                                                                                                                                                       25
                                                                14.1

                                                                                                                                                                   10.0
                                          11.8

  6,000                                                                                                                                                                      23
                                                                                                                                                                             21        18.9
                                                                                                                                                                   5.0
  4,000
                                                                                                                                                                             19
  2,000                                                                                                                                                            0.0       17
                                                                                                                                         -2.0

                                                                                                                                                                             15
        0                                                                                                                                                          -5.0
                                                                                                                                                                                           FY16                    FY17                  FY18                     FY19                    FY20                        TTM
                 FY16                    FY17                 FY18                  FY19                   FY20                   TTM

Source: Company, HSIE Research                                                                                                                                             Source: Company, HSIE Research

                                                                                                                                                                                                                                                                                                                    Page | 13
HSIE India Internet

IndiaMART InterMESH                                                                                           Not Rated
IndiaMART InterMESH Ltd is India's largest online B2B marketplace with ~60%              CMP (as on 16 Dec 2020)          Rs 5,485
market share. Indiamart provides a two-way discovery platform for buyers and
                                                                                         Target Price                          NA
sellers. It has a diversified product catalogue (69mn products) across 56 industries.
The traffic on the platform is 100% organic, and 83% of it flows through the             NIFTY                               13,683
mobile. Indiamart has 113mn registered buyers and 6.9mn registered suppliers.
The platform has ~61% repeat buyers, and 36% of the suppliers are buyers. The
company generates revenue through a subscription-based revenue model, and the            KEY STOCK DATA
paying supplier base has increased at a CAGR of 15%.                                     Bloomberg code                INMART IN

Key takeaways:                                                                           No. of Shares (mn)                        29

     The major strengths of the platform are (1) strong network effect, (2) buyer       MCap (Rs bn) / ($ mn)            160/2,171

      satisfaction, (3) helping suppliers manage leads through RFQs, (4) high            6m avg traded value (Rs mn)              656
      diversification, and (5) low cost of acquisition. Most of the traffic is driven    52 Week high / low           Rs 5,550/1,641
      through Google search as it manages to come at the top of the search for most
      product listings, despite not paying anything to search engine.
                                                                                         STOCK PERFORMANCE (%)
     The traffic on the IndiaMart platform is 100% organic, and the company does
                                                                                                                 3M     6M     12M
      not spend on advertising. The buyer traffic on the platform has increased at a
      CAGR of 32% and is now higher than pre-COVID levels.                               Absolute (%)            6.8 151.2     170.8

     The surge in buyer traffic has led to higher inquiries (+40% YoY), and the ROI     Relative (%)         (11.9) 112.4     156.8
      proposition for suppliers has improved. As a result, the company expects to
      add ~5,000 suppliers every quarter, similar to pre-COVID levels.                   SHAREHOLDING PATTERN (%)

     Subscribers with long-term packages have not opted out during the pandemic;                                Jun-20      Sep-20
      the real impact was witnessed on short-term (monthly) packages. The supplier
                                                                                         Promoters                52.34        51.99
      base has stabilised, and the new supplier addition has also revived. The
                                                                                         FIs & Local MFs           3.78         5.73
      company has added 2-3k new suppliers in the past three months.
     The platform is free for buyers, and revenue is generated from suppliers           FPIs                     15.15        21.67

      through a subscription model. There are three different kinds of subscription      Public & Others          28.73        20.61
      models, Platinum, Gold, and Silver (offered on a monthly and annual basis).        Pledged Shares            0.00         0.00
      Out of the total 0.14mn paying suppliers, ~67% of the suppliers buy annual
                                                                                         Source : BSE
      subscriptions, and ~33% are opting for a monthly subscription model.
                                                                                         Pledged shares as % of total shares
     We believe growth in ARPU would be driven by a price increase, selling higher
      duration premium packages, and up-gradation of existing lower duration
      packages (~20% of existing suppliers typically upgrade every year).
     The buyer traffic is coming from Tier 2-3 cities and only 35% of the traffic is
      from Tier-1 cities. Top-10 (Platinum customers) contribute ~41% of revenue.
     Margin expansion in 1HFY21 (+2,472bps YoY) was driven by cost optimisation
      and lower feet on street cost. Expenses would rise, in our view, as business
      volumes recover to pre-COVID levels and an EBITDA margin of ~35% (vs 48.7%         Amit Chandra
      in 1HFY21) is sustainable.                                                         amit.chandra@hdfcsec.com
Financial summary                                                                        +91-22-6171-7345
YE March (Rs bn)                       FY16       FY17    FY18    FY19    FY20    TTM
Net Sales                               2.46       3.18    4.11    5.07    6.39   6.51
EBITDA                                  -1.26     -0.54    0.47    0.82    1.69   2.49   Apurva Prasad
APAT                                    -1.24     -0.45    1.78    0.85    1.47   2.52   apurva.prasad@hdfcsec.com
Diluted EPS (Rs)                        NM         NM      20.2     7.6    50.2   87.3   +91-22-6171-7327
P/E (x)                                 NM         NM     249.1   661.8   100.2   57.7
EV / Revenue (x)                        58.6       45.2    34.6    27.3    21.4   20.7
EV / EBITDA (x)                         NM         NM     304.2   168.3    80.8   54.2   Vinesh Vala
RoE (%)                                 NM         NM      NM      NM      67.8   59.8   vinesh.vala@hdfcsec.com
Source: Company, HSIE Research, Consolidated Financials                                  +91-22-6171-7332

                                                                                                                      Page | 14
HSIE India Internet

Increasing trend of registered Buyers                                                                                                                   Buyer Traffic increasing on the platform
                                                      Registered buyers (Mn)                                                                                                                                     Total Traffic (mn)
  120                                                                                                                                        113         300
                                                                                                                                  107
  110                                                                                                                   102
                                                                                                              98
  100                                                                                                93                                                  250
                                                                                            88
   90                                                                              83
                                                                          78
   80                                                           72                                                                                       200
                                                      66
   70                                       60

                                                                                                                                                                                                                                                                                                            259
   60                            53                                                                                                                      150
                      48

                                                                                                                                                                                                                     198

                                                                                                                                                                                                                                                                     196

                                                                                                                                                                                                                                                                                                 191
          43

                                                                                                                                                                                                                                                                               188
   50

                                                                                                                                                                                                                                                          184
                                                                                                                                                                                                            181

                                                                                                                                                                                                                                                                                        180
                                                                                                                                                                                                                                173
                                                                                                                                                                                                   172

                                                                                                                                                                                                                                             171
                                                                                                                                                                                         140
                                                                                                                                                         100

                                                                                                                                                                              135
   40

                                                                                                                                                                 106
   30
   20                                                                                                                                                     50

                                                                                                                                                                                         Q3FY18
                                                                                                                                                                                                   Q4FY18
                                                                                                                                                                                                            Q1FY19
                                                                                                                                                                                                                     Q2FY19
                                                                                                                                                                                                                                Q3FY19
                                                                                                                                                                                                                                             Q4FY19
                                                                                                                                                                                                                                                          Q1FY20
                                                                                                                                                                                                                                                                     Q2FY20
                                                                                                                                                                                                                                                                               Q3FY20
                                                                                                                                                                                                                                                                                        Q4FY20
                                                                                                                                                                                                                                                                                                 Q1FY21
                                                                                                                                                                                                                                                                                                            Q2FY21
                                                                                                                                                                 Q1FY18
                                                                                                                                                                              Q2FY18
          Q1FY18
                      Q2FY18
                                 Q3FY18
                                            Q4FY18
                                                      Q1FY19
                                                                Q2FY19
                                                                          Q3FY19
                                                                                   Q4FY19
                                                                                            Q1FY20
                                                                                                     Q2FY20
                                                                                                               Q3FY20
                                                                                                                         Q4FY20
                                                                                                                                    Q1FY21
                                                                                                                                               Q2FY21
Source: COMPANY, HSIE Research                                                                                                                          Source: Company, HSIE Research

Paying suppliers returning to the pre-COVID level                                                                                                       ARPU stable during the pandemic
                                      Paying subscription suppliers (mn)                                                                                50,000

                                                                                                                                                                                                                                                                                                                45,809
                                                                                                                                                                                                                                                                                                   45,452
                                                                                                                                                                                                                                                                              45,330

                                                                                                                                                                                                                                                                                        44,961
                                                                                                                                                                                                                                                                   44,608
                                                                                                                                                                                                                                                      43,565
  0.14

                                                                                                                                                                                                                       42,309
                                                                                                                                                        46,000

                                                                                                                                                                                                                                    41,701
  0.12

                                                                                                                                                                                                            40,204
                                                                                                                                                                                                  39,443
  0.10                                                                                                                                                  42,000
  0.08                                                                                                                                                                                 37,246
                                                                                                                        0.15
                                                                                                              0.14

                                                                                                                                             0.14
                                                                                                     0.14
                                                                                            0.13

                                                                                                                                  0.13
                                                                                   0.13
                                                                          0.12

                                                                                                                                                        38,000
                                                                 0.12
                                                       0.11

  0.06
                                   0.11
                        0.11

                                             0.11
             0.11

                                                                                                                                                                          32,140

  0.04
                                                                                                                                                        34,000
  0.02
  0.00                                                                                                                                                  30,000
                                                                                                                                                                                                  Q1FY19

                                                                                                                                                                                                            Q2FY19

                                                                                                                                                                                                                       Q3FY19

                                                                                                                                                                                                                                    Q4FY19

                                                                                                                                                                                                                                                      Q1FY20

                                                                                                                                                                                                                                                                   Q2FY20

                                                                                                                                                                                                                                                                              Q3FY20

                                                                                                                                                                                                                                                                                        Q4FY20

                                                                                                                                                                                                                                                                                                   Q1FY21

                                                                                                                                                                                                                                                                                                                Q2FY21
                                                                                                                                                                          FY17

                                                                                                                                                                                       FY18
             Q1FY18
                        Q2FY18
                                   Q3FY18
                                             Q4FY18
                                                       Q1FY19
                                                                 Q2FY19
                                                                          Q3FY19

                                                                                            Q1FY20
                                                                                                     Q2FY20
                                                                                                              Q3FY20
                                                                                                                        Q4FY20
                                                                                                                                  Q1FY21
                                                                                   Q4FY19

                                                                                                                                             Q2FY21

Source: Company, HSIE Research                                                                                                                          Source: Company, HSIE Research

Total revenue trend                                                                                                                                     EBITDA margin (%) trend
                   Total Revenue (Rs Mn)                                                    Growth (YoY %) - RHS                                                                                               EBITDA Margin (%)
                                                                                                                                                           50
                                                                                                                                                                                                                                                                                                 38.2
  7,000                                                                                                                                          35        40
                       29.3                          29.2                                                                                                                                                                                                                     26.4
                                                                                                                                                           30
  6,000                                                                                                                                          30                                                                                               16.2
                                                                                                 25.9                                                      20                                                          11.4
                                                                          23.6                                                                             10
  5,000                                                                                                                                          25
                                                                                                                                                            0
  4,000                                                                                                                                          20       -10
                                                                                                6,389                   6,513
                                                                                                                                                          -20
  3,000                                                                   5,074                                                                  15                                               -17.1
                                                                                                                                                          -30
                                                 4,105
                      3,178                                                                                                                               -40
  2,000                                                                                                                   13.2                   10
                                                                                                                                                          -50
                                                                                                                                                                          -51.1
  1,000                                                                                                                                          5        -60
                      FY17                       FY18                     FY19                  FY20                    TTM                                               FY16                    FY17                FY18                       FY19                         FY20               TTM

Source: Company, HSIE Research                                                                                                                          Source: Company, HSIE Research

                                                                                                                                                                                                                                                                                                 Page | 15
HSIE India Internet

Affle (India)                                                                                                             Not Rated
Affle (India) Ltd is an advertising technology company operating in the fast-                       CMP (as on 16 Dec 2020)               Rs 4,026
growing digital advertising industry. Mobile/Digital advertising spend is growing
                                                                                                    Target Price                              NA
at a CAGR of 33/29%. Affle has an ROI-driven customer-centric business model,
and revenue has grown at a CAGR of 48% over FY18-20. Affle gets cost per                            NIFTY                                   13,683
converted user (CPCU) of Rs 40 for every converted user (72mn in FY20).
Converted users/CPCU eight-quarter CQGR has been +10.2/-0.1%. Affle has two
business segments, Consumer Platform (98.3% in H1FY21) and Enterprise                               KEY STOCK DATA
Platform (1.7% in H1FY21). The company generates 90% revenue from emerging                          Bloomberg code                     AFFLE IN
markets (India, Indonesia, Vietnam and Malaysia), with India alone contributing
                                                                                                    No. of Shares (mn)                          25
~50% of revenue. Affle generates 90% of revenue from the Top-10 verticals (e-
                                                                                                    MCap (Rs bn) / ($ mn)                 103/1,395
commerce, Ed-tech, Food-Tech, FMCG, Gaming, Entertainment, Health-Tech, Fin-
Tech, and Groceries).                                                                               6m avg traded value (Rs mn)                243

Key takeaways:                                                                                      52 Week high / low              Rs 4,072/899

 There are ~600mn connected devices, but only 20% are online shoppers. The
    target user base for Affle is ~120mn devices, where the probability for the                     STOCK PERFORMANCE (%)
    conversion is high. Affle's predictive algorithm works to predict the next 100mn                                        3M      6M        12M
    potential shoppers and target them with ads based on user preference.
                                                                                                    Absolute (%)           33.5 172.0         178.9
     The moat of Affle's platform is (1) ROI driven CPCU based business model
                                                                                                    Relative (%)           14.8 133.2         164.9
      where the advertiser pays only on conversions, (2) data filtering and enhancing
      technology which predicts future users and drives conversions, (3) fraud
                                                                                                    SHAREHOLDING PATTERN (%)
      detection M-FaaS platform which prevents digital ad fraud and (4) excellent
      preparation to handle data privacy laws, with data servers located in Singapore,                                       Jun-20         Sep-20
      India and the US and accredited by Singapore Government (SG:D).                               Promoters                 68.38          68.38
     The pandemic has led to higher screen time (~8 hours), an increase in mobile                  FIs & Local MFs           10.95          10.32
      activity, and more app downloads. The average time spent on mobile devices
                                                                                                    FPIs                        7.59           8.37
      has increased significantly. It has led to higher conversions with ad-spends on
      mobile advertising platforms also increasing significantly.                                   Public & Others           13.08          12.93

     Higher conversions will drive growth; CPCU should remain around Rs 40.                        Pledged Shares              0.00           0.00
      CPCU increase will be driven by higher international revenue, where                           Source : BSE
      conversion ratio and pricing are higher than in the domestic market.                          Pledged shares as % of total shares
     Google and Facebook are not direct competitors. Around 33% of the digital
      advertising budget is allocated to large players like Google/Facebook, ~33%
      goes with other network/web applications, and the remaining is allocated to
      players like Affle, InMobi, etc.
     Affle acquired Vizury, Shoffr, RevX, Appnext, and MediaSmart in the past two
      years to enhance the capabilities of the platform. It intends to keep up the
      acquisition strategy and invest in upcoming areas such as Connected
      Devices/TVs. Appnext and Mediasmart are doing well and should reach a 20%                     Amit Chandra
      PAT level in the next 1-2 years.                                                              amit.chandra@hdfcsec.com
                                                                                                    +91-22-6171-7345
Financial summary
YE March (Rs bn)                            FY18*            FY19            FY20           TTM
Net Sales                                    1.67             2.49            3.34           3.99
EBITDA                                       0.46             0.70            0.88           1.04   Apurva Prasad
APAT                                         0.28             0.49            0.66           0.82   apurva.prasad@hdfcsec.com
Diluted EPS (Rs)                             11.4             20.1            26.1           32.3   +91-22-6171-7327
P/E (x)                                     354.0            200.3           154.1          124.6
EV / Revenue (x)                             58.4             39.1            30.0           25.8
EV / EBITDA (x)                             214.5            138.8           113.8           98.6   Vinesh Vala
RoE (%)                                      94.6             67.4            62.3           30.3   vinesh.vala@hdfcsec.com
Source: Company, HSIE Research, Consolidated Financials, *Unaudited Proforma Combined financial     +91-22-6171-7332

                                                                                                                                 Page | 16
HSIE India Internet

High growth in converted users                                                                                  Average CPCU in a narrow range
                                              Converted users (mn)
                                                                                                                                                       Average CPCU (Rs)
 30.0                                                                                                 28.1
                                                                                                                42.0
 25.0                                                                                                                                                             41.3
                                                                      20.9                                                                              41.2                 41.1
                                                           18.5                                                                    41.0                                                            41.0
 20.0                 16.4                     16.6                                         17.0                41.0
                                                                                 16.3
                                                                                                                       40.6
 15.0     12.9                    13.4
                                                                                                                                                                                                             40.3
                                                                                                                                             40.0                                        40.1
 10.0
                                                                                                                40.0
  5.0

  0.0
                                                                                                                39.0
           Q2FY19

                       Q3FY19

                                   Q4FY19

                                                Q1FY20

                                                            Q2FY20

                                                                       Q3FY20

                                                                                  Q4FY20

                                                                                             Q1FY21

                                                                                                       Q2FY21

                                                                                                                        Q2FY19

                                                                                                                                    Q3FY19

                                                                                                                                              Q4FY19

                                                                                                                                                         Q1FY20

                                                                                                                                                                    Q2FY20

                                                                                                                                                                              Q3FY20

                                                                                                                                                                                          Q4FY20

                                                                                                                                                                                                    Q1FY21

                                                                                                                                                                                                              Q2FY21
Source: COMPANY, HSIE Research                                                                                  Source: Company, HSIE Research

Improvement in CPCU revenue                                                                                     as well as Enterprise Platform revenue
                                       CPCU Revenue (Rs. mn)                                                                            Enterprise Platform Revenue (Rs mn)
 1,200                                                                                                1,132     250
                                                                                                                                                                                                             218
 1,100                                                                                                                                                                                             201
 1,000                                                                                                          200
                                                                      859
   900
                                                           764                                                                                                                           147
   800                                                                                      697                 150
                       672                      684                              654
   700
   600     524                     536                                                                          100    80                                           83       86
                                                                                                                                   69        69         62
   500
   400                                                                                                           50
   300
   200                                                                                                            0
             Q2FY19

                         Q3FY19

                                                  Q1FY20

                                                             Q2FY20

                                                                        Q3FY20

                                                                                   Q4FY20

                                                                                             Q1FY21

                                                                                                       Q2FY21
                                     Q4FY19

                                                                                                                        Q2FY19

                                                                                                                                    Q3FY19

                                                                                                                                              Q4FY19

                                                                                                                                                         Q1FY20

                                                                                                                                                                    Q2FY20

                                                                                                                                                                              Q3FY20

                                                                                                                                                                                          Q4FY20

                                                                                                                                                                                                    Q1FY21

                                                                                                                                                                                                              Q2FY21
Source: Company, HSIE Research                                                                                  Source: Company, HSIE Research

Total Revenue trend                                                                                             EBITDA margin (%) trend
  4,500                                                                                                          29
                                                                                              3,993
  4,000
                                                                                                                                                             28.2
                                                                                                                 28
  3,500                                                                3,338

  3,000                                                                                                                             27.2
                                                2,494                                                            27
  2,500
                                                                                                                                                                                       26.3
  2,000                                                                                                                                                                                                      26.2
                      1,672                                                                                      26

  1,500

                                                                                                                 25
  1,000
                                                                                                                                 FY18                  FY19                  FY20                   TTM
                      FY18                      FY19                   FY20                   TTM

Source: Company, HSIE Research                                                                                  Source: Company, HSIE Research

                                                                                                                                                                                                         Page | 17
HSIE India Internet

Matrimony.com                                                                                                   Not Rated
Matrimony.com Ltd is India's largest matchmaking service provider with a
                                                                                           CMP (as on 16 Dec 2020)             Rs 841
dominant market share in the south region. Matchmaking services account for
99% of its revenue, while Marriage services account for just 1% of it. Matrimony           Target Price                            NA
has a subscription-based business model and 0.7mn paid subscribers. The                    NIFTY                               13,683
company offers 3,6 and 12 months subscription packages with the average
transaction value of Rs 5,150/subscriber.
                                                                                           KEY STOCK DATA
Key takeaways:
                                                                                           Bloomberg code                MATRIM IN
     Matrimony has a flexible subscription-based revenue model and offers
                                                                                           No. of Shares (mn)                       23
      differentiated pricing for different segments. Paid subscribers have registered
      healthy growth (+23% YoY) and are now above pre-COVID levels.                        MCap (Rs bn) / ($ mn)                 19/260

     The platform has a total of 5mn active profiles, but revenue is generated from       6m avg traded value (Rs mn)              36

      14% of the profiles. The primary focus is to convert the free profile to paid        52 Week high / low               Rs 917/250
      subscribers. For this purpose, the company has a dedicated team of 1,500
      associates who drive conversions through AI and data analytics tools.                STOCK PERFORMANCE (%)

     Matrimony also operates through 130 retail outlets, which contribute ~10% of                                 3M     6M      12M
      revenue. The purpose of the offline model is to support parents and drive paid       Absolute (%)         37.3 145.6         80.4
      subscriptions. The company operates 300 community sites, with 15% of revenue
                                                                                           Relative (%)         18.6 106.7         66.4
      coming from Elite and assisted Matrimony.
     Matchmaking billing is expected to grow in double digits while Marriage              SHAREHOLDING PATTERN (%)
      Services growth would remain muted. The loss in Marriage Services is expected
                                                                                                                   Jun-20      Sep-20
      to normalise in 2HFY21 (loss of Rs 100mn in FY21), in our view.
                                                                                           Promoters                50.43         50.43
     The average subscription price is Rs 4,000+ for three months. Typically, a profile
                                                                                           FIs & Local MFs           5.06          7.76
      remains active for at least nine months, and profiles created by parents and
      women have a higher conversion ratio. Pricing is different for the north and         FPIs                     25.19         22.09
      south markets and slightly higher than the competition.                              Public & Others          19.32         19.72

     The competitive intensity has increased in the near term. Matrimony has also         Pledged Shares            0.00          0.00
      stepped up marketing spend (+33% YoY) to increase market share in the north          Source : BSE
      market and maintain a dominant position in the south market.
                                                                                           Pledged shares as % of total shares
     There is no risk from the rise of dating websites/apps as ~80% of the marriages
      in India are arranged, and only 6% take place through matchmaking websites.
     The company wants to expand in the international markets and has planned to
      set up Sri Lankan Matrimony.

Financial summary
YE March (Rs bn)          FY15        FY16       FY17     FY18   FY19    FY20     TTM      Amit Chandra
Net Sales                  2.41        2.55       2.93    3.35   3.48     3.72     3.64    amit.chandra@hdfcsec.com
EBITDA                     0.18        0.07       0.59    0.78   0.74     0.54     0.56    +91-22-6171-7345
APAT                       0.13      (0.01)       0.48    0.61   0.42     0.30     0.32
Diluted EPS (Rs)            5.8        -0.6       21.2    26.9   18.7     13.0     14.0
P/E (x)                   145.3        NM         39.7    31.3   45.0     64.8     60.0    Apurva Prasad
EV / Revenue (x)            7.8         7.5        6.5     5.2    4.9      4.5      4.8    apurva.prasad@hdfcsec.com
EV / EBITDA (x)           103.1       286.9       32.1    22.5   23.0     30.8     31.5
                                                                                           +91-22-6171-7327
RoE (%)                    NM          NM         NM      37.2   23.2     13.7     13.4
Source: Company, HSIE Research, Consolidated Financials
                                                                                           Vinesh Vala
                                                                                           vinesh.vala@hdfcsec.com
                                                                                           +91-22-6171-7332

                                                                                                                        Page | 18
HSIE India Internet

Increasing traction in Matchmaking billing                                                                                                                  Lower billing in Marriage services
                                              Matchmaking Billing (Rs mn)                                                                                                                 Marriage services Billing (Rs Mn)

  1000                                                                                                                                                        50                                                  46
                                                                                                                                             962
                                                                                                                    947                                       45                                         40
  950
                                                            908                                                                                               40
                                                                                                     895                                                            33                                                            34
                                                                        877                                                                                   35                           32
  900
          860                                                                                                                                                 30              26
                                                                                         847                                                                                                                                               24
  850                     835
                                           823                                                                                                                25
                                                                                                                                812
                                                                                                                                                              20                                                                                     16
  800
                                                                                                                                                              15
  750                                                                                                                                                         10                                                                                                              5
                                                                                                                                                                                                                                                                   4
                                                                                                                                                               5
  700                                                                                                                                                          0
                             Q2FY19

                                                  Q3FY19

                                                                          Q1FY20

                                                                                          Q2FY20

                                                                                                           Q3FY20

                                                                                                                      Q4FY20

                                                                                                                                 Q1FY21

                                                                                                                                              Q2FY21
            Q1FY19

                                                              Q4FY19

                                                                                                                                                                     Q1FY19

                                                                                                                                                                               Q2FY19

                                                                                                                                                                                               Q3FY19

                                                                                                                                                                                                         Q4FY19

                                                                                                                                                                                                                  Q1FY20

                                                                                                                                                                                                                                  Q2FY20

                                                                                                                                                                                                                                            Q3FY20

                                                                                                                                                                                                                                                      Q4FY20

                                                                                                                                                                                                                                                                   Q1FY21

                                                                                                                                                                                                                                                                              Q2FY21
Source: Company, HSIE Research                                                                                                                              Source: Company, HSIE Research

Matchmaking EBITDA margin trend                                                                                                                             Digital adoption led to improved paid subscriptions
                                            Matchmaking EBITDA Margin (%)                                                                                                                           Paid Subscriptions (in Mn)
  38     37.0                                                                                                                                                0.25
  36
                      33.1                                                                                                                                                                                                                                                   0.21
  34
  32                                                                                                                                                         0.20   0.19
                                                                                                                                                                              0.18                      0.18 0.18                                    0.18
  30                                                                                                                                                                                      0.17                                0.17 0.17                           0.17
                                      26.8
  28                                                                   26.4
                                                                                                                                25.1
  26                                                                                 23.9                                                                    0.15
                                                           23.4                                                                              23.7
  24                                                                                                                21.9
                                                                                                    21.2
  22
  20                                                                                                                                                         0.10
                                                                                                                                                                     Q1FY19

                                                                                                                                                                               Q2FY19

                                                                                                                                                                                               Q3FY19

                                                                                                                                                                                                         Q4FY19

                                                                                                                                                                                                                  Q1FY20

                                                                                                                                                                                                                                  Q2FY20

                                                                                                                                                                                                                                            Q3FY20

                                                                                                                                                                                                                                                      Q4FY20

                                                                                                                                                                                                                                                                   Q1FY21

                                                                                                                                                                                                                                                                              Q2FY21
         Q1FY19

                          Q2FY19

                                           Q3FY19

                                                            Q4FY19

                                                                        Q1FY20

                                                                                         Q2FY20

                                                                                                         Q3FY20

                                                                                                                                 Q1FY21

                                                                                                                                              Q2FY21
                                                                                                                     Q4FY20

Source: Company, HSIE Research                                                                                                                              Source: Company, HSIE Research

Total Revenue trend                                                                                                                                         EBITDA margin (%) trend
                  Total Revenue (Rs Mn)                                                            Growth (YoY %) - RHS
                                                                                                                                                              25                                                      23.1
                  17.5

 4,000                                                                                                                                                 20                                                                                  21.3
                                                                                                                                                                                                        20.2
                                                                                                                                                       18     20
                                                                                 14.6
                                                           14.9

 3,500                                                                                                                                                 16                                                                                                                   15.3
                                                                                                                                                       14                                                                                                14.7
 3,000                                                                                                                                                        15
                                                                                                                                                       12
 2,500                                                                                                                                                 10
                                                                                                                    6.7 3,718

                                                                                                                                     3,642
                                                                                                   3,484
                                      2,548 5.6

                                                                                 3,354

                                                                                                                                                              10       7.6
                                                                                                                                                       8
                                                             2,928

 2,000                                                                                                                                                 6
                  2,414

                                                                                                                                                       4       5                        2.6
                                                                                                                                    1.4

 1,500
                                                                                                   3.9

                                                                                                                                                       2
 1,000                                                                                                                                                 0       0
                                                                                                                                     TTM
                  FY15

                                       FY16

                                                             FY17

                                                                                 FY18

                                                                                                   FY19

                                                                                                                     FY20

                                                                                                                                                                                                                                                                             TTM
                                                                                                                                                                       FY15

                                                                                                                                                                                        FY16

                                                                                                                                                                                                         FY17

                                                                                                                                                                                                                           FY18

                                                                                                                                                                                                                                           FY19

                                                                                                                                                                                                                                                           FY20

Source: Company, HSIE Research                                                                                                                              Source: Company, HSIE Research

                                                                                                                                                                                                                                                                       Page | 19
HSIE India Internet

Amazon Pay, ‘Payments as an adjacency’
We hosted Amazon Pay represented by Amit Kurseja, Head - Merchant                                      MD & CEO
Acceptance Products at our Internet conference. Captured below are some of the
                                                                                                       Mahendra Nerurkar
key messages:
TAM and industry drivers:
 Amazon Pay is targeting the online commerce merchant ecosystem adjacent to                           Company Description
   the parent entity business.                                                                         Amazon Pay is an online
 On the back of the COVID-induced no-contact customer purchase journey, the                           payment processing platorm
   P2M payments universe has leapfrogged to ~Rs 7trn (FY20: Rs 4trn) and is                            owned by Amazon. It uses
   expected to grow at 50% CAGR over the next five years.                                              consumer base of Amazon.com
                                                                                                       providing customer the option
Unit economics and financials:                                                                         to pay on external merchant
 CoD vs. digital payments quantified: The CoD mode of payment, although                               websites.
    convenient historically, carries an economic cost, which is 3-4x higher due to
    high-probability of returns and no-shows. Amazon has a sub-50% mix of CoD
    payments in its e-commerce business, lower than the industry average.                              Stats
   Standalone profitability: The economics of Amazon Pay is not assessed on a                         NA
    standalone basis, but as a part of the overall Amazon experience, given the
    significant synergies it drives in the customer purchase journey.
                                                                                                       Lead Investors
Business moat:                                                                                         Amazon
 Payment offerings for every customer segment: Amazon Pay offers a carefully-
    curated set of credit products (Wallet, Pay Later, Co-Branded Credit Card) to
    drive upselling on a neatly-segmented customer franchise.                                          Krishnan ASV
Read-across for banks and NBFCs:                                                                       venkata.krishnan@hdfcsec.com
 Amazon Pay ICICIBC CBCC: The Amazon Pay-ICICI Bank co-branded credit                                 +91-22-6171-7330
    card is the fastest-to-a-million and emerged as one of the most successful CBCC
                                                                                                       Aakash Dattani
    tie-ups, in terms of time to scale. In the near term, Amazon Pay is not looking to
                                                                                                       aakash.dattani@hdfcsec.com
    cannibalise this arrangement. Further, it expects a majority of the profits from
    the partnership to be realised over 6-10 years.                                                    +91-22-6171-7337

   Tie-ups with lenders: In addition to ICICIBC, Amazon Pay has tied up with                          Punit Bahlani
    Capital Float and KVB to offer credit to select customers. It is likely to stay away               punit.bahlani@hdfcsec.com
    from on-balance sheet lending.                                                                     +91-22-6171-7354

Total Addressable Market for Micro Merchants                  P2M UPI Transactions as % of total UPI transactions
                                                                           P2M Mkt Share Volume                       P2M Mkt Share Value
        Micro Merchants in India   POS Machines available
                                                                 50%
                     4.8 Mn                                      45%                                                                       40%
                                                                 40%
                                                                 35%
                                                                 30%
                                                                 25%
                                                                                                                                           16%
                                                                 20%
                                                                 15%
                                                                 10%
                                                                  5%
                                                                  0%
                                                                                                                                  Oct-20
                                                                                                             Aug-20
                                                                         Apr-20

                                                                                                    Jul-20

                                                                                                                         Sep-20
                                                                                  May-20

                                     60 Mn
                                                                                           Jun-20

                                                                                                                                            Nov-20

Source: Company, HSIE Research                                Source: Company, HSIE Research

                                                                                                                                           Page | 20
HSIE India Internet

BoAt, 'Plug Into Nirvana'
We hosted boAt, represented by the co-founder Aman Gupta, at our Internet
                                                                                                                   Founders
conference and below are the key highlights:
TAM and industry drivers:                                                                                          1. Aman Gupta
                                                                                                                   2. Sameer Mehta
  India had
HSIE India Internet

CarDekho, 'Right Car, Right now'
We hosted CarDekho represented by Amit Jain, Co-founder & CEO at our internet
                                                                                       Founders
conference and below are the key highlights.
                                                                                       1. Amit Jain
TAM and industry drivers:                                                              2. Anurag Jain
  Car Dekho is amongst India's largest online car platform that receives 25mn hits
    a month. The website drives traffic through its presence across the automobile
    lifecycle including new cars, used cars as well as financing and insurance.        Company Description
Unit economics:                                                                        Founded in 2008, one of the
  Used car segment: As per the management, a customer sells his/her car after 4-5     largest auto classified portal in
    years of usage. CarDekho offers buy-sell of the vehicle, financing and some        India, operates leading auto sites
    value-added services.                                                              viz. Gaadi, ZigWheels,
  The company does not offer bargaining power to the customers. The price of          BikeDekho etc & Insurance site
    selling the used car is decided after several inspections. The management          InsuranceDekho, international
    expects to reach 1mn vehicles used car buy-sell in the next 3-5 years, assuming    presence in SEA.
    higher margins.
Business moat:
  CarDekho operates in 4 major segments: New auto (recently started), used cars,      Stats
    insurance & financial services. The major benefit from having such a diversified   Partnership with 4000+ auto
    business model is that the company is able to receive revenues in multiple         dealerships, 3000+ used car
    segments from a single customer.                                                   dealership, car loan
  CarDekho uses technology to facilitate the sale and purchase of new and used        disbursements of Rs 120cr per
    vehicles. The company generates 2x more leads compared to its next                 month , 4000+ monthly car
    competitor. The management believes that the content created by the company        inspections.
    and its AI differentiates it from others.
Financials:
  The company has reported 65% CAGR in revenues over FY12 – 20. Current               Lead Investors
    revenues are ~$60mn in FY20.                                                       Sequoia, Hillhouse, CapitalG,
  The management plans an IPO in the next few years.                                  HDFC Bank, Ping An
Read-across for Auto sector:
  The online channels now account for 90% of searches before customers
    purchase their vehicle. This will gradually lead to a change in the purchasing
    habits of consumers and will drive changes in the car ecosystem (dealers,
    financiers, used car network, etc).
  The auto sector demand is sustaining post the festive season. Due to the
    pandemic, the availability of second hand cars has reduced as consumers are
    utilising vehicles for personal mobility.
 CarDekho's revenue growth over the years
       $ mn
  70
                                                                          61
  60

  50

  40                                                              37
                                                                                       Aditya Makharia
  30                                                      23                           aditya.makharia@hdfcsec.com
  20                                              16                                   +91-22-6171-7316
                                          12
  10                              7
                   2        4
              1
   0                                                                                   Mansi Lall
          FY12    FY13    FY14   FY15    FY16    FY17    FY18    FY19    FY20          mansi.lall@hdfcsec.com
Source: Company, HSIE Research                                                         +91-22-6171-7357

                                                                                                             Page | 22
HSIE India Internet

Grofers, 'Hitting its stride!'
We hosted Grofers represented by Manas Gupta and Keshav Gupta, (M&A,                      Founders
Strategy and IR team) at our Internet conference and below are the key highlights.
                                                                                          1. Albinder Singh Dhindsa
TAM and industry drivers:
                                                                                          2. Saurabh Kumar
  India is a USD600bn grocery market with USD25 and lower CAC makes unit economics far more
     palatable for e-grocers and has made penetration sustainable                         Jay Gandhi
  Online selection is improving and Grofers too, has cautiously improved upon            jay.gandhi@hdfcsec.com
     its selection without impacting inventory management (now offers 3000 SKUs),         +91-22-6171-7320
     which in turn helped it recruit more customers for sampling during the
     pandemic.
 Grofers' customer mix across income groups                     Related market share among Grocers
                            Customer mix (%)
                                                                                                   Others, 9.3
                                                                                    Grofers, 2.6
  90
  80                                                                              Big Basket,                          Reliance
  70                                                                                  4.1                             (Grocery),
  60                                                                                                                     32.1
                                                                                Walmart,
  50                                                                              4.1
  40
  30                                                                          ABRL, 4.2
  20
  10
                                                                                  Metro, 6.7
   0
                 251-1000

                                                                   >20000
                              1001-2000

                                          2001-5000
         0-250

                                                      5001-20000

                                                                                                                  Avenue
                                                                                           FRL, 13.8             Supermart,
                                                                                                                    23.1

Source: Company, HSIE Research                                              Source: Company, HSIE Research

                                                                                                                       Page | 23
HSIE India Internet

Paytm Money, 'Wealth management for the
masses’                                                                                    Founders
We hosted Paytm Money, represented by its CEO Varun Sridhar, at our Internet               1. Vijay Shekhar
conference and below are the key highlights.                                               Sharma
TAM and industry drivers:
 By FY25, workforce earning > US$ 10K is expected to grow > 2x from the current
   pool of ~30-40mn. Additionally, increased income should lead to greater market          Company Description
   participation. We expect total broking accounts to grow to ~80mn by FY25E               SEBI registered IA offering
   from the current ~45mn (Aug-20) and the total number of unique mutual fund              direct investing in MF schemes,
   individual investors to double to ~50mn.                                                largest provider of digital gold,
Unit economics:                                                                            runs a low cost equity broking
 Paytm Money's broking business is at a very nascent stage and, since the                 platform.
    company is in a highly competitive industry, it currently does not disclose
    metrics such as customer acquisition costs (CAC), ARPU etc. Paytm Money
    charges Rs 10/order for all intraday cash and F&O trades whereas equity                Stats
    delivery trades are free.                                                              Active clients at 26k, ~5mt
Business moat:                                                                             digital gold sold in FY20, direct
 PayTM Money's moats are its industry lowest pricing and distribution reach of            MF investors – 6.75mn
    parent PayTM. The company intends to build a robust platform which it
    believes would be its key differentiating factor.
Financials:                                                                                Lead Investors
 The company has not disclosed its financials and is currently not profitable as it       Softbank, Ant Financial, AGH
    is in the investment phase.                                                            Holdings, SAIF Partners,
Read-across for the sector:                                                                Berkshire Hathaway, Discovery
 Broking industry is undergoing a structural shift with (1) bank-owned brokers            Capital
    (not all) offering discounted brokerage charges, which could further intensify
    competition, (2) regulatory changes resulting in low leverage to negatively
    impact volumes.
 Aadhar-based paperless account opening along with internet penetration
    would drive broking new account opening growth in tier 2-4 cities.
 AMC space expects strong and innovative products in passive funds category
    to compress yields further.
Other key takeaways:
 Philosophy: The company believes that there are principally four types of
    investors:
    1) Fresh to market: Offerings to include localisation, teaching, simplicity,
    guidance. 2) Amateur: 70% of this category is losing money despite a high
    activity ratio. Offerings to include education, guidance and investing tools. 3)
    Advanced: This category is using derivatives and actively manages money but is
    still losing money and could drop out. PayTM Money aspires to provide tools
    and education. 4) Advanced traders: The company plans to provide this class
    with HFT facilities. It believes that this business is still a lot focused on
    institutional profitability rather than investor profitability. The company believes
    that wealth management is under-penetrated and believes that the industry
    would see a high degree of growth.
   Technology: PayTM money believes it can use technology to give the individual
    attention, advise and training that a client needs to become a successful investor.    Madhukar Ladha, CFA
    Using AI and by developing machine learning, the company intends to achieve            madhukar.ladha@hdfcsec.com
    the same. Through technology, the company aims at (1) personalising trades to          +91-22-6171-7323
    match customers risk appetite, (2) helping traders improve behavioural
    aspects, and (3) educating investors.                                                  Sahej Mittal
   Shift from MF to equity: PayTM Money believes that 70% of the investment in            sahej.mittal@hdfcsec.com
    direct equity is new, while only 30% is from the redemption of MFs.                    +91-22-6171-7325

                                                                                                                 Page | 24
HSIE India Internet

Pepperfry, 'Happy Furniture to You'
We hosted Pepperfry, represented by Chief Financial Officer Neelesh Talathi at
                                                                                                                 Founders
our Internet conference and below are the key highlights.
TAM and industry drivers:                                                                                        1. Ambareesh Murty
  The furniture market in India is pegged at USD20bn (online market: USD1.2bn).                                 2. Ashish Shah
     70-80% of consumer demand continues to be catered by local retailers.
  Pepperfry (founded in 2011) has become a force to reckon with in the online
                                                                                                                 Company Description
     furniture market with a 25% market share.
                                                                                                                 Omnichannel furniture and
  Like for other categories, the pandemic has expedited the shift from offline to
                                                                                                                 home products marketplace.
     online furniture purchase and improved unit economics.
Business moat:
  What works for pepperfry is its ability to work with small manufacturers,                                     Stats
     develop strong private labels, its supply chain efficiencies (variable logistics
                                                                                                                 9 private labels, 8mn+ registered
     cost in low-single-digit) and increasing omnichannel. These COGS increasingly
                                                                                                                 users, 60 experience studios pan-
     feed into better competitiveness and better unit economics with scale in this
                                                                                                                 India, 3 warehouses, 21
     high AoV (USD110), high GM (55%+) category.
                                                                                                                 distribution centres, 58%
  The company retails seven private labels, which account for 50% of the
                                                                                                                 transactions from repeat buyers
     business.
  The company has 60 Studio pepperfry stores (COCO: 40, Franchisees: 20) and
     intends to expand to ~100 franchisee stores over the next 2-3 years.
                                                                                                                 Lead Investors
Financials:
                                                                                                                 Goldman Sachs, Norwest,
  Pepperfry's reported revenue of Rs. ~2bn (FY19) with 86% of business coming
                                                                                                                 Bertelsmann, Pidilite, State
     from furniture.
                                                                                                                 Street Global Advisors
  COVID19 performance: April was a washout with business resuming only in
     May-20. By Aug-20, pepperfry touched pre-COVID levels in sales. During the
     pandemic, it witnessed a 30-35% jump in first-time buyers, and the lion's share
     came from Tier 2/3 cities.
  Since, the pandemic, customer acquisition costs (CAC) have significantly come
     off (organic: inorganic traffic: 80:20 vs Pre-COVID level of 65:35) and 60% of
     sales come from repeat customers.
  The company, as a consequence of higher AoV and lower CAC, has managed to
     reduce losses significantly (cash burn in Aug-20 is a mere 10% of Aug-19
     losses). It intends to break even at EBITDA level by exit FY21.
  It remains confident on the Studio pepperfry business. 25% of the business
     comes from these stores. Conversion rates at the Studios are 70%+, AoVs and
     repeat orders are 2.8/1.8x of a pure online transaction.
                                                                                                                 Jay Gandhi
Read-across for the furniture sector:
                                                                                                                 jay.gandhi@hdfcsec.com
     Given the high AoV, High GM category, a well-capitalised outfit such as
                                                                                                                 +91-22-6171-7320
      Reliance Retail (via Urban Ladder) could undercut fringe operators over the
      medium-to-long term and still be reasonably profitable.
Indian furniture market (USDbn)                                               Online furniture market trend
                             Organised          Unorganised                       (USD mn)
    (USD bn)
     30                                                                            800
                                                                                   700
     25
                                                                                   600
     20                                                                            500
                                                                      22           400
     15
                                                                                                                                     700
                                                              17                   300
     10                                  14        14.5
                                 12                                                200
      5    9.5        11                                                                                                 310
                                                                      6            100                   200
           0.5                                     2.5        3                            104
      0                                                                              0
                                                              CY20E

                                                                      CY23E

                                                                                                                                      CY20E
               CY15

                      CY16

                                  CY17

                                         CY18

                                                    CY19

                                                                                             CY17

                                                                                                          CY18

                                                                                                                          CY19

Source: Company, HSIE Research                                                Source: Company, HSIE Research

                                                                                                                                        Page | 25
HSIE India Internet

PharmEasy, 'Health meets a new space'
We hosted PharmEasy, represented by Head Strategy and IR Akarsh Bharadwaj at                     Founders
our Internet conference and below are the key highlights.                                        1. Dharmil Sheth
TAM and industry drivers:                                                                        2. Dhaval Shah
 The out-patient market in India is divided into: (a) pharma (USD20bn); (b)                     3. Siddharth Shah
   diagnostics (USD8bn); (c) consultation (USD2-3bn). Epharmacy business has                     4. Harsh Parekh
   penetration levels of 3% today, which are expected to increase to 7-8% in FY25                5. Hardik Dedhia
   and to 10-12% by FY30. The epharmacy GMV is expected to grow at 35%
   CAGR from ~USD0.9bn in FY20 to ~USD4bn by FY25.                                               Company Description
                                                                                                 PharmEasy is India’s largest e-
   Growth drivers – increasing pharma demand, chronic conditions, digital access
                                                                                                 pharmacy offering services
    & higher adoption, consumer awareness and behavioural shifts.
                                                                                                 including online medicines,
Unit economics:                                                                                  healthcare products, doctor
 PharmEasy's B2B business (distribution) has an EBITDA margin of 4% whereas                     consultation, and lab tests. It
    B2C business (e-pharmacy) is three years away from breakeven.                                operates through a market place
                                                                                                 model.
Business moat:
 Presence across the supply and value chains, scale benefits – 60% market share
    among key players (Netmeds, 1mg, PharmEasy and Medlife).                                     Stats
                                                                                                 Connects 600+ pharma cos,
Financials:
                                                                                                 50,000+ retailers, 2500
  Revenue of Rs40bn (including Medlife) split equally between distribution and
                                                                                                 distributors, 22,000+ pin codes,
    e-pharmacy. Diagnostics business has a revenue of ~Rs1.5bn.
                                                                                                 serves 5mn families,
Read-across for Pharma and Diagnostics sector:                                                   1mn orders every month.
 Volume-linked discounts offered by pharma manufacturers and improved
    supply relationships with distributors has resulted in 500bps margin expansion               Lead Investors
    for PharmEasy in the last five years. However, given e-pharmacies account for
                                                                                                 Bessemer Venture Partners
    only 3% of the market, the impact on pharma manufacturers is limited today.
                                                                                                 Everstone, Eight Roads, LGT
    Even with their rising scale, we expect limited impact on pharma companies
                                                                                                 Lightstone Aspada, CDPQ,
    profitability, given that offline stores are likely to dominate the market in the
                                                                                                 Temasek
    forseeable future.
                                                                                                 Bansi Desai, CFA
   Diagnostics – PharmEasy is planning to invest significantly in the diagnostics
                                                                                                 bansi.desai@hdfcsec.com
    market (40% is unorganised). While currently it is in nascent stages, focusing
                                                                                                 +91-22-6171-7341
    only on basic blood-related tests (Rs 600-700 ticket size), it plans to set up its
    own labs starting with a few metros.
                                                                                                 Karan Vora
                                                                                                 karan.vora@hdfcsec.com
                                                                                                 +91-22-6171-7359

Healthcare spends to grow 2.5x in 5 years                        e-pharmacy to grow 4x in 5 years
                     India's Healthcare expenditure                                         India e-Pharma Market
    USD bn                                                           USD bn
                                                                     4
    400
                                                       353

                                                                     3
    300

                                                                     2                                                4.0
    200
               135
                                                                     1
    100                                                                           0.9
                                                                     0
     0                                                                           FY20                                FY25e
                                                                                                           ~8x
              FY20                                    FY25e              Household users (mn)     9                  70

Source: Company, HSIE Research                                   Source: Company, HSIE Research

                                                                                                                            Page | 26
HSIE India Internet

Other highlights:

   The pharma supply chain in India is highly fragmented with 80-85k
    distributors across the country, with the largest having only 2% market share.
    This compares unfavourably with most major economies in the world (~95% for
    the top 3 the in the US, ~60% for the top 7 in EU and ~30% for the top 3 in
    China). Besides being highly fragmented and unorganised, it faces issues of
    high inventory levels (~1.5x more than FMCG distributors), more expiries and
    meagre credits (5-7 days in India vs. 42-45 days in EU and US). PharmEasy
    identified and addressed this issue by acquiring distributors. Till date, it has
    made ~ 17 acquisitions (backed by PE capital).
   According to PharmEasy, the entry of Reliance/Amazon will expand the
    market; however, they are likely to adopt aggressive strategies which would
    impact PharmEasy's ability to gain market share. However, given that the
    online pharma market is 1/10th the size of FMCG’s, it will attract lesser capital.
    In the long run, the market will consolidate, resulting in a 2-3 players’ field.
   Pharma companies are increasingly willing to partner with online pharmacies
    as they provide solutions to (a) manage inventory and expiry/damage of goods;
    (b) offer a consumer platform for insights.
   Acute vs chronic: 60% of the business is from chronic orders – high AOV,
    better margins, planned orders.
   The online consultation market (USD2-3bn) is difficult to monetise in the
    medium term. The market in India is at a nascent stage where consumer
    behaviour is still evolving. Though this is an interesting space for long-term
    digital delivery of healthcare services, there are likely to be headwinds with
    changing consumer behaviour and extensive adoption over the next 3-4 years. It
    would be interesting to observe how the adoption evolves post the pandemic.
    In the developed economies, higher insurance penetration has driven online
    consultation market.
   Diagnostics – currently, it operates with two models: (a) act as an aggregator -
    low margins; (b) own labs - high margin business.
   Regulatory environment – Draft guidelines have been issued by the
    government, but there is no law governing the sector today. Switching
    prescription for unbranded generics/substitutes looks tricky in getting
    approved by regulatory bodies.
   Financials:
    o   Average discounting has reduced from 20-22% to 15-18% today.
    o   Gross margins are likely to improve, driven by (a) volume-linked discounts,
        led by larger scale; (b) higher contribution from private labels/OTC/generic
        business; (c) a higher proportion of diagnostics revenues.
    o   Fixed costs such as warehousing, delivery charges can further be optimised
        with a larger scale. Cost of delivery is 20% lower than food delivery at Rs25-
        30/per order.

                                                                                         Page | 27
HSIE India Internet

Pine Labs, 'Graduating beyond merchant payments’
We hosted Amrish Rau, CEO, Pine Labs, at our Internet conference to showcase
                                                                                                               Founders
the world view on the Indian payments landscape.
                                                                                                               1. Lokvir Kapoor
TAM and industry drivers:                                                                                      2. Rajul Garg
 Pine Labs is a market leader in the offline merchant acquiring business with a                               3. Tarun Upadhaya
   14% payments TPV market share.
     The Buy Now Pay Later (BNPL) option is beginning to take off as one of the                               Company Description
      largest addressable opportunities in India (USD 180bn by 2023).                                          A full-stack merchant commerce
                                                                                                               solution provider, focused on
Unit economics and financials:
                                                                                                               technology and financial
 Pine Labs' business model is built to monetise its entire throughput by way of                               solutions. Today, its offerings
    transaction charges (variable) and subscription fees (fixed). It has a higher mix                          include payments, affordability
    of large merchants (55-60% market share) relative to peers, as evidenced by its                            (PoS EMI), prepaid cards and
    high throughput-to-merchant ratio.                                                                         credit (Pine Labs Capital)
     Pine Labs exercises significant pricing power on the back of its tech-based                              amongst others.
      "white machine" resulting in high mix of subscription fees (65-70%).
                                                                                                               Stats
Business moat:
 Plug-and-play interoperability: Pine Labs' unique plug-and-play tech allows                                  ~USD 27bn throughput
    PoS interoperability across banks as against traditional PoS that are usually                              150k+ merchants
    custom-built for a single acquiring-bank. This results in lower switching costs
    and better convenience for the merchant.                                                                   Lead Investors
                                                                                                               Sequoia, Temasek, Actis,
     Market leader in offline merchant space: Pine Labs has been riding the BNPL
                                                                                                               Mastercard, Paypal, Flipkart,
      wave; as one of the only merchants to offer this option on in-store PoS, it has a
                                                                                                               Madison India Capital
      95% market share in the offline BNPL market.
                                                                                                               Darpin Shah
Read across for banks and NBFCs:
                                                                                                               darpin.shah@hdfcsec.com
 In-store Buy Now Pay Later (BNPL): In-store BNPL can become a singificant
                                                                                                               +91-22-6171-7328
    low-cost retail credit acquisition channel for banks.
     Credible alternative to "credit cards": BNPL, in many ways, poses a credible                             Aakash Dattani
      threat to credit cards due to better convenience and similar pricing. While                              aakash.dattani@hdfcsec.com
      pricing can be replicated across payment modes (debit or credit cards and Pay                            +91-22-6171-7337
      Later schemes), the addressable market is significantly larger in the case of
      wider adoption of debit card-EMIs.                                                                       Punit Bahlani
                                                                                                               punit.bahlani@hdfcsec.com
                                                                                                               +91-22-6171-7354

New terminal deployments rising                                                   P2M (offline) to lead digital payments growth
                     New Terminals Deployed                                                           P2M offline      P2M online
                     Markets in lockdown/ containment (RHS)                        1,400
 30,000                                                                    100%
                                                                                   1,200
 25,000                                                                    80%     1,000
 20,000
                                                                           60%       800
 15,000
                                                                           40%       600
 10,000
                                                                                     400
    5,000                                                                  20%
                                                                                     200
       0                                                                   0%
                                                                  Oct-20
                                                Aug-20
            Apr-20

                                       Jul-20

                                                         Sep-20
                     May-20

                              Jun-20

                                                                                       0
                                                                                                     CY18                      CY23E

Source: Company, HSIE Research                                                    Source: Company, HSIE Research, Note in USD bn

                                                                                                                                       Page | 28
You can also read