SHIFTING THE BALANCE - Diversity Arts Australia
←
→
Page content transcription
If your browser does not render page correctly, please read the page content below

BALANCE
SHIFTING THE
               SHIFTING THE
               BALANCE
               CULTURAL DIVERSITY IN

               LEADERSHIP WITHIN THE

               AUSTRALIAN ARTS, SCREEN

               AND CREATIVE SECTORS

                                         i
© Diversity Arts Australia, 2019
                                                  ISBN 978-0-6483901-1-4
                                                  Published: August 2019

                                                  For further information, contact:
                                                  Diversity Arts Australia
                                                  8 Victoria Road
                                                  Parramatta NSW 2150
                                                  Australia
Shifting the Balance: Cultural
Diversity in Leadership Within
                                                  info@diversityarts.org.au
the Australian Arts, Screen and
                                                  Tel: +612 8821 9169
Creative Sectors
                                                  diversityarts.org.au

Produced by Diversity Arts Australia with
BYP Group and Western Sydney University,
with funding from the Australian Commission
                                                  Diversity Arts Australia (DARTS) is
for UNESCO.
                                                  Australia’s key organisation promoting
                                                  cultural diversity across the creative
Diversity Arts Australia encourages the
                                                  sectors. DARTS works to build a creative
dissemination and sharing of information in
                                                  sector that reflects Australia’s true cultural
this report.
                                                  diversity and believes creative expression
                                                  is a fundamental human right, which
All materials presented in this report are
                                                  strengthens and connects communities.
licensed under the Creative Commons
Attribution 4.0 International Licence
                                                  DARTS creates the conditions for culturally
(creativecommons.org/licenses/by/4.0/
                                                  and linguistically diverse (CALD) people to
legalcode), with the exception of:
                                                  participate in all levels of the creative sector.

• Photographs and images
                                                  DARTS undertakes research and provides
                                                  evidence about the value of cultural

• Any logos, branding or trademarks where         diversity. It acts as a broker between artists,

 otherwise indicated.                             industry, educators and government, and
                                                  commissions content from CALD artists

You may copy, share and use this report,          that articulates key issues and showcases

provided you attribute © Diversity Arts           leading practices.

Australia and abide by the licence terms.

The Shifting the Balance report is supported      Acknowledgement of Country
by the Commonwealth through the Australian
                                                  Diversity Arts Australia acknowledges the
National Commission for UNESCO of the
                                                  traditional owners of Australia from over
Department of Foreign Affairs and Trade.
                                                  250 Indigenous nations. We pay respect to
                                                  the Elders past and present. Diversity Arts
How to cite
                                                  Australia’s national office is in Parramatta
Diversity Arts Australia, BYP Group and           on the traditional land of the Burramattagal
Western Sydney University. (2019). Shifting       of the Darug nation. We acknowledge that
the Balance: Cultural Diversity in Leadership     this land was never ceded.
Within the Australian Arts, Screen and Creative
Sectors, Sydney.

    ii                                                                                                Shifting the Balance
Without strong data we cannot set              The mission of Diversity Arts
benchmarks or concrete goals for               Australia is to advocate for an arts
the future. Diversity Arts Australia           sector that reflects the diversity
is pleased to present Australia’s              and vibrancy of the Australian
first ever research measuring the              community — something that is
representation of culturally and               implicit in the aim of most arts-
linguistically diverse leadership in           based organisations, both large and
major Australian arts and creative             small, that operate in Australia.
organisations. This groundbreaking             This research highlights the gap
research will provide essential                between the desire to achieve
data and evidence to the arts,                 this and the reality, with many
screen and creative sectors in their           culturally diverse artists feeling
endeavours to become inclusive                 excluded from the various arts
and representative of Australia’s              communities. This report gives us
cultural and linguistic diversity.”            the baseline data to take the first
                                               step in overcoming this sense of
                                               exclusion with the goal of being a
                                               more inclusive, robust and resilient
Lena Nahlous
Executive Director, Diversity Arts Australia
                                               arts community.”

                                               Professor James Arvanitakis
                                               Pro Vice-Chancellor (Research and Graduate
  This research is absolutely                  Studies), Western Sydney University and Chair,
essential if Australia is to move              Diversity Arts Australia

forward in addressing under-
representation of culturally and
linguistically diverse people in arts
leadership. I commend Diversity
Arts Australia for taking a critical
step in the right direction. Greater
diversity means richer, more
vibrant and meaningful arts and
cultural experiences and a shared
sense of belonging for everybody.”

Jackie Bailey
Principal, BYP Group

                                                                                                iii
CONTENTS
EXECUTIVE SUMMARY. . . . . . . . . . . . . . . . . . . . . . . . . . . . . .  1                         MOVING FORWARD. . . . . . . . . . . . . . . . . . . . . . . . . . . . . . . . . 26

    Key Findings . . . . . . . . . . . . . . . . . . . . . . . . . . . . . . . . . . . . . . . 2             4. Discussion and Recommendations . . . . . . . . . . . . . 26

    Recommendations . . . . . . . . . . . . . . . . . . . . . . . . . . . . . . . . . 3                           4.1 Recommendations . . . . . . . . . . . . . . . . . . . . . . . . . . 28

    Conclusion . . . . . . . . . . . . . . . . . . . . . . . . . . . . . . . . . . . . . . . . 4                       4.1.1 Policy . . . . . . . . . . . . . . . . . . . . . . . . . . . . . . . . . . . 29

                                                                                                                       4.1.2 Targets . . . . . . . . . . . . . . . . . . . . . . . . . . . . . . . . 29
DOING THE RESEARCH . . . . . . . . . . . . . . . . . . . . . . . . . . . . . 5
                                                                                                                       4.1.3 Monitoring and evaluation . . . . . . . . . . . . . . 32
    1. Introduction . . . . . . . . . . . . . . . . . . . . . . . . . . . . . . . . . . . . . 5
                                                                                                                       4.1.4 Invest in organisational change . . . . . . . . . 33
         1.1 Aims . . . . . . . . . . . . . . . . . . . . . . . . . . . . . . . . . . . . . . . . . 5
                                                                                                                       4.1.5 Pathways for CALD participation . . . . . . . . 34
         1.2 Rationale . . . . . . . . . . . . . . . . . . . . . . . . . . . . . . . . . . . . . 5
                                                                                                                       4.1.6 Connecting CALD creative producers . . . 34
         1.3 Defining cultural diversity . . . . . . . . . . . . . . . . . . . . . 7
                                                                                                                       4.1.7 Research . . . . . . . . . . . . . . . . . . . . . . . . . . . . . . . 34
    2. Methodology . . . . . . . . . . . . . . . . . . . . . . . . . . . . . . . . . . . . 9

         2.1 Sample . . . . . . . . . . . . . . . . . . . . . . . . . . . . . . . . . . . . . . 9       CONCLUSION. . . . . . . . . . . . . . . . . . . . . . . . . . . . . . . . . . . . . . . 36

         2.2 Methods . . . . . . . . . . . . . . . . . . . . . . . . . . . . . . . . . . . . . 9
                                                                                                        ACKNOWLEDGEMENTS. . . . . . . . . . . . . . . . . . . . . . . . . . . . 38
         2.3 Classification . . . . . . . . . . . . . . . . . . . . . . . . . . . . . . . . 11

         2.4 Cross checking . . . . . . . . . . . . . . . . . . . . . . . . . . . . . . 11              APPENDICES . . . . . . . . . . . . . . . . . . . . . . . . . . . . . . . . . . . . . . . 39

         2.5 Data analysis . . . . . . . . . . . . . . . . . . . . . . . . . . . . . . .  12                 Appendix 1. Data Tables . . . . . . . . . . . . . . . . . . . . . . . . . . . 39

         2.6 Data limitations . . . . . . . . . . . . . . . . . . . . . . . . . . . . .  12                  Appendix 2. Data on Gender . . . . . . . . . . . . . . . . . . . . . . 46

                                                                                                             Appendix 3. References . . . . . . . . . . . . . . . . . . . . . . . . . . . 48
WHAT WE DISCOVERED. . . . . . . . . . . . . . . . . . . . . . . . . . . . 13
                                                                                                             Appendix 4. Endnotes . . . . . . . . . . . . . . . . . . . . . . . . . . . . . 50
    3. Findings . . . . . . . . . . . . . . . . . . . . . . . . . . . . . . . . . . . . . . . . 13

         3.1 The Australian Population . . . . . . . . . . . . . . . . . . . . 13

         3.2 CALD representation in leadership roles . . . . . 14

         3.3 Cultural backgrounds of senior leaders . . . . . . 16

               3.3.1 Leadership roles . . . . . . . . . . . . . . . . . . . . . . . 18

               3.3.2 Cultural sectors . . . . . . . . . . . . . . . . . . . . . . . 20

               3.3.3 Organisational status . . . . . . . . . . . . . . . . . . 24

               3.3.4 Jurisdictions . . . . . . . . . . . . . . . . . . . . . . . . . . 25
EXECUTIVE SUMMARY

M
            ost of us living in Australia recognise         organisations. This decision to focus on leadership
            the reality that we are a multicultural,        was in recognition of the significant role that cultural
                                                            sector leaders play in terms of decision making,
            multi-faith and multi-racial nation.
                                                            influencing priorities, setting agendas, gatekeeping
However, we are yet to see that cultural and social         and shaping organisational culture.
diversity reflected in the leadership positions
within our creative and arts sectors. There is a            There are discrepancies between the high population
                                                            of Australians who are from a CALD background
fundamental gap between the rhetoric supporting
                                                            (Australian Bureau of Statistics, 2016), the high rates
cultural diversity and the reality of cultural              of CALD participation in the creative sector (Australia
leadership in Australia.                                    Council for the Arts, 2017) and the low levels of
                                                            representation of CALD people in the Australian
Diversity Arts Australia (DARTS) undertook research         creative sector, including decision-makers (Kim Ho,
in February 2018 to investigate levels of representation    2017; PricewaterhouseCoopers, 2016; Screen
of culturally and/or linguistically diverse (CALD)          Australia, 2016).
Australians in leadership positions within the
country’s major arts, screen and cultural organisations.    The Australia Council for the Arts’ Artistic Vibrancy
The data collected and analysed in this report is           Framework (2009) describes a relational model where
current as at 2 April 2018.                                 creative content is developed, refined and shared
                                                            among groups of people who act as gatekeepers or
One of the key aims of this research is to establish        enablers of new and diverse content, depending on
baseline data about the level of CALD representation        their personal networks and cultural backgrounds.
in the leadership positions of Australia’s major cultural   Qualitative research conducted by DARTS, published

Executive Summary                                                                                                      1
in the Voice, Agency and Integrity report (2018)
    indicates that many organisations within the creative
                                                                        Actively involved
    sector are perceived as presenting a significant barrier
    to CALD artists seeking to access funding, mentorship
    and support for developing their new work.                          At the DARTS Beyond Tick Boxes
                                                                        symposium, Lisa Walsh, Director of
    We adapted the Australian Human Rights                              Research and Knowledge Management
    Commission’s classification of cultural backgrounds                 from the Australia Council for the Arts,
    and compared levels of CALD representation with                     reported that arts participation among
    CALD proportions of the Australian population.                      culturally diverse populations is high,
                                                                        particularly when compared to the
    For this report, we have examined the cultural                      broader population. She conveyed that
    backgrounds of 1,980 Board chairs and members, chief                the latest national arts participation
    executive officers, creative directors, senior executives           survey shows that 80% of Australians
    and award panel judges from 200 major cultural                      from culturally diverse backgrounds
    organisations, government bodies and award panels.                  participate in the arts, compared to 72%
    These organisations represent the nation’s leading                  of the mainstream Australian population.
    arts, screen, creative and heritage organisations
    and awards from the not-for-profit, government and                  (Voice, Agency and Integrity report,
    for-profit sectors.                                                 Diversity Arts Australia, 2018)

    By undertaking this project and providing this
    information, it is our aim that creative sector
    organisations will be better able to identify and
    address barriers to inclusion and participation
    by people with CALD backgrounds, including in
    programming and employment.

    Furthermore, this report provides a starting point
    for the development of more substantial research            rates in the arts than the rest of the Australian
    into the composition and organisational cultures of         population.i
    creative sector organisations, and the causes for CALD
    under-representation in these organisations. This           However, we found that:
    would mirror similar work being done in other sectors,
    such as the 2013 report Futurestep: The Diversity and       •   Approximately half (51%) of the major cultural
    Inclusion Study: A Survey of Companies of Australia             organisations had no CALD representation at the
    and New Zealand by Diversity Council Australia,                 leadership level.
    Korn/Ferry International.
                                                                •   Only 9% of the 1,980 leaders of our major cultural
                                                                    institutions are CALD Australians

    KEY FINDINGS                                                •   Non-CALD Australians are nine times more likely
                                                                    to occupy cultural leadership roles than CALD
                                                                    Australians
    As at 2 April 2018, CALD Australians were
    under-represented across every leadership role
                                                                We were unable to identify CALD leaders in the
    in every cultural sector, organisational type and
                                                                majority of organisations in the following sectors:
    jurisdiction included in this study.

    According to the Australian Human Rights                    •   museums and heritage sector (64% of
    Commission, 39% of the Australian population —                  organisations had no CALD leaders)
    more than one in three Australians — have a CALD
    background. The Australia Council for the Arts has          •   performing arts sector (63% of organisations had
    also found that CALD Australians have higher than               no CALD leaders)
    average live attendance and creative participation

2                                                                                                       Shifting the Balance
•   music and opera (61% of organisations had no       •   We identified CALD Australians in leadership
    CALD leaders)                                          roles in approximately half of not-for-profit (48%)
                                                           organisations. In not-for-profit organisations,
•   screen and radio (59% of organisations had no          CALD Australians comprised only 9% of cultural
    CALD leaders).                                         leaders.

CALD Australians are under-represented in Board        •   In the for-profit cultural sector, CALD Australians
                                                           were slightly more likely to occupy leadership
member and executive roles across all leading
                                                           roles (12%). However, nearly two out of three for-
Australian creative sector organisations.
                                                           profit organisations had no CALD leaders (63%)
CALD Australians comprised:                                and CALD Australians were under-represented
                                                           by 27% in leadership positions.

•   10% of CEOs and equivalents (under-represented
    by 29%)

•   14% of creative directors, including artistic      RECOMMENDATIONS
    directors, curators, senior editors and screen
    heads of production (under-represented by 25%)
                                                       For real change to occur, we recommend that
                                                       Australia’s major cultural organisations, government
•   12% of senior executives (under-represented
                                                       agencies and investors:
    by 27%)

•   6% of Chairs and Deputy-Chairs (under-
                                                       1   Commit to national policies in the arts,
    represented by 33%)
                                                           media, screen, education and creative sector,
                                                           and minimum diversity standards that promote
•   9% of Board members (under-represented by 30%)
                                                           inclusive representation of CALD Australians in
•   10% of awards judges (under-represented by 29%).       the creative sector

                                                       2   Introduce targets to achieve equitable CALD
CALD Australians were under-represented at the             representation in the Australian cultural sector
leadership level of every cultural sector:                 by 2024 (based on the UK diversity standards)

                                                       3   Monitor, report on and evaluate the
•   This was particularly pronounced in the
                                                           impact of actions and track changes in CALD
    performing arts, where we estimate that CALD
                                                           representation
    Australians comprised only 5% of all leaders,
    compared to 39% of the Australian population.      4   Promote inclusion of CALD communities
                                                           in leadership of arts organisations through
•   The literature and publishing sector had the
                                                           meaningful organisational change
    highest representation of CALD leaders at 14%.
    However, the sector still under-represented CALD   5   Create more pathways for CALD Australians
    leaders by 25%, and more than one in three             to participate in leadership of arts organisations
    literature and publishing organisations had no         through mentorships
    CALD leaders (37%).
                                                       6   Connect CALD practitioners across the creative
                                                           industries within Australia (through national
In creative sector roles, CALD Australians were
                                                           summits) and through alliances, exchanges
under-represented across for-profit organisations,
                                                           and collaborations with arts organisations
not-for-profit organisations and government
                                                           internationally
bodies:
                                                       7   Research barriers to inclusion and participation
•   Only 9% of leaders identified as coming from a         of CALD Australians in arts organisations,
    CALD background in the majority of government          including the impact of intersectional factors
    bodies. We were unable to identify CALD                such as gender, socio-economic background,
    leaders in more than one in three government           disability and age.
    bodies (38%).

Executive Summary                                                                                                3
CONCLUSION                                                  examine the significant role of creative sector leaders
                                                                in terms of influencing priorities, setting agendas,
                                                                gatekeeping and shaping organisational culture.
    This research creates an evidence-based foundation
    for taking action to improve CALD representation            Given the vibrant creative practices of the many CALD
    in Australia’s major cultural organisations. There is       communities throughout Australia, there is a further
    a great deal of goodwill among our nation’s largest         need for strategies to be implemented to provide
    cultural organisations for the changes recommended          greater support to these practices and to remove
    in this report. It is now time to turn this goodwill        the barriers that exclude CALD people from full
    into action.                                                participation.

    We recognise that many individuals and organisations        This is not only important for the communities who
    in the creative sector are committed to improving           find themselves excluded, but imperative for the
    cultural diversity, however, without representative         longer-term viability of the broader arts sector in
    leadership there is a high risk of implicit bias reducing   terms of:
    the chances of ensuring there is greater diversity of
    creative workers, artists, practice and programming.        •    overcoming the opportunity cost of foregoing the
                                                                     inclusion of many talented leaders and managers
    Our findings demonstrate there is a significant                  with a CALD background
    under-representation of CALD people in leadership
    and decision-making roles in every area of the              •    the economic benefits of engaging broader
    creative sector. This report highlights the need for             sections of the community
    more measures to be taken and the need for further
    research and capacity-building programs to address          •    the increasing evidence that finds diverse
                                                                     organisations are more robust than those that lack
    this under-representation.
                                                                     this diversity*
    Further inquiry is needed to understand the reasons
    for such discrepancies between arts practice areas.
                                                                •    building social cohesion and inclusion.

    For example, why is there a higher representation of
    CALD representation in the Literature and Publishing        * See The Diversity and Inclusion Revolution: Eight Powerful Truths,
    sectors (14%) compared to the Performing Arts sector        Bourke and Dillon, Deloitte, 2018 and Which two heads are better than
    (5%)? Additional research should also be undertaken to      one? How diverse teams create breakthrough ideas and make smarter
                                                                decisions, Bourke, J., Australian Institute of Company Directors, 2018)

4                                                                                                                Shifting the Balance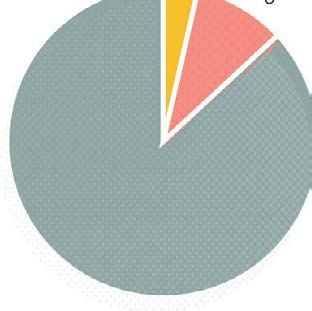
DOING THE RESEARCH

1. INTRODUCTION                                            decision-making and improve CALD
                                                           representation in the Australian arts, screen and
                                                           creative sectors.

T
         his is a report on the estimated level        •   Provoke discussion and reflection about the
         of representation of culturally and/or            direction and level of commitment towards
         linguistically diverse (CALD) Australians         cultural diversity in order to elicit change in
                                                           Australia’s arts, screen and creative sectors.
in leadership positions within the country’s
major cultural organisations as at 2 April 2018.       •   Contribute to the methodological and theoretical
                                                           body of knowledge, practice and critical
It is a preliminary study, laying the groundwork           discourse regarding CALD representation,
for subsequent research measuring cultural and             identity and lived experience, including
linguistic diversity in leadership across all areas        complementing qualitative research into CALD
of the arts, screen and creative sectors, as well as       representation.
more in-depth qualitative studies highlighting the
discrepancies in CALD and non-CALD representation.

                                                       1.2   Rationale
1.1   Aims
The aims of this research are to:                      Background

•     Take the first step towards a national,          The United Nations Declaration of Human Rights
      standardised approach to collecting and          states that people have the fundamental right to
      analysing data regarding the level of CALD       express themselves creatively and celebrate their
      representation in Australia’s arts, screen and   cultures. In the context of a cultural and linguistically
      creative sectors.                                diverse society, the right to creative expression
                                                       cannot be separated from the recognition and
•     Establish a baseline or reference point in       celebration of the cultural and linguistic differences
      order to track CALD representation over time,    between members of this society.
      which in turn will support evidence-based

Doing the Research                                                                                                 5
As former Australian Human Rights Race                   Context
    Commissioner Tim Soutphommasane said during
    his opening address at the Beyond Tick Boxes
                                                             Australia is a culturally diverse nation. Thirty-nine per
    Symposium:
                                                             cent of Australians come from CALD backgrounds.iii
                                                             CALD Australians are highly engaged in cultural,
                                                             creative and artistic activity. CALD Australians
         There is no human right, of                         are more likely to attend live performances, and
       course, for people to be reflected in                 creatively participate in the arts, than the national
       the arts or in media. But we can all                  average. The 2017 Australia Council study of arts
       appreciate that someone’s dignity                     participation recorded that live attendance rates
                                                             for CALD Australians aged 15+ were 80%, compared
       can be connected with how they
                                                             to 72% for the total Australian population aged 15+.
       or, to be more specific, the group                    Creative participation rates for CALD Australians
       they belong to — are depicted in                      aged 15+ were 58%, 12% higher than the Australian
       the public sphere. Where a group                      average.iv
       in society is invisible or demeaned,
                                                             However, this is not reflected on our screens, main
       the message is clear. Those in that
                                                             stages or at the Board and executive levels of the
       group are outsiders, second-class
                                                             country’s leading companies, universities and
       members, or even an ‘other’ against                   government departments.
       whom society defines itself.” ii
                                                             Previous research into the arts, screen and creative
                                                             sectors has found:

    In 2017, DARTS hosted the Beyond Tick Boxes              •   In 2016, only 10% of professional artists in
    symposium at Casula Powerhouse in Sydney. While              Australia identified as being from a non-English
    the majority of the 140 people who attended were             speaking backgroundv
    Sydney-based, the symposium included over 100
    livestream participants, many of whom were from
                                                             •   Only 18% of main characters in Australian TV
                                                                 dramas from 2011 to 2015 came from CALD
    other states, territories and regional areas.
                                                                 backgroundsvi

    Some of the outcomes of the symposium informed the       •   In 2017, only four of 95 productions produced by
    design of this study. In a session addressing barriers       Australia’s 10 main theatre companies were both
    to participation from CALD artists and creative              written and directed by artists of colourvii
    workers, participants called for the current level of
    diversity in the leadership of arts organisations to     •   In 2016, of the 90 productions staged by the
    be measured to provide a benchmark for change.               nine Australian major performing arts theatre
    Furthermore, as noted in the Voice, Agency and               companies, only one writer and two directors
    Integrity report (2018), which documented the                were of Asian Australian descentviii
    Beyond Tick Boxes symposium, many participants
    discussed the frustration and feelings of exclusion of   •   In 2016, research found that 75% of employees in
                                                                 the Australian media and entertainment industry
    many artists from CALD backgrounds from major arts
                                                                 were ‘white, male and aged over 35’.ix
    organisations and bodies.

    Although specifically focused on cultural and            This poor representation is not limited to the
    linguistic diversity within the arts, screen and         arts, screen and creative sectors. Similar research
    creative sectors, this report should be read in          conducted by the Australian Human Rights
    context with a body of Australian research seeking       Commission and the Diversity Council of Australia
    to measure diversity in various other industries in      into CALD diversity of the leaders of Australia’s
    Australia such as business, education, government        largest corporations and universities have found that:
    and media.

                                                             •   While only 58% of the Australian population were
                                                                 Anglo-Celtic, 76% of leaders were Anglo-Celticx

6                                                                                                   Shifting the Balance
• CALD Australians are under-represented at
the CEO level of Australia’s top universities, What is Cultural and
government departments and companies
by 15%xi
Linguistic Diversity?
• More than 60% of the Australian and New
Zealand businesses surveyed by the Diversity For the purposes of this research, the
Council of Australia in 2013 had limited or no term culturally and linguistically diverse
background in diversity, and 41% of businesses (CALD) refers to people who are first,
indicated they were only at the foundation stage second or third generation migrants
of building a diversity program. In the study, or members of ethnic communities.
81% of respondents said that senior leadership This includes Australian-born people
is critical to the success of a diversity and who may self-identify or engage with
inclusion strategy.xii the languages, customs or cultural
specificities of ancestral heritages that
differ from those of Anglo-Australians
The under-representation of CALD Australians in
(as defined by the Australian Bureau
our nation’s leadership and cultural life is an issue
of Statistics of the ‘English-speaking’
of equity and social justice. It is also a barrier to the
constituency).
growth of the Australian economy and the drivers
of the creative industriesxiii. The Price Waterhouse
Coopers’ (PwC) 2016 report warns that a lack of racial
and gender diversity in Australia’s media is ‘dragging
down the future growth of the industry.’xiv
According to recent research, supporting cultural
diversity can:
• increase productivity and innovation
1.3Defining cultural
diversity
• reduce the economic costs associated with
discrimination such as lower productivity,
In undertaking this research, we have drawn on the
absenteeism, lawsuits and reputational damage
Australian Human Rights Commission’s approach to
to organisations
defining cultural background:
• build social cohesion and inclusion
• protect people’s human rights We consider cultural background
• improve decision-making and access to talentxv to refer primarily to a person’s
ethnicity and ancestry. The
• improve organisational robustness.xvi
concept of ethnicity can be
understood to relate to a human
The Workplace Gender Equality Act 2012 has group or population that has
required companies with 100 or more staff to
a common origin, and which
submit a report on gender equality indicators to the
Workplace Gender Equality Agency. However, this is may exhibit shared defining
not the case for cultural and linguistic diversity. One features such as homeland,
of the key areas for future research is in developing language, customs, historical
criteria for identifying and describing how cultural tradition, religion and physical
and linguistic differences may be experienced as appearance. We regard ancestry
barriers to participation in, and representation by, the
— a person’s descent and family
creative arts sector.
background — as inextricably tied
to ethnicity.”xvii
Doing the Research 7Recent reports by the Australian Human Rights Many authors and creative practitioners acknowledge
Commission (2016, 2018) and Screen Australia (2016) that the terms used to describe diversity are
use four categories to measure cultural and linguistic often limited and problematic, as they have been
diversity: Australian Indigenous, Anglo-Celtic, constituted by discourses that homogenise and elide
European and non-European. In this report, we have economic, political and cultural diversities. However,
used the two broad categories of CALD it can provide a starting point for ‘analysis and
and non-CALD. resistance.’
The categorisation of CALD or non-CALD is
amenable to the heuristic qualities of data collection In recent years there has been a
used by this study, which triangulated publicly
growing unease about the tendency
available information with participants’ own identity
descriptors. Heuristic approaches are recognised as of anti-Eurocentric writing to
appropriate for translating the complexities of cultural homogenise not just the ‘Third
identity into quantitative data.xviii In the process World’ but also the category of
of undertaking this research, some respondents ‘the West’. But in the face of such
expressed concerns regarding the complexity of objections we need to remind
cultural identity and the study’s methodology. The
ourselves that these increasingly
CALD/non-CALD categories encouraged participants
to consider and question how cultural background is troublesome categories, such as
identified by institutions and researchers. ‘the West’ or ‘colonialism’ or
’neo-colonialism’ — and even
We acknowledge that ‘Cultural and Linguistic ‘colonial discourse’ — are
Diversity’ (CALD) is an umbrella term for people themselves in their current
from enormously divergent backgrounds, for whom
usage often the creation of Third
geopolitical components (e.g. type of migration),
socio-economic factors, religious or cultural practices World theorists … who needed to
and linguistic capacities are all major determinants invent such categories in order
on their participation in arts organisations and to constitute an object both for
leadership. Subsequent studies will need to delineate analysis and for resistance.”xx
more specific determinants, including the differences
between non-Europeans and Europeans not of
Anglo-Celtic background, in order to provide more
accurate diagnosis of structural barriers that exist for Cultural identity criteria, while highly contested, are
CALD groups. nevertheless critically important for organisations
seeking to benchmark, evaluate and promote
The terminology of ‘CALD’ is contested, including inclusion. We recommend that future research
by DARTS itself. For example, a participant at the employs methodologies that articulate the complexity
DARTS Beyond Tick Boxes Symposium explained the of the lived experience of cultural identity.
limitations of the term:
The terminology of ‘CALD’
allows or encourages decision-
makers to stereotype ‘other’
CALD artists. ‘CALD’ inspires in a
decision-maker a sense of having to
tick a box, instead of excitement at
the potential of this unmined vein
of Australian creative output.”xix
8 Shifting the Balance2. METHODOLOGY the de-identification of organisation-level and
individual-level data.
In 2018 DARTS established an Expert Research While this is not an exhaustive list of Australia’s
Reference Group of advisers — made up of university culturally influential organisations, we hope that
lecturers, researchers, directors and managers from it provides a starting point for ongoing research.
cultural organisations — to provide feedback on (See Table 1, page 10)
the research design and methodology, as well as
We collated the details of individuals occupying
the report. DARTS partnered with Western Sydney
the leadership roles (listed in Table 2, page 10) of
University and BYP Group to deliver this report.
these organisations as at 2 April 2018.
In undertaking this research, we have drawn upon
The methodology used in our research draws on
the Australian Human Rights Commission’s approach
established methods of cultural diversity research,
set out in its 2018 report, Leading for Change.xxi As
using a heuristic approach where participants
discussed in the previous section, we adopted the
were actively involved in negotiating how they
category of CALD as a recognised umbrella term,
were identified according to existing categories.xxii
amenable to the heuristic approach of this report.
The Australian Human Rights Commission
explains that this heuristic methodology is
practiced in academic and industry studies, and
2.1 Sample has been used by the Diversity Council Australia
and other studies.xxiii
We constructed a sample of 1,980 individuals
from 200 ‘major cultural organisations’, identified
as culturally influential and leading national and
State-level arts, cultural, broadcast and screen
2.2 Methods
organisations, funding agencies and major award
For this research, the initial classification of
panels. Organisations were predominantly medium
cultural background employed the same methods
and large in size but the sample also included some
used by the Australian Human Rights Commission
smaller companies that had significant national
in their Leading for Change reports (2016, 2018).
impact and reach. The sample included:
They are as follows:
• For-profit, not-for-profit and government bodies
• publicly available biographical information
• Service organisations, award panels, training about individuals
institutions, collecting institutions, publishers,
distributors, production houses, venues, festivals, • other relevant public statements that may
include information about the individual’s
orchestras and performing arts companies
cultural background
• Organisations from across the arts, screen
and creative sectors including literature and • an individual’s full name and its origins
publishing, multi-artform, museums and heritage,
music and opera, performing arts, screen and
• an individual’s place of birth
radio, and visual arts, craft and design. • photographs of the individual
Based on this criteria, BYP Group identified a list of
• references to ancestry and cultural
background going as far back as two
216 organisations which were then confirmed by generations (to a person’s grandparents).
DARTS and the Expert Research Reference Group.
Three organisations asked to be removed from the
study and researchers were unable to find data for This initial desktop research was undertaken to
13 organisations, resulting in a final sample size of establish the most likely cultural and linguistic
200. Organisations were aggregated into segments backgrounds of leaders within each arts
for analysis as per the following table, to ensure organisation.
Doing the Research 9Table 1 Structure of the Study Sample: Organisations
Analysis Segments Count %
Sector Literature and publishing (includes major journals, festivals, service
43 21%
bodies, literary awards and publishers)
Multi-artform (includes major multi-artform venues, government funding
35 17%
bodies and festivals)
Museums and heritage 14 7%
Music and opera (includes orchestras and opera companies) 23 12%
Performing arts (theatre, dance, circus) 19 10%
Screen and radio (includes major production houses, distributors and
46 23%
broadcasters)
Visual arts, craft and design (includes major galleries, award panels,
20 10%
service bodies and training institutions)
TOTAL ORGANISATIONS 200 100%
Organisational For-profit 49 24%
Status
Government (including statutory bodies, government departments and
52 26%
corporate government entities)
Not-for-profit 99 50%
TOTAL ORGANISATIONS 200 100%
State/Territory NSW 94 47%
VIC 46 23%
Other States/Territories (ACT, NT, SA & WA) 60 30%
TOTAL ORGANISATIONS 200 100%
Table 2 Structure of the Study Sample: Individual Leaders
Analysis Segments Count %
Roles Board Chairs and Deputy-Chairs 192 10%
Board Members 1,128 57%
CEOs and equivalents 181 9%
Creative Directors (includes Artistic Directors, Curators, Senior Editors,
95 5%
Creative Directors, Heads of Production)
Judges of major Australian cultural awards 130 6%
Senior Executives (includes senior managers and C-suite officers) 254 13%
TOTAL LEADERS 1,980 100%
10 Shifting the BalanceTable 3 Cultural Background Classifications
Australian Human Rights Commission Classifications Diversity Arts Australia Classifications
Indigenous background First Nations
European background CALD
Non-European background CALD
Anglo-Celtic background Non-CALD
2.3 Classification
While the Australian Human Rights Commission • encourage cultural organisations to monitor the
categorised individuals as Indigenous, Anglo-Celtic, cultural diversity in their leadership positions
European and non-European, we used the CALD
classification as derived from the Australian Bureau • encourage debate in the arts sector on how
cultural identity is classified.
of Statistics’ Standards for Statistics on Cultural and
Language Diversity.xxiv Our categories can be cross-
referenced against the Australian Human Rights We anticipate this triangulated model will form the
Commission’s as per the table above. basis of future in-depth qualitative studies that will
explore the invisible barriers to leadership among
Two researchers independently classified the cultural CALD workers in the creative arts sector.
background of each individual included in the report.
Their classifications were then reviewed by a senior
researcher, who adjusted and/or further analysed the
data as required. Error margins
We received 89 responses, representing a response
rate of 45%. We then made amendments to our data
2.4 Cross checking based on these responses.
Our approach to research differed from the Australian We compared our estimates of cultural background
Human Rights Commission by adding a step to our with the amendments provided by organisations.
data collection and validation process. While the We used this to calculate a margin of error for our
desktop research gave us the baseline quantitative study of between +/-4% and +/-12%. The margin
data, we supplemented this with a mixed mode of of error is between +/-4% to +/-12% because some
research. After our researchers collated data from organisations provided confirmed data from the
the abovementioned sources, we sent our estimates individuals in the study, whilst other organisations
of cultural background to each organisation in the provided their own estimates of the CALD status
sample, offering the opportunity for the organisation of individuals in the study. Our margin of error is
to revise the data. at the lower end of this range (+/-4%) if we base
the calculation on a comparison of our estimates
This combination of desktop research and participant with organisations’ estimates plus data confirmed
engagement provided a triangulated model that by individuals. Our margin of error is at the higher
allowed us to achieve the following: end of the range (+/-12%) if we base our calculation
on a comparison of our estimates only with data
confirmed by individuals. We recommend applying
• estimate an error margin for our desktop
the more conservative +/-12% margin of error when
research
reading the report’s findings.
• engage cultural organisations in research
without contributing to survey fatigue
Doing the Research 112.5 Data analysis
All the data represented in the graphs in this report
was final as at 2 April 2018. Data tables for each
graph can be found in Appendix 1. In cases where
there were too few records to ensure de-identification,
we have aggregated data and indicated with ‘n/a’
that records in a particular category have not been
specified. Some percentage totals in the report may
differ due to the effects of rounding.
2.6 Data limitations
First Nations
The focus of this research was to measure the
participation of CALD Australians in cultural
leadership roles. Where an individual self-identified
as being of First Nations descent, we have recorded
this, but further investigation was beyond the scope
of this report. Our findings regarding First Nations’
representation should be read as indicative rather
than representative and we hope it is a prompt for
further research.
Gender
Gender and CALD has been explored in existing
studies on CALD women in leadership (Diversity
Council Australia, et al, 2017), however gender
categories exist across a spectrum and should be
more nuanced than a binary model. Gathering
information on the gender self-identity of individuals
was beyond the scope of this research, as it would
have required a direct survey of individuals. We
collated data on individuals’ gender based on the
source materials used to identify cultural background.
We have included the data in Appendix 2, in the
hope that this will prompt others to conduct rigorous
research in this important area of inquiry. We caution
against the use of this data as representative, as it
essentially represents a binary identification method
which does not encompass individual’s gender
identities.
12 Shifting the BalanceWHAT WE
DISCOVERED First Nations
3%
CALD
39%
3. FINDINGS ← Figure 1
Australia’s
Population
by Cultural
Non-CALD
The Australian
3.1
58 %
Background
Population
I
n its 2018 report on cultural diversity in In addition, the report specified that 18% of
Australian leadership, the Australian Human Australians come from a ‘European’ background,
Rights Commission analysed Australian which refers to all other European backgrounds
other than Anglo-Celtic, i.e. those European countries
Bureau of Statistics data to estimate the cultural
where English is not the first language, e.g. France,
diversity of the Australian population as follows: Germany, Poland, Latvia, Greece, Italy and so on.
Twenty-one per cent come from a ‘non-European’
• 3% of Australians identify as having First Nations background, which refers to all other backgrounds
heritage including Asian, South American, African, Middle
Eastern, Oceanic and Pacific Islander.
• 39% of Australians identify as coming from
a cultural background other than a solely For the purposes of our research, we refer to the
Anglo-Celtic background* 39% of Australians who identify as coming from
cultural backgrounds other than a solely Anglo-Celtic
• 58% of Australians identify as coming from an
background as ‘culturally and/or linguistically
Anglo-Celtic cultural background.†
diverse Australians’ (CALD). We refer to the 58% of
Australians who identify as coming from an Anglo-
Celtic cultural background as non-CALD.
* Australian Human Rights Commission (2018), op. cit., 4. The Aus-
tralian Human Rights Commission data is based on the Australian
Bureau of Statistics Census data 2011 and 2016, and the Reserve
Bank of Australia’s Race and Cultural Identity Employee Resource
Group analysis: Australian Human Rights Commission (2018), op. cit.,
7 and 33.
† ‘Anglo-Celtic background’ refers to those cultural backgrounds
that are English, Scottish, Welsh and Irish: Australian Human Rights
Commission (2018), op. cit., 4.
What We Discovered 13of Australia’s
major arts No CALD
organisations representation
have 51%
CALD
representation
CALD represen- 49%
tation within (Percentage
their leadership. breakdown of 200
arts organisations)
3.2CALD
representation in
leadership roles
CALD Australians are significantly under- ↑ Figure 2
represented in Australia’s major cultural CALD Representation
leadership positions. in Leadership Roles
As at 2 April 2018, we estimate that 102 of the 200
organisations (51%) in our study had no culturally
and linguistically diverse representation amongst
their Board members, executives and/or award
panel judges. The following graphs provide further
information on the location and creative sector, and
the types of organisations that do not have any
CALD leadership.
↓ Figure 3
CALD Representation
in Leadership Roles by
Jurisdiction
49% 51% Total organisations
50% 50% Other States/Territories
49% 51% New South Wales
48% 52% Victoria
CALD representation in leadership No CALD representation in leadership
(Percentage breakdowns involving 200 arts organisations)
14 Shifting the BalanceBIG PICTURE OVERVIEW
• 51% of the arts and creative • 58% of the population is
Cultural and organisations examined in Anglo-Celtic, compared to 87%
Linguistic this study had no culturally
and linguistically diverse
of arts leaders.
Diversity of representation amongst their • It was found that culturally and
Board members, executives or linguistically diverse Australians
Australian Arts award panel judges. are four times less likely to
Leaders • 39% percent of the Australian
hold leadership roles in the arts,
screen and creative sectors.
population is culturally and
linguistically diverse, compared
to only 10% of arts leaders.
→ Figure 4
CALD Representation in
Leadership Roles
by Sector Representation in leadership of all organisations
49% 51%
CALD representation in leadership No CALD representation in leadership
Representation in organisations by sector
(Percentage breakdowns involving 200 arts organisations)
Literature and publishing 63% 37%
Multi-artform 57% 43%
Visual arts, craft and design 55% 45%
Screen and radio 41% 59%
Music and opera 39% 61%
Performing arts 37% 63%
Museums and heritage 36% 64%
What We Discovered 15Representation in leadership of all organisations
Figure 5 → 49% 51%
CALD Representation
in Organisations by CALD representation in leadership No CALD representation in leadership
Funding Model
Representation in organisations by funding model
Government body 62% 38% Governme
Not-for-profit 48% 52% Not-for-pro
For-profit 37% 63% For-profit
3.3Cultural
backgrounds of senior
leaders
Of the 1,980 leaders we reviewed, 9% (188) were
identified as culturally and/or linguistically diverse,
compared to 39% of the Australian population.
Based on the make-up of the Australian population,
non-CALD Australians should occupy approximately
1.5 times as many cultural leadership roles as CALD
Australians. However, as at 2 April 2018:
• non-CALD Australians occupied nine times more
cultural leadership roles than CALD Australians
• CALD Australians were under-represented
amongst major cultural leadership roles by 30%.
Put another way, CALD Australians were represented
in creative sector leadership roles at only a quarter of
the rate than they are present in the population.
16 Shifting the BalanceFirst Nations
4%
CALD
9%
Less than
← Figure 6
Cultural
Background
of Leaders
Australian arts
leaders is from a
Non-CALD CALD background
87 %
100%
87 %
Proportion of leaders ← Figure 7
of that background
who are leaders in arts Cultural
80%
organisations
Background
of Leaders
58 % vs Australian
Proportion of people of
60% that background in the
Population
Australian population
39 %
40%
20% 9%
3% 4%
0%
First Nations CALD Non-CALD
What We Discovered 17Overview of cultural backgrounds
In the population 39% 58% 3%
In leadership positions 9% 87% 4%
Backgrounds in different leadership roles
(Percentage breakdowns of 1,980 arts organisation leaders)
Creative directors 14% 82% 4%
Senior executives 12% 88%
CEOs 10% 90%
Figure 8 →
Judges 10% 83% 7%
Cultural
Background Board members 9% 87% 4%
of Leaders
by Roles Board Chairs and 6% 90% 4%
Deputy Chairs
33% gap
CALD Non-CALD First Nations
3.3.1 Leadership roles 12% of senior executives (under-represented
by 27%).
As at 2 April 2018, we estimate that CALD
Australians were under-represented across Put another way, CALD Australians were represented
all leadership roles in the 200 major cultural as follows:
organisations included in this report.
CEOs and equivalents: CALD Australians were
CEOS, CREATIVE DIRECTORS AND SENIOR represented at about a quarter of the rate that
EXECUTIVES they are present in the population
Creative directors: CALD Australians were
We estimate that as at 2 April 2018, CALD Australians
represented at about a third of the rate that
comprised:
they are present in the population
10% of CEOs and equivalents (under- Senior executives: CALD Australians were
represented by 29%) represented at less than a third of the rate that
they are present in the population.
14% of creative directors, including artistic
directors, curators, senior editors and screen
heads of production (under-represented
by 25%)
18 Shifting the BalanceThere are so many
Australians — including kids
and teenagers — who still don’t
see stories resembling theirs on
screen, who see very few people
who look like their families.
To not feel visible or reflected
is a quietly dehumanising
Figures for ‘First Nations’ in the
process. And though we
‘CEO’ and ‘Senior Executives’
segments were excluded as they
might congratulate ourselves
were too small to maintain de-
identification.
on doing better at diversity,
Australia is far behind.
Take for instance, the fact that
just over 1 in 10 Australians
have Asian heritage — roughly
proportionate to how many
black Americans there are
in the United States. Take a
B OARD MEMBERS look at black representation
At the Board level, CALD Australians comprised: in American versus Asian
representation here, and you’ll
6% of Board Chairs and Deputy-Chairs (under-
represented by 33%) see how far we have to go.”
9% of Board members (under-represented
by 30%).
AWARD PANEL JUDGES
Of the award panels we reviewed, CALD
Australians comprised 10% of judges (under-
represented by 29%).
Benjamin Law
Writer
What We Discovered 193.3.2 Cultural sectors
There’s a big, serious job
for the arts to do in reimagining CALD Australians were under-represented in
leadership roles across all cultural sectors. This was
the national story. But the most pronounced in the performing arts, where we
organisations that exist are estimate that as at 2 April 2018, CALD Australians
comprised 5% of all leaders, compared to 39% of the
locked into big-small, major- Australian population.
minor dynamics by policy We were unable to identify any CALD leaders in the
settings which have basically majority of organisations in the following sectors:
marginalised the marginalised. • museums and heritage sector (64% of
Big arts companies are yoked organisations had no CALD leaders)
to semi-commercial models • performing arts sector (63% of organisations had
no CALD leaders)
that, like those big road trains,
• music and opera (61% of organisations had no
can’t cope with the kinds of CALD leaders)
unexpected kinks and swerves • screen and radio (59% of organisations had no
CALD leaders).
that it takes to beat a new path.
In other words, we’re failing to LITERATURE AND PUBLISHING
tell the country’s stories. Which The literature and publishing sector had the
highest representation of CALD leaders at
is most of our reason for existing. 14%, and 63% of organisations had at least
We need to break down the one CALD Australian in a leadership role. However,
CALD Australians are still under-represented in
barriers and start telling these the sector by 25% and more than one in three
organisations had no CALD leaders (37%).
stories as a matter of urgency and
a matter of course.”
MULTI-ARTFORM
In the major multi-artform organisations
in Australia, 9% of leaders came from a
CALD background. This means that CALD
Australians were represented in leadership roles at
only a quarter of the rate that they are present in the
population. As at 2 April 2018, we estimate that
43% of major multi-artform organisations had no
CALD leaders.
Eamon Flack
Artistic Director,
Belvoir Theatre
20 Shifting the BalanceCALD people are almost
more likely to become a leader in literature and publishing than
in the performing arts
Overview of cultural backgrounds ← Figure 9
Cultural
In the population 39% 58% 3% Backgrounds
of Leaders
In leadership positions 9% 87% 4%
by Sector
CALD Non-CALD First Nations
Backgrounds of leaders in each sector
(Percentage breakdowns of 1,980 arts organisation leaders)
Literature and publishing 14% 83% 3%
Visual arts, craft and design 10% 89% 2%
Screen and radio 9% 89% 2%
Multi-artform 9% 88% 3%
Figures for ‘First
Music and opera 8% 92%
Nations’ in the ‘music
and opera’ segment
Museums and heritage 7% 80% 12% were excluded
as they were too
small to ensure de-
Performing arts 5% 86% 9%
identification.
34% gap
What We Discovered 21One surefire way to grow
screen audiences is to diversify
them, and the only way to
diversify screen audiences is to
diversify the key creatives and the
decision makers.
Government funding can play a
significant role; where funding
has been conditional on working
with key creatives from diverse
backgrounds, the world has
changed dramatically.
It’s also more important than ever
that we have people from diverse
backgrounds in our boardrooms,
as that’s where strategy is set. If
delivering diversity is a priority MUSEUMS AND HERITAGE
in the boardroom, it cascades leaders injustthe
We identified 7% of Australian
leaders in the
through the whole business and museums and heritage sector as having a
performing arts is from
CALD background, with CALD Australians
out across the industry.” represented in cultural leadership roles at less
a CALD background
than a fifth of the rate that they are present in
the population. Nearly two out of three (64%)
organisations had no CALD leaders.
MUSIC AND OPERA
We estimate that 8% of leadership roles were
filled by CALD Australians in Australia’s
major music and opera organisations. This
means that CALD Australians were represented in
cultural leadership roles at less than a fifth of the rate
that they are present in the population. We estimate
that 61% of major music and opera organisations had
no CALD leaders at all.
Courtney Gibson
Chief Executive,
South Australian Film Corporation
and Adelaide Studios
22 Shifting the Balanceleaders in the Australian
performing arts is from
a CALD background
PERFORMING ARTS VISUAL ARTS, CRAFT AND DESIGN
The performing arts sector had the lowest We found at least one CALD Australian in
representation of CALD leaders, with just 5% a leadership role in 55% of Australia’s major
of leaders coming from a CALD background. visual arts, craft and design organisations.
This means that CALD Australians were represented This means that 45% of organisations had no CALD
in cultural leadership roles at less than an eighth leaders. We identified 10% of leaders in this sector
of the rate that they are present in the population. as coming from a CALD background, which means
We estimate that almost two out of three (63%) that CALD Australians were represented in cultural
performing arts organisations had no CALD leaders leadership roles at just a third of the rate that they
whatsoever. are present in the population.
SCREEN AND RADIO
We identified 9% of major screen and radio
organisation leaders as coming from a CALD
background. This means that in the screen
and radio sector CALD Australians were represented
at the leadership level at less than a quarter of
the rate that they are present in the population.
We estimate that 59% of major screen and radio
organisations had no CALD leaders.
What We Discovered 23Overview of cultural backgrounds
In the population 39% 58% 3%
In leadership positions 9% 87% 4%
CALD Non-CALD First Nations
Backgrounds of leaders by funding model
(Percentage breakdowns of 1,980 arts organisation leaders)
Figure 10 → For-profit 12% 88%
Cultural
Background
Government body 9% 86% 5%
of Leaders by
Funding Model
Not-for-profit 9% 87% 4%
30% gap
GOVERNMENT BODIES
3.3.3 Organisational status
(funding models) The majority of government bodies had at
least one CALD Australian in a leadership
CALD Australians are under-represented across role (62%). However, only 9% of leaders
for-profit organisations, not-for-profit organisations and identified as coming from a CALD background. This
government bodies. means that CALD Australians were represented in
government cultural leadership roles at only a quarter
of the rate that they are present in the population.
FOR-PROFIT ORGANISATIONS
As at 2 April 2018, 12% of leaders in for- NOT-FOR-PROFIT ORGANISATIONS
profit cultural organisations came from
CALD backgrounds. This means that CALD We identified CALD Australians in leadership
Australians were represented in for-profit cultural roles in approximately half (48%) of not-
leadership roles at just a third of the rate that they for-profit organisations. CALD Australians
are present in the population. Almost two in three comprised 9% of cultural leaders in this sector,
for-profit major cultural organisations had no CALD meaning they are represented at only a quarter of the
leaders (63%). rate that they are present in the population.
24 Shifting the BalanceOverview of cultural backgrounds
In the population 39% 58% 3%
In leadership positions 9% 87% 4%
CALD Non-CALD First Nations
Backgrounds of leaders by jurisdiction
(Percentage breakdowns of 1,980 arts organisation leaders)
Victoria 11% 87% 2%
← Figure 11
Cultural
Background
New South Wales 10% 86% 4%
of Leaders by
Jurisdiction
Other States/Territories 7% 88% 4%
32% gap
We have aggregated the results for Qld, SA, Tas, WA, ACT
and NT to maintain de-identification.
3.3.4 Jurisdictions
We estimate that, as at 2 April 2018, Victoria (11%)
and NSW (10%) had roughly the same spread and
proportion of CALD leadership at the national level.
Other states and territories collectively had lower
than national average CALD representation (7%).
What We Discovered 25You can also read