An Image of Society: Gender and Racial Representation and Impact in Image Search Results for Occupations - Danaë Metaxa
←
→
Page content transcription
If your browser does not render page correctly, please read the page content below
An Image of Society: Gender and Racial Representation and
Impact in Image Search Results for Occupations

DANAË METAXA, Computer Science Department, Stanford University, USA
MICHELLE A. GAN, Computer Science Department, Stanford University, USA
SU GOH, Department of Economics, McGill University, CAN
JEFF HANCOCK, Department of Communication, Stanford University, USA
JAMES A. LANDAY, Computer Science Department, Stanford University, USA
Algorithmically-mediated content is both a product and producer of dominant social narratives, and it has the
potential to impact users’ beliefs and behaviors. We present two studies on the content and impact of gender and
racial representation in image search results for common occupations. In Study 1, we compare 2020 workforce
gender and racial composition to that reflected in image search. We find evidence of underrepresentation on
both dimensions: women are underrepresented in search at a rate of 42% women for a field with 50% women;
people of color are underrepresented with 16% in search compared to an occupation with 22% people of color
(the latter being proportional to the U.S. workforce). We also compare our gender representation data with that
collected in 2015 by Kay et al., finding little improvement in the last half-decade. In Study 2, we study people’s
impressions of occupations and sense of belonging in a given field when shown search results with different
proportions of women and people of color. We find that both axes of representation as well as people’s own
racial and gender identities impact their experience of image search results. We conclude by emphasizing the
need for designers and auditors of algorithms to consider the disparate impacts of algorithmic content on
users of marginalized identities.
CCS Concepts: • Human-centered computing → Empirical studies in HCI ; Laboratory experiments.
Additional Key Words and Phrases: Algorithm audit; search media; marginalized identities; algorithmic bias
ACM Reference Format:
Danaë Metaxa, Michelle A. Gan, Su Goh, Jeff Hancock, and James A. Landay. 2021. An Image of Society:
Gender and Racial Representation and Impact in Image Search Results for Occupations. J. ACM 0, 0, Article 0
( 2021), 23 pages. https://doi.org/10.1145/3449100

INTRODUCTION
In recent years, the possibility for algorithms to perpetuate harmful biases—often silently—has
drawn increased attention from users, the media, and lawmakers. A wide range of algorithms, from
those used in the criminal justice system [9] to online market places [24] to search algorithms [30]
are coming under scrutiny, and for good reason. Algorithmic systems are ubiquitous and affect
us unconsciously; search engines, in particular, are powerful mediators of information, becoming
Authors’ addresses: Danaë Metaxa, metaxa@cs.stanford.edu, Computer Science Department, Stanford University, USA;
Michelle A. Gan, mgan@stanford.edu, Computer Science Department, Stanford University, USA; Su Goh, su.goh@mail.mcgill.
ca, Department of Economics, McGill University, CAN; Jeff Hancock, hancockj@stanford.edu, Department of Communication,
Stanford University, USA; James A. Landay, landay@cs.stanford.edu, Computer Science Department, Stanford University,
USA.

Permission to make digital or hard copies of all or part of this work for personal or classroom use is granted without fee
provided that copies are not made or distributed for profit or commercial advantage and that copies bear this notice and the
full citation on the first page. Copyrights for components of this work owned by others than the author(s) must be honored.
Abstracting with credit is permitted. To copy otherwise, or republish, to post on servers or to redistribute to lists, requires
prior specific permission and/or a fee. Request permissions from permissions@acm.org.
© 2021 Copyright held by the owner/author(s). Publication rights licensed to ACM.
0004-5411/2021/0-ART0 $15.00
https://doi.org/10.1145/3449100

 J. ACM, Vol. 0, No. 0, Article 0. Publication date: 2021.
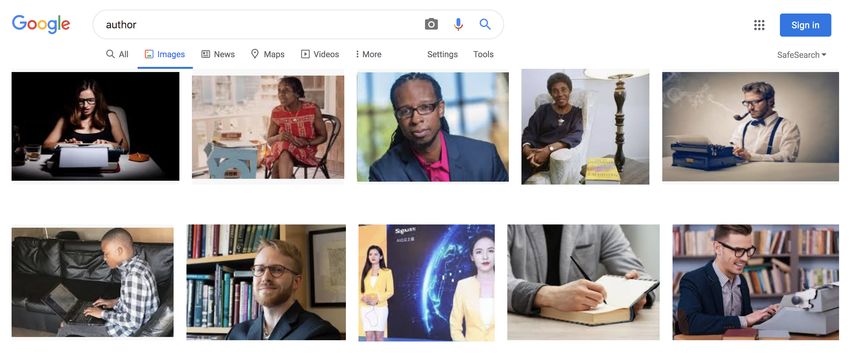
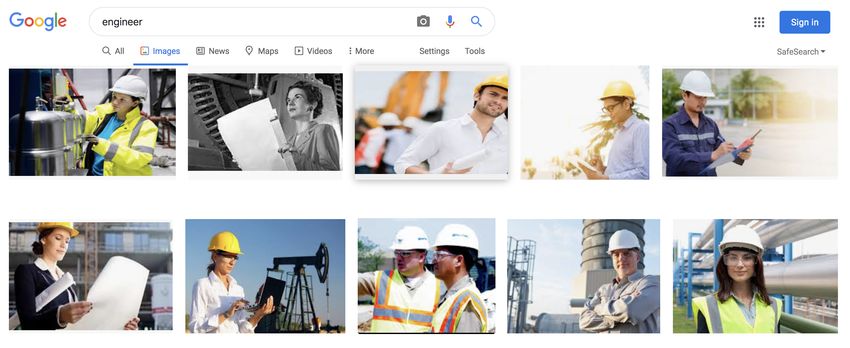
0:2 Metaxa et al.

so widely used that some argue for considering Google Search a public utility [40]. Prior work
has found that content consumed through search is usually highly trusted and can even change
people’s political beliefs and voting behaviors [17].
 The opacity of these systems and the ephemerality of the content they produce makes studying
algorithmic systems a challenge. One method used in this domain is the algorithm audit. Algorithm
audits, based on the tradition of audit studies in the social sciences, involve repeatedly querying
an algorithm and observing its outputs in order to draw conclusions about the algorithm’s inner
workings without directly observing that internal process. Algorithm audits are particularly effective
tools for studying bias and discrimination in sociotechnical systems like search engines, video
platforms, employment and housing platforms, and online advertising. As such, they have been
leveraged by researchers in the CSCW and CHI communities to study biases and disparities along
the lines of gender [7], race [1], and political affiliation [44] among other categories. Notably,
however, scholars have pointed out that race and its intersection with other identity categories
continues to be under-addressed [18, 21]. We use the algorithm audit method to study gender and
race in Google Image Search, a query service that allows users to search for images using keywords,
powered by Google’s computer vision algorithms, which extract concepts and keywords from
images found online [16].
 In 2015, Kay et al. published an algorithm audit of gender representation in Google Image Search,
finding some evidence that women were underrepresented in search results for common occupations
(e.g., searching for “engineer” or “author”), relative to the rate of women’s participation in those
fields. In the years following that publication, social movements for equality, such as the Black Lives
Matter movement and the #MeToo movement, against racial and gendered violence respectively,
have gained strength and publicity. This momentum towards examining social inequities has
extended into the realm of algorithms, for instance with Safiya Umoja Noble’s book Algorithms
of Oppression, which describes the causes and impact of racially biased algorithms [35]. Further,
with suspicions that algorithmically-targeted content could have influenced recent U.S. elections in
2016 and 2020, pressure has mounted on Google and other information gatekeepers. Responding to
these and other pressures, Google announced refinements to their algorithms over the last three
years with goals like “[surfacing] more authoritative content” [22], and introducing fact-checking
for image search [11].
 Given the efficacy of the method established in Kay et al. for studying gender, the subsequent
social and technical shifts, and keeping in mind the relative dearth of similar research examining
race, we ask: how does the representation of marginalized groups, specifically women and people
of color, compare to the representation of dominant groups in Google Image Search results? Has
gender representation, for which Kay et al. published data in 2015, improved in the last half-decade?
Are marginalized races also underrepresented in Image Search? And how do gender and racial
representation in image search results influence users’ perceptions of the world and sense of
belonging in it? In this work, we present two studies seeking to answer these questions. We make
four primary contributions:

 (1) Women remain as underrepresented in Image Search in 2020 as in 2015. In Study 1, we conduct
 an audit of Google Image Search results for common occupations, adhering closely to the
 method established in Kay et al. We then compare gender representation in Google Image
 Search with 2020 data on occupation demographics from the U.S. Bureau of Labor and
 Statistics (BLS). We find continued evidence of the systematic overrepresentation of men in
 image search results, and do not find evidence that this measure has improved since 2015.
 (2) People of color are underrepresented in image search for occupations. We develop and apply
 a similar algorithm audit method to study racial representation in image search results in

J. ACM, Vol. 0, No. 0, Article 0. Publication date: 2021.

An Image of Society 0:3

 comparison to BLS data, where we find even stronger systematic overrepresentation of the
 dominant group, white people, relative to people of color.
 (3) Gender and racial composition in search images influences participants’ beliefs about occupations.
 In Study 2, we expose participants to sample image search results representing a set of
 occupations in which women and people of color are heavily underrepresented. We vary the
 gender and racial composition of these synthetic search results to measure the impact of a
 range of levels of representation on people’s perception of demographics in those occupations.
 We find that increasing the proportion of women or people of color in images linearly
 increased participants’ estimates of gender and racial representation in those occupations,
 underscoring the importance of search results in shaping users’ views of the world.
 (4) Participants’ own gender and racial identities influence how search images affect their beliefs
 about occupations. Further, we study participants’ self-reported level of interest in each
 occupation, perception of its inclusivity, and expectations of whether they would be valued
 in that field; importantly, unlike most prior work we examine these trends in the context of
 participants’ own gender and racial identities. Here we find that participants’ own gender
 and race, as well as both gender and racial composition of search images, impacts their
 perceptions of an occupation and their own psychological sense of place in it.

 In the remainder of the paper, we first review relevant prior literature, state our research questions,
and subsequently detail the method and discuss the findings of both studies before concluding.

RELATED WORK
We draw our conceptual foundation from fields including media studies, race and ethnic studies, and
sociology, in particular focusing on the communication of culture, including bias and stereotypes,
through visual cues. We also connect to previous algorithm audit work in computer and information
science to contextualize this research.

Algorithmic fairness, bias, and representation
Like much work in algorithmic fairness, underlying our goal of studying composition and impact of
algorithmic content is the normative assumption that fair treatment of different gender and racial
identities is the desired outcome. But concepts and terms like “fair” or “biased” are fraught, carrying
different meanings by discipline and presenting challenges to define, let alone measure [13]. In this
work, we adopt the definition suggested by AI fairness researcher Kate Crawford, who defines bias
broadly as a skew that produces harm, including the sub-category of representational harm: when a
system perpetuates or exaggerates social inequalities along identity lines.
 Following this framing, in our work we assert that the systematic exclusion of marginalized
people from image search results is a form of representational harm. Consistent with prior work,
we operationalize this idea by measuring representational bias—specifically comparing the rate
of representation of people from marginalized identity groups in image search results to their
actual rate of participation in the workforce [26]. In particular, we focus on marginalized genders
(women and non-binary people) and races (non-white people, equivalently termed people of color).
In this work, we use terms like “bias” or “underrepresentation” flexibly to refer to this concept of
representational bias. We avoid terms like “diversity” except when engaging with prior work that
specifically uses such language, since diversity’s focus on the mere presence of different groups,
rather than the degree or nature of their representation, has been rightfully criticized as insufficient
for meaningful social change [48, 49].

 J. ACM, Vol. 0, No. 0, Article 0. Publication date: 2021.

0:4 Metaxa et al.

Studying bias in the context of images
Race and gender are highly visible attributes: the body and visual cues such as skin color, hair
texture, and facial features convey information that helps viewers identify and classify others [49].
Diversity studies scholarship has largely focused on analyzing language; despite the ubiquity
of visual media, images have often been overlooked [49]. But images can convey information
instantaneously, considerably and unconsciously affecting viewers’ beliefs. Mere exposure to an
image, without any textual information, is enough to influence viewers’ attitudes [32]. In one high-
stakes example of racial representational bias in media, legal scholar Perry Moriearty has argued
that the overrepresentation of Black youth in the media as criminals has led to disproportionately
stricter policing and harsher sentencing [33]. Given the visual salience of race and gender (though
subjective to the viewer), the mosaic of images presented in image search results has the potential
to powerfully and unconsciously influence perceptions of the object of query and of the world.
 Visual diversity has been long-studied in advertising and marketing. Organizations like universi-
ties or companies may exaggerate their diversity, using marketing materials to make themselves
more attractive to prospective students [39], employees [2], or customers [15]. This strategy is
meant to appeal to people of underrepresented identities, inviting them to imagine themselves
in the place of racialized or gendered figures in an advertisement [39]. Further, exaggerating the
representation of a marginalized group also acts as a cue signalling “evidence of nondiscrimination,
as well as evidence that one’s identity is valued” [42]. This is not limited to the particular minority
group being overrepresented; for instance, researchers found that LGBT-friendly advertising sig-
nalled to consumers that a firm was also race- and gender-inclusive, despite making no explicit
mention of those categories [15].
 The purposeful persuasive intent in advertising contrasts with the seemingly impartial nature
of search engine results. Search engines today are like infrastructure, “ubiquitously and deeply
embedded, robust, widely shared, widely accessible, and essential” [40]. The production of search
results is hidden and invisible to users, many of whom who do not think twice about the process
that provides answers to their queries, just as the infrastructure of plumbing and water regulation is
overlooked when one turns on a tap [46]. As with other infrastructure, there is value to scrutinizing
these inner machinations: to quote the late sociologist and CSCW researcher Susan Leigh Star,
“[if you] study an information system and neglect its standards, wires, and settings, and you miss
equally essential aspects of aesthetics, justice and change” [46].

Search engines draw from and contribute to cultural narratives
Search engines are powerful mediators of information, with Google Search in particular dominating
the market in the United States; as of 2019, the estimated international market share of Google was
as high as 90%, with Baidu coming in a distant second at approximately 3% [47]. With such pervasive
and repeated use, search engines can perpetuate existing norms or stereotypes, presenting them in
a format that is widely used and trusted by users.
 Unfortunately, these narratives are frequently biased and discriminatory. The “colorblind fan-
tas[y] of the web” is a myth; recent research has shown that social prejudices and inequalities are
embedded in technological systems [23]. As Kay et al. demonstrated in 2015, image search results
exaggerate gender stereotypes of occupations [26]. Researchers studying Google’s auto-complete
suggestions also found evidence of racist, sexist, and homophobic stereotypes [4]. In one example,
an innocuous search for “unprofessional hairstyles for work” returned images of black women’s
hair [35]; in another, searches for racially associated names were more likely to result in ads at the
top of the search page suggestive of an arrest record [50]. In addition to the content generated by

J. ACM, Vol. 0, No. 0, Article 0. Publication date: 2021.
An Image of Society 0:5

the search algorithm, users’ own interactions—from the wording of queries to interactions with the
system over time—can introduce bias [6, 28].

Algorithms’ psychological and behavioral effects on users
While much work has studied the technological aspects of the algorithms themselves, comparatively
less discussion has focused on “algorithms in practice” [9], and the impact of these systems on user
behaviors and beliefs. Some prior work in this domain has studied political preferences, finding
that search rankings can sway undecided voters [17]. Outside the context of search, research has
found that visual cues in technical systems can also unconsciously influence users’ psychology, for
instance by triggering stereotype threat [10, 34] or threatening their sense of belonging [8, 31].
 Such work has shown that these unconsciously-communicated signals can lead to negative real-
world outcomes like lowering course performance or causing learners to self-select out of a learning
environment [27]. Other work in sociology shows that cultural beliefs, including stereotypes,
contribute to differential assessments of one’s own competence, and subsequent changes in career
aspirations [12]. The relationship of biased content consumption with users’ own cognitive and
psychological biases is bidirectional: prior work has also found evidence that users’ own biases
impact their consumption of image search content—finding, for instance, that “people who are rated
as more sexist according to the Ambivalent Sexism Inventory measure are less likely to recognize
gender biases in image search” [38].

Auditing Google Image Search
The potential for unintended harm to users of search and to society as a whole has motivated
researchers to critically examine algorithmic systems. The algorithm audit technique allows us to
probe an algorithm with carefully-chosen inputs and, by monitoring its outputs, to draw conclusions
about its opaque inner workings [45]. There are many approaches to conducting search algorithm
audits, including ethnographic and qualitative approaches [51] and centralized data collection
approaches [5]. Given the rate at which these algorithms change, auditors must often collect and
compare data longitudinally [43], or even daily [30, 44].
 This paper applies and extends Kay et al.’s 2015 audit methodology to quantify gender bias and
racial bias in occupation queries in 2020. In their work, Kay et al. investigated gender representation
in search image results for different occupations. They compared the proportion of men and women
in the image results to actual 2015 workforce proportions, and examined qualitative differences
in the ways men and women were portrayed in the images. Acknowledging the influence that
search engine results have on users, Kay et al. also studied how different levels of gender diversity
in search results affected users’ perceptions of the occupation and the search engine. This prior
work identified a systematic underrepresentation of women in Google Image Search results, and
found that the gender distribution of a results page could determine 7% of a person’s resulting
estimate of the prevalence of women in a given occupation. The effectiveness of Kay et al.’s audit
naturally raises the question of whether this method can be adapted to study other categories of
difference. For instance, race has been relatively less studied and, given the immense social harms
of racism, it is certainly a topic meritorious of attention in its own right. Given that Kay et al. also
established the effect of such images on users’ expectations about the external world, one might
ask whether image results interact with users’ internal states, such as psychological experience or
social identity.
 Determining representation in visual media is challenging—image labels from outside observers,
as are generally collected in such studies, do not truly capture the identities held by the individuals
in those images. Moreover, perception of categories like racial or gender identity may vary greatly
between viewers. Given these issues, why is representation worth studying? Prior work in media

 J. ACM, Vol. 0, No. 0, Article 0. Publication date: 2021.
0:6 Metaxa et al.

studies has argued that people’s identities and senses of self are constructed “in relation to others
and through symbolic structures,” including forms of mass media (like search media) [20]. In
other words, a viewer’s impression of the identity of a person in an image allows them to see
themself in the place of that person; this symbolic mirroring is a central reason that representation
matters [39]. A related concept from science and technology studies is situated knowledge, the idea
that the production and consumption of content reflects “particular and specific embodiments”—the
identities held and lived experience—of the viewer [25]. These key media studies concepts clarify the
theoretical importance of studying perceived visual diversity in sociotechnical systems, especially
as it relates to marginalized users.

RESEARCH QUESTIONS
Study 1: Comparing representation in image search results with the U.S. workforce
In Study 1, we compare the distribution of race and gender in common occupations from Google
Image Search results with prevalence in the U.S. workforce. We focus specifically on the U.S.
workforce (and consistently use U.S.-based annotators in Study 1 and participants in Study 2)
in order to compare longitudinally with Kay et al., and also as an attempt to control cultural
expectations and assumptions regarding representation and occupations that could impact the
images collected, crowdsourced data annotations, and participant judgements. We ask:
 (1) Do search results accurately represent the 2020 U.S. workforce in terms of representation of
 gender and race? We hypothesize, given results from 2015, that there will be evidence in our
 data that women and people of color (POC) are underrepresented in 2020.
 (2) Comparing with available 2015 data on gender representation, has the representation of
 women in image search results improved in the last half-decade? We hypothesize that, in
 light of recent social movements and political attention to these issues, search results will be
 more accurately representative than they were in 2015.

Study 2: Search results’ impact on users’ perceptions of occupations and themselves
Next we conduct a randomized controlled experiment with participants, focusing on occupations
where gender and racial disparities are most extreme. We examine the effect of image search results
on people’s perceptions of occupations, and their impact on people’s sense of their own place in
those fields. We ask:
 (1) Does increasing the representation of women and POC in search results impact participants’
 estimates of true rates of representation in those fields? In keeping with previous work, we
 expect that such representation will have a positive, linear relationship with estimates.
 (2) Does the representation of women and POC in search impact a participant’s sense of belonging
 in an occupation? We hypothesize that increasing the representation of marginalized people
 in search results will increase outcome measures such as interest in the occupation, perception
 of the occupation as inclusive, and expectation that people of one’s own race and gender
 would be valued therein, in particular for women and POC.
 (3) How do different axes of identity interact to affect participants’ experiences of search results?
 People simultaneously hold both gender and racial identities; similarly, the images of people
 used in our experimental conditions reflect both gender and race. Given previous literature
 on belonging (e.g., [8, 31]), we expect outcome effects to be mediated by participants’ own
 racial and gender identities. Therefore, we predict that each of these four characteristics—
 participant gender, participant race, gender composition in the stimulus images, and racial
 composition in the images—significantly contribute to participants’ responses.

J. ACM, Vol. 0, No. 0, Article 0. Publication date: 2021.
An Image of Society 0:7

STUDY 1: REPRESENTATION IN IMAGE SEARCH
In Study 1, we examine gender representation in image search results relative to representation in
the workforce, and compare with Kay et al.’s data from 2015. Our findings, in order of our research
questions, are: (1) image search results underrepresent both women and people of color relative
to 2020 U.S. population rates, and (2) women’s representation in search results has not increased
since 2015; in fact, women are slightly more underrepresented than before.

Study 1 Method
In the following sections, we describe the process for collecting and annotating gender and race
in images. In both of these analysis pipelines, recent data from the Bureau of Labor Statistics
(BLS) [36, 37] was used to establish the demographics of the U.S. labor force in 2019.1 Next, we
describe the process for selecting occupations, collecting image data, and annotating representation.
Annotating gender representation. First, we selected a set of occupations of interest, and search
query terms for them. This set was based on Kay et al.’s collected data of 45 occupations, plus
an additional 7 in case it was not possible to accurately label enough images for the original set.
Search terms were matched to the respective BLS categories (e.g., the BLS category “Police and
sheriff’s patrol officers” mapped to the search term “police officer”).
 Next, we collected a dataset of image search results by scraping the top 100 Google Image search
results using those queries in August 2019.2 To avoid in-session personalization effects, we ensured
that our scrapers were as anonymous as possible, using Selenium WebDriver with a separate
incognito scraping session for each occupation’s results. (Other forms of personalization in Google
Search have been found to be relatively minimal [44].)
 We then recruited crowdworkers through Amazon Mechanical Turk to annotate these images
for (1) the quantity of people in the image (none, one, or multiple), and (2) the gender of people in
the image (women, men, children, or unclear—checking all that applied).3
 To match the U.S.-based scraping of results and workforce data, crowdworkers were filtered to
U.S. location; to control for data quality, they were required to have over 1000 approved tasks, and
an approval rate over 95%. Each image was labeled by two annotators, and a third was recruited in
the case of disagreement to achieve a majority vote (if none emerged, the image was dropped and
excluded from future analysis). This resulted in an average of 60 annotated images per occupation;
one distant outlier, “welder,” had only 5 (it largely featured people in full-welding attire whose
gender and race could not be determined), and was dropped. This resulted in 51 occupations to be
analyzed for gender representation.
Annotating racial representation. We adapted this method to examine the distribution of race in
images. While the assumption of a gender binary is already tenuous and simplifying, racial identity
is very multi-dimensional and hard for viewers to consistently label from appearance. Acknowl-
edging this complexity, our focus in this work was to collect data relevant to the representation
of marginalized people in image search, so we asked crowdworkers to annotate (1) the quantity
of people in the image (none, one, or multiple), and (2) the race of people in the image (white,

1 For all occupations, we used the most recent data available, which in most cases was from 2019; in the case of two
occupations, opticians and telemarketers, this data was from 2018.
2 For the sake of clarity, throughout this paper we refer to the date of the Kay et al. study, published in 2015, as 2015, although

their data was collected in 2014 and compared to BLS data from 2012. Also for clarity, we reference the date of our data,
collected five years later, as 2020, though the scraped dataset and BLS data are both from 2019.
3 As we discuss elsewhere in the paper, While gender identity is not a binary and gender presentation is a separate axis

entirely, our method makes this simplifying assumption for the sake of comparison with binary BLS data.

 J. ACM, Vol. 0, No. 0, Article 0. Publication date: 2021.
0:8 Metaxa et al.

non-white, or unknown—checking all that applied). (We did not ask annotators to identify whether
images contained children, since this only caused ambiguity specific to gender annotation.)
 Similar to the annotation for gender representation, we sought consensus from annotators and
dropped occupations for which there were not enough images where annotators agreed on the racial
representation. As anticipated, the multi-dimensionality of racial identity complicated consensus,
resulting in 40 occupations for racial representation analysis.
Data validation. For both the subset of 51 occupations in which we study gender and 40 in which we
examine race, we validate that this subset of occupations is not statistically significantly different
from the overall list of over 500 occupations provided by the BLS. To do so, we conduct a series
of Kolmogrov-Smirnov tests comparing the BLS-reported distribution of gender and ethnicity
representation in the gender and race occupation subsets with the superset of all occupations, using
bootstrap -values to allow for non-continuous distributions and ties. We did not find evidence that
our two data subsets were significantly different from the set of all BLS occupations, and therefore
felt comfortable proceeding to use these subsets in the following analyses.
 Specifically, in our dataset of 51 occupations for studying gender representation, we found no
significant differences from the full BLS data set in all categories supplied by the BLS: gender
distribution ( (51,564) = 0.094, = 0.793), distribution of Asian people ( (51,564) = 0.119, = 0.461),
distribution of Black or African-American people ( (51,564) = 0.064, = 0.978), or distribution of
Hispanic/Latinx people ( (51,564) = 0.139, = 0.332). In our dataset of 40 occupations for studying
racial representation, we again found no significant differences from the full BLS data set in gender
distribution ( (40,564) = 0.120, = 0.659), distribution of Asian people ( (40,564) = 0.139, = 0.443),
distribution of Black or African-American people ( (40,564) = 0.092, = 0.894), or distribution of
Hispanic/Latinx people ( (40,564) = 0.164, = 0.277).

Study 1 Findings
We begin by comparing Google Image Search results with BLS data to identify whether there is
evidence of stereotype exaggeration or systematic under-representation of women or people of
color. We find evidence of under-representation on both axes—in an occupation of 50% women, our
model predicts 42% of images would be of women, and in an occupation of 22% people of color, it
predicts 16% would contain people of color (50% women and 22% POC are baselines proportional
to overall workforce participation rates).
 Next, we compare gender representation in Google Image Search in 2015 to 2020 to ascertain
whether the degree of women’s under-representation has lessened in that time. After accounting
for changes in the underlying population, we do not find evidence to support our hypothesis that
2020 data would be more representative than 2015 data.
Under-representation and stereotype exaggeration. Following Kay et al., we investigate stereotype
exaggeration, the idea that discrepancies between ground truth and image search data would be
greatest at the extremes. To do so, we fit two models to the data, one with an S-shaped curve that
captures stereotype exaggeration, and the other without. The stereotyped model regressed the
logit of the proportion of the marginalized group in search on the proportion reported by the BLS,
while the non-stereotyped model regresses the logit of the proportion in search on the logit of the
proportion reported by the BLS.
 We compare the two models using Vuong’s test for closeness of fit for non-nested models, and
find that for gender, the stereotyped model is a significantly better fit ( = 1.85, = 0.03), and that
for race neither model is preferred ( = 1.17, = 0.12). Given these results, we conclude that there
is some evidence of stereotype exaggeration in the gender dataset, though we cannot conclude the
same in the race dataset. In the next analysis quantifying the degree of under-representation, we

J. ACM, Vol. 0, No. 0, Article 0. Publication date: 2021.
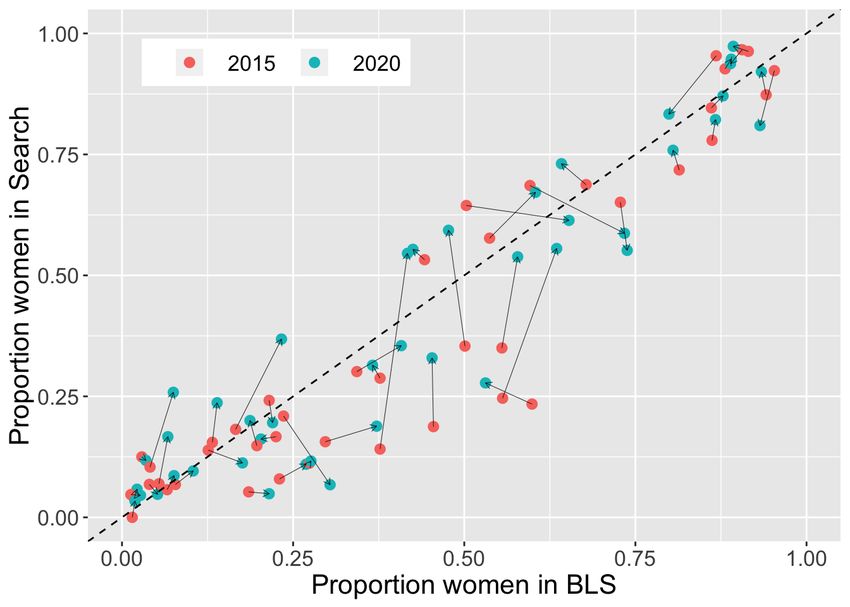
An Image of Society 0:9

Fig. 1. Stereotyped models (with a slight S-shaped curve representing stereotype exaggeration) fitting real-
world data from the BLS with search data, comparing changes in representation of women in occupations
from 2015 (left) to 2020 (right).

use the stereotyped models, visualized in Figures 1 (featuring gender, alongside the model used in
Kay et al. fitted to the 2015 dataset) and 2 (featuring race).
Does image search reflect BLS data in 2020? Having chosen models representing the relationship
between image search and BLS representation, we examine them to interpret the degree of marginal-
ized underrepresentation in our data. To do so, we check whether the coefficient of the model’s
intercept is significantly different from zero when the x-intercept is set to 50% women in the BLS,
or 22% people of color (values that would reflect workforce-proportional representation). We report
the intercepts along with their estimated effects (unstandardized coefficients, ), 95% confidence
intervals, -statistics, and -values below.
 • Gender: The intercept has a significant effect in this model ( = −0.31, 95% CI: [−0.52, −0.11],
 50 = −2.96, = 0.005), corresponding to an odds ratio of approximately 0.73 (95% CI: [0.59,
 0.90]). In other words, in an occupation with 50% women, we would expect about 42% of
 search images to be women on average (95% CI: [37.4%, 47.4%]).
 • Race: The intercept also has a significant effect in this model ( = −1.63, 95% CI: [−1.80, −1.47],
 39 = −19.48, < 0.001), corresponding to an odds ratio of approximately 0.20 (95% CI: [0.17,
 0.23]). In an occupation with 22% people of color, we would expect an average of about 16%
 of search images of people of color on average (95% CI: [14.2%, 18.7%]).

Five years later: Comparing 2020 to 2015. We next compare our data to Kay et al. data from 2015 to
determine whether image search results have improved in that time. We only perform this analysis
for gender, since we do not have search or BLS racial composition data from 2015.
 Initially, we can naively perform a pairwise comparison for each occupation in common between
the two datasets to test whether the representation of women is higher in 2020—which on average
was 41.4%—than it was in 2015—when it was, on average, 37.3%. A paired Wilcoxon signed rank test
indicates that the proportion of women in image search results is statistically significantly higher
in 2020 ( = −2.81, < 0.01). However, this analysis does not take into consideration shifts in the
representation of women in occupations in real life, which has also improved. A paired Wilcoxon
signed rank test for proportion of women in BLS data indicates that there has also been an increase
in the prevalence of women in the workforce from an average of 41.6% to an average of 43.4%.
 To control for this shift in the workforce, we instead consider whether search data is any closer to
proportional to real life than it was before. To do so, we compute a distance measure by subtracting

 J. ACM, Vol. 0, No. 0, Article 0. Publication date: 2021.
0:10 Metaxa et al.

Fig. 2. Model fitting real-world data from the BLS with search data, comparing the representation of people
of color in image search results for occupations with BLS data in 2020. (Note the different axis limits from
Figure 1.)

Fig. 3. Comparing changes in the proportion of women in the force and in search, by occupation, between
2015 and 2020, with the dashed = diagonal representing a perfect correspondence between BLS and
search gender representation.

search from BLS for each data point; see Figure 3 for a visualization of these changes in two-
dimensional space. These differences are essentially a form of error; we can compute the mean
square error for both time points, which shows that they are very similar (0.012 in 2014 and 0.014
in 2020). Were image search results closer to representative in 2020, we would expect these errors
to be smaller than they were in 2015. However, using a Wilcoxon signed-rank test to evaluate
the difference between the paired distributions of errors, we find that they are not statistically
significantly different ( = −1.54, = 0.12).

J. ACM, Vol. 0, No. 0, Article 0. Publication date: 2021.
An Image of Society 0:11

 To confirm this finding another way, we fit a linear mixed model to predict the proportion of
women in image search results from the year, the proportion in occupations according to the BLS,
and a random effect for each occupation. If image search were more representative in 2020, we
would expect year to be a significant predictor when controlling for BLS ground truth (as this model
does). However, as recorded in Table 1, only the BLS proportion of women is a strong predictor
( < 0.001). Therefore, we conclude that we do not find evidence that image search has significantly
improved in gender representation since 2015.

STUDY 2: BIAS AND BELONGING
Visual diversity in image search results is significant for its potential to influence users of a system,
both consciously and unconsciously. To explore this relationship, in Study 2 we expose randomized
controlled study participants to a synthetic image search results page with one of three levels of
gender or racial representation, and measure the effect on participant perceptions of the occupation
and its racial and gender inclusivity.
 In order of our research questions, we find: (1) echoing findings from Kay et al. and extending
them to race, increasing women’s representation in search increases participants’ estimates of
women’s representation in occupations, and the same holds for non-white representation; (2) levels
of gender and racial representation in image search results significantly impact all outcome measures
including participants’ interest in an occupation, sense of its inclusivity, and expectation of being
valued; and (3) while representation significantly impacts these measures, participants’ own gender
and racial identities have the largest effect on their experiences of search results.

Study 2 Method
Selection of occupations. From our motivation to study marginalization, we selected the ten oc-
cupations from our list of occupations in Study 1—five for gender and five for race—in which
marginalized people—women and people of color, respectively—are most heavily underrepresented
in the labor force.4
 For each of these occupations, we generated three mock search pages, each with ten images,
exactly in the style of a Google Image Search page (Figure 4). The three mock search pages were
each conditions in our experimental design: for the gender experiment one mock search page had
10% women, the second had 50% women, and the third 90% women. Similarly, for race the first
condition had 10% images of people of color, the second 50%, and the third 90%. Notably, since we
selected these occupations due to their very low levels of representation of women and people of
color, the first condition (10% marginalized) was close to accurately reflecting proportions in BLS
data as well as real Google Image Search data, while the other two conditions both substantially
overrepresented marginalized people relative to BLS data, and relative to Google’s search results
4 Forthe occupation “plumber” there were not enough images of people of color to construct stimuli, so we instead selected
the next occupation.

Table 1. We compare image search gender representation from 2015 with 2020 using a model predicting
proportion women in search from year and underlying proportion women according to the Bureau of Labor
Statistics, and do not find evidence that representation in image search has improved.

 Est. SE df
 (Intercept) -0.023 0.026 51.5 -0.88 0.384
 Year 0.025 0.017 42.1 1.45 0.16
 % Women in occupation (BLS) 0.95218 0.04742 42.16792 20.079 < 0.001 ***

 J. ACM, Vol. 0, No. 0, Article 0. Publication date: 2021.
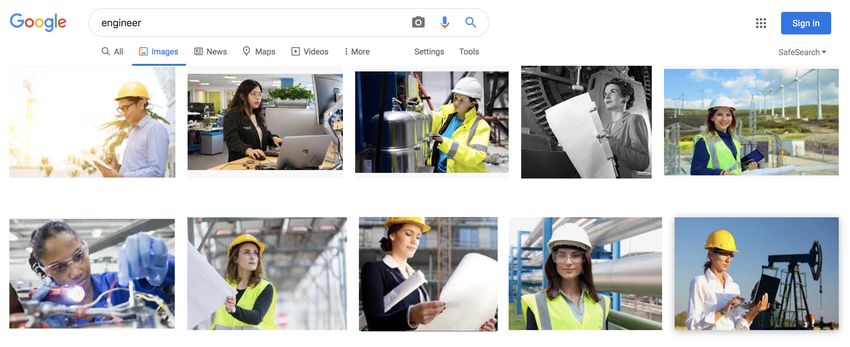
0:12 Metaxa et al.

 Experiment Occupation BLS p_women BLS p_POC GIS p_women GIS p_POC
 Gender Construction worker 0.04 0.15 0.11 0.13
 Gender Engineer 0.14 0.28 0.19 0.14
 Gender Truck driver 0.07 0.25 0.16 0.11
 Gender Electrician 0.02 0.13 0.05 0.14
 Race Author 0.64 0.10 0.52 0.20
 Race Chief executive officer 0.28 0.11 0.15 0.19
 Race Veterinarian 0.68 0.10 0.56 0.03
 Race High school teacher 0.57 0.13 0.41 0.09
 Both Pilot 0.08 0.06 0.24 0.13

Table 2. To study the impact of image search results on participants, we selected five occupations for gender
and five for race. Here we report the proportion of the occupation who are women or people of color (POC)
as reported by the Bureau of Labor Statistics (BLS), and in Google Image Search (GIS) as found in Study 1.

(for summary statistics on the occupations selected, see Table 2). We chose this wide range of
conditions, rather than only testing current levels of underrepresentation, for several reasons. First,
we sought to experimentally validate the impact of search results on users by investigating whether
different levels of representation in search images would affect users differently. Second, we wanted
to examine the user impact of current levels of underrepresentation alongside options from the
breadth of possible changes that could be made to rectify the issue, including equal representation
and overrepresentation. And third, by using this range of conditions we could measure whether
participants holding marginalized and non-marginalized identities responded similarly when their
own identity was over-, under-, or equally represented in the stimuli.
 We constructed each of these pages manually, using the gender and race labels collected in Study
1. We selected images in order of their appearance in the real image search results, prioritizing
images of only one race or gender (resorting to using images labeled “both” when there were not
enough after manually verifying that the marginalized person was the central focus of the image).
 The final occupations selected for gender were electrician, engineer, construction worker, truck
driver, and pilot. For race, they were veterinarian, pilot, chief executive officer, author, and high
school teacher. Note that both women and people of color are heavily underrepresented among
pilots, so that occupation was included twice, with two different sets of stimuli constructed (see
Table 2).
Survey design. Participants were recruited through Amazon Mechanical Turk and directed to
a Qualtrics survey which consented them under the pretense that the study was about public
perception of common occupations, without mention of the different experimental conditions. This
deception was necessary in order to avoid biasing participants in advance or drawing their conscious
attention to the likely unconsciously-processed aspect of representation. This experimental design
was approved by our university’s Institutional Review Board.
 Participants were randomly assigned to a condition and shown one of the three mock search
pages for that occupation. On the next page of the survey, participants were asked a series of
distracting questions including their estimate of the education level typical of the occupation, their
perception of its prestige, and their estimate of how quickly it is growing.
 They were then asked to estimate what percent of jobs in that field were held by women, and
what percent were held by POC. Finally, to study their sense of belonging, participants were asked
a series of 7-point Likert scale questions: their personal level of interest in joining the profession

J. ACM, Vol. 0, No. 0, Article 0. Publication date: 2021.
An Image of Society 0:13

 (a) 10% women (b) 10% POC

 (c) 50% women (d) 50% POC

 (e) 90% women (f) 90% POC

Fig. 4. Example mock image search results pages, on the left showing the three levels of gender composition
for the query “engineer”, and on the right three levels of racial composition for the query “author”.

(“not at all interested” to “extremely interested”); their perception of the field’s inclusivity (“not at
all inclusive” to “extremely inclusive”), whether they felt that people of their gender are valued in
the field, and whether they felt that people of their race are valued in the field (both from “not at
all valued” to “extremely valued”).
Participants. Approximately 100 participants were recruited using Amazon Mechanical Turk for
each of the 10 occupations. Participants could complete each survey, but at most once—they were
restricted to see only one randomly assigned mock image search page per occupation (meaning
that for the “pilot” occupation, participants only participated in one of the two experiments). The
median age of participants was 25-35, with most holding an undergraduate degree. The majority of
participants identified as men: 65% of respondents were men, 34.7% were women, and 0.3% were
non-binary. In the subsequent analyses, we grouped women and non-binary participants together,
since all belong to marginalized gender identity groups; in the remainder of analyses we refer to
the two groups as men and non-men. The sample was also majority white: 76.3% of respondents
identified their race only as white, and the remaining 23.7% identified with at least one non-white
group, including 8.6% as Black or African-American, 5.0% as Asian, 3.8% as Hispanic/Latinx, and
the remaining 6.1% as a combination of the above. Following the rationale laid out in Study 1, in
the subsequent analyses we group participants by marginalized identity status into two groups:
whites (those identifying only as white) and people of color (all other participants).

 J. ACM, Vol. 0, No. 0, Article 0. Publication date: 2021.
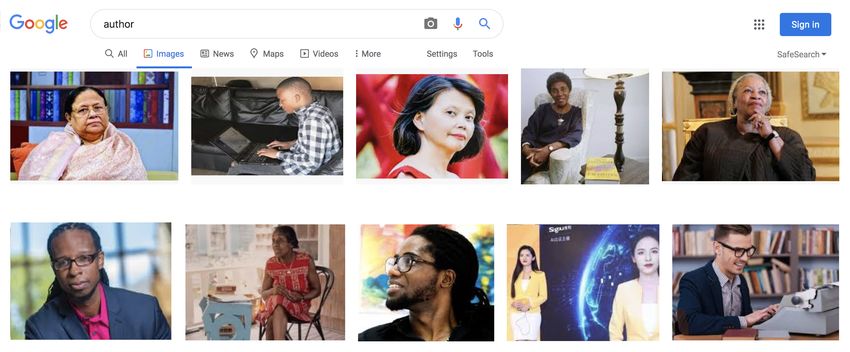
0:14 Metaxa et al.

Fig. 5. We observe a small positive linear relationship between participants’ estimated proportion of women
in the field when shown increasing levels of women’s representation, and of people of color in the field when
shown increasing levels of POC representation.

Study 2 Findings
In the following analyses, we examine the effect of different distributions of people by race or
gender on participants’ evaluations of occupations and their perception of their own place in them.
We also examine potential differential effects by the participant’s own racial and gender identity. (In
reporting the coefficients of statistically significant variables, we use to denote the unstandardized
effect size, and to denote the standardized effect size.)
Impact of image representation on perception of the field. We first examine the impact of image
representation on people’s perceptions of the prevalence of marginalized groups in occupations,
for both gender and race. A visualization of these results is shown in Figure 5. Overall we find that,
as expected, participants’ perceptions of a field are significantly influenced by search results, an
empirical finding that confirms the importance of representation in the images shown by search
engines and their potential to affect people’s impressions of the world.
 We fit a linear mixed model to predict participants’ estimated proportion of women and of people
of color by condition. Following Kay et al., we include a random effect for each participant to account
for individual differences estimates since participants could answer for multiple occupations. In
predictions of gender representation, we find that the proportion of women in search results has a
small but statistically significant positive linear relationship with people’s estimates; there was a
roughly 5% increase in their estimates between conditions ( = 5.33, < 0.001). The model has
a low marginal 2 (which describes the model fit taking into consideration its fixed effects) and
much higher conditional 2 (which also factors in the explanatory power of the random effect,
participant). This reflects that there was a great deal of individual variation in these estimates
 2 = 0.03, 2 = 0.68). We find similar results for race, namely that the proportion of people of
(
color in the image had a statistically significant linear positive impact of similar magnitude on
people’s estimates of racial representation ( = 4.19, = 0.001). This model also showed a large
difference in conditional versus marginal 2 ( 2 = 0.01, 2 = 0.60).

Impact on inclusivity and interest. In addition to asking participants about their perception of the
gender and racial breakdown of the occupations, we also asked four questions targeted at their
own sense of belonging: their level of interest in the occupation, how inclusive they would rate
it, how much they thought someone of their gender would be valued in it, and how much they

J. ACM, Vol. 0, No. 0, Article 0. Publication date: 2021.
An Image of Society 0:15

(a) Overrepresenting women and people of color (b) Increasing representation of people of color
relative to population rates increases perception increases interest in the field, while increasing
of field inclusivity. the representation of women does the opposite.

Fig. 6. Bucketing both proportion of women and proportion of POC in the mock search image into thirds
(labelled “low,” “medium,” and “high” representation), we visualize their interaction on participants’ perceived
field inclusivity and personal interest.

thought someone of their race would be valued in it. We analyzed the effect of four independent
variables—the proportion of women in the search results, the proportion of POC in the results, the
participant’s gender, and the participant’s race—on the four dependent outcomes of interest, using
four linear regressions with fixed effects (we do not include participant as a random effect here
because we are already explicitly including aspects of participant identity as fixed effects). In each
of the findings below we report the model’s 2 , along with any significant effects’ standardized
coefficients ( ) and -values.5
 • Inclusivity: Overall, we find that search results with the fewest women and fewest people of
 color (images that are both reflective of real-world representation and current image search
 results) result in the lowest inclusivity ratings. In this model ( 2 = 0.05, (4,989) = 11.6, <
 0.001), both gender representation ( = 0.146, 95% CI [-0.16, 0.45], < 0.001) and racial
 representation ( = 0.143, 95% CI [-0.20, 0.48], < 0.001) significantly predicted participant
 ratings of field inclusivity. We visualize these results at left in Figure 6.
 • Interest: We find that higher proportions of people of color in images led to higher levels
 of interest in the occupation for all participants, though this was not true for gender ( 2 =
 0.02, (4,989) = 5.153, < 0.001). The regression indicated that proportion of people of color
 ( = 0.103, 95% CI [-0.33, 0.53], = 0.001) significantly predicted interest, but that the
 proportion of women had a borderline (though slightly deterring) effect at most ( = −0.065,
 95% CI [-0.45, 0.32], = 0.03). We visualize this in Figure 6 at right.
 • Gender valued: Results confirmed our hypothesis that increasing the proportion of women in
 search results had significant and differential effects on men’s and non-men’s expectations
 they would be valued (see Figure 7). At the simplest level, when asking if participants
 felt people of their gender would be valued, non-men reported more doubts than men,
 regardless of race ( = 5.33, = 4.00). The regression ( 2 = 0.18, (5,989) = 44.8, < 0.001)
 supported our hypothesis that participant gender ( = −0.653, 95% CI [-1.00, -0.30], <
 0.001) significantly affected this measure. Similarly, the proportion of women in the images
 significantly impacted whether participants felt people of their gender would be valued
5 Wenote that the effects reported remain significant at the < 0.05 level after applying a Benjamini-Hochberg multiple
comparisons correction across all four models.

 J. ACM, Vol. 0, No. 0, Article 0. Publication date: 2021.
0:16 Metaxa et al.

(a) As proportion of women increased, men re- (b) The proportion of POC shown had little ef-
ported expecting to feel less valued and non-men fect relative to the overall expectation by POC
more valued, regardless of race. participants that they would be less valued.

Fig. 7. Changing the proportion of women and people of color in images shifted participants’ expectations
that someone of their gender or race would be valued in the occupation differently by identity group. (Wm =
White men; Wn = White non-men; Pm = POC men; Pn = POC non-men.)

 ( = −0.21, 95% CI [-0.56, 0.16], < 0.001). Notably, search results with more women had
 opposite effects on men versus non-men, with this interaction effect ( = 0.37, 95% CI [-0.25,
 0.98], < 0.001) reflecting that increasing the proportion of women made men feel they
 would be less valued but made non-men feel they would be more valued. The proportion of
 people of color in the images also had a positive effect on expectations of gender inclusivity,
 though this was weaker ( = 0.07, 95% CI [-0.27, 0.40], = 0.02).
 • Race valued: The experimental manipulation for race was less impactful of participants’
 perceptions; rather, the strongest predictor of whether a participant felt someone of their
 race would be valued was that participant’s race ( = 5.43, = 4.04), regardless imagery
 shown. The regression ( 2 = 0.16, (5,988) = 46.6, < 0.001) reflected that participant race
 was a highly significant predictor ( = −0.41, 95% CI [-0.73, -0.09], < 0.001), followed by
 smaller and less significant effects: the proportion women ( = −0.08, 95% CI [-0.35, 0.19],
 = 0.009), and participant gender ( = 0.07, 95% CI [-0.12, 0.25], = 0.02). Unlike the
 corresponding result on the previous measure, we did not observe a significant interaction
 effect between image and participant race (see Figure 7).
 All models, despite having significant results, have low 2 values, suggesting that there is a great
deal of individual variability in these measures. We also observe that the standardized regression
coefficients in all models reflect that increasing the proportion of women or people of color in these
images did not consistently improve measures of interest, and sometimes had the opposite effect.

DISCUSSION
Despite increasing attention to algorithmic bias and social movements like #MeToo and Black Lives
Matter calling attention to social injustice more broadly, in Study 1 we find that women and people
of color are underrepresented in search results for common occupations. In Study 2, we find that
these search results influence people’s perceptions of occupations and their own sense of belonging
therein, and that these impacts are dependent on one’s own gender and racial identity.
 It is important to note that achieving greater representation in search may not always translate
into desirable real-world outcomes. For instance, in the difference between perceived occupation
inclusivity and peoples’ interest in them: as Figure 6 reflects, increasing numbers of women in
search results increases the perception that an occupation is inclusive, but decreases overall interest

J. ACM, Vol. 0, No. 0, Article 0. Publication date: 2021.
An Image of Society 0:17

in that occupation for all participant groups except women of color. This may be an example of what
sociologists term “occupational feminization” and the closely related idea that pay and other status
markers in occupations decrease as the proportion of women in them increases [29]. Algorithm
designers must be prepared to anticipate, measure, and evaluate the socially situated impacts of
their work, lest such second-order effects of well-intentioned efforts do more harm than good.
 Separately from features of search results, participants’ own identities are the strongest predictors
for how search images are received in our data. Across three of the four measures (all but occupation
interest) we see the same trend: white men report the most positive expectations, while non-white
non-men report the least. This is yet another reflection of white male privilege and the importance
of intersectionality—the compounding weight of holding multiple marginalized identities [14]. This
suggests that without wider social change even the best efforts of technologists to inclusively build
or to de-bias our technologies may come up short. Users’ prior life experiences come with them to
their experience of a system, mediating the interactions they have with it and the impact it has on
them. Recent work has shown that aspiring towards fairness in terms of numerical representation
matters less than creating a culture of inclusivity [41]. To ensure that our systems avoid reproducing
unjust social patterns and structures, we must design, build, and audit our systems—paying careful
attention to its least privileged users. But we must also recognize our users’ underlying and more
fundamental need for equity and justice in their lives, and strive to make that a reality.

Limitations and Future Directions
While we believe this work is a worthwhile contribution to an important literature, we must also
call attention to its methodological and theoretical limitations. To begin, we acknowledge the
methodological limitations of conducting this audit; for instance, the queries used to collect the
data in Study 1 and to which participants were exposed in this work are not necessarily naturalistic
user queries. We believe they are a good stand-in, and especially valuable as they allow us to
compare longitudinally with prior work, but they are not necessarily ecologically valid, and more
work needs to be done on users’ actual experiences with image search over time, including real
queries used and compounding effects of repeated exposure to online images. Additionally, in
Study 2 we only used three discrete conditions despite the much larger range (0% to 100%) of
possible representation levels, so constrained to concentrate the number of participants allocated
to each condition. This allowed us to effectively evaluate our concepts of interest, but a more
nuanced experiment would strengthen the conclusions that could be drawn regarding the results of
images on users. We also did not control for participants’ prior level of familiarity with occupations,
which could mediate (either exaggerating or weakening) the degree to which image search results
impacted their perceptions of occupations.
 A more important limitation, perhaps, is the coarse-grained categorization of people’s identity
upon which this work relies. We have used an explicitly intersectional framing that considers
gender and racial identity, but those two axes of identity are both continuous, with a wide range
of identities much more nuanced than the binary categories we use for analysis. We make these
simplifications in light of previous research on the broad effects of diversity cues and shared
experiences of marginalized people (e.g., [8, 41]), but we wish to emphasize that these identity
categories are not monoliths. Each includes a wide range of experiences and cultures (for instance
those specific to non-binary people as distinct from women and men, or ethnically Latinx people
separately from non-Latinx people sharing the same racial identity) and the range of responses to
visual representation is equally wide. As organization behavior scholars have found in studying
workplace dynamics, though perceptions of workplace diversity do depend on a job seeker’s identity,
its impacts vary by the strength of a job-seeker’s other-group identification: “although minorities
generally might place greater value on diversity than members of the racioethnic majority, there

 J. ACM, Vol. 0, No. 0, Article 0. Publication date: 2021.
You can also read