Voice Assistants in Cars - Dream or Nightmare? - University of ...
←
→
Page content transcription
If your browser does not render page correctly, please read the page content below
Voice Assistants in Cars - Dream or Nightmare?
                                                 The effects of voice assistants on
                                              trust, emotions and purchase intention

                                                          Author: Anna-Maja Wolf
                                                            University of Twente
                                                      P.O. Box 217, 7500AE Enschede
                                                             The Netherlands

ABSTRACT
Over the past years, voice assistants have become a constant companion in people’s daily lives. Not only are
they used during day-to-day activities as calling someone, ordering food, or asking for the weather, but they are
additionally supporting people during their drive to work, friends, or holidays. Current literature found that
negative emotions lead to an increase in a risk-supporting attitude and more accidents. This study examines the
effects of voice assistants on trust and purchase intention and emotions as stress, anger, confusion, and
concentration. A scenario-based 2 (gender: male vs. female) x 2 (humanity: human vs. computer) x 2 (time of
recording: day vs. night) experiment was created with a total of 256 German participants between 18 and 50+
years. The multivariate analysis of variances showed that humanity influences the felt emotions and the purchase
intention. Respondents who heard a human voice experienced a lower level of stress and anger and a higher
possibility to concentrate. Furthermore, they were more likely to purchase a car having a human voice assistant.
Additionally, the study revealed a significant interaction effect between gender, humanity, the time of recording,
and stress, meaning that a higher stress level was found when the voice was an artificial voice taking into account
the gender and recording time. These findings suggest that using a voice assistant in cars might be helpful and
supporting and would decrease the negative emotions when a human voice is used instead of an artificial one.

Graduation Committee members:
First supervisor – dr. C. Herrando
Second supervisor – dr. E. Constantinides

Keywords
Artificial Intelligence, Voice Assistants, Emotions, Driving Behavior, Trust, Purchase Intention,
Stress, Anger, Confusion, Concentration

   This is an open access article under the terms of the Creative Commons Attribution
   License, which permits use, distribution and reproduction in any medium, provided
   the original work is properly cited.
                                                                                            CC-BY-NC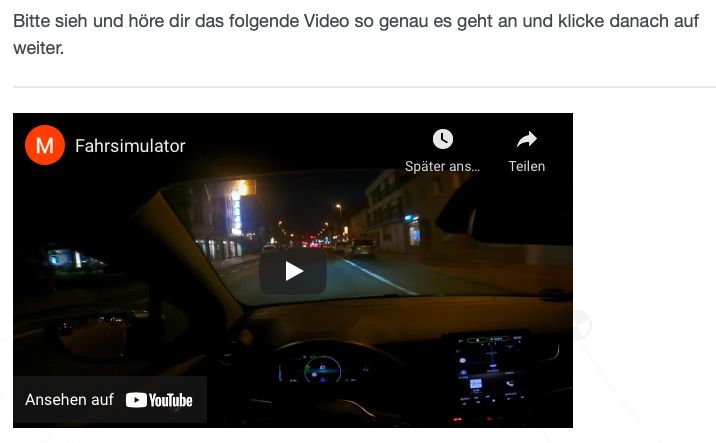
1. INTRODUCTION                                                        digitally shown. Generally, there are three different bits of AI
                                                                       intelligence: mechanical, thinking, and feeling (Huang & Rust,
1.1 Academic Relevance                                                 2021). Feeling AI is constructed for the bi-directional
The emotional state drivers experience while driving has               interaction implicating humans and/or additionally for
influences on their driving performance. Negative emotions as          interpreting hominid perceptions and emotions (Huang & Rust,
anger, frustration, or sadness lead to a decrease in their driving     2021). The purpose is to interpret current and future consumer
performance and endanger road safety for all other drivers             desires (Huang & Rust, 2021).
(Braun, Schubert, Pfleging, & Alt, 2019). Therefore, it is             Voice Assistants are a sample of speech-empowered artificial
crucial to increase the driver's emotions to ensure a safe drive       intelligence (Poushneh, 2021). They allow customers to use
for them and their travelers (Eyben et al., 2010). A helpful tool      various functions without the need to interact directly with
often used in cars to relieve the drive for the driver are in-voice    other people. These functions can include navigation, listening
care assistants, hereafter VA. The possibility of a vehicle            to music, sending messages, managing smart home systems,
interacting with the driver and serving as a virtual partner is        calling somebody, ordering a meal, or a ride home (Poushneh,
seen as a great opportunity for current and future cars (Eyben         2021). Voice Assistants have the ability to raise positive
et al., 2010). It will help increase driving safety (Eyben et al.,     affirmations, decrease discouragement and contribute
2010) as it serves as virtual assistance which adds to the             positively to social communication (Kachouie, Sedighadeli,
security of driving (Bubb, 2003). Generally, the driving               Khosla, & Chu, 2014).
performance is influenced by the current emotional state of the        Current studies highlight that the use of in-voice assistants
driver as some abilities, like focus and attention or                  influences driving behavior. The interaction with a virtual
communication, are dependent on the present emotions (Eyben            assistant affects the personal attitude, performance, or behavior
et al., 2010). When considering the driver's responsibility over       (Harris & Nass, 2011). Herby, differences in the different
his passengers and other road members, it is crucial to keep the       genders have been found. Female drivers perceived a VA
driver in an emotional state that suits the driving task best          helpful in low and high traffic locations and mentioned that the
(Eyben et al., 2010). Resulting also in a proper fit of the voice      in-voice assistant had an increasingly positive effect on their
assistant, as it supports the driver in the performance of primary     driving performance (Jonsson & Chen, 2007). However, male
driving tasks (Bubb, 2003) and, therefore, indirectly influences       drivers preferred the assistant more in low traffic locations than
the emotional state (Eyben et al., 2010). Primary driving tasks        in high traffic situations as they were afraid of being distracted
include all the tasks directly related to the drive, like the choice   by it (Jonsson & Chen, 2007).
of the lane, the speed, the route, or the space between the own
car and the front car (Bubb, 2003). The voice assistant's
interaction is operated as a secondary driving task (Braun et al.,     2.2 Trusting the Voice Assistant
2019). A study conducted by Agrawal, Giripunje & Bajaj                 Trust can be described as one’s compliance to be dependent on
(2013) tried to recognize drivers' emotions during their drive         something else due to the abilities of the opposite (Mcknight,
using a technology system called Fuzzy Rule-Based System.              Carter, Thatcher, & Clay, 2011) and plays a fundamental role
The system had an accuracy of 90% (Agrawal, Giripunje, &               in supporting users to overcome their consciousness of hazard
Bajaj, 2013). This shows the possibilities of today's                  and uncertainty when using and approving the latest technology
technologies to interact with the driver based on the previously       (Li, Hess, & Valacich, 2008). Another definition of Mayer,
identified emotional state. Furthermore, it can be said that if the    Davis & Schoorman (1995) describes trust as “the willingness
voice of the car assistant matches the drivers' current emotional      of a party to be vulnerable to the actions of another party based
state, it increases the bond between the driver and the assistant      on the expectation that the other will perform a particular action
and replaces the role of a co-driver (Eyben et al., 2010).             important to the trustor, irrespective of the ability to monitor or
The assistant's voice plays an essential role as well as the           control that other party” (Mayer, Davis, & Schoorman, 1995,
characteristics it has, whether it is a male or a female voice or      p.712). Trust is a central element in every situation where
if it is human likely or not (Jonsson & Chen, 2007). The               skeptics exist or where unpredictable events are imaginable
increasing usage of in-car assistants makes it curial to               (Fukuyama, 1997). When deciding whether to trust new
understand the driver's emotions and the influence the voice           technology, users decide on the available knowledge and
assistant has on them. It could be that the VA's characteristic        current recognition of the technology (Moore & Benbasat,
influences the emotional state of the driver. As safety is the         1991). Factors influencing trustworthiness are, for example,
most important aspect in designing cars and implementing               gender or speech quality (Schwieren, 2020). On the other hand,
VAs, it is essential to know which impacts different                   users are unlikely to trust the new technology and interact with
characteristics of the VA might have on the driver.                    it when they recognize a serious risk related with it (Agarwal
                                                                       & Prasad, 1997). Generally, trusting in a precise technology
                                                                       means that one believes the technology has the required
1.2 Research Question                                                  abilities to behave and perform in the safest manner during a
The research question of this thesis therefore is:                     situation which could lead to negative outcomes (Mayer et al.,
Which effects have the use of voice assistants on the drivers'         1995). When analyzing the trustworthiness of a new
emotional state?                                                       technology, a study from Lankton, McKnight, & Tripp (2015)
                                                                       distinguished between “system-like and human-like
                                                                       technology” (Lanktop, McKnight, & Tripp, 2015, p.881).
2. THEORETICAL BACKGROUND                                              Human-like technology is defined as seeing the technology as
2.1 Artificial Intelligence in Voice                                   a human-being while measuring trust (Lankton et al., 2015).
                                                                       The trust is measured utilizing the human-like trust design
Assistants                                                             consisting of benevolence, ability, and integrity which
Artificial Intelligence (AI) is the expansion of computers to          originally have been used to estimate interpersonal trust
interact in humanoid processes like learning, analyzing, and           (Lankton et al., 2015). Benevolence can be defined as the
interacting (Kok, Boers, Kosters, Van der Putten, & Poel,              acceptance that the agent will act in the best behavior for the
2009). According to Poushneh (2021), AI is the intelligence to         trustor, without egocentric motives (Mayer et al., 1995). Ability
imitate and interact with a human attitude which is often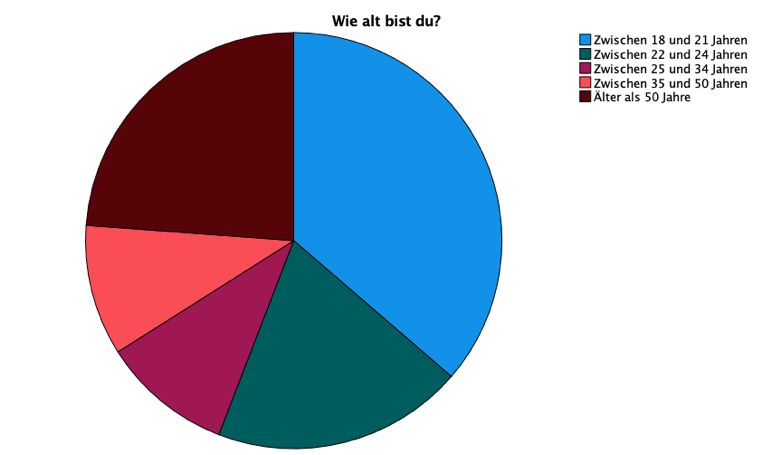
is the trust that the agent has the necessary skills and             Otterbache & Talias, 2017; Stroessner & Benitez, 2019).
competencies to perform the tasks (Mayer et al., 1995). Lastly,      Therefore, the hypothesis H4a and H4b concentrate on the
integrity is the belief of the agent operating consistently and in   influence gender has on the emotional state.
line with given principles (McKnight et al., 2011).
Additionally, when deciding to purchase a voice assistant,           H4a: The driver's emotional state is positively influenced if the
individuals are influenced not only by their trustworthiness but     VAs gender is female.
also by the expressed emotions and behavior of them
(Poushneh, 2021). Based on the presented literature, the first       H4b: The driver’s emotional state is negatively influenced if the
two hypotheses have been developed.                                  VAs gender is male.

 H1: Trust in a VA is higher when the VA has a human-likely
voice than when the VA has a robot-likely voice.                     2.4 Driving behavior under the influence of
                                                                     emotions
H2: Trust in a VA is higher when the VA has a female voice           Driving appears in a miscellaneous environment involving
than when the VA has a male voice.                                   bikers, pedestrians, other cars, traffic, and traffic signs. This
                                                                     reduces the opportunity for the driver to decrease frustrating
                                                                     situations (Harris & Nass, 2011). Ideally, drivers' frame of
2.3_Emotional_states                                                 mind should support the competencies required for driving
Kleinginna & Kleinginna (1981) have defined emotions as a
                                                                     safely. These emotions are related to paying attention, good
multi-level set of interactions within various subjective and
                                                                     decision-making, and intuition (Agrawal, Giripunje, & Bajaj,
objective factors managed by human hormones. They can
                                                                     2013).
influence behavior, manage the cognitive procedure and allow
                                                                     In reality, due to the increasing amount of vehicles during
experiences (Kleinginna & Kleinginna, 1981). Cabanac (2002)
                                                                     traffic hours, drivers experience an increase in frustration and
encloses that emotions are perceived in different categories as
                                                                     negative emotions (Harris & Nass, 2011). Frustration functions
anger, happiness, sadness, or surprise. Psychologists have
                                                                     as an entrance emotion, leading to a more aggressive driving
found that it is impassable to think or behave without involving
                                                                     attitude and anger (Harris & Nass, 2011). Harris & Nass (2011)
the emotional system (Nass et al., 2005). Emotions affect
                                                                     define this as road rage behavior, which is an increasing
various competencies and traits like perception and
                                                                     problem in today's traffic and the reason for multiple accidents.
organization of memory (Bower, 1981), categorization and
                                                                     Reasons for this behavior are, on the one hand, many adjacent
preference (Zajonc, 1984), strategic planning (LeDoux, 1992),
                                                                     hours of driving, and on the other hand, the outcome of stress
focus and attention (Derryberry & Tucker, 1992) and,
                                                                     aroused by heavy traffic (Alvarez, Lopez-de Ipiña, Daily, &
motivation and performance (Colquitt, LePine, & Noe, 2000).
                                                                     Gilbert, 2012).
Furthermore, they are influenced by different acoustic
                                                                     The personal characteristics traits were also considered to play
characteristics like volume, speed, or frequency (Nass et al.,
                                                                     an important role regarding the driving behavior and the
2005).
                                                                     emotional state (Deffenbacher, Lynch, Oetting & Yingling,
A study by Harris & Nass (2011) analyzed the influence VAs           2001; Underwood, Chapman, Wright & Crundall, 1999;
have on the driver's emotional state. The outcome showed that        Zimasa, Jamson & Henson, 2017). Hereby, Zimasa et al. (2017)
participants who were part of the reappraisal-down condition         put up the hypothesis of whether happy drivers are safer
had more positive emotions than the other groups' participants.      drivers. Their study outcome accepted this hypothesis by
A study from Braun et al. (2019) achieved the knowledge that         finding out that drivers in a happy or neutral mood have a better
a VA with an emotional state and the ability to interact with the    and faster reaction to upcoming hazards than drivers in a sad
driver is used best when improving emotions and increasing the       mood. A study from Underwood et al. (1999) concluded that
driving performance. Furthermore, speech is an essential             there was a strong positive relation between almost having an
transporter of information emotionally (Nass et al., 2005).          accident and the level of anger the driver feels during the drive.
To increase the approval and the use of VA, it is advised to         It was found that drivers who generally have a lower boundary
include human capacities in the machines (Borau, Otterbring,         for anger are more likely to show angry behavior in road traffic
Laporte, & Fosso Wamba, 2021). These capacities include              and adapt to a more unsafe and combative driving style
verbal and non-verbal contact (Borau et al., 2021). This human-      (Deffenbacher et al., 2001).
like interaction with the VA helps to increase trust and the         Generally, it can be distinguished between different types of
relationship between the machine and the user (Borau et al.,         emotions that negatively influence the driving performance of
2021). Resulting from the literature presented above, the third      the driver: anger, stress, confusion, and concentration.
hypothesis is:
                                                                     2.4.1 Aggressiveness and Anger
H3: The driver's emotional state is better if the VA has a           Research has shown that anger negatively influences driving
human-likely voice than when the VA has a robot-likely voice.        behavior and leads to a more risk-supporting attitude such as
                                                                     speed, lane deviations, and collisions (Jeon, Walker, & Yim,
                                                                     2014).
Additionally, appointing a gender to the VA helps to increase        Aggressiveness and anger can be summarized in the term road
the anticipated humanness (Borau et al., 2021). Hereby,              rage. Based on the definition from Wells-Parker et al. (2002),
differences between the genders have been found. Women, in           road rage is seen as the impulsive performance in precarious
general, are perceived more as having favorable human                activities that leads to an increase in the possibility of an
intentions (e.g., friendly, warm, and credulous) and the             accident. Additionally, less extreme appearances can be found
capacities to recognize and feel emotions, like anger, empathy,      in expressing anger verbally in inconspicuous ways as shouting
frustration (Borau et al., 2021). Multiple studies have shown        through a locked window, talking to oneself, or expressing the
that customers prioritize a female over a male voice because         emotions using functions as the headlights' flash (Wells-Parker
they are superior in transporting and experiencing emotions          et al., 2002). These milder forms appear most often in the daily
(Eyssel, De Ruiter, Kuchenbrandt, Bobinger, & Hegel, 2012;           traffic routines (Hennessy & Wiesenthal, 1997).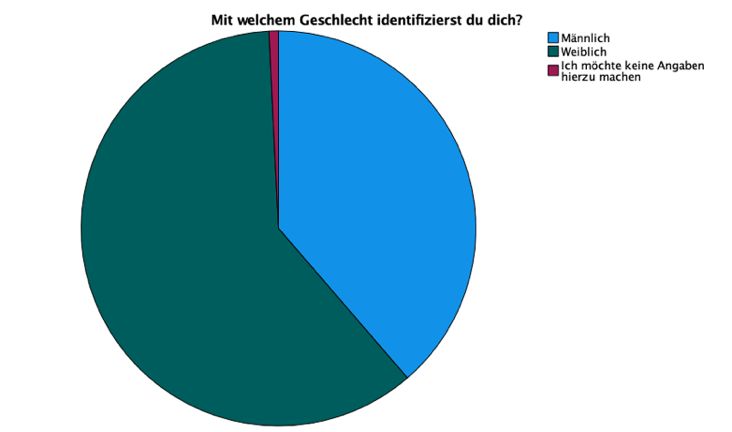
2.4.2 Stress                                                          2012). Furthermore, it describes the feeling of purchasing a
Stress is defined as a feeling from a patient state to an annoying    product and the loyalty to the brand, which results out of
state activated by one or more factors in the environment             personal tendencies towards a product (Rezvani et al., 2012).
(Healey & Picard, 2005). Most stress factors are either               Another definition describes purchase intention as the
intellectual, personal, or perceptual (Healey & Picard, 2005).        individual’s consciousness to make a try to buy a product
Stress usually develops through factors as full roads, rush           (Shabbir, Kirmani, Iqbal, & Khan, 2009). A previous study
hours, driving scrupulously behind other cars, taking an              from Daneshvary and Schower (2000) found out that the
incoming call, or trying to be punctual at the final destination.     intention to purchase is influenced by demographic factors as
                                                                      age, gender, or the country of origin (Wang, Li, Barnes, & Ahn,
2.4.3 Confusion                                                       2012). Other external factors influencing an individual’s
                                                                      decision to purchase are the quality perception, the price, and
Confusion appears in complex traffic settings, as misleading
                                                                      the given value (Chang & Wildt, 1994), but also the customer’s
traffic signs, a complication in the route, or through the
                                                                      knowledge (Pires, Stanton, & Eckford, 2004). The higher the
performance of other drivers. It can also result from driving the
                                                                      value of a product, the higher the likelihood a consumer is
route for the first time or being in a bigger city. Confusion is
                                                                      going to purchase it (Chang & Wildt, 1994). Regarding voice
seen as a significant negative influence on the safety risk, as the
driver is not aware of how to behave in the situation and             assistants, in today’s society, most of the conversational agents
                                                                      are female (i.g. Alexa, Siri, Cortana). They do not only have
whether one is responsible for the primary driving tasks
                                                                      female names but also speak with a female voice (Feine,
(Wilson, Yang, Roady, Kuo, & Lenné, 2020).
                                                                      Gnewuch, Morana, & Maedche, 2019). Over 60% of German
                                                                      inhabitants have used voice assistants (Tenzer, 2019), and a
2.4.4 Concentration                                                   study from Adams (2019) revealed that almost 56% of her
Keeping concentration high while driving is a significant             respondents are in the current usage of a voice assistant. Based
operation to ensure safe road traffic as distraction of the driver    on the literature, the sixth hypothesis is as followed:
is one of the most crucial contributors to accidents (Fofanova
& Vollrath, 2011). Almost 23% of all accidents happening on           H6: Purchase Intention is higher when the voice assistant has
the road are caused through distraction by secondary tasks            a female voice than when the VA has a male voice.
(Fofanova & Vollrath, 2011). Harbluk, Noy, Trbovich, et
Eizenman (2007) conducted a study where drivers need to
perform secondary no-hands tasks besides driving. They found          2.6 Conceptual Framework
out that drivers are mostly distracted by their environment and       Based on the literature and the formulated hypothesis, the
spend time looking outside of their vehicle. Furthermore, this        following conceptual framework (Figure 1) will serve as a
distraction leads to a reduction in the monitoring of the mirrors     foundation estimating the positive influence the correct
or traffic lights (Harbluk et al., 2007).                             characteristics of voice assistants can have on the overall
                                                                      driving performance.
Resulting from the literature hypothesis H5a, H5b, H5c and
H5d are the following:

H5a: Anger is lower when a VA with a human-likely voice is
used during the drive than when a VA with a robot-likely voice
is used.

H5b: Stress is lower when a VA with a human-likely voice is
used during the drive than when a VA with a robot-likely voice
is used.

H5c: Confusion is lower when a VA with a human-likely voice
is used during the drive than when a VA with a robot-likely
voice is used.
                                                                                   Figure 1. Conceptual Framework
H5d: Concentration is higher when a VA with a human-likely
voice is used during the drive than when a VA with a robot-           3. METHODOLOGY
likely voice is used.                                                 3.1 Research Design
                                                                      A proper design method needs to be used to answer the research
When focusing on VAs and their influence on driving                   question and justify the hypotheses. Regarding the scope of the
performance, it can be said that based on a study from Eyben et       study, an experiment will be conducted with different
al. (2010), participants have agreed on the positive influence of     experimental groups. The overall research question is answered
VAs in unknown and unpleased situations. Additionally, it was         using primary and secondary data. For exploiting primary
found out that the voice of the VA plays a significant role in the    research data is used that is "collected directly from researches
influence it has on the driver (Nass et al., 2005). In an             for the purposes of their research objectives," (Chrysochou,
experiment with a 2x2 study matrix (emotion of driver and             2017, p.411). which enables them to have adequate control over
emotion of in-voice assistant), the conclusion was drawn that         the collection of the data. The secondary research includes
the number of accidents can be reduced if the car assistant's         "sources and data that are already available" (Chrysochou,
voice fits the emotional state of the driver (Nass et al., 2005).     2017, p.411). Keywords used for the secondary data collection
                                                                      were, e.g., Artificial Intelligence, Emotions, Driving behavior,
2.5 Purchase Intention                                                Voice assistants, characteristics or differences, primarily
Purchase Intention can be defined as the purpose of one to            focusing on the relationship between two or more of the
decide which brand to choose to purchase from (Rezvani et al.,        keywords. Based on this research, a conceptual framework has
been created, which serves as the basis for the following study. After answering these questions, the participants were
The primary data will be collected using a quantitative randomly assigned to one out of the eight different videos. In
experimental study consisting of a video and one survey. total, 256 respondents have been used for further analyses.
Surveys are a common method to explore data, as they add the Hereby it was ensured that each stimulus had more than 30
opportunity for an accurate operationalization and analysis of respondents. In the end, scenario two and three got 34
the data (Chrysochou, 2017). participants, scenario eight 33, scenario four 32, scenario five,
The experimental study will be conducted between subjects six, and seven each got 31 participants, and scenario one got 30
where the participants will see one out of eight possible videos, participants. A comprehended overview of the distribution
and afterward, a survey needs to be filled out. In total, there will among the scenarios can be found in table 1. The videos have
be eight different stimuli in the end, as seen in figure 2. an approximate length of three minutes and showed the
The study focuses on whether different characteristics of VAs researcher driving around. During the video, the participants
have different impacts on the driver's emotional state. got different commands and support from a voice assistant. The
Therefore, different VAs will be used: a female with a human human VAs have been recorded by persons from the
voice, a female with a computer voice, a male with a human researchers' personal circle. It was ensured that the voices
voice, and a male with a computer voice. To encourage express stereotypical attributes of their gender and have a clear
different stress situations, each VA will be used once during the pronunciation. The website notevibes.com served as the base
day and once during the night. To keep the limitations as small for the computer voices. Hereby, the persona 'Markus' has been
as possible and not get in trouble with legal issues, the chosen as the most convenient male voice, whether the persona
researcher has taken the videos herself using a GoPro. The car 'Annika' has been used as the female assistant.
used for all videos is a Renault Zoe (year of construction 2019), In the second half of the survey, the respondents were asked to
and the location of filming is Ahaus, Germany. The route answer statements on a five-point Likert scale from (1) strongly
driven is for all videos the same and can be found in the disagree to (5) strongly agree (McKnight, Choudhury, &
appendix (Appendix Part 1), but only parts of the route have Kacmar, 2002). The Likert scale can be described as "one of
been used for the video. the most fundamental and frequently used psychometric tools"
(Joshi, Kale, Chandel, & Pal, 2015, p.369). It was ensured that
all questions of each item are unidimensional, meaning that "all
the items in a scale or index fit together, or measure a single
construct "(Neuman, 2014, p.125). The variables with the
belonging items can be seen in the appendix (Appendix Part 2).
The first nine statements measure the trustworthiness of the
voice assistant regarding benevolence, ability, and integrity.
Participants were asked to state whether, for example, the VA
was concerned about their well-being, the VA is qualified in
helping the driver, or if the pieces of advice have been helpful.
The following thirteen statements concerned the feelings
arising by the participant when hearing the voice of the voice
assistant. The emotions checked were stress, anger, confusion,
and concentration and were chosen to achieve a better
understanding of the driver's emotional state during the drive.
Lastly, participants were asked if they can imagine buying a car
with a voice assistant and which functions are important to
them when deciding for a car. Hereby, again multiple options
Figure 2. Eight stimuli were given as a parking aid, a camera, a navigation system, or
a voice assistant. Due to missing mutual exclusivity, the
participants were able to choose multiple options or indicate
3.2 Designing questions that they have other or no wishes for their car.
The questions used in the survey are based on existing literature To ensure the attention of the participants, in the end they have
(see Appendix Part 2). The whole questionnaire that was sent been asked to mention whether they heard a male or a female
out can be found in the appendix (Appendix Part 3). voice and what the time of recording was (day vs. night).
Furthermore, a link to all eight videos, published on YouTube, To simplify the results for the quantitative analysis, open
can be seen in the appendix (Appendix Part 4). questions have been averted. The questionnaire consists of a
At the beginning of the questions, the respondents were asked total of 17 questions, excluding the video, where each question
to answer five questions regarding their individual being. These either represented an exact question or a question block of
questions contained information on the participant's age, the comparable statements. Question blocks were entirely used in
gender they identify with, the current living location, how long the interest of Likert-Scales. The duration to finish the survey
the participant has their driver's license, and the amount of car is approximately seven minutes and could be done at any time
rides they do per week. These questions have been answered in a period of three weeks, completed from every device with
by the participants using the multiple-choice option with pre- an internet connection (Computer, Smartphone, Tablet, etc.)
selected answers. It continued with a question about ones'
driving behavior, where the option was to select multiple
answers as the individual choices were not mutually exclusive. 3.2.1 Pre-test
When designing a survey, it is crucial to review the individual To ensure the study and the questions are clearly formulated, a
multiple choice options to ensure that the answers are mutually pre-test was conducted, where five people watched the pre-
exclusive and exhaustive (Neuman, 2014). Lastly, the recorded videos and the surveys before. After the received
participants indicated how much they agree or disagree with the feedback, grammar and spelling mistakes have been removed,
statement 'I am an experienced driver.'. and two of the questions have been reformulated to avoid
misunderstanding. The responses were deleted afterward, andthe five participants did not fill out the survey when it was them, closely followed by a parc distance control (21.7%). A
online. more detailed overview of the sample characteristics can be
found in the appendix (Appendix Part 5).
3.3 Data collection
Due to the ongoing worldwide pandemic, the collection of the 3.5 Measurement Model Validation
data was completely online. An online survey allowed the To ensure an equal spread of gender in the scenarios a Chi-
researcher to reach a broader audience and get an extensive Square Test was conducted, which did not show significance
understanding as the majority of the target group are internet (X2 (16, N=256) = 12,67, p-value = 0,621). Out of the 259
users. The survey was distributed via different social media respondents 155 (60,55%) identified as female, 99 (38,7%) as
channels, e.g., What's App, Instagram, and Facebook. To avoid male and 2 participants (0,8% ) did not want to give
confusion and misunderstanding by the participants, the information about their gender. The distribution within the
instruction language was German, as the videos have been scenarios had a wider spread, but it was ensured that the
recorded in a German city. This allowed the researcher to gain scenarios were seen by both genders. An overview of the full
a diversified sample regarding the age groups as it enables gender distribution can be seen in Table 1.
participation for older people who do not speak English
fluently. The data which was conducted from the survey was Table 1. Gender distribution among the scenarios
treated completely anonymously to provide confidentiality. Scenario* N % % % % No
The BMS ethics committee of the University of Twente Female** Male** information**
approved the survey first to ensure no personal affection. All
1 30 11.7 50.0 50.0 0.0
responses were collected voluntarily with the possibility to
withdraw the participation at the end after being informed about 2 34 13.3 64.7 32.4 2.9
the general aim of the study. 3 34 13.3 64.7 35.3 0.0
4 32 12.5 65.6 31.3 3.1
3.4 Sampling 5 31 12.1 74.2 25.8 0.0
In total, 303 participants responded to the survey. This is a 6 31 12.1 51.6 48.4 0.0
representative sample size which raises the verification of the 7 31 12.1 54.8 45.2 0.0
findings and allows sub-groups to be compared meaningfully
(Hartley, 2014). In this survey, the sub-groups focused 8 33 12.9 57.6 42.4 0.0
especially on comparing different cases regarding gender, age Total 256 100.0
groups, and living locations. Nevertheless, some exclusion
*
criteria have been made. To participate in the survey, a Scenario 1=female, human, night
sufficient level of German was required as well as the Scenario 2=male, human, day
availability of a driver’s license. Furthermore, participants Scenario 3=male, human, night
needed to be above 18 and are able to see and hear clearly. Scenario 4=female, human, day
However, due to surveys being incomplete and answers with Scenario 5=female, computer, day
no use, some of the responses needed to be removed. More Scenario 6=male, computer, day
specifically, all responses have been checked regarding the Scenario 7=male, computer, night
manipulation check at the end and the duration. Completed Scenario 8=female, computer, night
**
surveys with a duration below three minutes and a % within each scenario
misunderstanding of the gender of the voice assistant have been
removed. Moreover, all responses have been checked on their Furthermore, the two manipulation questions were checked
usefulness based on the potential impact on the research using once an independent sample t-test and once a cross table.
question. In the end, out of the 303 responses, only 256 have The first independent t-test for gender (male vs. female)
been used for further analysis. showed that those participants who had a female voice
The sample differs in the age groups from 18-50+, with the indicated that they heard a female voice and vice versa with the
majority being between 18-21 years (36,33%). Additionally, male voice (t(254) = -30.51, p < .001). The test showed that
the duration of being in charge of a driver’s license supports participants who heard a female voice were able to record that
this, as 38,28% of the participants possess their driver’s license they heard a female voice (M = 1.48, SD = 0.50) and not a male
for three to five years. Most of the participants identified with voice (M = 3.34, SD = 0.489). The second independent t-test
the female gender (60,55%), but 0,78% wanted to keep their for the humanity of the voice assistants showed significance as
gender to themselves. As the survey was designed only for well (t(254) = -5.65, p < .001). Even if it was harder for
German-speaking participants, the living locations were based participants to decide whether the voice was a human voice (M
on the 16 different federal states. The majority of the = 2.13, SD = 0.99) or an artificial voice (M = 2.85, SD = 0.99),
participants (71,48%) currently live in North-Rhine the majority indicated it right. The cross table was used to
Westphalia, followed by 15,63% living in Lower Saxony. measure the right indication of the recorded time. It was seen
Regarding the amount of driving, 30,86% of the participants that all of the participants reported correctly whether the video
estimate that they drive daily, 21,09% drive between six to four was recorded during the day or the night. The cross table can
times per week, 20,03% between three to two times per week. be found in the appendix (Appendix Part 6).
Lastly, 17,58% drive less than once a week, and 10,16% drive To ensure the validity and reliability of the scales and to see
around once a week. The majority of the participants said they whether the items match the variable, a confirmatory factor
drive with very high consciousness and attention (41,83%). In analysis was conducted. Furthermore, the average variance
the end, the respondents had been asked to mention which extracted (AVE), the composite reliability (CR), and
functions are important to them when buying a car, for Cronbach’s alpha were calculated. To make sure all items
example, a navigation system, a camera, or a voice assistant. measure in the same direction, two items were recoded firstly.
Hereby, they had the possibility of choosing more than one For the variable trust, results showed that two items were
answer. 23.2% indicated that a navigation system is essential to loaded in a different factor. The items ‘Der Sprachassistent hatmir geholfen’ (‘The VA has helped me’) and ‘Die Tipps des 0.86). Respondents were able to concentrate on the same level
Sprachassistenten waren konsequent’ (‘The advice of the VA whether the voice was female (M = 3.14, SD = 0.07) or male
were consistent’) were removed for further analysis. The AVE (M = 3.16, SD = 0.08). The multivariate analysis of variance
of trust showed a value below 0.5. To be consistent, the values furthermore revealed that there are also no significant effects of
need to be above 0.5. Consequently, the lowest item ‘Der gender on the variable of purchase intention (F(1.248) = 0.21,
Sprachassistent ist um mein Wohlbefinden besorgt’ (‘The VA p = 0.65).
is concerned about my well-being’) was removed from the data Table 3. MANOVA effects – Gender
for further analysis. For the second variable, emotions, the Dependent Sum df Mean F Sig.
factor analysis reported that the individual emotions are seen as variable of sq. sq.
belonging to different factors. Therefore, in the following Trust 0.16 1 0.16 0.82 0.37
analysis, the emotions will be seen separately from each other.
Anger 0.11 1 0.11 0.13 0.72
All variables were loaded correctly for the factor purchase
intention, and no items needed to be removed. The Kaiser- Stress 0.90 1 0.90 1.15 0.29
Meyer-Olkin value was significant with a value of 0.83 and is Concentration 0.02 1 0.20 0.30 0.86
used to check sampling adequacy (Rasheed & Abadi, 2014). Purchase 0.04 1 0.04 0.21 0.65
The next step was to calculate Cronbach’s alpha to regulate the Intention
internal consistency of the variables. All of the dependent
variables showed a value of above 0.7 except for the variable Table 4. Mean and standard deviations – Gender
confusion. Furthermore, the average variance extracted (AVE) Female Male
has been measured, which measures the degree of differences
and expresses consistency with a value higher than 0.5 Dependent M SD M SD
(Alarcón, Sánchez, & De Olavide, 2015). All variables showed variable
consistency with values higher than 0.5 except for confusion Trust 2.88 0.04 2.94 0.04
again. As a consequence confusion with the items ‘Die Anger 2.31 0.08 2.35 0.08
Anweisungen des Sprachassistenten waren schwer zu Stress 2.62 0.08 2.74 0.08
verstehen’ (‘The tips of the VA were hard to understand’), ‘Die Concentration 3.14 0.07 3.16 0.08
Anweisungen des Sprachassistenten haben mich irritiert’ (The
Purchase 2.68 0.04 2.65 0.04
tips of the VA have irritated me’) and ‘Ich war unsicher, ob ich
Intention
den Anweisungen vertrauen konnte‘ (‘I was unsure whether I
can trust the advices’) had been removed from the sample for
further analysis. 4.3 Humanity
Finally, the composite reliability (CR) index was calculated, For the independent variable humanity all dependent variables
which showed reliability with values above 0.7. As all of the showed significant effects except for the variable trust
items show values above 0.7, it can be concluded that the (F(1.248) = 0.68, p = 0.41). For the respondents there is no
dependent variables fulfill the requirements of reliability. A difference in their trust perception whether the voice assistant
detailed overview of the analyses is shown in table 2. had a human voice (M = 2.94, SD = 0.04) or an artificial voice
(M = 2.90, SD = 0.04). In contrast to that, the multivariate
4. ANALYSIS analysis of variances has found effects of the humanity on the
variable of anger (F(1.248) = 28.44, p < 0.01). Respondents
4.1 Main effects who were confronted with a human voice experienced a lower
To check the hypotheses and answer the research question, the level of anger (M = 2.01, SD = 0.07), than respondents who
collected data has been analyzed using a multivariate analysis were confronted with an artificial voice (M = 2.64, SD = 0.09).
of variances (MANOVA) and an analysis of variances, short Similar results were found for the level of stress (F(1.248) =
ANOVA. The analysis exposed several significant effects. 21.95, p < 0.01). People confronted with a human voice
experienced a lower level of stress (M = 2.41, SD = 0.07), than
4.2 Gender people who were confronted with an artificial voice (M = 2.95,
The multivariate analysis of variance revealed no significant SD = 0.09). The emotion concentration showed comparable
effects between the gender of the voice assistant and the results (F(1.248) = 5.88, p = 0.01). When hearing a human
dependent variables. Whether the voice assistant had a female voice, participants were able to concentrate better (M = 3.30,
or a male voice had no significant effect on their trust SD = 0.07), than when hearing an artificial voice (M = 3.02, SD
perception (F(1.248) = 0.82, p = 0.37). Participants who had = 0.08). The multivariate analysis of variances furthermore,
listened to a female voice (M = 2.88, SD = 0.04) trusted her as reports a significant effect of the humanity of the voice assistant
much as participants who had a male voice (M = 2.94, SD = on the variable purchase intention (F(1.248) = 7.47, p = 0.01).
0.04). The same outcome was found for all of the dependent Respondents are more likely to buy a car with a voice assistant
emotion variables anger, stress, and concentration. First, the if the VA has a human voice (M = 2.74, SD = 0.04) in contrast
level of anger towards the voice assistant was found out to be to if it has an artificial voice (M = 2.60, SD = 0.04).
independent of the gender of those (F(1.248) = 0.13, p = 0.72).
Respondents assigned to the female voice experienced the same Table 5. MANOVA – Humanity
level of anger (M = 2.31, SD = 0.08) as those who were Dependent Sum df Mean F Sig.
assigned to the male voice (M = 2.35, SD = 0.08). Second, the variable of sq. sq.
stress level of the participants was not significant in relation to Trust 0.13 1 0.13 0.68 0.41
the gender of the voice assistant (F(1.248) = 1.15, p = 0.29). Anger 22.65 1 22.65 28.44Table 2. Measurement Model Validation
Variable Item Cronbach’s alpha Composite reliability Average variance λ (factor loadings)
(CR) extracted (AVE)
Trust Q8_Trust_2 0.73
Q8_Trust_3 0.70
Q9_Trust_1 0.85 0.87 0.52 0.76
Q9_Trust_2 0.82
Q9Trust_3 0.62
Q10_Trust_1 0.71
Anger Q11_Emotions_Anger_1 0.80
Q11_Emotions_Anger_2 0.87 0.80 0.57 0.81
Q11_Emotions_Anger_3 0.63
Stress Q12_Emotions_Stress_1 0.78
Q12_Emotions_Stress_2 0.82 0.82 0.54 0.67
Q12_Emotions_Stress_3 0.68
Q12_Emotions_Stress_4 0.81
Concentration Q14_Emotions_Concentration_1 0.82
Q14_Emotions_Concentration_2 0.75 0.75 0.50 0.58
Q14_Emotions_Concentration_3 0.60
Purchase Intention Q15_PurchaseIntention_1 0.88
Q15_PurchaseIntention_2 0.87 0.86 0.69 0.68
Q15_PurchaseIntention_3 0.88Table 6. Mean and Standard Deviation – Humanity female, human voice during the day (M = 2.15, SD = 0.16).
Human Artificial Comparable results were revealed when the voice of the
assistant was male. People indicated a higher stress level when
Dependent M SD M SD the voice was a male, artificial voice and the recording time
variable was during the day (M = 3.10, SD = 0.19) as when the voice
Trust 2.94 0.04 2.90 0.04 was a male, but human voice with the same recording time (M
Anger 2.01 0.07 2.64 0.09 = 2.50, SD = 0.14). Lastly, the multivariate analysis of
Stress 2.41 0.07 2.95 0.09 variances revealed a lower stress level for a human, male voice
Concentration 3.30 0.07 3.02 0.08 recorded during the night (M = 2.62, SD = 0.14) than for an
artificial, male voice recorded during the night (M = 2.77, SD
Purchase 2.74 0.04 2.60 0.04
= 0.19).
Intention
Table 9. MANOVA – Interaction effect Gender,
4.4 Time of recording Humanity & Time of recording
The multivariate analysis of variances revealed no significant Dependent Sum df Mean F Sig.
effects between the time of recording and the dependent variable of sq. sq.
variables. There has been no significant difference found for Trust 0.01 1 0.01 0.04 0.85
the perception of trust (F(1.248) = 0.28, p = 0.59) regarding
Anger 1.19 1 1.19 1.49 0.22
the time of recording. Participants experience the same level
of trust independently of the recording of the videos (M = 2.93, Stress 3.29 1 3.29 4.18 0.04
SD =.04), (M = 2.90, SD = 0.04). Furthermore, the multivariate Concentration 0.53 1 0.53 0.79 0.38
analysis of variances found no significant effects of the time Purchase 0.13 1 0.13 0.72 0.40
of recording on the variables anger (F(1.248) = 0.02, p = 0.90), Intention
stress (F(1.248) = 0.13, p = 0.72) and concentration (F(1.248)
= 1.95, p = 0.16). Similar results were revealed for the 4.6 Duration of driver’s license
dependent variable purchase intention (F(1.248) = 0.053, p = To check the correlation between the dependent variables and
0.82). some characteristics of the participants, the data has been
analyzed using an analysis of variances (ANOVA). The
Table 7. MANOVA – Time of recording analysis focused on the correlation between the duration of
Dependent Sum df Mean F Sig. being in charge of a driver’s license and the dependent
variable of sq. sq. variables. The analysis of variances showed significant effects
Trust 0.06 1 0.06 0.28 0.59 of the duration on the variable of stress (F(5, 250) = 2.15, p =
Anger 0.01 1 0.01 0.02 0.90 0.03). Participants who have a driver’s license longer than ten
Stress 0.10 1 0.10 0.13 0.72 years showed a lower level of stress (M = 2.05, SD = 0.76)
Concentration 1.31 1 1.31 1.95 0.16 than participants which are in charge of their driver’s license
for less than a year (M = 2.61, SD = 1.14).
Purchase 0.01 1 0.01 0.05 0.82
Intention
Table 10. ANOVA – Duration of driver’s license
Dependent Sum df Mean F Sig.
Table 8. Mean and Standard Deviation – Time of
variable of sq. sq.
recording
Trust 1.22 5 0.24 1.25 0.29
Day Night
Anger 11.03 5 2.21 2.53 0.03
Dependent M SD M SD Stress 9.01 5 1.80 2.15 0.06
variable Concentration 2.17 5 0.43 0.63 0.68
Trust 2.93 0.04 2.90 0.04 Purchase 1.38 5 0.28 1.50 0.19
Anger 2.33 0.08 2.34 0.08 Intention
Stress 2.70 0.08 2.66 0.08
Concentration 3.23 0.08 3.10 0.08 Table 11. Mean and Standard Deviation – Duration of
Purchase 2.67 0.04 2.66 0.04 driver’s license
Intention Duration N M SD
< 1 year 6 2.61 1.14
1 – 2 years 21 2.57 0.99
4.5 Interaction effects 3 – 5 years 98 2.47 1.00
To analyze the data further and check the hypothesis and the
6 – 10 years 37 2.25 1.06
research question, multivariate analysis of variances
(MANOVA) was used to determine if there are interaction > 10 years 94 2.05 0.76
effects between the five dependent variables. The analysis Total 256
revealed that gender, time of recording, and humanity
significantly affect the variable stress (F(2.148) = 4.18, p = 5. DISCUSSION AND IMPLICATIONS
0.04). Respondents indicated a higher level of stress when the The driving performance is highly influenced by external
gender of the voice was a female, artificial voice recorded factors (Alvarez, Lopez-de Ipiña, Daily, & Gilbert, 2012). A
during the day (M = 2.84, SD = 0.17), in contrast to when the possibility to reduce accidents and stabilize the emotional state
voice was human (M = 2.40, SD = 0.15). Similar results were of the driver would be by using voice assistants, which act as
found when the recording time was during the night. virtual partners (Eyben et al., 2010). Hereby, the right fit of
Participants felt more stressed when the voice was a female, the voice assistant is crucial to support the driver during one's
artificial voice during the night (M = 3.12, SD = 0.16) than adrive (Nass et al., 2005). The overall aim of the study was to keeping concentration high is essential, as a lower level of
find out if the use of a voice assistant might support the driver concentration leads to an increase in accidents (Fofanova &
taken into account the different characteristics. Vollrath, 2011). Furthermore, the study revealed significant
interaction effects between gender, humanity, time of
5.1 Gender recording and the variable stress. For both genders the stress
The experiment revealed no significant differences for the level was higher when the voice was a robot-like voice than
gender of the voice assistant. The respondents indicated the when it was a human vocie, taken into account the time of
same level of trust perception independently of the gender the recording. Generally, this means that using a VA with a human
VA had. Even if current scientific literature suggests that a voice helps to decrease negative emotions, which results in
female voice is prioritized over a male voice (Eyssel et al., experiencing more positive emotions, which will lead to fewer
2012), this could not be supported. There was no evidence accidents, as happier drivers are generally safer drivers
found for the statement that women are perceived more as (Zimasa et al., 2017). Lastly, for hypothesis H1 ('Trust in a VA
having a favorable voice (Borau et al., 2021). The hypothesis is higher when the VA has a human likely voice. ') no
H2 ('Trust in a VA is higher when the VA has a female voice.') significant effects have been found; therefore, the hypothesis
has therefore been rejected. Furthermore, the hypotheses H4a has been rejected.
(‚The driver's emotional state is positively influenced if the
VAs gender is female. ') and H4b ('The driver's emotional state 5.3 Time of Recording
is negatively influenced if the VAs gender is male. ') have been Additionally, the videos were recorded at different times to
rejected as well. For the driver, the emotions of anger and check if the time of recording influences the three dependent
stress and the ability to concentrate are not influenced by the variables. The conducted study found no significant
gender of the voice assistant. Concerning the purchase differences between a recording by day and one by night.
intention, no significant results have been found. Respondents Furthermore, the participants did not indicate a difference in
show the same willingness to pay the product independently their trust perception, emotional state, or willingness to
of the gender of the voice assistant. Hypothesis H6 ('Purchase purchase the product.
Intention is higher when the voice assistant has a female An overview of all the hypothesis and their significance can
voice.') is therefore rejected. Although all hypotheses have be seen in the appendix (Appendix Part 7)..
been rejected and no significant effects were found, the
analysis revealed interaction effects between the gender, 5.4 Practical Implications
humanity, and time of recording for the dependent variable Based on the findings analyzed before, voice assistants' usage
stress. Respondents indicated a higher level of stress when the might help decrease accidents in nowadays traffic. Out of that,
voice was a male, artificial voice, and the recording time was some main implications can be drawn. The main focus should
during the day (M = 3.10, SD = 0.19) as when the voice was a lie on the humanity of the voice assistant. Today's VAs are
female, artificial voice with the same recording time (M = usually spoken by an artificial voice. However, the conducted
3.12, SD = 0.16). This results also have been found for the study revealed clear disproval of this usage, meaning that the
human-likely voice. As current literature already suggest, level of anthropomorphism of the VA should be as human-like
women are seen as more capable of recognizing emotions like as possible. An assistant with a human voice leads to a lower
anger, empathy, and frustration (Borau et al., 2021), level of stress and anger, but on the other hand, to a higher
Therefore, using a female voice can help to reduce those ability to concentrate. Current scientific literature shows that
negative emotions, resulting in fewer accidents (Eyben et al., anger and stress negatively influence driving performance,
2010). resulting in a more risk-supporting attitude (Jeon et al., 2014).
The findings of this study help to improve the development of
5.2 Humanity future voice assistants and increase revenue for future cars.
According to the study results, the humanity of the voice People have a higher purchase intention if the VA inside the
assistant has a significant effect on two of the three variables. car has a human-like voice compared to a computer voice. As
The results revealed that a human voice has a positive the results suggest, gender makes no difference, but
influence on the emotional state and the purchase intention of companies should make use of the humanity of voice
the driver. Participants indicated a lower level of stress and assistants. This will lead to a decrease in negative emotions, a
anger and a better possibility to concentrate when a human higher purchase intention, and a decrease in road accidents in
voice was used. This supports hypothesis H3 ('The driver's the long term
emotional state is better if the VA has a human-likely voice.
'). More specifically, this supports the hypothesis H5a ('Anger 6. CONCLUSION
is lower when a VA with a human-likely voice is used during The study was conducted to find an answer for the research
the drive than when a VA with a robot-likely voice is used. '). question presented in the beginning:
A lower level of anger allows the driver to concentrate more
on the road traffic and decreases the risk of accidents (Eyben Which effects have the use of voice assistants on the drivers'
et al., 2010). The hypothesis H5b ('Stress is lower when a VA emotional state?
with a human likely voice is used during the drive than when
a VA with a robot likely voice is used. ') is supported as well. A total of eight hypotheses were tested in this relation. By
As a high level of stress leads to a loss of attention and focus, testing the hypotheses, it became visible that different voice
which results in lower driving performance, reducing the assistants have different emotional effects. This paper
stress level helps to keep the driver's attention and increase the suggests that using voice assistants to support the driver is
driving performance again (Eyben et al., 2010). Similar results helpful if used with the right criteria. An essential
have been revealed for the hypothesis H5d ('Concentration is characteristic is that the voice assistant should have a human
higher when a VA with a human likely voice is used during or human-likely voice. The resulting effects were a lower level
the drive than when a VA with a robot likely voice is used. ') of stress and anger and a higher level of concentration
that has been accepted. To ensure a safe on-road behavior compared to an artificial voice. Furthermore, the study did notreveal any significant differences between the gender. No 7.2 Further research
moderate impacts have been found for the variable of trust. As mentioned in the limitations section, the study only focused
However, an interaction effect between gender, humanity, and on German participants. To test the obtained results further,
the time of recording on the variable of stress revealed the experiment should be repeated within different countries,
significance. Concluding the study, the outcomes clearly regions, educational levels and cultural communities. This
reported that the implementation of a human voice shows ensures that the findings from this research also show validity
significant effects on stress, anger and confusion, and the and significance in a further research.
willingness to purchase the product. Therefore, the research Generally, the usage of voice assistants during the drive
question can be answered that the use of voice assistants might should be analyzed further using real life experiments. This
have aspects depending taken into account a human voice. paper is used as a starting point in this field. However, besides
the analyzed dependent variables trust, emotions and purchase
7. LIMITATIONS AND FURTHER intention other variables as the emotional state or the driving
performance should be analyzed. By testing the usage of voice
RESEARCH assistants over a long time, an increase or decrease in the
7.1 Limitations number of accidents might become visible, to support the
The study adds new information to the current scientific findings and the current literature even further. Regarding the
literature. In addition, some significant results could have been humanity of voice assistants, the study revealed several
revealed, which can be used for further research. However, significant aspects. People generally perform better, when
there are some limitations worth mentioning. with humans, than with robots. Redesigning future robots,
The first one concerns the living location of the participants. making them look more like humans helps to increase trust
The majority of respondents come from the same region in and the likelihood of buying the product. It furthermore,
Germany. Therefore, cultural differences are not entirely reduces negative emotions concerning the environment
covered in this research. It might be possible that inside of leading to a higher satisfaction with the product.
Germany, the different regions have different attitudes
towards using voice assistants, which could lead to a change 8. ACKNOWLEDGMENTS
in the results. The second limitation concerns the nationality First of all, I would like to thank my first supervisor, Dr.
of the participants. Due to several crucial reasons, the study Carolina Herrando, for all of the support she gave me while
was only available in German. Participants needed to be able writing my thesis. She provided me with extensive feedback
to speak German fluently. This forbids discovering cultural and helped as a guide during the whole development process.
differences between different countries. A third limitation She has been an enormous help during the last months and
affects the design of the survey. Participants were not aware supported me in writing my thesis in the best possible way.
of the fact that different stimuli have been used with different Even if all communication was online due to the current
characteristics of the voice assistant. As today’s technology COVID-19 pandemic, she supported me in the best possible
and artificial voices are similar to human voices, respondents way. Next to this, I also want to thank all of my participants
struggled to indicate if the voice was a human voice (M = 2.13, who participated in my survey. But I want to thank especially
SD = 0.99) or an artificial voice (M = 2.85, SD = 0.99). As a those who helped me spread the survey by actively forwarding
result, around 1/5 of the participants made the wrong choice. it. Without them, there would have been no qualifying data for
Even if it was not visible in the results, the manipulation check me to analyze. Finally, I would like to thank my thesis circle,
reported differences. Furthermore, the second manipulation which was always willing to answer questions fast. With the
question could not have been analyzed statistically due to knowledge of having people in the same situation, the
missing answer choices. Even if all of the participants were development of the thesis became a lot easier.
right about the time of recording, the result is not statistically Lastly, I would like to show my appreciation for my friends
significant. and family, especially my boyfriend, who supported and
This leads to another limitation. As the videos were only motivated me throughout the process and provided me with
recordings, respondents did not have a real-life experience of essential inputs.
how voice assistants affect their driving behavior. Coombs
(2020), mentioned that an essential aspect for consumers to
judge the situation is depending on how they are affected by
it. In the case of the survey, the respondents experienced the
voice assistant only via a pre-recorded video. Therefore,
results might change if the voice assistant would be used
during a real-life experiment. The last limitation concerns the
reliance of the scales of Beldad, van Laar, & Hegner (2018) ,
where two variables needed to be extracted, and Schweizer,
Kotouc, Wagner, & Rudolph (2006), where all three variables
needed to be extracted from the study. In this specific case
relying on the scales of other researchers prohibited the study
from discovering more explorative and robust research
findings.You can also read