Polymer Fuel Cells - Cost reduction and market potential - Austin Power ...
←
→
Page content transcription
If your browser does not render page correctly, please read the page content below
Polymer Fuel Cells – Cost
reduction and market
potential
A report by the Carbon Trust based on independent analysis

September 2012
Contents
1. Executive Summary............................................................................................1
2. Background and Context .....................................................................................4
  The role of fuel cells ..............................................................................................4
  Hydrogen Infrastructure ........................................................................................6
3. The role of UK technology in reducing fuel cell costs ...............................................8
4. The breakthrough UK fuel cell technologies ...........................................................9
  ACAL Energy ........................................................................................................9
  ITM Power.......................................................................................................... 10
  Imperial College & University College London ......................................................... 10
5. Modelling Methodology...................................................................................... 12
  Cost modelling by vehicle..................................................................................... 12
  FCEV uptake modelling and model outputs ............................................................. 15
  CO2 savings ........................................................................................................ 17
6. Results ........................................................................................................... 18
  Deployment potential .......................................................................................... 18
  Market values ..................................................................................................... 20
  CO2 savings ........................................................................................................ 21
  Other applications for fuel cells ............................................................................. 23
7. Conclusions ..................................................................................................... 25
Annex A: ACAL Case Study ..................................................................................... 27
Annex B: ITM Power Case Study .............................................................................. 29
Annex C: Imperial College London and University College London Case Study ............... 31
Annex D: Ilika Case Study ...................................................................................... 33
Annex E: Glossary ................................................................................................. 34

1. Executive Summary
UK breakthroughs in polymer fuel cells could make fuel cell cars cost competitive with
combustion engine cars – doubling the number of fuel cell cars on the road globally by
2030 versus current projections

Battery electric vehicles are more efficient and potentially have lower carbon emissions than
traditional internal combustion powered cars, but issues with recharging, range and price mean
that a third alternative – fuel cell electric vehicles (FCEVs) – could take over 30% of the mid-sized
car market by 2050. That’s a long way off, but by 2015 the major car manufacturers expect to roll-
out their first few thousand FCEVs into countries such as the UK, Japan, Germany and the US,
where plans are already developing to build the hydrogen infrastructure needed to refuel them. The
Polymer Electrolyte Membrane Fuel Cell (PEMFC) technology to power such vehicles is forecast to
steadily reduce in cost, but this will take time. This report looks at three breakthrough UK
technologies that could bring about a disruptive step-change in cost reduction to accelerate
consumer uptake, leading to approximately double the number of fuel cell cars on the road globally
by 2030 versus current expectations. Some of the technologies discussed in this report could be
under the bonnet of the next generation of FCEVs as early as 2020.

PEMFCs operate at lower temperatures and are smaller and lighter than other fuel cells, making
them more suitable for use in cars and vans. PEMFCs have no moving parts and use electrodes on
either side of a polymer membrane to convert hydrogen fuel and air into electrical power, heat and
water, with the help of a platinum catalyst. In vehicle applications, electrical power produced by a
series of cells (a fuel cell stack) is used to drive electric motors that drive the wheels. The result is
that FCEVs typically have significantly higher real-world drive cycle efficiencies than internal
combustion engine vehicles, and have no tailpipe emissions besides water when fuelled by pure
hydrogen.

According to independent analysis commissioned by the Carbon Trust, current state-of-the-art
polymer fuel cell technology is predicted to cost $49/kW in automotive applications when
manufactured at mass scale (i.e. 500,000 units per year). However, in order to be competitive with
internal combustion engine vehicles, automotive fuel cells must reach approximately $36/kW. Cost
savings can be achieved by reducing material costs (notably platinum use), increasing power
density, reducing system complexity and improving durability.

The Carbon Trust recognised both the need and potential for cost breakthroughs in vehicle fuel
cells in 2009 and set up the $10m Polymer Fuel Cells Challenge to find and accelerate the
development of technologies that could meet the $36/kW target, as illustrated in Figure 1. This
initiative is now in its second phase, in which three groups developing fuel cell systems that could
achieve this step-change in cost are moving from feasibility testing towards commercial
development with partners:

   ITM Power have developed a membrane that has the potential to roughly double the power
   density of a cell, producing more ‘bang’ for the platinum ‘buck’;
   ACAL Energy have developed a liquid cathode that has the potential to reduce platinum use by
   at least two thirds, and eliminates the need for some standard components of a fuel cell; and
   Imperial College (IC) London and University College London (UCL) have developed a
   novel stackable cell architecture that uses low-cost materials and manufacturing techniques
   with breakthrough potential in terms of cost reduction. Note that this technology is at an earlier
   stage than those of the other companies.

                                                                                                       1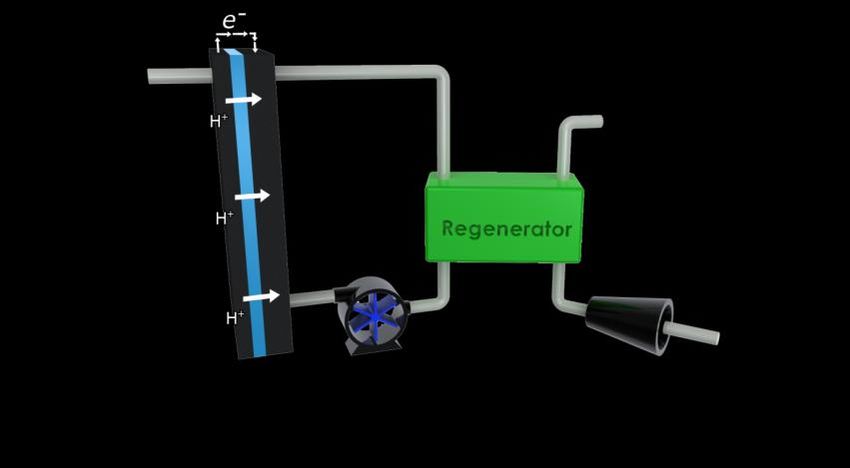
Carbon Trust is also working with Ilika in Phase 2 – a company specialising in developing new
materials – to test their palladium ternary alloy which has the potential to deliver a 70% reduction
on catalyst costs on a cost / performance basis against platinum.1

Details of work to be carried out in the next phase are given below:

           ITM Power – Conduct performance and durability testing of membranes at low catalyst
           loading; address scale up to full size (250cm2) automotive cells; engage with automotive
           partner(s).
           Acal Energy – Develop a 10 kW (1/8th scale) automotive stack capable of achieving car
           makers’ current targets for cost, size, weight and durability; demonstrate ability to handle
           cold start requirements; facilitate partnering with automotive OEM’s.
           IC / UCL – Create an investable Special Purpose Vehicle (SPV); demonstrate a 1 kW stack
           in 9 months.
           Ilika – Select a partner to manufacture 1 kg scale quantities of the catalyst; send material
           to car companies for pre-commercialisation testing; confirm the stability of the material at
           higher voltages.

This report presents the results of independent analysis commissioned by the Carbon Trust. This
analysis indicates that each of the three system-level technologies has the potential to meet the
$36/kW cost target, and shows that fuel cells with this level of cost performance could increase the
deployment of FCEVs by 200m by 2050. These extra FCEVs would increase the value of the global
FCEV market by $30bn to $261bn by 2050. The market modelling takes into account a number of
factors that a typical car buyer might consider when making a purchase, including vehicle
performance and total cost of ownership.

The carbon case is also projected, considering how hydrogen production might change from natural
gas reforming to using renewable or low carbon powered electrolysis. This shows that if the
$36/kW cost target can be achieved, it would reduce global carbon emissions from vehicles by an
additional 260 million metric tonnes per year (260 MtCO2e per year – approximately equivalent to
the annual emissions of Taiwan) by 2050. This step-change in cost is also likely to unlock other
markets for PEM fuel cells besides FCEVs, such as combined heat and power (CHP) and stationary
power applications, leading to an additional 160 MtCO2e per year of savings (approximately
equivalent to the annual emissions of Pakistan) by 2050.

1
    See Annex D for further details

                                                                                                     2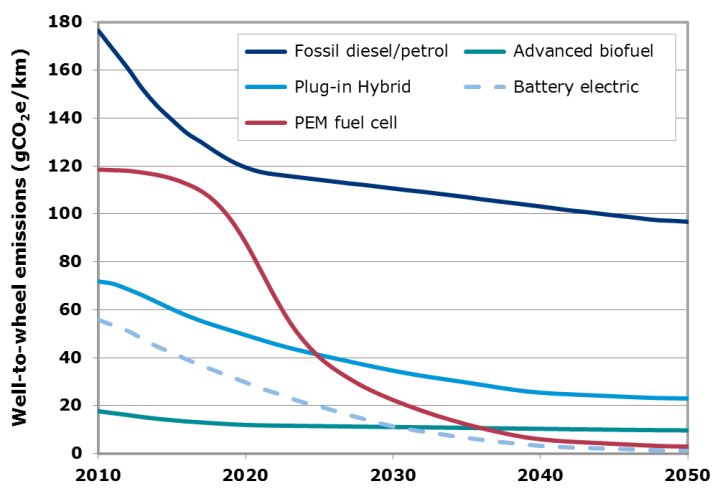
60
Mass manufacture fuel cell system cost ($/kW)

                                                55
                                                                                                            Baseline
                                                     Expected cost of current state of the art fuel cell
                                                                                                             range
                                                     technologies at future mass manufactured volumes
                                                50

                                                                       Potential cost
                                                                       reductions of
                                                45
                                                                     breakthrough UK
                                                                       technologies

                                                40

                                                                                                             $36/kW
                                                                                                            automotive
                                                35                                                            target

                                                30

                                                25
                                                       ACAL                   ITM                  IC-UCL

        Figure 1: Ranges of automotive fuel cell system costs at mass manufactured volume.
Notes: The industry baseline and technology of each Polymer Fuel Cells Challenge (PFCC) system-level project
 team are shown. Solid blue bars represent the range of model outputs, and dotted bars estimate inclusion of
   benefits outside the standard fuel cell system boundary. Source: Carbon Trust, E4Tech and Austin Power
Engineering analysis. Underlying data: from PFCC teams and, for the industry baseline, publicly available data
                                       related to competing technologies.

Sponsor: this report was prepared by the Carbon Trust’s Polymer Fuel Cell Challenge, which is supported by the UK
Department for Energy and Climate Change (DECC)
Commissioning author: Dr Ben Graziano of the Carbon Trust
Contributing authors: Richard Guy, Tim Lancaster, Joseph Thornton, Alex Hart, Dr James Sun and Dr James Wilde of
the Carbon Trust
Independent modelling and analysis: Dr David Hart, Richard Taylor and Rob Ball of E4tech, and Yong Yang of
Austin Power Engineering.
Technology Advisors: Dr David Hart and Dr Charles Stone
Contact: innovation@carbontrust.co.uk

                                                                                                                       3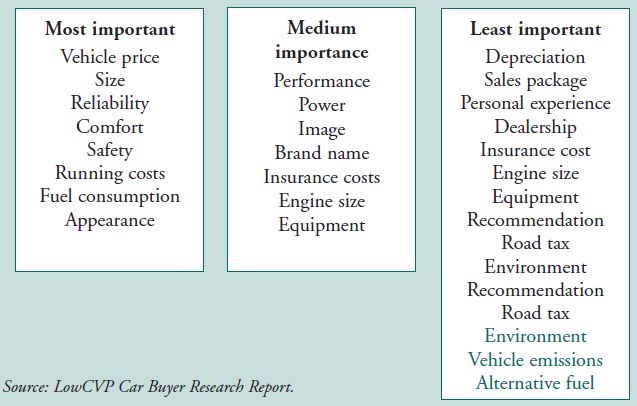
2. Background and Context                            better described as energy conversion devices.

                                                     In a PEMFC, hydrogen molecules are split into
The role of fuel cells
                                                     positive hydrogen ions (protons) at the cathode
All fuel cells are similar in structure. At their    and (negative) electrons at the anode. Once
heart is an electrochemical device, which allows     they have flowed their separate ways, they
the transfer of ions (but not electrons) through     recombine with oxygen to form water at the
a membrane, forcing electricity to flow round an     cathode on the other side of the membrane (see
external circuit. This electro-chemical process is   Figure 2).
highly efficient and requires no moving parts.
                                                     Catalysts – such as the precious metal platinum
Subsystems and peripherals control the flows of      – are usually deposited in small amounts on the
fuel and oxidant, product water, power and           cathode and anode to speed up both reactions.
heat. Fuel cells need fuels (e.g. hydrogen); they
are not energy sources in their own right, but       FCEVs use electric drivetrains powered by a fuel

                                 Figure 2: Diagram of a PEM fuel cell.
                        Source: US National Institute of Standards and Technology

                                                                                                      4
cell. Several types of fuel cell exist, but PEMFCs the year 2030). However, according to that
are particularly well-suited to automotive same analysis, to compete with ordinary
applications due to their low weight, small size, internal combustion engine (ICE) vehicle
high durability, quiet operation, and responsive costs on a total cost of ownership (TCO)
power output. basis, automotive fuel cells must reach
approximately $36/kW (see Box 2). This is
Fuel cells could be powering up to 491 million equivalent to $3,060 for an 85kW system,
cars by 2050 (Carbon Trust, E4Tech and Austin which would be suitable for an average mid-size
Power Engineering analysis) – a third of all the car. These PEM fuel cell system-level cost
cars on the road. Governments around the reductions will also unlock other markets such
world increasingly recognise the role FCEVs as combined heat & power (CHP). Breakthrough
could play in the future low carbon transport cost reductions, beyond current trends, are
mix, and several countries have made serious required to reach this $36/kW automotive
commitments to accelerate their uptake. target.
Meanwhile, car makers have spent billions of
dollars on the development of FCEVs to date, Box 2 – Why the $36/kW target
and stated their intentions to start low-volume
mass production and commercial sales in 2015 Prior to the 2009 market modelling, Carbon Trust
(see Box 1 for further information about global commissioned analysis to establish what price a
FCEV would need to reach to be cost competitive
commitments to fuel cells).
with an ICE vehicle on a TCO basis. The TCO for
the ICE was calculated by modelling:
Box 1 - Global commitments to fuel cell
vehicles Retail Price (power train, energy storage,
transmission, control, chassis, body and
In September 2009, leading car manufacturers markup costs)
signed a Letter of Understanding stating their Fuel costs
intentions to target 2015 for the commercial roll- Maintenance costs
out of FCEVs. The signatories included Daimler,
and summing the outputs. Using a bottom-up
Ford, GM/Opel, Honda, Hyundai, Kia, Renault,
modelling approach for a FCEV to calculate the
Nissan and Toyota. Recognising the importance of
retail price (minus the power train), fuel costs and
FCEVs as one of their main options to meet CO2
maintenance costs, a target power train cost could
reduction regulations, automotive companies have
be calculated to make the FCEV cost competitive
spent over $6bn on the development of FCEVs to
with the ICE.
date (Source: comment by Daimler at the World
Hydrogen Energy Conference, 2012).
Consumer attitudes towards the safety of
In certain markets – such as fork-lift trucks, hydrogen fuelled vehicles could potentially be a
back-up power for telecoms base stations, and factor limiting their uptake. However, the
leisure activity auxiliary power units – fuel cells issues around safety are being addressed
are already seeing initial commercial success. through the development of sufficient codes and
The main challenge preventing PEM fuel cells standards for equipment design, manufacturing
from entering larger markets – including micro- practices, operation and maintenance
CHP and automotive markets – is their cost; procedures, and through extensive research and
pre-commercial fuel cell vehicles currently cost testing (European Commission, 20062). It is
over $130,000. expected that the misconception that hydrogen
vehicles are less safe than internal combustion
According to Carbon Trust, E4Tech and Austin engine vehicles can be corrected through public
Power Engineering analysis, projected
economies of scale and learning effects are
2
ftp://ftp.cordis.europa.eu/pub/fp7/energy/docs/hydrogen_
expected to reduce this cost to approximately
22002_en.pdf
$49/kW (at mass production volumes, i.e. after
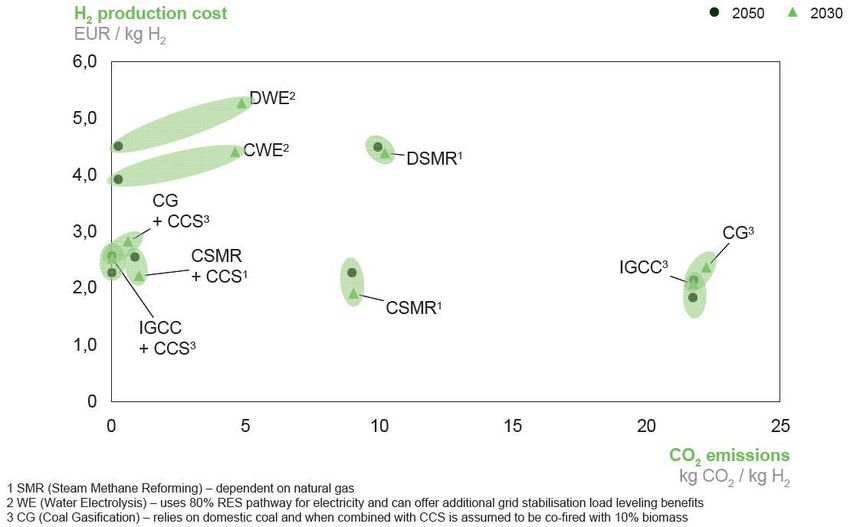
5information campaigns and appropriate field Biomass gasification, with or without CCS,
tests and demonstrations (NETL, 20023). and
Use of renewable or nuclear (i.e. low carbon)
In addition, Liquid Petroleum Gas (LPG), which electricity for water electrolysis.
potentially has similar issues related to
perception of safety, has been used for road Figure 3 compares the future costs and
transport applications in a number of countries emissions of various hydrogen production
for several decades. methods.
Hydrogen Infrastructure Costs of water electrolysers are expected to
reduce due to efficiency and design
FCEVs fuelled by hydrogen will produce no
improvements. In calculating vehicle fuel costs,
tailpipe emissions other than water, and will
the power price assumed ($0.21/kWh) reflects
have the long driving range and fast refuelling
that electrolyser units can be run intermittently,
that car users have come to expect. If the
providing a balancing solution for the power
hydrogen is generated from clean sources, fuel
grid, although this is dependent on scale and
cells could offer a very low carbon means of
location.
transport.
Sufficient hydrogen to fuel the projected FCEV
Approximately 60 million tonnes of hydrogen
fleet can be produced cost effectively on both a
are produced annually (IEA 20074). The cost is
small and large scale – from 0.4 to 1,000
heavily dependent on the cost of the particular
tonnes per day – from centralised or
fuel or electricity used as a feedstock, but
decentralised production (McKinsey5, 2010).
current estimates indicate a cost of about $2/kg
(NETL, 2002). To support the market Hydrogen with negative CO2 emissions could
deployment scenarios presented in this report, also be produced using biomass gasification
an additional 70 million tonnes of hydrogen will with CCS, although is likely to be expensive.
need to be produced annually by 2050. Biogenic carbon taken from the atmosphere
would be sequestrated underground as CO 2,
Significant investments are being made to
with only the hydrogen extracted from the
scale-up hydrogen production. It is expected
syngas.
that costs of existing higher-carbon production
methods such as steam methane reforming Sales of FCEVs are obviously dependent on the
(SMR) and coal gasification will increase in the existence of the hydrogen infrastructure
future due to increasing fossil fuel prices and required for fuel and the interest of car
costs of carbon – partly offset by technology manufacturers in entering this market. We are
advancements. At the same time, it is expected relying on national hydrogen initiatives such as
that a variety of technologies and feedstocks UKH2Mobility to overcome the obstacles there
will be developed that are able to produce which include: the current high cost of hydrogen
clean, CO2-free hydrogen in the future. These production as discussed already; the cost of
include: installing hydrogen re-fuelling infrastructure;
and space restrictions at fuel stations where
Thermo-chemical conversion of fossil fuels
there will be a need to continue to store
with carbon capture and storage (CCS), using
conventional fuels while also creating the
SMR or coal gasification. These are expected
underground space required to safely house
to be the most cost effective future
hydrogen tanks (see Box 3 for global
production methods;
commitment to hydrogen infrastructure).
3
http://www.netl.doe.gov/technologies/hydrogen_clean_fuel
s/refshelf/pubs/The%20National%20Hydrogen%20Vision.pd
5
f http://www.iphe.net/docs/Resources/Power_trains_for_Eur
4
http://www.iea.org/techno/essentials5.pdf ope.pdf
6Figure 3: Carbon intensity and future costs of different H2 production methods
Source: McKinsey, 2010
Key: CCS – CO2 Capture and Storage; CG – Coal Gasification; CSMR – Central Steam Methane Reforming; CWE – Central
Water Electrolysis; DSMR – Distributed Steam Methane Reforming; DWE – Distributed Water Electrolysis; IGCC – Integrated
Gasification Combined Cycle
The modelling underpinning this report follows Box 3 - Global commitments to hydrogen
the assumptions about hydrogen infrastructure infrastructure
made in the McKinsey 2010 Powertrains for Germany launched the H2Mobility6 initiative in
Europe study. Hydrogen production, delivery September 2009, to evaluate options for an area-
and storage technologies for vehicles are close wide roll-out of hydrogen fuelling stations in
to technically mature, but to achieve suitable Germany, then agree and implement a joint
utilisation and make them cost-effective, an business plan to deliver. Partners involved include
orchestrated investment plan is required to Daimler, EnBW, Linde, OMV, Shell, Total and
build up the first critical mass of hydrogen Vattenfall.
supply. The UK Government launched its own
UKH2Mobility7 initiative in January 2012, to
678910
analyse the case for introducing FCEVs to the UK,
and then develop an action plan for roll-out by
2015. The industry partners involved include Air
Liquide, Air Products, BOC Group, Daimler,
Hyundai, Intelligent Energy, ITM Power, Johnson
Matthey, Nissan, Scottish and Southern, Tata
6
http://www.greencarcongress.com/2009/09/h2-mobility- Motors, Toyota and Vauxhall.
20090910.html
7
http://nds.coi.gov.uk/content/Detail.aspx?ReleaseID=4228 Major “Hydrogen Highway” schemes have also
77&NewsAreaID=2 been set up in California8, Scandinavia9 and
8
http://www.hydrogenhighway.ca.gov/ Japan10.
9
http://www.scandinavianhydrogen.org/
10
http://www.japantimes.co.jp/text/nn20110118f1.html
73. The role of UK technology in Box 4 – The Carbon Trust Polymer Fuel Cells
Challenge
reducing fuel cell costs
The PFCC aims to accelerate the commercialisation
When the Carbon Trust launched the PFCC in of breakthrough polymer fuel cell technologies to
2009 it carried out a detailed analysis to enable the step-change in cost needed to unlock
mass-market applications. Its objectives are to:
determine the target cost reduction that would
be needed to make FCEVs cost competitive with 1. Reduce system cost to $36/kW;
ICEs. A breakthrough in PEM fuel cell 2. Demonstrate a system at 5-10kW scale; and
technology is needed in order to achieve the 3. Secure a development and supply agreement
$36/kW automotive cost target that this for at least one technology.
analysis implied.
To achieve these ambitious objectives, the Carbon
The Carbon Trust identified that breakthroughs Trust has been working with internationally
in the following PEM fuel cell areas would have renowned polymer fuel cell experts to structure
the programme so that it is market-oriented and
large cost benefits:
end-user focused, using the following approach:
Improving the power delivered per unit
weight and volume; • Selection of the best UK technologies with the
help of leading experts;
Reducing the amount of platinum used in the • Structuring of investments to accelerate
catalysts; commercialisation, and recoup capital;
• Provision of leading expert technical support
Reducing the fuel cell system complexity and
to guide technology development; and
the number of air, fuel, heat and water
• Provision of business support and network to
management components; and, engage auto-OEMs (Original Equipment
Improving durability, especially of many of Manufacturers).
the novel materials being used.
The $10m initiative has two phases:
The UK has world-renowned industrial and Phase 1: De-risk technologies and
academic expertise in the areas of polymer fuel demonstrate feasibility. Carbon Trust
cell technology, chemical processes and support and network used to build
$3.5m industry partnerships and set
materials science – all these are directly
development targets meeting customer
relevant to addressing the cost challenge.
specifications
Recognising these strengths, the Carbon Trust
launched the PFCC11 in September 2009 (see Phase 2: Industry partners and Carbon
Box 4 for further information about the PFCC). Trust investing to accelerate the
commercialisation of the most
$6.5m promising technologies leading to a
A nationwide competition was run to select the
most promising UK PEM fuel cell technologies. development licence or supply contract
with a major customer/manufacturer
After an extensive due diligence process, three
teams out of 15 were selected for Carbon Trust
Phase 1 funding:
ACAL Energy;
ITM Power; and,
Imperial College London & University College
London.
11
http://www.carbontrust.co.uk/emerging-
technologies/current-focus-areas/fuel-cells/pages/fuel-
cells.aspx
84. The breakthrough UK fuel ACAL Energy $49/kW
ACAL
cell technologies ACAL Energy’s patented Potential
27% cost
FlowCath® fuel cell design,
reduction
Outlined below are the three system-level illustrated in Figure 4, uses
breakthrough UK technologies that could meet $36/kW
a liquid polymer cathode
or beat the automotive cost target of $36/kW: solution, which replaces the platinum-based
solid cathode used in standard PEM fuel cells.
ACAL Energy: zero-platinum liquid catalyst;
This represents a fundamental design
ITM Power: high power density membrane; breakthrough that has the potential to reduce
and, expensive platinum use by at least two thirds,
reduce the number of components within the
IC-UCL: novel stackable board architecture
overall system (by avoiding fuel humidification
Full case studies for each of these projects are and water recovery), and increase durability (as
provided in Annexes A to C. In addition, in it replaces the solid cathode of typical systems,
Annex D there is a case study for the Ilika which usually suffers performance degradation
project developing new catalyst materials. For that limits product lifetime). It is the world’s
each system-level breakthrough technology, the highest performing system with a platinum-free
down arrow icons show the scale of potential cathode, and shows potential for power
cost reduction achievable versus the expected densities of 1 W/cm2 and higher.
costs of conventional state of the art
technologies at mass production volumes The Carbon Trust invested £1m of funding to
($49/kW). support ACAL Energy’s development of
FlowCath® for automotive applications in March
2011 and in July 2012 provided a further
investment of £850k. These funds will
contribute towards the development of a 10 kW
(1/8th scale) automotive stack capable of
Figure 4: FlowCath® half-cell and regeneration system
9achieving car makers’ current targets for cost, worked with other commercial organisations
size, weight and durability. including OEMs and industry leaders globally,
who have replicated these results using ITM
Power’s membranes in their own systems. In
ITM Power $49/kW
Potential July 2012 the Carbon Trust invested £1.1m in
ITM
ITM Power’s patented 29% cost ITM Power to contribute towards the
membranes use low-cost, low reduction development of a full-scale active area
toxicity materials (ionic $35/kW automotive cell capable of achieving a power
polymers) instead of the density of 2 W/cm2 at low platinum loading (0.3
perfluorosulfonic acid membranes that are the mg/cm2).
current industry standard. ITM Power have the
highest ever published power density of >2.1 Imperial College & University
W/cm2 in H2-air, as illustrated in Figure 5. This College London
ultra-high power density membrane has the
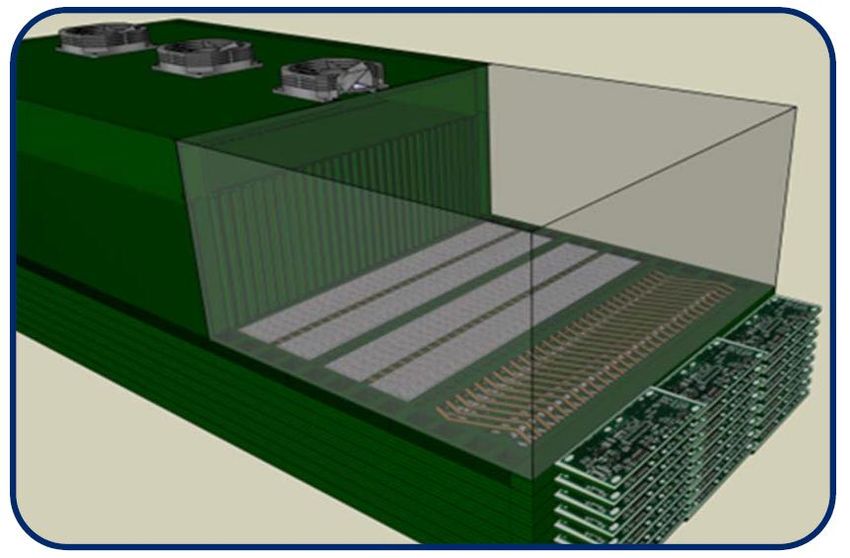
IC and UCL have developed $49/kW
potential to radically reduce the cost, size and
IC/UCL
a new fuel cell stack design. Potential
weight of PEM fuel cells. This is because higher
This modular ‘Flexi- Planar’ 47% cost
power densities translate into more power per reduction
design uses a layered
cell; hence a much smaller, lighter stack can
arrangement of laminated, $26/kW
meet the same power output.
printed circuit board materials, bonded on top of
ITM Power’s original testing used oxygen as the each other to create a fuel cell stack with
oxidant, while automotive applications use air, internal fuel, water and air channels. These
simplifying the system but reducing power boards lead to cost benefits over conventional
densities. In Phase 1 of the PFCC the Carbon fuel cell systems by eliminating the need for
Trust provided £200k of funding for ITM’s initial several components that are normally used in a
membrane work and H2-air testing, which conventional fuel cell. The biggest areas for
produced power densities that are double the potential cost reduction are air-, fuel- and
norm (>2.1W/cm2). ITM Power have since water-management, sealing (no gaskets or
Figure 5: Performance of ITM Power membrane in H2/air compared to automotive target
10frame required) and stack assembly. The boards
are also easy to assemble, and can be made
using low-cost, high volume manufacturing
techniques. The team’s Flexi-Planar technology
can also be used with many types of fuel cells,
and the inherent fault tolerance means the
systems are more tolerant of materials
variations, allowing the use of lower cost
materials and components. The team is
engaging with customers in both automotive
and micro-CHP applications to develop product-
specific requirements for the next stage of
Figure 6: Model of a Flexi-Planar stack, with
technology development. cut-away
To date, the Carbon Trust has provided £750k
of PFCC funds to develop a proof of concept
prototype arrangement of flexi-planar cells.
115. Modelling Methodology power densities, platinum loadings, a bill of
materials for their system, and information
The cost and market modelling undertaken for about how their innovation affects key system
this study used the following steps: components.
Fuel cell system costs for each project team
Gather input technical parameters from each
PFCC team were then projected at mass manufacturing
volumes by E4tech and Austin Power
Engineering, using a cost model specifically
developed for the PFCC. This uses a bottom-up
Bottom-up cost modelling gives $/kW fuel cell
system costs (and external benefits included) approach, complimented by experience-based
methodologies, to determine the cost of major
stack and balance of plant components.
Evaluate technical competitiveness of FCEV,
PHEV and ICE The case studies give further detail of the cost
savings by component. A platinum price of
$1,600/troy oz has been used throughout the
Evaluate cost competitiveness based on total cost modelling, based on traded prices in early
cost of ownership (TCO) over 3 years for
FCEV, PHEV and ICE 2012. This is a conservative assumption,
compared with expected platinum price rises in
future. See Box 5 for further discussion of
Estimate purchase probability, based on platinum costs and use.
normal distribution of technical and cost
competitiveness
Monte Carlo analysis to determine most likely
long-run market shares
Bass Diffusion to determine uptake
deployment curves
Calculate sales figures based on deployment
and retirement of each vehicle type
Calculate market value of PEMFC drivetrains
based on vehicle sales plus ongoing fuel and
maintenance costs
Calculate CO2 savings based on difference in
Well-to-Wheels emissions factors and
projected vehicle deployment
Cost modelling by vehicle
Each project team provided E4tech and Austin
Power Engineering with the necessary cost
modelling input data including operating points,
12Box 5 - Platinum use Fuel cell system costs also depend on factory
Platinum (Pt) is a precious metal, with around 250 scale/manufacturing volumes, which were set at
tonnes/yr12 currently mined in South Africa, Russia current automotive standards of 500,000 units
and North America. Estimated13 world reserves are per year (i.e. a level not likely to be seen before
>30,000 tonnes. Pt trades14 on international 2030). Different scenarios can be run, with
markets for around $1,600/troy oz ($52/g) altered parameters and the choice of
currently, although its price has been volatile15.
components and fabrication processes included,
Given its high value, the majority of Pt used in
to determine key cost sensitivities. The key
FCEVs is likely to be recycled at the end of life of
the vehicle. factors that influence fuel cell system costs are
power density, platinum loading, and
complexity of system-level componentry.
2,000
Each project team intends to bring to market
Price ($/troy oz)
1,500
different fundamental research breakthroughs,
each with the potential to disrupt current fuel
1,000 cell industry paradigms, and bring down system
costs. At mass manufacture volumes, the PFCC
2002 2004 2006 2008 2010 2012
technologies are projected to achieve system-
500
level cost reductions of between 14% and
Figure 7 – Platinum prices 2002-2012 39% versus what fuel cells are currently
Source: Johnson Matthey16 expected to achieve in 2050 without these
interventions, depending on the level of
FCEVs using a baseline PEM fuel cell technology
are estimated to require around 17g ($884) of Pt
optimism regarding the input parameters. This
per mid-sized passenger car, although car makers is shown by the solid blue bars in Figure 8. Also
are looking at reducing this to only 10g ($520) in shown in this figure for comparison are the
the future. With an estimated 491 million FCEVs baseline costs at mass-manufacture volumes for
on the road globally in 2050, this would equate to current state-of-the-art technology based on
4,910 tonnes of Pt in use. At global sales of 37 the most recent published advances in polymer
million FCEVs in 2050, the Pt requirement in that fuel cell technology by competitors. However,
year alone would be 370 tonnes of Pt ($19bn at
some of the benefits of the PFCC technologies
current prices), and 148% of 2012’s Pt market.
are not fully captured in the cost modelling –
While considerable Pt resource remains to be
exploited, a risk of future short supply
either because of the system boundary
nevertheless exists. definition (e.g. IC-UCL have electronic power
controls within each module, which are not
However, both ACAL Energy's and ITM Power’s
included within the baseline system costs), or
technologies have the potential to use as little as
because these capital costs do not include some
approximately 4g ($208) of Pt per FCEV. With
these technologies adopted across the global fleet, of the operational cost and technical benefits
this would only require 208 tonnes of Pt/year to be (e.g. improved fault tolerance and durability).
produced or recovered by 2050 (valued at $11bn In order to display the impact that including
at current prices). The PFCC therefore has some of these additional benefits within the fuel
potential to minimise expansionary pressures cell system boundary would have on the overall
placed on the Pt market, despite increased FCEV $/kW capital costs, dotted bars are included to
deployment.
show the potential minimum cost estimate.
12 13 14 15 16
These additional benefits have the potential to
increase system-level cost savings to reach a
level of between 19% and 48% vs. the
12
http://www.platinum.matthey.com/uploaded_files/Int_201 baseline. Including these additional benefits
1/press-release-tonnes-final.pdf
13
http://www.lenntech.com/periodic/elements/pt.htm
14 16
http://platinumprice.org/ http://www.platinum.matthey.com/pgm-prices/price-
15
http://www.regalgoldcoins.com/platinum-price-chart charts/
13means that the Acal, ITM and IC/UCL PFCC
technologies all have the potential to meet the
$36/kW target as indicated in Figure 8.
Figure 9 shows the estimated long-term total
cost of ownership of FCEVs (with and without
the PFCC), ICEs and PHEVs, once all these
vehicles are produced at mass manufacturing
volumes. The trend is for non-motive parts such
as the chassis, body and mark-ups to make a
much larger contribution to the overall vehicle
purchase price than the power train.
60
Mass manufacture fuel cell system cost ($/kW)
55
Baseline
Expected cost of current state of the art fuel cell
range
technologies at future mass manufactured volumes
50
Potential cost
reductions of
45
breakthrough UK
technologies
40
$36/kW
automotive
35 target
30
25
ACAL ITM IC-UCL
Figure 8: Ranges of automotive fuel cell system costs at mass manufactured volume.
Notes: The industry baseline and technology of each Polymer Fuel Cells Challenge (PFCC) system-
level project team are shown. Solid blue bars represent the range of model outputs, and dotted bars
estimate inclusion of benefits outside the standard fuel cell system boundary. Source: Carbon Trust,
E4Tech and Austin Power Engineering analysis. Underlying data: from PFCC teams and, for the
industry baseline, publicly available data related to competing technologies.
1440
FCEV uptake modelling and model
Maintenance outputs
35
Fuel The output from the cost analysis was then
Total cost of car ownership ('000 US$)
30
used in a market sizing model to estimate
Retail price
25 PFCC-specific impacts on future market
Markup penetrations, market values and CO2 savings
20
using the ITM cost profile. The results of this
Chassis, body
15 new analysis are given in the following sections
Transmission, of this report.
10
control
Energy storage
Customers take a range of factors into
5
Power train consideration when purchasing a car, including
0 a number of intangibles such as comfort,
Baseline PFCC ICE PHEV
FCEV FCEV appearance, image and brand name, which are
not quantified in this study (a full list of
Figure 9: Long-term (15-year) total cost of intangible factors is provided in Figure 10).
ownership for representative passenger road
However, in common with other studies of this
vehicles
Source: Carbon Trust, E4Tech and Austin Power type (e.g. McKinsey, 2010), it is assumed that
Engineering analysis. Underlying data: McKinsey customers are unlikely to consider annual costs
2010 across the full 15 year lifetime of the vehicle –
they are more likely to only include costs within
For a mid-sized passenger vehicle, a baseline a limited time horizon (e.g. 3 years) when
PEM fuel cell technology with a system cost of making a purchase decision. The market
$49/kW at mass-production volumes would give penetration modelling is based on a 3 year TCO
a total power train cost of $4,165 (for a mid- to reflect the limited time horizon of consumer
sized car requiring an 85kW fuel cell). A purchasing decisions.
successful PFCC technology meeting a $36/kW
mass production target would have a power FCEVs were compared with two competing
train cost of only $3,060 – a cost saving technologies: PHEVs, and ICEs. They were
significant enough to enable FCEVs to compete scored in terms of their technical
with ICEs on a total cost of ownership basis. competitiveness (e.g. reliability, perceived
The relative impact on the overall FCEV safety, refuelling time, noise and emissions)
purchase price equates to about 6%, based on and their TCO at a manufacturing volume of
typical long-term vehicle retail costs, which are 500,000 units per year.
estimated to lie in the range $26-31k, as shown
in Figure 9. It has been assumed throughout the analysis
presented in this report that FCEVs are most
In summary, the purchase price of a FCEV is likely to compete in the mid-size passenger car
expected to remain slightly higher than an ICE, (C/D segment) market (McKinsey 2010),
even with a successful PFCC breakthrough. against ICE and emerging PHEV technologies.
However, many customers will also consider As such, the automotive application modelled is
annual fuel and maintenance costs in their the same as the C/D segment light duty
purchase decisions17 – i.e. a total cost of passenger vehicle modelled in the McKinsey,
ownership. Therefore, since FCEVs are more 2010 study. In addition, it has been assumed
energy efficient than ICEs, adding in annual fuel that pure battery electric vehicles (BEVs) are
(and maintenance) costs leads to FCEVs unlikely to compete in this market due to
achieving cost competitiveness with ICEs on a limited range.
TCO basis.
17
The King Review of Low Carbon Cars Part I, 2007
15The FCEV modelled has a peak power output of Ease of use
85kW, annual distance driven of 12,000km/yr Fuel availability
and an average product lifetime of 15 years Safety
(with a standard deviation of 7 years). As in the Time spent refuelling / recharging
McKinsey study, no taxes, carbon price or Range (time between refuelling /
subsidies have been considered in the analysis. recharging)
The total cost of ownership only includes the Robustness
purchase cost of the vehicle and the first 3 Portability
years of fuel and maintenance, which is a Operating noise
conventional modelling approach. A longer Emissions
timescale would make the FCEV more
attractive, as operating costs become more These technical competitiveness scores were
important. Consumers take into account many then weighted by 'market needs', i.e. whether
cost, technical and intangible factors when each criterion was: a key purchasing criterion
considering the purchase of a car, as given in for the consumer; not essential but evaluated
Figure 10 below (King Review, 2007). The by the consumer during purchase decision; or
probability of purchase in this study is only not considered by the consumer. The sum of
based on the relative total cost of ownership these weighted competitiveness scores gives an
and the relative technical competitiveness overall technical competitiveness rating for each
scores of each of the vehicle options. In technology.
calculating total cost of ownership, fuel and
maintenance costs were discounted over three In general, technical scores are similar,
years at a rate of 10%, to represent consumers’ although FCEVs and PHEVs have noise and
attitudes to future costs. emissions advantages over ICEs, and PHEVs
have the disadvantage of long recharging times
in some scenarios.
The technical competitiveness was then
combined with cost competitiveness (giving a
heavier weighting to cost-competitiveness) to
produce an overall competitiveness value for
each technology in each application, which was
then used to determine the market shares by
Monte Carlo simulation. Monte Carlo analysis
involves the substitution of probability
distributions in place of values that are
uncertain, and involves repeated calculation of
Figure 10: Factors that are important to results using random values from the
consumers in deciding which car to buy probability functions. This enabled the model to
Source: King Review, 2007
resolve purchase probabilities into likely long-
run market shares.
Each powertrain technology was assigned a
In the model, a fall in FCEV purchase price leads
technical competitiveness value vs. the others
to lower TCO, which leads to a higher purchase
(better, same or worse) for each of a number of
probability vs. the competing vehicle options,
technical criteria:
and hence higher deployment of FCEVs.
Reliability / maintenance A 10% fall in baseline FCEV purchase price
Lifetime equates to a 14 %-point increase in long run
Start-up time market share. A 10% increase in FCEV
16purchase price over the projected baseline
equates to a 9 %-point decrease in market
share18.
At present, ICEs are assumed to have 100% of
the market. PHEVs are assumed to become
commercially available in 2012, and FCEVs in
2015. Forecasts for the total car fleet size were
taken from the IEA/WBCSD Transportation
Model19.
Bass diffusion market modelling was then used
to determine uptake deployment curves, along
with sales and retirements figures. Market Figure 11: Car well-to-wheel emission factors
innovation and imitation factors from industry over time Source: Carbon Trust, E4Tech and Austin
Power Engineering analysis
and academic studies20 were used to form the
shape of the deployment curve. The innovation
rate was taken to be 0.00075, and the imitation over time as the input fuel decarbonises and
rate was 0.28036. vehicle efficiencies improve.
CO2 savings This shows that FCEVs can save a significant
amount of CO2 compared to ICEs (even when
The ‘well-to-wheel’ emissions factors of different
using hydrogen produced from natural gas in
vehicle types are mainly dependent on two
early years), and versus PHEVs even once grid
factors21; average vehicle energy efficiency
electricity has decarbonised. However, clean
(km/kWh input energy) and the carbon intensity
sources of H2 must be produced and consumed
of the energy consumed (gCO2e/kWh).
in order to achieve these savings.
Combined, these lead to the well-to-wheel
emissions factors shown in Figure 11, which fall The total CO2 saved in the transport sector is
measured as the difference in total MtCO2e/yr
18
Note that this is not a traditional measure of linear emissions between “with PFCC” and “without
price elasticity, but is the result of several PFCC” scenarios, i.e. including the effect of the
competition and stochastic steps in the model, and slight decrease in PHEV deployment as FCEVs
therefore the sensitivities above will change non-
linearly with the baseline costs. take a larger market share from both ICEs and
19
http://www.wbcsd.ch/plugins/DocSearch/details.as PHEVs.
p?type=DocDet&ObjectId=MTE0Njc
20
NREL (2005) “R&D Advancement, Technology Note that the CO2 savings calculated in this
Diffusion, and Impact on Evaluation of Public R&D” modelling using are based on vehicle
CET (2009) “Electric Vehicles in the United States: A
New Model with Forecasts to 2030” deployments and their well-to-wheel emission
Meyer (2008) “Modeling technology diffusion of factors.
complementary goods: The case of hydrogen vehicles
and refueling infrastructure”
Park et al. (2011) “Development of a market
penetration forecasting model for Hydrogen Fuel Cell
Vehicles considering infrastructure and cost reduction
effects”
21
Average vehicle energy efficiency (km
travelled/kWh of input energy): 2.4km/kWh diesel for
an ICE, 4.83km/kWh for a PHEV (driving 75% on
electricity, 25% on petrol), 4.46km/kWh H2 for a
FCEV. The carbon intensity of the energy consumed
(gCO2e/kWh): Fossil diesel/petrol based on IEA OECD
data, electricity based on EU grid average, H2 from
McKinsey (2010)
176. Results Deployment potential
In the case of a successful PFCC, a 6% decrease
Reaching the automotive cost target could boost
in FCEV purchase price leads to about a 5%
fuel cell vehicles’ market share for cars from
decrease in 3-year TCO, thereby increasing
25% to 34%. By 2050, the extra 200 million
FCEV market penetration from 25% to 34%.
FCEVs on the roads would increase the PEM fuel
This means an extra 3.3 million FCEVs could be
cell market value by $30bn (reaching $261bn).
on UK roads by 2050, and an extra 200 million
CO2 savings due to FCEVs would also increase
globally, reaching 691 million FCEVs overall (see
by 260 million tonnes per year (reaching 924
Figure 12).
million tonnes per year overall – similar to
Germany’s current annual emissions). A The 5% reduction in 3-year TCO is important
summary of the key findings of the analysis is enough to improve the cost competitiveness of
shown in Table 1 and the key modelling insights FCEVs versus PHEVs and ICEs, which will in turn
are shown in Box 6. increase the likelihood of FCEVs being
purchased by customers. This probability of
Box 6 - Key Modelling Insights purchase was estimated using the ratio of TCOs,
Cost reductions achieved by the PFCC are the key and a weighted technical score based on key
driver for increased FCEV market penetrations: consumer criteria – how much more or less
PEM fuel cell system costs at mass volumes are attractive the performance of an FCEV is
reduced from $49/kW, reaching ~$36/kW compared to an ICE or PHEV, and how it differs
technically.
Long-term FCEV power train costs are reduced A discussed in Section 5, a number of standard
(from $4,165 to $3,060) modelling techniques were then used to derive
the values in Figure 12. In the UK, vehicle
FCEV total cost of ownership falls to become ownership is expected to plateau in 2030. As
more competitive with that of an ICE (5% the vehicles considered in this analysis are
decrease in 3-year TCO)
technically similar, and the costs of ownership
of the vehicles converge in the future (when
Improved chance customers will purchase including the effects of the PFCC), the model
FCEVs shows a plateau in UK market share for PHEVs
and FCEVs towards 2050. FCEVs could only
Higher market penetration of FCEVs, displacing continue to capture further market share in the
ICEs and PHEVs in projected markets (market UK (and the rest of Europe) if their technical or
share increases from 25% to 34%) cost competitiveness continued to improve
beyond that achievable by the PFCC. However,
Increased FCEV sales drive higher market the global FCEV market is forecast to continue
values (additional $30bn globally) to grow beyond 2050, as the global market for
cars continues to grow (see Figure 13).
Low per km emissions using clean H2 leads to
increased transport fleet CO2 savings (additional
260Mt CO2e saved per year)
18Additional PEM PEM fuel cell Additional GHG GHG savings due
Additional FCEVs Number of FCEVs
Number of cars fuel cell market market value savings due to to all FCEVs
due to the PFCC with the PFCC
(million) value due to the with the PFCC the PFCC displacing ICEs
(million) (million)
PFCC ($bn) ($bn) (MtCO2e/yr) (MtCO2e/yr)
2020 2030 2050 2020 2030 2050 2020 2030 2050 2020 2030 2050 2020 2030 2050 2020 2030 2050 2020 2030 2050
33 33 33 0.06 0.9 3.3 0.1 2.0 11.4 0.06 0.6 0.4 0.2 2.3 3.5 0.01 0.7 3.2 0.05 2.1 13
UK
Rest of 231 234 235 0.4 6.1 23 0.8 14.0 81 0.4 4.7 3.5 1.3 17.2 31 0.3 7.4 30 0.5 17.3 108
EU
USA & 318 349 406 0.6 9.2 40 1.1 21 140 0.6 7.1 6.0 1.8 26 53 0.4 11 53 0.7 26 187
Canada
OECD 108 111 119 0.2 2.9 11.9 0.4 6.6 41 0.2 2.2 1.8 0.6 8.1 16 0.1 3.5 15 0.3 8.2 55
Pacific
Rest of 379 561 1,217 0.7 15 121 1.3 33 419 0.7 11 18 2.2 41 159 0.4 18 158 0.9 41 561
World
1,069 1,289 2,009 1.9 34 200 3.8 77 691 2.0 26 30 6.1 94 261 1.2 41 260 2.5 95 924
Global
Table 1: Summary of key findings.
Note that some numbers in this table differ slightly to those given in the report text, due to rounding.
19UK Global
Figure 12: UK & global car deployment, with (solid areas) and without (dashed lines) the PFCC
Source: Carbon Trust, E4Tech and Austin Power Engineering analysis. Underlying global car fleet numbers are
based on 2004 IEA/WBCSD data.
2500
The extra FCEV deployment comes mainly at Rest of World
Cumulative deployment (million units)
the expense of ICEs, with PHEV deployment OECD Pacific
largely unchanged by the PFCC (only decreasing 2000
USA & Canada
slightly).
UK
Rest of EU
Market values 1500
With commercial deployment of FCEVs starting
in 2015, market values increase rapidly from 1000
2020 to the mid-2030s, as shown in Figure 14.
By the late 2030s, new sales have started to
drop. This is caused by market saturation of 500
$36/kW FCEVs (note that relative cost
competitiveness for all vehicle types modelled
were fixed over the modelling period such that 0
2010 2020 2030 2040 2050
the effect of further cost reductions on the
market penetrations of different vehicles beyond
their cost targets are not shown), but Figure 13: Number of cars globally
Source: Carbon Trust, E4Tech and Austin Power
approaching 2050, the total market value
Engineering analysis. Data from: IEA & WBCSD
increases again as FCEVs being retired at the (2004) Transport model
end of their life are replaced.
205.0 300
UK With PFCC Global
PEM fuel cell market size (US$ bn)
250
4.0
Without PFCC
200
3.0
150
2.0
100
1.0
50
0.0 0
2010 2020 2030 2040 2050 2010 2020 2030 2040 2050
Figure 14: UK & global passenger car PEM fuel cell market values, with and without the PFCC
Notes: the drop in sales between the mid-2030s and mid-2040s is due to market saturation of FCEVs (note
that relative cost competitiveness for all vehicle types modelled were fixed over the modelling period), but as
the first FCEVs sold in the 2020s and 2030s reach the end of their useful life (15 years), sales of new vehicles
begin to pick-up again from about 2045. Source: Carbon Trust, E4Tech and Austin Power Engineering analysis
A successful PFCC is estimated to lead to an globally (similar to the current annual emissions
increase in the FCEV market value of $59m in of the UK and France combined). These CO2
the UK in 2020, and $2.0bn globally. In 2050, savings, shown in Figure 15 are based on the
the difference in market values with and without total FCEV deployments with a successful PFCC
the PFCC could be as high as $425m in the UK, shown in Figure 12, and the difference in well-
and $30bn globally. Using the annual FCEV to-wheel emissions from ICEs (Figure 11), due
sales data from the market modelling, the FCEV to a move to cleaner hydrogen sources over
market size is calculated as the applicable time (e.g. from steam methane reforming to
capital costs in every FCEV sale in that year. renewable electrolysis).
These costs relate to the power train (including
the fuel cell system), transmission, control, and By modelling both FCEV deployments with the
energy storage components and equate to PFCC and without the PFCC, it was possible to
about $5,000 per FCEV in the market value calculate the incremental GHG savings from the
results. extra FCEVs due to a successful PFCC. The
higher and earlier deployment of FCEVs due to
Note that the high costs of the chassis, body the PFCC, as shown in Figure 12, will displace
and markups, which are not specific to FCEVs, more ICEs (and some PHEVs), changing the
are not included. If they were to be included, overall car fleet emissions, as shown in Figure
FCEV sales in 2050 would be valued at 16. Global emissions plateau in 2030 with the
$1,490bn. Adding annual maintenance and fuel introduction of FCEVs and PHEVs, then rise
costs for all the FCEVs on the road in 2050 again after 2040 due to the continued
would increase this value up to $2,075bn. underlying growth in the car market. By
contrast, UK car fleet emissions fall rapidly as
CO2 savings the grid and hydrogen supply decarbonise and
The CO2 savings due to FCEVs are negligible in remaining ICE vehicles become more efficient.
2020 as comparatively few FCEVs are on the Figure 10 shows these effects and the additional
road, but by 2050 they could reach 13 million impact that the PFCC is likely to have through
metric tonnes of carbon dioxide equivalent per displacement of only mid-sized cars by FCEVs.
year (MtCO2e/yr) in the UK, and 924 MtCO2e/yr
2114
By 2050, the GHG savings due to the PFCC
GHG savings (MtCO2e/yr)
12
are therefore 3.2 MtCO2e/yr in the UK, and
10 260 MtCO2e/yr globally (equivalent to the
UK current annual emissions of the
8
Netherlands). The technologies being
6 supported by the PFCC have similar energy
efficiencies to the baseline FCEV
4
technologies and will therefore have similar
2 CO2 benefits.
0
2010 2020 2030 2040 2050
1000
GHG savings (MtCO2e/yr)
800
600
Global
400
200
0
2010 2020 2030 2040 2050
Figure 15: GHG savings due to FCEVs displacing only
ICEs
Source: Carbon Trust, E4Tech and Austin Power Engineering
analysis.
70 2500
UK Global
Car fleet emissions (MtCO2e/yr)
60
2000
50
1500
40
30
1000
20
Without PFCC
500
10
With PFCC
0 0
2010 2020 2030 2040 2050 2010 2020 2030 2040 2050
Figure 16: Car fleet emissions in the UK and globally, showing the effect of reduced mid-sized
passenger vehicle emissions due to the PFCC
Source: Carbon Trust, E4Tech and Austin Power Engineering analysis
22Other applications for fuel cells Note that market values only include the PEM
fuel cell system capital costs, but not other
Although passenger cars represent by far the
vehicle or equipment capex, operating or fuel
largest future market for PEM fuel cells, there
costs.
are other potential mass markets and nearer
term niche markets that would benefit from the Further indications of the potential savings can
cost reductions enabled under the PFCC. be seen in Table 3, Table 4 and Figure 17.
Increased PEM fuel cell deployment, market
values and CO2 savings could be achieved in a
variety of transport, stationary and portable
applications. The values in Table 2 are indicative
of the PEM fuel cell deployments that could be
achieved with a successful PFCC.
Market 2050 2050
share deploy- market
(%) ment value
(GW) ($bn)
Cars 34% 58,580 261
Buses 36% 310 16
Materials handling 93% 210 4
Domestic CHP 18% 260 8
Commercial CHP 26% 145 4
Telecom UPS 70% 15 0.4
Gensets 83% 345 13
Table 2: PEMFC deployments in other markets
with a successful PFCC
Cars = % of light duty passenger cars, Buses = % of all buses,
Materials handling = % of all forklifts, Dom CHP = % of all
residential heating systems and power supply (incumbent = gas
boiler + grid electricity), Commercial CHP = % of all commercial
heating systems and power supply, Telecom UPS = % of mobile
phone base transceiver stations, Gensets = % of portable generator
market (holiday camping, backup power, etc.)
Market share 2050 deployment 2050 market value
(%) (GW) ($bn)
Scenario: Baseline PFCC Baseline PFCC Baseline PFCC
Cars 25% 34% 41,845 58,580 231 261
Buses 32% 36% 275 310 14 16
Materials handling 81% 93% 185 210 4 4
Domestic CHP 12% 18% 175 260 6 8
Commercial CHP 21%
26% 145 125 4 4
Telecom UPS 56% 70% 10 15 0.4 0.4
Gensets 78% 83% 330 345 13 13
Table 3: Market share, deployment and market value with and without reaching the
$36/kW cost target of the Carbon trust Polymer Fuel Cells Challenge
23You can also read