Community Improvement Plan - 2017-2021 Adopted - Ennis, TX
←
→
Page content transcription
If your browser does not render page correctly, please read the page content below

-

    2017-2021 Adopted
Community Improvement Plan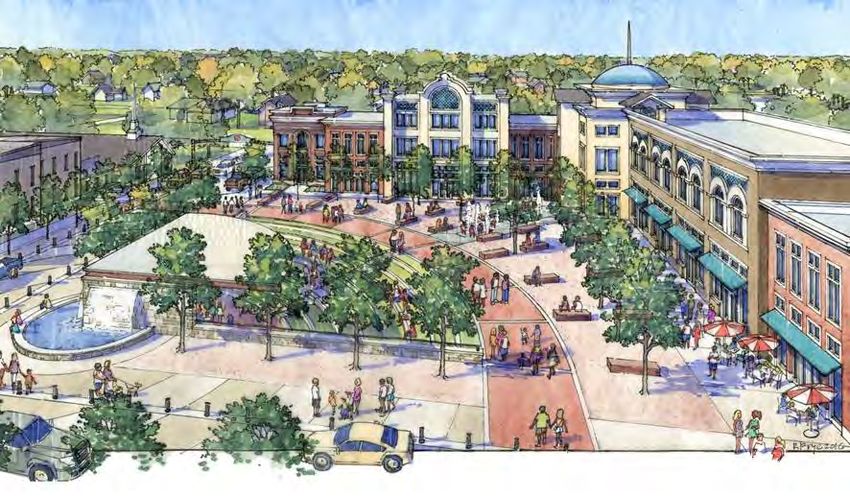
This page is intentionally blank.
COMMUNITY INVESTMENT PLAN

Table of Contents
Executive Summary....................................................................................................................................... 1
Introduction .................................................................................................................................................. 3
   Draft Vision Statement ............................................................................................................................. 3
   Draft Mission Statement ........................................................................................................................... 3
   Draft Organizational Values ...................................................................................................................... 3
   What is a Community or Capital Improvement Plan (CIP)? ...................................................................... 4
   What is a Capital Project? ......................................................................................................................... 4
   What is the Process for Developing the CIP? ............................................................................................ 5
   Capital Assets by Funding Source ............................................................................................................. 5
   Funding Considerations ............................................................................................................................ 5
   Sources of Funding.................................................................................................................................... 6
   Deciding to Borrow: Three Considerations ............................................................................................... 6
     Who Should Pay? .................................................................................................................................. 6
     Consider Your Funding Sources ............................................................................................................ 6
     Can We Afford It?.................................................................................................................................. 6
   How Inflation Impacts the CIP .................................................................................................................. 7
Conclusions ................................................................................................................................................... 9
   Community Improvement Plan ................................................................................................................. 9
     Community Improvement Project Details ............................................................................................ 9
         UPRR Safety Zone........................................................................................................................... 10
         Project North Plaza ........................................................................................................................ 12
         Project South Plaza ........................................................................................................................ 14
         New Bar Screenat WWTP............................................................................................................... 16
         Project Downtown Infrastructure .................................................................................................. 18
         IH 45 Ramp Reconfiguration .......................................................................................................... 20
         Playground Replacements (Jaycee, Kiwanis, Bluebonnet, Gauna, Lake Clark).............................. 22
         Project Airport ............................................................................................................................... 24
         Fire Station #1 ................................................................................................................................ 26
         Wastewater Package ..................................................................................................................... 28
         Wastewater Plant Improvements .................................................................................................. 30
         Fire Station #3 ................................................................................................................................ 32
         Restroom Facility (Jaycee) ............................................................................................................. 34
         Splash Pads (Jaycee, Lions) ............................................................................................................ 36
         Project Welcome Center ................................................................................................................ 38
         Streets Package .............................................................................................................................. 40
         Project North Sonoma Trail ........................................................................................................... 42
         Project South Sonoma Trail ........................................................................................................... 44
         Entry Portals................................................................................................................................... 46
         Hwy 34 Upgrade at Sonoma Trail .................................................................................................. 48
         General Ballfield Improvements (Bluebonnet, Veterans) ............................................................. 50
         General Trails (Fairview, Jaycee, Lake Clark) ................................................................................. 52

                                                                               i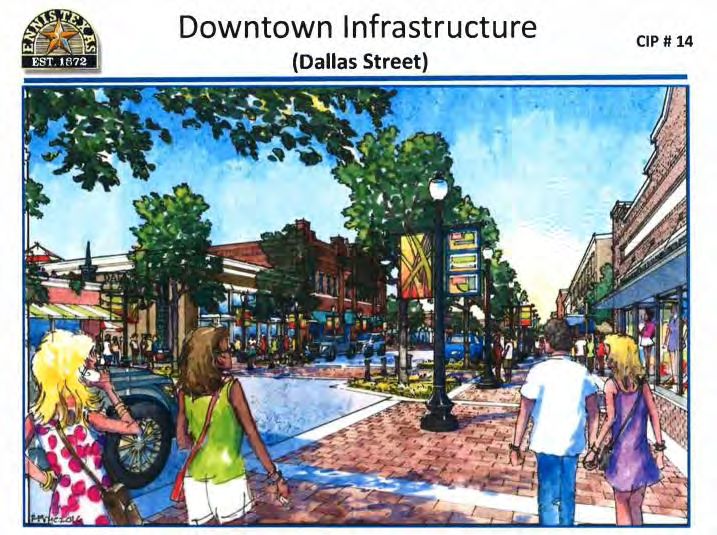
COMMUNITY INVESTMENT PLAN

           Senior Citizens / Civic Center ......................................................................................................... 54
           Skatepark ....................................................................................................................................... 56
           Ennis Avenue to IH 45 .................................................................................................................... 58
           Project Main Street Mall ................................................................................................................ 60
           Project Knox Street ........................................................................................................................ 62
           Project Brown Street...................................................................................................................... 64
           McKinstry Energy Savings Project .................................................................................................. 66
           Laneview Dr ................................................................................................................................... 68
           Golf Course .................................................................................................................................... 70
           Water Park ..................................................................................................................................... 72
           Natatorium / Public Pool ............................................................................................................... 74
           Indoor Sports Complex .................................................................................................................. 76
           Outdoor Sports Complex ............................................................................................................... 78

Table of Tables
Table 1 - Community Improvement Funding Sources .................................................................................. 3
Table 2 - Community Improvement Use of Funds ........................................................................................ 4

Table of Figures
Figure 1 - Funding Sources (Funded Projects) .............................................................................................. 3
Figure 2 - Funding Sources (Unfunded Projects) .......................................................................................... 3
Figure 3 - Use of Funds (Funded Projects) .................................................................................................... 4
Figure 4 - Use of Funds (Unfunded Projects) ................................................................................................ 4
Figure 5 - Pavement Condition Over Time (Lazarus, 2013) .......................................................................... 6
Figure 6 - Capital Improvement Plan Model (Elmer, 2006) .......................................................................... 7
Figure 7 - Rolling Annual Inflation 2000 - Current ........................................................................................ 9
Figure 8 - Normalized Cost Indices ............................................................................................................. 10
Figure 9 - Normalized Cost Indices 2010 to Current ................................................................................... 10
Figure 10 - Funded v.s. Unfunded Capital Projects ..................................................................................... 11

Appendix
City Commission - Community Values Survey Results ............................................................................... 81
City Staff - Community Values Survey Results ............................................................................................ 84
City Commission - CIP Project Ranking ....................................................................................................... 87

                                                                              ii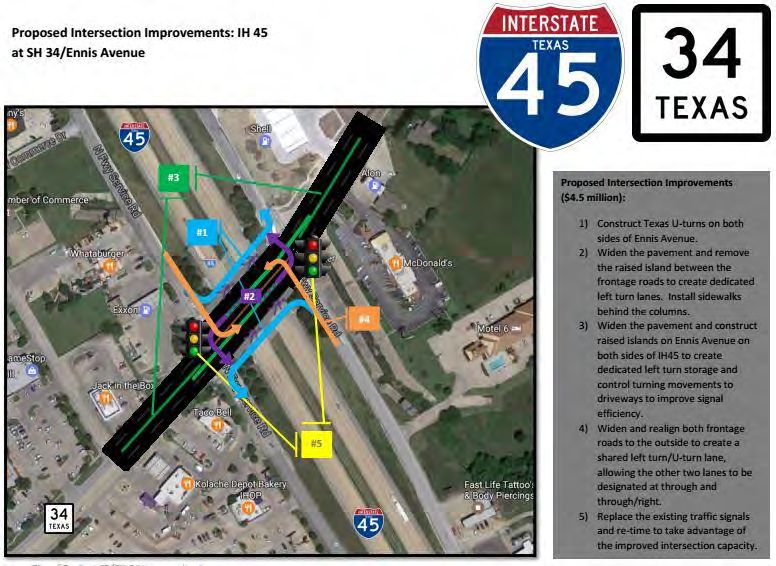
COMMUNITY INVESTMENT PLAN

Executive Summary
The 2017-2021 Community Improvement Plan (CIP) is designed to present the community and City
Commission with a view of the capital projects needed to meet today’s infrastructure needs as well as
those of the future. From work on underground water and wastewater lines to more visible projects,
such as those found in the Downtown Master Plan, the CIP identifies capital needs representing 35
projects requiring an investment totaling $110,215,000. City staff believes the plan meets the objective
of striking a balance between critical infrastructure needs, facilitating future development opportunities,
and promoting quality of life for the entire community.

In addition to the proposed projects, the document provides extensive analysis of capital needs
including a discussion of the planning process and funding options as well as a primer on capital
infrastructure maintenance.
Table 1 - Community Improvement Funding Sources

                                   Community Improvement Funding Sources

 Funded Projects                     2017                2018               2019                2020                  2021
 Fund Balance                     1,538,848          16,283,308         12,642,302           5,339,584             9,167,295
 Bonds                            2,298,789           3,331,500            920,000             840,000               940,000
 Grants                             290,000           4,041,768                  -          34,000,000            67,260,000
 Private Sources                          -           1,887,500         34,500,000                   -             2,780,000
 Total                            4,127,637          25,544,076         48,062,302          40,179,584            80,147,295

 Unfunded Projects                    2017                2018                2019              2020                  2021
 Fund Balance                             -            1,800,000                     -         110,000             7,067,705
 Bonds                              120,000                    -                     -         400,000                     -
 Grants                                   -                    -                     -               -                     -
 Private Sources                  1,200,000                    -                     -       8,400,000            23,000,000
 Total                            1,320,000            1,800,000                     -       8,910,000            30,067,705

 Grand Total                      5,447,637          27,344,076         48,062,302          49,089,584        110,215,000

Figure 1 - Funding Sources (Funded Projects)                     Figure 2 - Funding Sources (Unfunded Projects)

             Proposed Funding Sources                                         Proposed Funding Sources
                 (Funded Projects)                                               (Unfunded Projects)
      Private
                                                  Fund               Private                                         Fund
     Sources,
    39,167,500                                  Balance,            Sources,                                       Balance,
                                               44,971,337          32,600,000                                     8,977,705

     Grants,                                 Bonds,                                                                Bonds,
   105,591,768                             8,330,289                                                              520,000

                                                             1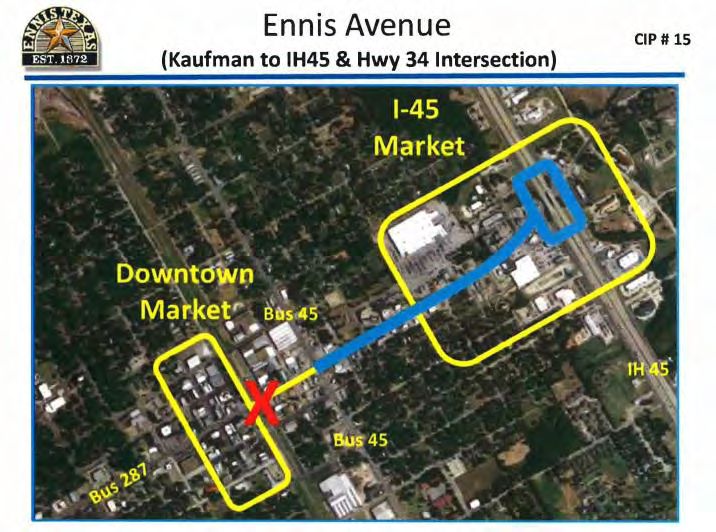
COMMUNITY INVESTMENT PLAN

The funding sources for the community improvements can generally be grouped into one of the
following categories: Fund Balance (cash), debt (bonds), grants, and private funding sources. Table 1
and Figures 1 and 2 provide a breakdown of the funding sources for both funded and unfunded
projects. Funded projects are projects that have been prioritized for completion by the City Commission
and are in the process of having specific funding sources identified and allocated. Unfunded projects
are projects that are unable to be funded by the City in the current five-year planning horizon.
Table 2 - Community Improvement Use of Funds

                                      Community Improvement Use of Funds

 Funded                                 2017               2018                2019                2020               2021
 Professional Services               1,936,789          3,434,000           1,095,000           1,215,000          1,295,000
 Acquisition                            52,000          3,000,000             250,000                   -                  -
 Construction                        2,088,848         19,160,076          46,717,302          38,964,584         71,232,295
 Total                               4,077,637         25,594,076          48,062,302          40,179,584         72,527,295
 Unfunded                                   2017           2018                  2019               2020               2021
 Professional Services                             -                -                   -          400,000                  -
 Acquisition                                       -                -                   -        1,500,000                  -
 Construction                                      -                -                   -                -          4,000,000
 Total                                             -                -                   -        1,900,000          4,000,000
 Grand Total                                       -                -                   -      42,079,584         76,527,295

Figure 3 - Use of Funds (Funded Projects)                         Figure 4 - Use of Funds (Unfunded Projects)

             Proposed Use of Funds                                             Proposed Use of Funds
               (Funded Projects)                                                (Unfunded Projects)
   Acquisition,                                                                                                 Professional
    3,302,000                                 Construction,        Construction,
                                                                                                                  Services,
                                              178,163,105           4,000,000
                                                                                                                  400,000
  Professional
    Services,                                                                                                   Acquisition,
   8,975,789                                                                                                     1,500,000

The Table 2 and Figures 3 and 4 provide a breakdown of how the funds are anticipated to be spent if the
Community Improvement Plan is adopted.

                                                              2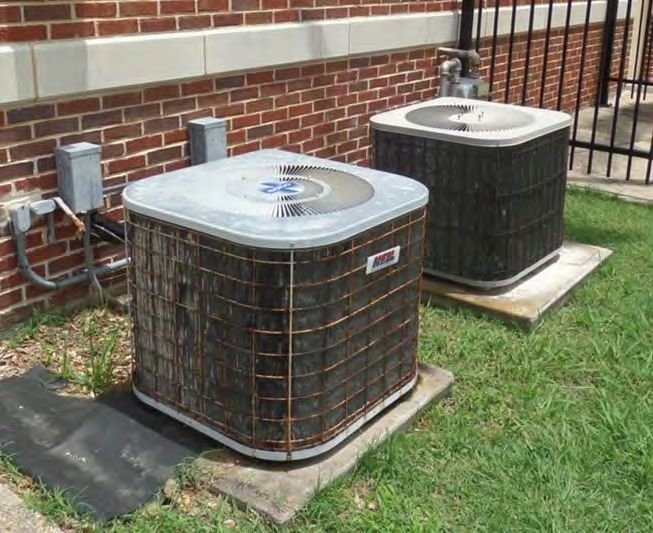
COMMUNITY INVESTMENT PLAN

Introduction
This proposed Community Improvement Plan (CIP), a first for the City of Ennis, has been an iterative
process that has included input from staff, community members, and the City Commission. The
committed leadership of the City Commission has been a driving force behind the development of this
community improvement plan. Hundreds of hours have been spent developing this plan, working with
staff, community members, and other stakeholders to better understand our community’s values, our
vision of the future, and laying out the mission before us. One of the outcomes of this process has
been the development of the following draft mission and vision statements and core values:

Draft Vision Statement
              We are a singular community, nestled amongst rolling hills of wildflowers,
   a community that embraces our diverse cultural history and natural beauty in shaping our future,
     mixing distinctive design and development amid open spaces, parks, trails, and quality of life
                              amenities, bringing joy to all phases of life.

Draft Mission Statement
                    We are united in creating a distinctive community that merges
      our unique past and singular future. . .our natural beauty with a flourishing economy. . .
    our public servants and engaged citizens. . .our educational and employment opportunities. . .
               as we provide effective, personalized, and exceptional municipal services
                               to all those who live, work, or visit Ennis.

For our community to be successful in this endeavor, we must align our long-term planning,
establish specific goals, tasks, and our desired outcomes within the budgeting process. As stewards
of our community’s resources we are committed to efficient, effective, and transparent
management, utilizing our organizational values in the decision-making process.

Draft Core Values
Trust - we can share thoughts and ideas without fear,          Quality - we take ownership and have pride in doing it
we mean what we say, we are dependable, we are                 the “Ennis” way, we provide personal and flexible
honest with ourselves and each other                           service
Customer Satisfaction - we anticipate, educate,                Commitment - we are true to our vision, mission and
manage, and exceed the expectations of our                     organizational values, we follow through, we act, even
customers                                                      in the face of opposition
Financial Stability - we are good stewards of public           Continuous Improvement - we constantly strive to be
funds, we focus on the “whole” community, we plan,             better tomorrow than we are today, as an individual, an
budget, and execute effectively                                organization, and as a community
Goals Orientation - we use organizational values to        Cooperation - we have a common goal, we collaborate
think, plan, and act strategically, we make decisions that and work with stakeholders, we understand there is a
align with our vision and mission                          time to lead and to follow
Leadership Development - we are all leaders, we will           Creativity - we are proactive, we are not afraid to take
support leadership development through teaching                risks, we find better solutions, we anticipate future
correct principles and providing the necessary tools and       needs, and we encourage the diversity of ideas within
training                                                       our organization

                                                           3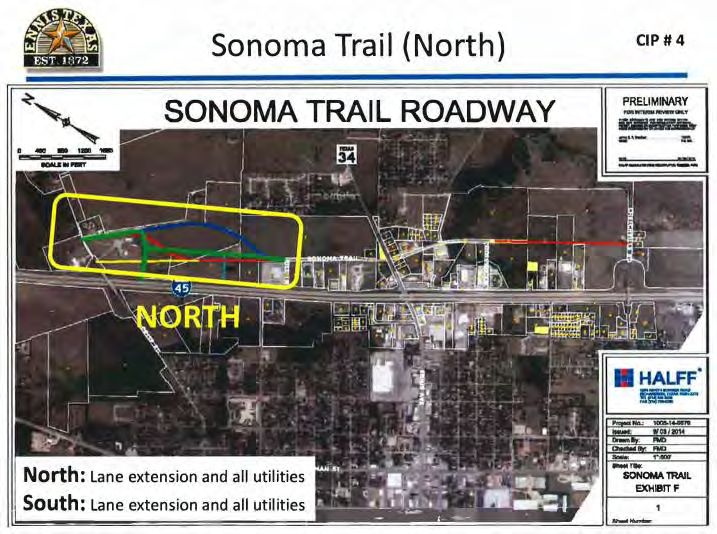
COMMUNITY INVESTMENT PLAN

What is a Community Improvement Plan (CIP)?
Developing a CIP is one of the first steps in the process of realizing our community’s vision. Before we
can create anything physically, we must first have a clear vision in mind of where we want to go. When
you look at the world, you may see amazing works of art, beautiful architecture and/or urban decay.
The difference in many cases depends on whether or not the corresponding communities had a vision
and planned for the future.

A CIP should not become a wish list, but be developed as a thoughtful, realistic plan, designed to fulfill
the long-term goals and objectives necessary to achieve the mission and vision of our community. A CIP
is a working document that presents the capital needs of a community over time. It provides details
about individual capital projects, how they align with our vision and mission, and the fiscal impact that
they may pose to the community.

What is a Capital Project?
Capital projects are the individual action plans that make up a Community Improvement Plan and
generally involve the acquisition of a capital asset. “Capital assets include major government facilities,
infrastructure, equipment and networks that enable the delivery of public sector services. The
performance and continued use of these capital assets is essential to the health, safety, economic
development and quality of life of those receiving services” (GFOA, 2010). In addition, the City of Ennis
creates a capital asset for all major equipment purchases that exceed $5,000.

It is important to remember that in most cases, capital assets require ongoing operating, maintenance,
and replacement costs. Recently, many communities have been struggling when trying to find a balance
between “new” capital expenditures while successfully maintaining existing capital assets. It is also
common to see communities defer essential maintenance costs, but this may end up reducing the
communities’ ability to provide adequate services, or potentially threaten the public health, safety, and
the overall quality of life. Delaying essential maintenance may reduce the overall useful life of the
capital asset and increase the maintenance costs or necessitate early replacement of the capital asset.
Figure 5 - Pavement Condition Over Time (Lazarus, 2013)

                                                          4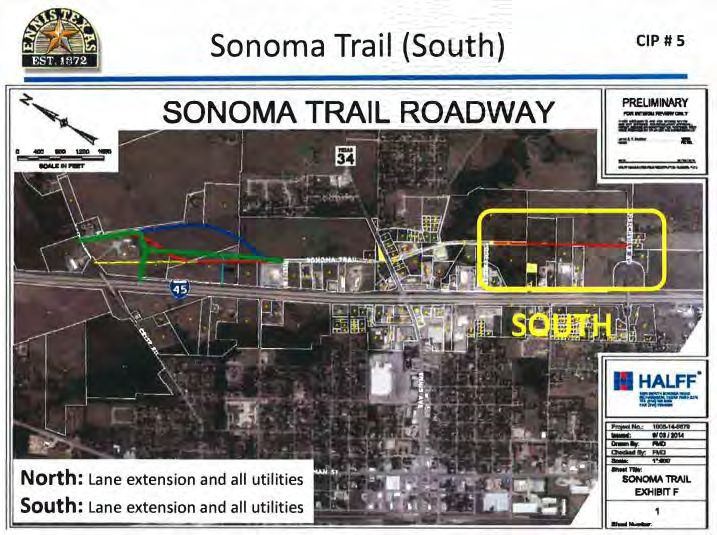
COMMUNITY INVESTMENT PLAN

What is the Process for Developing the CIP?
Capital budgeting may be described as the process used to determine the City’s long-term infrastructure
needs. They are generally broken down on a project basis which describes the scope and total costs
associated with the design, construction, operations, and maintenance of the project.

The CIP leans heavily upon the City’s vision, mission, comprehensive and strategic plans. The CIP plays
an integral role in the implementation of the City’s strategic plan, long-term operating budget, and
capital budget. The flowchart in Figure 2 outlines how a CIP may be incorporated into the planning
process.

Capital Assets by Funding Source
The project sheets contain the details on funding sources. Most of the capital projects have more than
one funding source, such as a portion of the project being funded through cash, debt, and grants.

Figure 1 - Funding Sources (Funded Projects)

                           Proposed Funding Sources
                               (Funded Projects)
             Private
            Sources,                                                        Fund
           39,167,500                                                     Balance,
                                                                         44,971,337

           Grants,                                                        Bonds,
         105,591,768                                                    8,330,289

Funding Considerations
In most communities, the cost associated with desired community improvements far outweighs the
available resources necessary to pay for them; in short there is not enough money to do everything a
community may desire to do. This requires prioritization of the projects based upon their perceived
impact on the community. Due to the vast number of individual desires it is near impossible to satisfy
everyone and requires a collaborative effort to create situations where the benefits are shared
equitably with community stakeholders. In some cases, the City is limited to specific categories of
projects by the source of funding; for example, the Utility Fund may only contribute towards capital
projects that improve water and wastewater projects.

                                                    5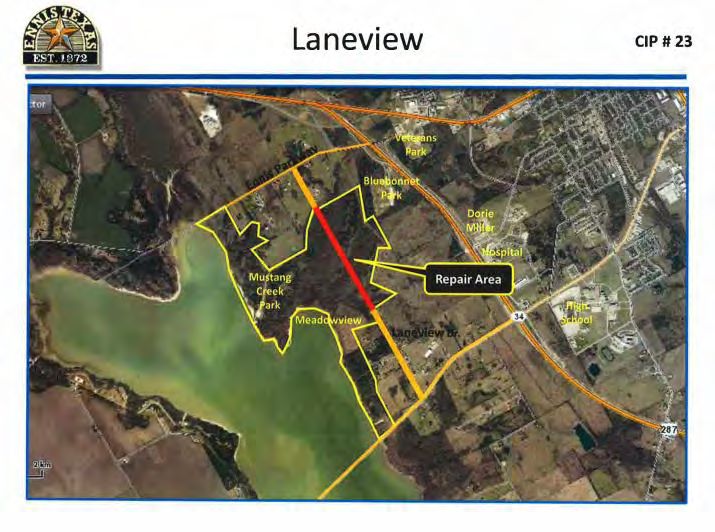
COMMUNITY INVESTMENT PLAN

Sources of Funding
There are four primary funding sources for capital improvements: 1) revenue sources (also referred to
as cash funded projects) - such as sales, hotel/motel and property taxes), 2) Grants - state/federal
funding through public grants, 3) Private Funding - via developmental impact fees or charitable
donations and, 4) Bonds - funds borrowed by the City through the issuance of bonds or other types of
debt instruments. The proposed projects in this CIP rely on bond proceeds and other revenues in the
Governmental and Enterprise Funds as well as contributions from private partners for funding. Each
project sheet outlines the planned funding sources:

Deciding to Borrow: Three Considerations
Before deciding which types of bonds to issue a municipality should first consider three factors: first,
who should ultimately pay for the project, second, what other funding sources should be utilized and to
what degree and third, whether the municipality can afford to issue debt.

Who Should Pay?
Deciding who should pay for a project may seem like a strange concept at first. However, it is important
to consider the benefactors of the project when deciding how the project should be funded. Just
because a community can afford to bond-fund a project does not necessarily mean that it is the best or
most appropriate funding method. The source of a project’s funding should be indicative of who
ultimately benefits from the project. Projects that benefit a single development or business should be
funded through impact fees or any other method that localizes the project cost to the beneficiary.
Likewise, projects that benefit the community at-large should be funded through broad-based taxes or
bonds that are supported by those taxes.
Consider Your Funding Sources
Although avoiding debt may seem like prudent financial management; there are many instances where
bond financing is indicative of sound fiscal stewardship. Long term capital assets of a local government
(public buildings, infrastructure, etc.) are typically financed largely by long-term debt so residents living
in the community in year 20 of the asset’s life are helping to pay for the asset as they use it. However,
cities sometimes reduce their long-term debt costs by “buying down” or reducing their debt issuance
with cash on hand that exceeds their fund balance policy requirements. Allowing for a mix of funding
sources (contributions, grants, available funds and bonds) provides the greatest utility of resources.
Funding sources should be viewed as important and strategic aspects of the overall capital plan.

Can We Afford It?
Finally, a municipality should consider whether it can afford to pay the debt service required by the
proposed bonds. There are three major indicators and benchmarks that are used by the bond rating
agencies as affordability indicators:

    •   Overall net debt as a percentage of assessed or market valuation. Net debt is that which is
        supported by taxes, specifically excluding self-supporting, single purpose debt of the jurisdiction.
        If it is over 10% of either the assessed or market valuation of the properties of the locality, or if it
        has increased rapidly over the previous years, this is a warning sign. *The City of Ennis has total
        outstanding debts of $29,581,722 and total taxable values of $1,590,995,809 making the City of
        Ennis' Net Debt 1.86%.

    •   Overall net debt per capita (or per household) as a percent of per capita (or household)
        income. This index is what is known as the Standard and Poor’s index. If this figure is close to or
        over 15%, this is also a warning sign of a problem. *The per capita debt is calculated to be
        $1,456
                                                      6
COMMUNITY INVESTMENT PLAN
and per capita personal income is estimated to be $21,772 which equals an overall net debt
per capita of approximately 6.7%.
• Net Debt Service as a percentage of net operating revenues. The rating agencies use the figure
of 20% as a maximum figure that a jurisdiction should have to obtain the highest credit rating.
Rating agencies also like to have the first two indicators for the entire tax base, regardless of the
jurisdiction involved. That is, they are interested in what the total burden is on the tax payer in
the “underlying” or “overlapping” taxing districts. *The net general obligation debt service for
the City of Ennis is approximately $3,779,062. The total revenues for the City of Ennis are
estimated at $30,338,257. Using these estimates, the City of Ennis' net debt service is
approximately 12.45%. *All figures based on FY 2016 Audited financial statements.
How Inflation Impacts
Inflation is defined as a rise in the price of all goods and services over time. This implies that the
purchasing power, or value, of currency will decline in the future relative to costs. Therefore, more
money will be required to fund CIP related expenditures and must be accounted for. To measure the
impact of inflation, the federal government records current rates and creates indexes to track
inflation over time. Indexes, such as the Construction Cost Index, Purchasing Price Index, and
Consumer Price Indexes may provide a trend of potential future costs.
Figure 7 - Rolling Annual Inflation 2000 - Current
Rolling Annual Average Inflation 2000 - Current
2.0%
1.5%
1.0%
0.5%
0.0%
-0.5%
-1.0%
-1.5%
-2.0%
2000 2002 2004 2006 2008 2010 2012 2014 2016
Municipal Cost Index Construction Cost Index
Consumer Price Index Purchasing Price Index
7COMMUNITY INVESTMENT PLAN
Similarly, the Municipal Cost Index (MCI) was created by the publication American City & County to
illustrate how inflation affects costs specific to municipal service provision, including construction
costs. AC&C’s website explains that, “the MCI draws on the monthly statistical data collected by the
U.S. Departments of Commerce and Labor as well as independently compiled data to project a
composite cost picture for the municipal budget officer or operating department manager. The MCI
has a 2.62% average annual increase or .22% per month from the year 2000.The average annual
percentage change across all years in the MCI is approximately 2.7%.
Figure 8 - Normalized Cost Indices
Normalized Cost Indexes 2000 - Current
200
175
150
125
100
75
2000 2002 2004 2006 2008 2010 2012 2014 2016
Municipal Cost Index Construction Cost Index
Consumer Price Index Purchasing Price Index
The composite index is adjusted by changes in the cost of materials and supplies, wages and contracted-
for services. It is a weighted average of the more detailed price indexes measuring consumer cost
fluctuations, industrial commodity wholesale prices, and construction contract costs. While no predictor
of future changes in the economy is ever certain, a common and reliable method for estimating these
changes utilizes the average percentage change over time to estimate future long-term trends.
Figure 9 - Normalized Cost Indices 2010 to Current
Normalized Cost Indexes 2000 - Current
160
Municipal Cost Index
95% Confidence Interval
150
140
130
2010 2011 2012 2013 2014 2015 2016 2017
8COMMUNITY INVESTMENT PLAN
Like the stock markets which have historically averaged 8-10% returns, this average is made up of
individual fluctuations that vary greatly. 95% of the time, the average inflation for municipal costs will
fall within this range. This data is important in calculating the Town’s future liability; by utilizing these
inflation trends to calculate future capital replacement costs we can determine how ‘waiting’ a year or
more impacts the total project cost. Most are aware of the benefits of compounding when it comes to
investing. Unfortunately, this same principle works in reverse as inflation causes costs to compound
over time.
Conclusions
Capital Improvement Plans play an integral role in helping a municipality reach its stated strategic
objectives. Equally important to the capital project development process are funding and economic
considerations. Prudent financial stewardship should be based on cost minimization and long-range
strategic capital preservation. While there are many methods for funding capital projects, consideration
to who benefits from the project, the life of the capital asset and the affordability of the funding method
are all important factors to consider.
Community Improvement Plan
The five-year Capital Improvement Plan for 2017 through 2021 presents the City’s proposed plan for
infrastructure development and improvements. The projects included in the fiscal year 2017 will be
amended in the 2017 budget, while projects in the future years will be adopted as and when they
occur. This process gives staff authority to undertake the initial steps of the capital projects to meet
the established timelines. At the end of each fiscal year, the City's operating budget will be ammended
to reflect the actual expenditures of the Community Improvement Projects.
Community Improvement Project Details
The following pages contain the project sheets for anticipated capital projects over the next five fiscal
years.
Figure 10 - Funded v.s. Unfunded Capital Projects
Funded v.s. Unfunded Capital Projects
2017
2018
2019
2020
2021
- 50 100 150 200
Millions
Funded Unfunded
9COMMUNITY INVESTMENT PLAN
This page is intentionally blank.
10COMMUNITY INVESTMENT PLAN
Project Information and Scoring Sheet
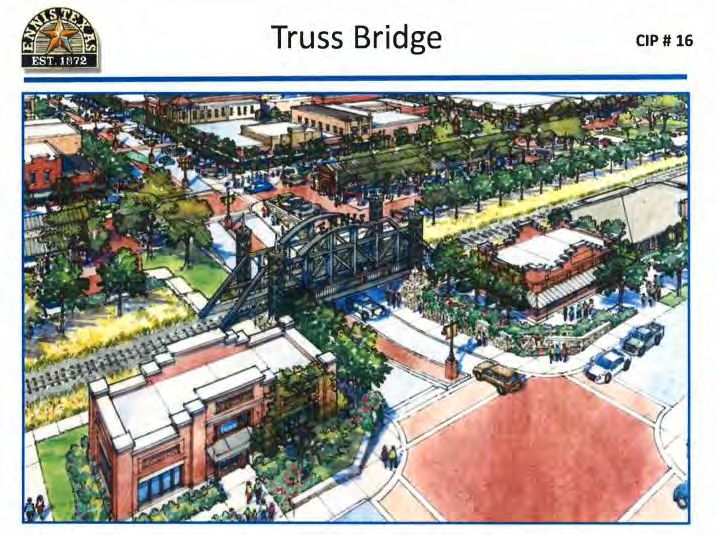
PROJECT NAME: UPRR Safety Zone PROJECT #: 00001
LOCATION Downtown (MLK to Lampasas) PROJECT COST: $46,684,000
PROJECT TYPE: New Installation ASSET: Real Estate
PROJECT MANAGER: Heye Project Rank: 1 DEPARTMENT: Administration/CM
DESCRIPTION
The scope of this project includes several tier one catalyst projects (Grade Separated Crossing (Underpass)/Truss
Bridge, replacing the RR bridges at Baylor and Belknap and the reconstruction of Ennis Avenue from Clay to Kaufman).
PROJECT IMAGE 1 PROJECT IMAGE 2
JUSTIFICATION
Community Need: Connecting the IH45 Market area to the Downtown Market area is the most vital economic
component of the Downtown Master Plan. Creating a combined vehicular and pedestrian Ennis Avenue "underpass" at
the railroad tracks, strengthens the connection allowing downtown to capture a portion of the I-45 market share.
Safety & Service: The at-grade crossing at Ennis Avenue is unsafe as evidenced by two fatality accidents in the past three
years. Guests arriving at the Visitors Center have no other way to get to downtown other than walking across the RR
tracks. The height of the underpass will allow fire and other first responder access to and from the east and west sides
of the City regardless of train traffic.
Quality of Life: The downtown master plan has been developed to maximize quality of life improvements through
enhanced pedestrian, shopping and dining experiences.
Return on Investment: The City will be able to leverage its investment ten to 1 through State, federal and private funding.
PROJECT CRITERION ASSESSMENT & SCORING (see Criterion Prioritization Instruction Sheet)
Community Safety & Quality of Return on Useful Life Budget Funding Total
Need Service Life Investment & Cost * Impact * Sources * Score
4.57 3.83 4.27 4.40 5 5 5 32.07
* Automatically calculated based upon objective financial and the useful life of the project.
1 of 2 Pages • UPRR Safety Zone
11COMMUNITY INVESTMENT PLAN
Project Information and Scoring Sheet
PROJECT NAME: UPRR Safety Zone PROJECT #: 00001
LOCATION Downtown (MLK to Lampasas) PROJECT COST: $46,684,000
FINANCIAL INFORMATION
PROPOSED FISCAL YEAR 2017 2018 2019 2020 2021
PROPOSED FUNDING SOURCES
Local Bonds - 1,700,000 1,000,000 1,000,000 -
Cash (Fund Balance) 400,000 584,000 - - -
Grants (Federal, State, etc.) - - - 20,000,000 22,000,000
Private Funds - - - - -
Total Funding $400,000 $2,284,000 $1,000,000 $21,000,000 $22,000,000
PROPOSED ANNUAL EXPENDITURES
Professional Services 400,000 2,284,000 1,000,000 1,000,000 -
Acquisition - - - - -
Construction - - - 20,000,000 22,000,000
Total Expenditures $400,000 $2,284,000 $1,000,000 $21,000,000 $22,000,000
FUNDING BALANCE
Total $ $ $ $ $
PROPOSED OPERATIONAL BUDGET IMPACT
Personnel - - - - -
Maintenance - - - - -
Total Budget Impact $ $ $ $ $
ADDITIONAL COMMENTS
The City is working with TxDOT and the North Central Texas Council of Government to seek federal funding for this project.
The window of opportunity for this funding is very narrow as the majority of funding for the next ten years will be tied up
during the planning process this summer. Union Pacific is anticipated to be a source of funding as well.
2 of 2 Pages • UPRR Safety Zone
12COMMUNITY INVESTMENT PLAN
Project Information and Scoring Sheet
PROJECT NAME: Project North Plaza PROJECT #: 00002
LOCATION North Plaza PROJECT COST: $33,500,000
PROJECT TYPE: New Installation ASSET: Real Estate
PROJECT MANAGER: Heye Project Rank: 2 DEPARTMENT: Administration/CM
DESCRIPTION
This project is the second highest scoring tier one catalyst project. The project is a three story vertical infill with
enhanced parking and features and amphitheater in the public plaza.
PROJECT IMAGE 1 PROJECT IMAGE 2
JUSTIFICATION
Community Need: North Plaza is a major component in the downtown master plan because it functions as a "virtual
anchor" that will connect with South Plaza via the newly reconstructed Dallas Street. This is the creation of a major focal
space at the north end of Dallas Street, on the westerly portion of the city-owned Safeway Property. This project will
provide a public space interface with surrounding/ abutting neighborhood, host public/ festive/ civic activities, provide
public restrooms, and create additional retail opportunity for retail projects that cannot be accommodated within the
spatial limitations of the Ennis historic downtown. The plaza will be home to a new City Hall, Municipal Court and Police
Station. Acquisition of a new police station was the primary reason for the passage of the 1/4 cent sales tax that created
the CCPD.
Safety & Service: Safety comes in the form of enhanced parking and at-grade sidewalks. The new City Hall and Police
Station will eliminate many ADA compliance issues at the current facilities.
Quality of Life: The public plaza space has been designed to maximize quality of life enhancements and provide a high
quality outdoor venue for citizens and visitors alike.
Return on Investment: In return for investing $2.6 million dollars the City will realize at least $18 million dollars in private
capital investment. The improved plaza will (continued on the next page).
PROJECT CRITERION ASSESSMENT & SCORING (see Criterion Prioritization Instruction Sheet)
Community Safety & Quality of Return on Useful Life Budget Funding Total
Need Service Life Investment & Cost * Impact * Sources * Score
4.17 2.77 4.07 4.67 5 5 5 30.67
* Automatically calculated based upon objective financial and the useful life of the project.
1 of 2 Pages • Project North Plaza
13COMMUNITY INVESTMENT PLAN
Project Information and Scoring Sheet
PROJECT NAME: Project North Plaza PROJECT #: 00002
LOCATION North Plaza PROJECT COST: $33,500,000
JUSTIFICATION CONTINUED
provide the basis for improved property values radiating outward from the development.
FINANCIAL INFORMATION
PROPOSED FISCAL YEAR 2017 2018 2019 2020 2021
PROPOSED FUNDING SOURCES
Local Bonds - - - - -
Cash (Fund Balance) - 750,000 - - -
Grants (Federal, State, etc.) - - - - -
Private Funds - 750,000 32,000,000 - -
Total Funding $ $1,500,000 $32,000,000 $ $
PROPOSED ANNUAL EXPENDITURES
Professional Services - - - - -
Acquisition - - - - -
Construction - 1,500,000 32,000,000 - -
Total Expenditures $ $1,500,000 $32,000,000 $ $
FUNDING BALANCE
Total $ $ $ $ $
PROPOSED OPERATIONAL BUDGET IMPACT
Personnel - - - - -
Maintenance 15,000 15,000 15,000 15,000 15,000
Total Budget Impact $15,000 $15,000 $15,000 $15,000 $15,000
ADDITIONAL COMMENTS
The City is working with a developer who will build and lease the unoccupied space. The City's 1/4 cent sales tax for
enhanced police safety will be utilized to fund a substantial portion of the annual lease. The EDC is contributing the land
with no cost to the City. The plaza will be programmed and operate on a fee basis to partially cover O&M costs.
2 of 2 Pages • Project North Plaza
14COMMUNITY INVESTMENT PLAN
Project Information and Scoring Sheet
PROJECT NAME: Project South Plaza PROJECT #: 00003
LOCATION South Plaza PROJECT COST: $15,000,000
PROJECT TYPE: New Installation ASSET: Real Estate
PROJECT MANAGER: Heye Project Rank: 3 DEPARTMENT: Administration/CM
DESCRIPTION
This project is the third highest scoring tier one catalyst project. The project is a three story vertical infill with enhanced
parking and a public plaza feature.
PROJECT IMAGE 1 PROJECT IMAGE 2
JUSTIFICATION
Community Need: South Plaza is a major component of the downtown master plan because it functions as a "virtual
anchor" that will connect with North Plaza via the newly reconstructed Dallas Street. This project will terminate the
improved sections of Dallas Street, provide public space for interface with surrounding/ abutting neighborhood, host
public/ festive/ civic activities, provide public restrooms, and create additional retail opportunity for the expansion of
(and aggregation of) Hispanic businesses.
Safety & Service: Safety comes in the form of enhanced parking and at-grade sidewalks.
Quality of Life: This project provides new retail, professional office, restaurant, entertainment and possibly residential
space. A revitalized downtown creates the place and economic vitality that connects our city for the betterment of all.
Return on Investment: In return for investing $1.8 million dollars the City will realize at least $18 million dollars in private
capital investment. The improved plaza will provide the basis for improved property values radiating outward from the
development.
PROJECT CRITERION ASSESSMENT & SCORING (see Criterion Prioritization Instruction Sheet)
Community Safety & Quality of Return on Useful Life Budget Funding Total
Need Service Life Investment & Cost * Impact * Sources * Score
3.93 2.13 3.67 4.50 5 5 5 29.23
* Automatically calculated based upon objective financial and the useful life of the project.
1 of 2 Pages • Project South Plaza
15COMMUNITY INVESTMENT PLAN
Project Information and Scoring Sheet
PROJECT NAME: Project South Plaza PROJECT #: 00003
LOCATION South Plaza PROJECT COST: $15,000,000
FINANCIAL INFORMATION
PROPOSED FISCAL YEAR 2017 2018 2019 2020 2021
PROPOSED FUNDING SOURCES
Local Bonds - - - - -
Cash (Fund Balance) - - - - -
Grants (Federal, State, etc.) - 1,000,000 - 14,000,000 -
Private Funds - - - -
Total Funding $ $1,000,000 $ $14,000,000 $
PROPOSED ANNUAL EXPENDITURES
Professional Services - - - - -
Acquisition - 1,000,000 - - -
Construction - - - 14,000,000 -
Total Expenditures $ $1,000,000 $ $14,000,000 $
FUNDING BALANCE
Total $ $ $ $ $
PROPOSED OPERATIONAL BUDGET IMPACT
Personnel - - - - -
Maintenance - - - - -
Total Budget Impact $ $ $ $ $
ADDITIONAL COMMENTS
The City is working with a developer who will build and lease the retail and commercial/office space. The EDC is
contributing the land with no cost to the City. The plaza will be programmed and operate on a fee basis to partially cover
O&M costs.
2 of 2 Pages • Project South Plaza
16COMMUNITY INVESTMENT PLAN
Project Information and Scoring Sheet
PROJECT NAME: New Bar Screen at WWTP PROJECT #: 00004
LOCATION WWTP PROJECT COST: $356,768
PROJECT TYPE: Replacement ASSET: Infrastructure
PROJECT MANAGER: Bolen Project Rank: 4 DEPARTMENT: Utilities
DESCRIPTION
Replace ineffective and worn out bar screen and equipment at WWTP.
PROJECT IMAGE 1 PROJECT IMAGE 2
JUSTIFICATION
Community Need: Bar screens are located at the headworks of our wastewater treatment plant and are the vital first
step in our process. They are used to remove large objects such as rags, plastics bottles, bricks, solids, toy action figures
and other less mentionable items from the waste stream entering the treatment plant.
Safety & Service: Reducing the amount of large solids in our wastewater treatment process reduces the risk of serious
injury to our employees or damage to City equipment.
Quality of Life: There is no significant quality of life impact.
Return on Investment: There is no significant return on investment.
PROJECT CRITERION ASSESSMENT & SCORING (see Criterion Prioritization Instruction Sheet)
Community Safety & Quality of Return on Useful Life Budget Funding Total
Need Service Life Investment & Cost * Impact * Sources * Score
3.50 3.93 3.07 2.33 5 5 5 27.83
* Automatically calculated based upon objective financial and the useful life of the project.
1 of 2 Pages • New Bar Screen at WWTP
17COMMUNITY INVESTMENT PLAN
Project Information and Scoring Sheet
PROJECT NAME: New Bar Screen at WWTP PROJECT #: 00004
LOCATION WWTP PROJECT COST: $356,768
FINANCIAL INFORMATION
PROPOSED FISCAL YEAR 2017 2018 2019 2020 2021
PROPOSED FUNDING SOURCES
Local Bonds - - - - -
Cash (Fund Balance) - 30,000 - - -
Grants (Federal, State, etc.) - 326,768 - - -
Private Funds - - - - -
Total Funding $ $356,768 $ $ $
PROPOSED ANNUAL EXPENDITURES
Professional Services - 30,000 - - -
Acquisition - - - - -
Construction - 326,768 - - -
Total Expenditures $ $356,768 $ $ $
FUNDING BALANCE
Total $ $ $ $ $
PROPOSED OPERATIONAL BUDGET IMPACT
Personnel - - - - -
Maintenance - - - - -
Total Budget Impact $ $ $ $ $
ADDITIONAL COMMENTS
We have applied for a 2017 CDBG grant for 80% State funding.
2 of 2 Pages • New Bar Screen at WWTP
18COMMUNITY INVESTMENT PLAN
Project Information and Scoring Sheet
PROJECT NAME: Project Downtown Infrastructure PROJECT #: 00005
LOCATION Downtown PROJECT COST: $7,776,789
PROJECT TYPE: Replacement ASSET: Infrastructure
PROJECT MANAGER: Heye Project Rank: 5 DEPARTMENT: Administration/CM
DESCRIPTION
This project includes 4 catalyst projects (Dallas Street, Water, Sewer & Alleys).
PROJECT IMAGE 1 PROJECT IMAGE 2
JUSTIFICATION
Community Need: Collectively this is the highest priority tier one catalyst project.
Safety & Service: Current water and sewer lines will not support future development. Reconstructing Dallas Street to
be ADA compliant will greatly improve pedestrian safety.
Quality of Life: Reconstructing Dallas Street creates a vital market connection between North and South Plaza. Dallas
Street becomes a true pedestrian-way, capable of accommodating cars; thereby, making it possible to comprehend
downtown as a north/ south oriented shopping environment that is six blocks long, instead of an east/ west shopping
environment that is only two blocks long. The provision of central grease traps makes it possible for restaurants to locate
anywhere within the downtown core.
Return on Investment: In return for investing $7 million dollars the City realizes $10 plus million in private capital
investment (already committed through the HP Grant Program) plus an estimated $20 million in anchor development at
each plaza. These figures do not include future capital investment or the economic vitality (sales taxes) created.
PROJECT CRITERION ASSESSMENT & SCORING (see Criterion Prioritization Instruction Sheet)
Community Safety & Quality of Return on Useful Life Budget Funding Total
Need Service Life Investment & Cost * Impact * Sources * Score
4.73 3.13 4.00 4.70 5 5 0 26.57
* Automatically calculated based upon objective financial and the useful life of the project.
1 of 2 Pages • Project Downtown Infrastructure
19COMMUNITY INVESTMENT PLAN
Project Information and Scoring Sheet
PROJECT NAME: Project Downtown Infrastructure PROJECT #: 00005
LOCATION Downtown PROJECT COST: $7,776,789
FINANCIAL INFORMATION
PROPOSED FISCAL YEAR 2017 2018 2019 2020 2021
PROPOSED FUNDING SOURCES
Local Bonds - 3,500,000 3,500,000 - -
Cash (Fund Balance) 776,789 - - - -
Grants (Federal, State, etc.) - - - - -
Private Funds - - - - -
Total Funding $776,789 $3,500,000 $3,500,000 $ $
PROPOSED ANNUAL EXPENDITURES
Professional Services 776,789 - - - -
Acquisition - - - - -
Construction - 3,500,000 3,500,000 - -
Total Expenditures $776,789 $3,500,000 $3,500,000 $ $
FUNDING BALANCE
Total $ $ $ $ $
PROPOSED OPERATIONAL BUDGET IMPACT
Personnel - - - - -
Maintenance - - - - -
Total Budget Impact $ $ $ $ $
ADDITIONAL COMMENTS
The City has already committed $750,000 dollars with GSP for design and engineering. Plans are complete and ready for
bidding.
2 of 2 Pages • Project Downtown Infrastructure
20COMMUNITY INVESTMENT PLAN
Project Information and Scoring Sheet
PROJECT NAME: IH 45 Ramp Reconfiguration PROJECT #: 00006
LOCATION Various PROJECT COST: $14,000,000
PROJECT TYPE: Replacement ASSET: Infrastructure
PROJECT MANAGER: Heye Project Rank: 7 DEPARTMENT: Administration/CM
DESCRIPTION
This project will re-align and "flip" various entrance and exit ramps along I-45.
PROJECT IMAGE 1 PROJECT IMAGE 2
JUSTIFICATION
Community Need: The access to commercial areas on the east and west sides of IH 45 are poorly designed and hinder
further commercial development along the Ennis corridor.
Safety & Service: There is no significant safety impact.
Quality of Life: There is no significant quality of life impact.
Return on Investment: Improving these areas will leverage the City's TIRZ #2 by increasing the property values along
IH45 and encouraging additional retail and commercial development. The City is able to leverage its investment fifty to
one through State and federal funding.
PROJECT CRITERION ASSESSMENT & SCORING (see Criterion Prioritization Instruction Sheet)
Community Safety & Quality of Return on Useful Life Budget Funding Total
Need Service Life Investment & Cost * Impact * Sources * Score
2.70 1.67 2.27 3.63 5 5 5 25.27
* Automatically calculated based upon objective financial and the useful life of the project.
1 of 2 Pages • IH 45 Ramp Reconfiguration
21COMMUNITY INVESTMENT PLAN
Project Information and Scoring Sheet
PROJECT NAME: IH 45 Ramp Reconfiguration PROJECT #: 00006
LOCATION Various PROJECT COST: $14,000,000
FINANCIAL INFORMATION
PROPOSED FISCAL YEAR 2017 2018 2019 2020 2021
PROPOSED FUNDING SOURCES
Local Bonds - - - - -
Cash (Fund Balance) - - - - -
Grants (Federal, State, etc.) - - - - 14,000,000
Private Funds - - - - -
Total Funding $ $ $ $ $14,000,000
PROPOSED ANNUAL EXPENDITURES
Professional Services - - - - 1,200,000
Acquisition - - - - -
Construction - - - - 12,800,000
Total Expenditures $ $ $ $ $14,000,000
FUNDING BALANCE
Total $ $ $ $ $
PROPOSED OPERATIONAL BUDGET IMPACT
Personnel - - - - -
Maintenance - - - - -
Total Budget Impact $ $ $ $ $
ADDITIONAL COMMENTS
The City is working with TxDOT and the North Central Texas Council of Government to seek federal funding for this project.
The window of opportunity for this funding is very narrow as the majority of funding for the next ten years will be tied up
during the planning process this summer.
2 of 2 Pages • IH 45 Ramp Reconfiguration
22COMMUNITY INVESTMENT PLAN
Project Information and Scoring Sheet
Playground Replacements (Jaycee, Kiwanis, PROJECT #:
PROJECT NAME: 00007
Bluebonnet, Gauna, Lake Clark)
LOCATION Various PROJECT COST: $380,000
PROJECT TYPE: Replacement ASSET: Real Estate
PROJECT MANAGER: Liska Project Rank: 8 DEPARTMENT: Parks
DESCRIPTION
Replace or install new playground units and associated site features at Jaycee, Kiwanis, Bluebonnet, Gauna and Lake
Clark Parks.
PROJECT IMAGE 1 PROJECT IMAGE 2
JUSTIFICATION
Community Need: Use of Playgrounds was the #1 response in the 2016 ChildrenÆs Survey among elementary aged
students and ranked high in intermediate, junior high and high-school age groups. In recommended improvements, need
for playground improvements rated in the top 3 responses across all age groups.
Safety & Service: These playgrounds are either dangerous, showing considerable age and wear or nonexistent. They
have been prioritized A-F according to a scale of removing danger (A-C), replacing units that are breaking down (D), and
adding a unit where there is little or nothing there (E-F).
Quality of Life: Recreational improvements have positive effects on the quality of life in the community. The need for
nicer parks and trails was one of the most highly rated items in the citizen satisfaction survey.
Return on Investment: When new businesses seek to relocate to a community, they often site the condition of the City's
parks as one of the major factors in decision making. The City will seek to leverage its investment with State matching
grants.
PROJECT CRITERION ASSESSMENT & SCORING (see Criterion Prioritization Instruction Sheet)
Community Safety & Quality of Return on Useful Life Budget Funding Total
Need Service Life Investment & Cost * Impact * Sources * Score
4.07 3.83 4.47 2.87 5 4 1 25.23
* Automatically calculated based upon objective financial and the useful life of the project.
1 of 2 Pages • Playground Replacements (Jaycee, Kiwanis, Bluebonnet, Gauna, Lake Clark)
23COMMUNITY INVESTMENT PLAN
Project Information and Scoring Sheet
Playground Replacements (Jaycee, Kiwanis, PROJECT #:
PROJECT NAME: 00007
Bluebonnet, Gauna, Lake Clark)
LOCATION Various PROJECT COST: $380,000
FINANCIAL INFORMATION
PROPOSED FISCAL YEAR 2017 2018 2019 2020 2021
PROPOSED FUNDING SOURCES
Local Bonds - - - - -
Cash (Fund Balance) - 190,000 - - -
Grants (Federal, State, etc.) - 190,000 - - -
Private Funds - - - - -
Total Funding $ $380,000 $ $ $
PROPOSED ANNUAL EXPENDITURES
Professional Services - - - - -
Acquisition - - - - -
Construction - 380,000 - - -
Total Expenditures $ $380,000 $ $ $
FUNDING BALANCE
Total $ $ $ $ $
PROPOSED OPERATIONAL BUDGET IMPACT
Personnel - - - -
Maintenance 25,400 25,400 25,400 25,400 25,400
Total Budget Impact $25,400 $25,400 $25,400 $25,400 $25,400
ADDITIONAL COMMENTS
This project is eligible for a 50/50 State Grant.
2 of 2 Pages • Playground Replacements (Jaycee, Kiwanis, Bluebonnet, Gauna, Lake Clark)
24COMMUNITY INVESTMENT PLAN
Project Information and Scoring Sheet
PROJECT NAME: Project Airport PROJECT #: 00008
LOCATION TBD PROJECT COST: $32,650,000
PROJECT TYPE: Replacement ASSET: Real Estate
PROJECT MANAGER: Dixon Project Rank: 9 DEPARTMENT: Administration/CM
DESCRIPTION
Replacement of existing airport
PROJECT IMAGE 1 PROJECT IMAGE 2
JUSTIFICATION
Community Need: The existing airport was constructed in 1964 and is showing its age.
Safety & Service: It no longer meets many of the FAA's safety standards including adequate object-free zones on both
the north and south end of the runway, taxi and runway separation distances and runway composition
Quality of Life: A new airport has the potential to yield new opportunities for residents, visitors, and businesses.
Return on Investment: A new airport can generate revenue from a variety of sources (e.g. hangar leases, fuel sales,
special events) and provide a positive benefit with ancillary development. As the City of Ennis competes for new industrial
and manufacturing businesses, one of the factors considered by those looking to relocate their corporate headquarters
is whether or not the City has an airport.
PROJECT CRITERION ASSESSMENT & SCORING (see Criterion Prioritization Instruction Sheet)
Community Safety & Quality of Return on Useful Life Budget Funding Total
Need Service Life Investment & Cost * Impact * Sources * Score
2.27 2.17 2.23 3.43 5 5 5 25.10
* Automatically calculated based upon objective financial and the useful life of the project.
1 of 2 Pages • Project Airport
25COMMUNITY INVESTMENT PLAN
Project Information and Scoring Sheet
PROJECT NAME: Project Airport PROJECT #: 00008
LOCATION TBD PROJECT COST: $32,650,000
FINANCIAL INFORMATION
PROPOSED FISCAL YEAR 2017 2018 2019 2020 2021
PROPOSED FUNDING SOURCES
Local Bonds - - - - -
Cash (Fund Balance) 60,000 150,000 60,000 60,000 60,000
Grants (Federal, State, etc.) - 2,260,000 - - 30,000,000
Private Funds - - - - -
Total Funding $60,000 $2,410,000 $60,000 $60,000 $30,060,000
PROPOSED ANNUAL EXPENDITURES
Professional Services 60,000 410,000 60,000 60,000 60,000
Acquisition - 2,000,000 - - -
Construction - - - - 30,000,000
Total Expenditures $60,000 $2,410,000 $60,000 $60,000 $30,060,000
FUNDING BALANCE
Total $ $ $ $ $
PROPOSED OPERATIONAL BUDGET IMPACT
Personnel - - - - -
Maintenance - - - - -
Total Budget Impact $ $ $ $ $
ADDITIONAL COMMENTS
The EDC has allocated $2 million dollars for property acquisition. The City has been awarded a grant for the professional
services costs associated with the project. Once constructed, the airport will provide additional revenue in the form of
fuel sales and hangar leases.
2 of 2 Pages • Project Airport
26COMMUNITY INVESTMENT PLAN
Project Information and Scoring Sheet
PROJECT NAME: Fire Station #1 PROJECT #: 00009
LOCATION TBD PROJECT COST: $3,790,000
PROJECT TYPE: New Installation ASSET: Real Estate
PROJECT MANAGER: Aycock Project Rank: 10 DEPARTMENT: FD
DESCRIPTION
Replacement of fire station #1.
PROJECT IMAGE 1 PROJECT IMAGE 2
JUSTIFICATION
Community Need: The current fire station is over 100 years old, administration and operations space is inadequate and
undersized for newer apparatus. Residents and business to the west and south will be covered appropriately for the next
25 plus years. Once built this station will be the primary Emergency Operations Center. This station/location will provide
a close neighbor of our EISD facilities allowing for a mass casualty staging area.
Safety & Service: The ability to respond in a large fire engine from this station is complex. The narrow roads, traffic,
parked cars, traffic lights and railroad tracks are encountered on every call this station makes which greatly affect
response times and places the crew and citizens at risk. Responding into the heart of our city safer by allowing fire
apparatus to navigate larger roadways. Allows a greater geographical area covered which will tremendously affect our
ISO/PPC rating.
Quality of Life: When asked, residents routinely respond that the three most important aspects of their overall quality
of life are police, fire and parks. Providing adequate fiure coverage for all of our residents is one of the foundations of a
sense of enhanced quality of life for our residents.
Return on Investment: A lower ISO rating for the City typically yields lower insurance premiums for residents and
businesses.
PROJECT CRITERION ASSESSMENT & SCORING (see Criterion Prioritization Instruction Sheet)
Community Safety & Quality of Return on Useful Life Budget Funding Total
Need Service Life Investment & Cost * Impact * Sources * Score
3.97 4.20 4.03 2.77 5 5 0 24.97
* Automatically calculated based upon objective financial and the useful life of the project.
1 of 2 Pages • Fire Station #1
27COMMUNITY INVESTMENT PLAN
Project Information and Scoring Sheet
PROJECT NAME: Fire Station #1 PROJECT #: 00009
LOCATION TBD PROJECT COST: $3,790,000
FINANCIAL INFORMATION
PROPOSED FISCAL YEAR 2017 2018 2019 2020 2021
PROPOSED FUNDING SOURCES
Local Bonds - - - 1,200,000 2,220,000
Cash (Fund Balance) - - 250,000 120,000 -
Grants (Federal, State, etc.) - - - - -
Private Funds - - - - -
Total Funding $ $ $250,000 $1,320,000 $2,220,000
PROPOSED ANNUAL EXPENDITURES
Professional Services - - - 120,000 -
Acquisition - - 250,000 - -
Construction - - - 1,200,000 2,220,000
Total Expenditures $ $ $250,000 $1,320,000 $2,220,000
FUNDING BALANCE
Total $ $ $ $ $
PROPOSED OPERATIONAL BUDGET IMPACT
Personnel - - - - -
Maintenance 18,700 18,700 18,700 18,700 18,700
Total Budget Impact $18,700 $18,700 $18,700 $18,700 $18,700
ADDITIONAL COMMENTS
2 of 2 Pages • Fire Station #1
28You can also read