Measuring Social Return on Investment for Community Schools - A Case Study
←
→
Page content transcription
If your browser does not render page correctly, please read the page content below

Measuring Social Return
         on Investment for
         Community Schools
                                         A Case Study

TFP SROI Case Study FINAL-lo v2.indd 1              6/12/13 10:13 AM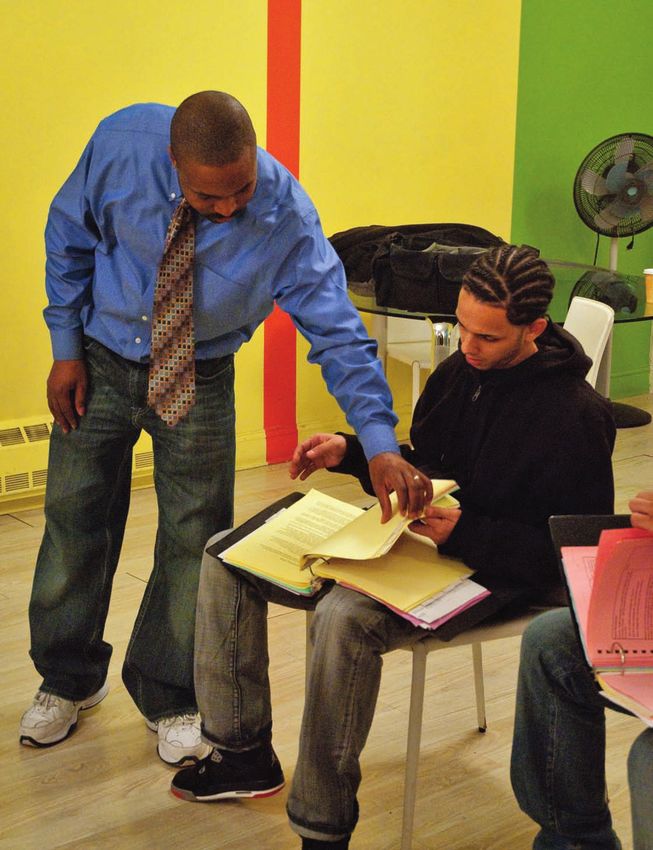
ABOUT THE FINANCE PROJECT

                                         Helping leaders finance and sustain initiatives that lead to better
                                         futures for children, families, and communities.

                                         The Finance Project is an independent nonprofit research, training,
                                         consulting, and technical assistance firm for public- and private-sector
                                         leaders nationwide. It specializes in helping leaders plan and implement financing
                                         and sustainability strategies for initiatives that benefit children, families, and com-
                                         munities. Through a broad array of tools, products, and services, The Finance Project
                                         helps leaders make smart investment decisions, develop sound financing strategies, and
                                         build solid partnerships. To learn more, visit www.financeproject.org.

                                         About The Children’s Aid Society

                                         The Children’s Aid Society is an independent, not-for-profit organiza-
                                         tion established to serve the children of New York City. Our mission is
                                         to help children in poverty to succeed and thrive. Founded in 1853, Children’s Aid
                                         has played an important leadership role in improving services and outcomes for
                                         the most vulnerable children. In 1992, Children’s Aid launched its first community
                                         school, an innovative model that brings the expertise of our organization into deep,
                                         long-term partnership with selected New York City public schools. Two years later,
                                         Children’s Aid created the National Center for Community Schools in response to the
                                         tremendous interest generated in this new comprehensive and integrated approach to
                                         promoting children’s learning and development. The role of the National Center is to
                                         build the capacity of schools, districts, community partners and government agencies
                                         to organize their human and financial resources around student success. Since 1994,
                                         the National Center has provided training, consultation and other forms of technical
                                         assistance to nearly all of the country’s major community school initiatives.

                                         Copyright 2013 © by The Finance Project, 1150 18th Street, NW, Suite 325, Washington, DC 20036.
                                         All rights reserved. This publication may not be reproduced in any form without express written permission
                                         from The Finance Project.

TFP SROI Case Study FINAL-lo v2.indd 2                                                                                                                6/12/13 10:13 AM
Measuring Social Return
         on Investment for
         Community Schools
                                         A Case Study

                                            Laura Martinez and
                                            Cheryl D. Hayes

                                            2013

TFP SROI Case Study FINAL-lo v2.indd 1                           6/12/13 10:13 AM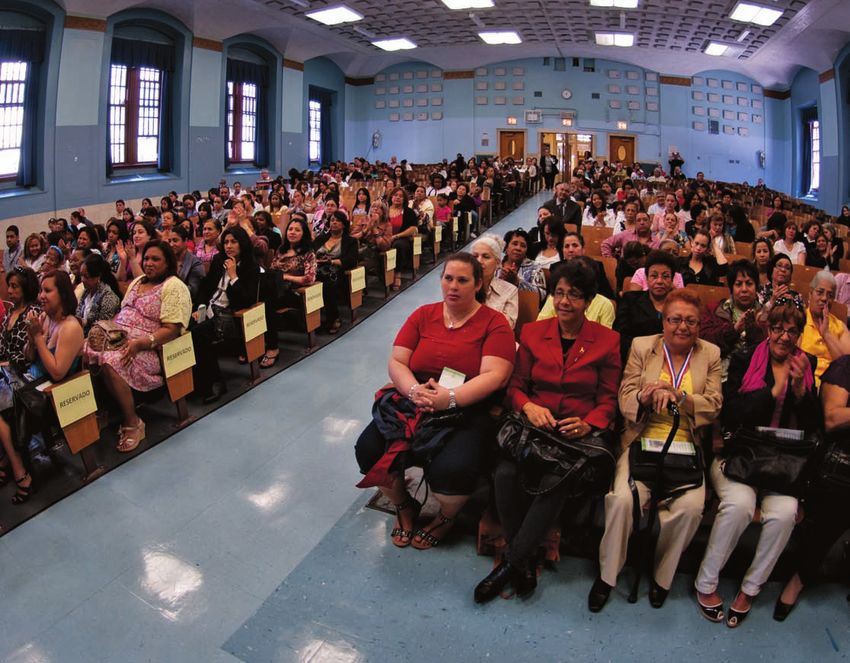
Contents

                                         Foreword                                                               3

                                         Acknowledgements                                                       5

                                         Introduction                                                           7
                                              Purpose of the Case Study                                         7
                                              The Children’s Aid Society’s Community Schools                    8
                                              Documented Impact of Children’s Aid Community Schools             8

                                         Social Return on Investment (SROI) Approach, Tools, and Analysis     11
                                              Step 1: Understand What to Measure                              11
                                              Engage Stakeholders                                             11
                                              Review and Refine the Theory of Change                          13
                                              Define the Analysis Parameters                                  13
                                              Step 2: Prepare for the SROI Analysis                           13
                                              Determine a Sample                                              13
                                              Establish a Data Collection Process                             14
                                              Collect Outcome and Cost Data                                   14
                                              Identify Outcomes and Indicators To Be Measured and Collected   16
                                              Develop an Impact Map                                           16
                                              Step 3: Model and Calculate the SROI                            18
                                              Determine Financial Values and Proxies                          18
                                              Calculate Impact                                                18
                                              Calculate the SROI                                              18

                                         Conclusion                                                           25

                                         Appendices                                                           26
                                              A: Community School Goals and Outcomes Crosswalk                26
                                              B: Data Inventory Worksheet                                     28
                                              C: Impact Maps by Site and Beneficiary                          34
                                              D: Monetized Benefits                                           56
                                              E: SROI Deadweight Rationale                                    60

TFP SROI Case Study FINAL-lo v2.indd 2                                                                        6/12/13 10:13 AM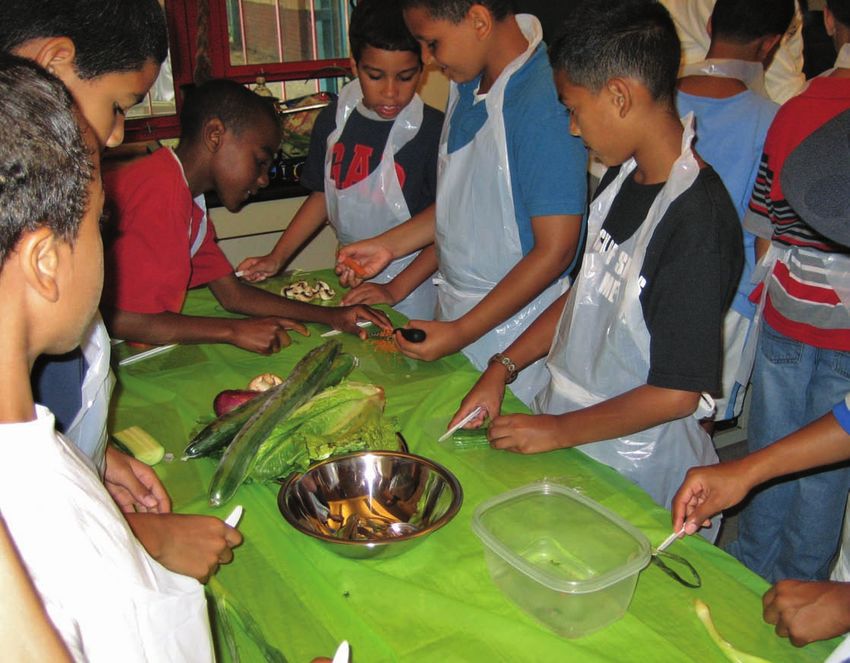
Foreword

         Few would dispute the invaluable                                In this constrained fiscal environ-               methodology developed by The Finance
         contributions of community schools to                    ment, it is more critical than ever to                   Project to help community school leaders
         student academic achievement, children’s                 ensure that reliable information is avail-               measure and communicate the social and
         social and emotional health, family                      able for informed decision making and                    economic value of a community school
         participation, and community engage-                     investment. Independent grant-making                     and its programs.
         ment. By transforming the whole school                   foundations, individual donors and                              This methodology is presented in
         environment, these initiatives create a                  public officials are the primary sources                 a companion guide, Measuring Social
         positive and supportive school climate in                of growth capital to sustain and scale                   Return on Investment for Community
         which teachers, parents and an array of                  community schools and maximize their                     Schools: A Practical Guide, which is
         others are actively engaged in supporting                impact. But they need more information                   published separately and is also available
         student success. Currently there are                     about the effectiveness and return on                    online at financeproject.org. The guide
         as many as 5,000 community schools                       investment of various approaches to                      draws on and complements the work of
         operating in 44 states and the District                  scaling and growth planning. They want                   other researchers with a shared interest
         of Columbia, serving an estimated 5.1                    to know the value of social outcomes                     in SROI measurement. It is by no means
         million students.                                        attributable to community schools and                    the first or the last word on how to reli-
                Despite the demonstrated success                  be able to express that value in monetary                ably measure and communicate the value
         of this strategy,1 community schools                     terms, which are easy to understand                      of community schools and other social
         face a daunting challenge in scaling to                  and communicate.                                         policy initiatives. But we believe it is an
         achieve widespread impact. For example,                         Social return on investment                       important and practical contribution to
         they are confronted with competing                       (SROI) offers a new strategy to measure                  the ongoing conversation.
         theories about how to improve student                    and communicate the value of outcomes
         achievement, including a heavy reliance                  achieved by programs that provide social,                Cheryl D. Hayes
         on what journalist Paul Tough terms the                  health, and education services to children               President and CEO
         “cognitive hypothesis”—the simple but                    and their families. It can be a powerful                 The Finance Project
         unproven idea that children’s cognitive                  tool for demonstrating the monetary                      Washington, D.C.
         capacities can be developed in isolation                 value of programs and services and for
         from their social, emotional, physical                   communicating that value in a way that                   Jane Quinn
         and moral growth.2 Furthermore, in this                  can be understood at a basic economic                    Vice President
         environment of limited resources, any                    level. This case study of two community                  The Children’s Aid Society
         kind of change strategy can generate                     schools operated by The Children’s Aid                   New York, N.Y.
         resistance—even one that is designed                     Society in partnership with the New York
         to make better use of existing school                    City Department of Education — PS 5
         and community resources, such as                         and Salomé Ureña — provides convinc-
         community schools.                                       ing results. It was prepared using a

         1. See, for example, Research Report 09 (Washington, DC: Coalition for Community Schools, 2009). See also Building Community Schools: A Guide for Action
            (New York, NY: The Children’s Aid Society, 2011).
         2. Paul Tough, How Children Succeed: Grit, Curiosity, and the Hidden Power of Character (New York, NY: Houghton Mifflin Harcourt, 2012).

                                                                                                  The Finance Project / The Children’s Aid Society                    3

TFP SROI Case Study FINAL-lo v2.indd 3                                                                                                                              6/12/13 10:13 AM
4         Measuring Social Return on Investment for Community Schools: A Case Study

TFP SROI Case Study FINAL-lo v2.indd 4                                                         6/12/13 10:13 AM

Acknowledgements

         The Finance Project and The Children’s      • Robert G. Frawley, New York State         Aid Society provided thoughtful leader-
         Aid Society gratefully acknowledge the        Office of Children and Family             ship for this work from beginning to
         contributions and support of all who          Services                                  end. Community Schools Division
         participated in the development of this     • Linda Juszczak, National Assembly on      Director Richard Negrón participated
         guide and case study, especially The W.K.     School-based Health Care                  actively in the “deadweight” analysis for
         Kellogg Foundation for funding the work     • David Kirp, University of California      the community schools that are the sub-
         and the Foundation’s Program Officer,         Berkeley                                  ject of the case study. And Community
         Valorie Johnson, for her guidance and       • Milbrey McLaughlin, Stanford              School Directors Madelyn Gonzalez and
         support throughout the process.               University                                Migdalia Cortes-Torres assisted with data
               A national advisory group com-        • Allan Porowski, ICF International         collection at their respective schools.
         prised of social science researchers and    • Michael Rebell, Campaign for                     With guidance from Cheryl
         program evaluators, community school          Educational Equity, Columbia              D. Hayes, Laura Martinez and Torey
         leaders, state and local policy makers,       University                                Silloway of The Finance Project staff
         school and school district officials, and   • Mark Rigdon, JPMorgan Chase               conducted the data collection and
         national education and school health          Foundation                                analysis. Cheryl D. Hayes and Laura
         experts provided valuable advice and                                                    Martinez drafted the guide and the case
         input on all aspects of the study from            Special thanks are due to Kristin     study. Carlene Campbell provided able
         conception through final review and         Moore of Child Trends, Inc. for her         administrative support. Karen Glass
         drafting. With leadership from Cheryl       prescient review of the relevant outcomes   served as editor, and Irina Katz assisted
         D. Hayes of The Finance Project, and        and indicators that were used in the        with all final proof-reading and revision.
         Jane Quinn of The Children’s Aid            analysis, Heléne Clark of ActKnowledge,     Children’s Aid staff Justin Burke, Kathy
         Society, these individuals met in person    the Children’s Aid community schools        deMeij, Hersilia Mendez, Anthony
         and consulted by phone over a two-year      evaluator for her outcome data and          Ramos and Julianne Rana helped with
         period to help shape and refine the meth-   insights, and Allan Porowski of ICF         production and dissemination plan-
         odology and social return on investment     International for his thoughtful input      ning. Cyndi Cliff of Janin/Cliff Design
         analysis. They include:                     and assistance with methodological issues   designed the guide and case study for
          • Martin J. Blank, Coalition for           throughout the process.                     publication.
            Community Schools                              Jane Quinn and Katherine
          • Heléne Clark, ActKnowledge               Eckstein of the National Center for
                                                     Community Schools at The Children’s

                                                                              The Finance Project / The Children’s Aid Society           5

TFP SROI Case Study FINAL-lo v2.indd 5                                                                                                 6/12/13 10:13 AM
Proud artist and his parents at
                                                   The Children’s Aid/National Arts Club
                                                   annual Students’ Art Exhibit.
                                                   —The Children’s Aid Society

         6         Measuring Social Return on Investment for Community Schools: A Case Study

TFP SROI Case Study FINAL-lo v2.indd 6                                                         6/12/13 10:13 AM
Introduction

         The Children’s Aid Society (Children’s Aid) contracted with The Finance Project
         (TFP) to conduct a study to determine the social return on investment (SROI) of the
         New York City-based children’s charity’s community schools. An SROI calculation
         is a relatively new approach used to capture social value by translating outcomes
         into financial and nonfinancial measures.3 It differs from a traditional cost-benefit
         analysis because it is a framework for exploring an organization’s “social value,” both
         in dollar terms (“social profit”) and qualitative impact. This case study is a landmark
         attempt to use SROI analysis to measure the value of the Children’s Aid community
         school model.

         Purpose of the Case Study
         Increasingly, policymakers, state and city officials, and members of the private phi-
         lanthropy community want clear evidence of the results of their investments. One pur-
         pose of this study is to provide these leaders and other decisionmakers with the critical
         information they need to understand the return on their investments in Children’s
         Aid. The goal of this study is to better understand the impact of the community
         schools operated by The Children’s Aid Society on students, families, and the school
         community. It analyzes “value” not only in terms of improved outcomes, but also
         through additional revenues generated and costs avoided using an SROI approach.
         This approach looks at the total monetary benefit derived from social investments
         relative to the monetary costs of those investments.
                SROI can be a powerful tool for communicating the monetary value of the
         community schools in a way that resonates with public- and private-sector leaders.
         Children’s Aid and other community school leaders and decisionmakers can use the
         study’s findings to guide their program, policy, and funding decisions. Therefore,
         TFP opted for a straightforward approach to ensure the funders, policymakers, and
         other leaders have a significant level of confidence in the findings. The approach used
         to conduct the SROI analysis strives to balance the client’s goals with the realities of
         available data and rigorous methodology.

         3.   New Economics Foundation, Measuring Value: A Guide to Social Return on Investment, 2d. ed. (London,
              England: New Economics Foundation, 2008).

                                                                                                   The Finance Project / The Children’s Aid Society     7

TFP SROI Case Study FINAL-lo v2.indd 7                                                                                                                6/12/13 10:13 AM
“Making every school a community school has to be our collective
         vision. This has to be the rule rather than the exception.”
         —Arne Duncan, U.S. Secretary of Education, Children’s Aid Society, Community
         Schools National Conference, October 22, 2009
         http://www.childrensaidsociety.org/media-center/videos/arne-duncan-speaks-community-schools-practicum

         The Children’s Aid                                         Documented Impact                                        Aid found that on-site health clinics in
         Society’s Community                                        of Children’s Aid                                        four community schools helped prevent
         Schools                                                    Community Schools                                        emergency room visits by students that
                                                                                                                             would likely have occurred if these
         The Children’s Aid Society was founded                     The Children’s Aid Society has commis-                   students had attended a traditional
         in 1853 and offers a comprehensive array                   sioned several independent evaluations                   school without built-in access to health
         of services to more than 70,000 children                   of its community schools during the                      services. The data also revealed that
         and families each year at 45 locations                     past decade.4 Evaluation findings                        school-based health clinics at Children’s
         throughout New York City. Fundamental                      include these:                                           Aid community schools provided more
         to Children’s Aid’s theory of change                        • Children who participated in com-                     timely access to mental health services
         and school philosophy is the belief that                      munity school afterschool programs                    than traditional schools.5
         a focus on the education of children                          demonstrated greater gains in math
         and the strength of the surrounding                           and reading than non-participants,
         community results in a “web of support”                       particularly when they attended the
         for children’s optimal development. Its                       program for more than one year.
         community schools provide various                           • Student and teacher attendance was
         supports and services all year long, both                     higher at community schools than at
         during and outside the regular school                         matched comparison schools.
         day, to help students develop academi-                      • Teachers, parents, and students
         cally and socially.                                           at community schools rate school
                Depending on the school site,                          climate more positively than do their
         students may participate in extended day                      peers at comparison schools.
         academic enrichment programs or receive                     • Parent/caregiver involvement was
         on-site or school-linked medical, dental,                     significantly higher in community
         and mental health services. Family and                        schools than in comparison schools.
         community members can also access
         early childhood or adult education                         Furthermore, some Children’s Aid com-
         programs. These five comprehensive                         munity schools offer on-site (or school-
         supports and services are integrated                       linked) health and mental health services
         and aligned with the school day and                        for students. Based on data it collected
         are provided to those most in need of                      between 2007 and 2009 on several
         academic and social boosts.                                indicators of child health, Children’s

         4.   The Children’s Aid Society, Building Community Schools: A Guide for Action.(New York: The Children’s Aid Society, 2011).
         5.   The Children’s Aid Society, “School-Based Health Centers Dashboard” (New York: The Children’s Aid Society, 2012), www.childrensaidsociety.org/publications/
              spring-2012-school-based-health-centers-dashboard.

         8          Measuring Social Return on Investment for Community Schools: A Case Study

TFP SROI Case Study FINAL-lo v2.indd 8                                                                                                                                      6/12/13 10:13 AM
High school students construct thoughtful
portfolios to compete for college entrance.
—The Children’s Aid Society
The Finance Project / The Children’s Aid Society 9
TFP SROI Case Study FINAL-lo v2.indd 9 6/12/13 10:14 AMGraduation ceremony for The Children’s Aid
Society’s Ercilia Pepin Parent Leadership
Institute. Since its inception in 2007, the
Institute has graduated an average of 400
parents and family members a year.
—The Children’s Aid Society
10 Measuring Social Return on Investment for Community Schools: A Case Study
TFP SROI Case Study FINAL-lo v2.indd 10 6/12/13 10:14 AMSROI Approach, Tools,
and Analysis
The Finance Project partnered with The Children’s Aid Society to pilot a methodology,
adapted from the New Economics Foundation,6 to assess the social return on invest-
ment of community schools. The key steps identified and used to conduct an SROI
analysis include:
• Step 1: Understand what to measure
• Engage stakeholders
• Review and refine the theory of change
• Define the analysis parameters
• Step 2: Prepare for the SROI Analysis
• Determine a sample
• Establish a data collection process
• Collect outcome and cost data, including in-kind costs
• Identify outcomes and indicators to be measured and collected
• Develop an impact map
• Step 3: Model and calculate the SROI
• Determine financial values and proxies
• Calculate impact
• Calculate the SROI
Step 1: Understand What to Measure
To create a solid foundation for the SROI analysis, community school leaders
must engage stakeholders, review and refine the theory of change, and define the
analysis parameters.
Engage Stakeholders
To help guide the case study, Children’s Aid convened an 9-member advisory com-
mittee consisting of experts in research, public policy, and program development and
administration. The advisory committee was asked to review and offer feedback on the
study methodology, provide feedback on the content and presentation of the findings,
and help identify key audiences for the study findings. Also instrumental to the case
study were members of the Children’s Aid staff, who provided overall direction.
Evaluation experts on the advisory committee were engaged throughout the
SROI process to offer advice and comment on the study design and quality of the
data. On December 14, 2010, the advisory committee met to agree on the final
study methodology, including how to address data limitations and the rigor of the
6. New Economics Foundation.
The Finance Project / The Children’s Aid Society 11
TFP SROI Case Study FINAL-lo v2.indd 11 6/12/13 10:14 AMAt Children’s Aid Society community schools,
students have access to comprehensive health care,
including medical and dental services.
—The Children’s Aid Society
12 Measuring Social Return on Investment for Community Schools: A Case Study
TFP SROI Case Study FINAL-lo v2.indd 12 6/12/13 10:14 AM“Evaluations back up the anecdotes of accomplishment…This research
record makes the Children’s Aid Society Exhibit #1 in the case for
community schools nationwide.”
—David L. Kirp
Kids First: Five Big Ideas for Transforming Children’s Lives and America’s Future, by David L. Kirp.
(New York: Public Affairs, Perseus Books Group, 2011).
approach, and to identify opportunities • Schools are engaged with families Step 2: Prepare for the
to communicate the study findings to and communities. SROI Analysis
key stakeholders. • Teachers and principals are effective.
The December 2010 meeting After clarifying what to measure, com-
launched the start of the SROI study and These goals formed the basis of the munity school leaders must determine
was instrumental in deciding the param- analysis. After careful review of the goals a sample; establish a data collection
eters of the analysis. Specifically, the and intended outcomes of Children’s Aid process; collect cost and outcome data;
advisory committee provided guidance and other community school initiatives, identify outcomes and indicators to be
regarding the Children’s Aid outcomes, more than 40 outcomes pertaining to the measured and collected; and develop an
potential data sources, and recommended eight major goals were identified for the impact map.
study sample. The committee also analysis (see Appendix A: Community
forewarned TFP about the risks involved School Goals and Outcomes Crosswalk). Determine a Sample
in the monetization process stating, “You Each outcome relates to measurable Two of The Children’s Aid Society’s
have to monetize everything. If not, indicators that are used to assess the sites—P.S. 5/Ellen Lurie Elementary
the outcome will be underrepresented value of community schools. School (prekindergarten to grade 5)
and you don’t want to miss any of the and its sister site, the Salomé Ureña de
benefits.” The committee added, “There Define the Analysis Henriquez Campus (grades 6 to 12)—
is a lot of value in monetizing, but Parameters were chosen to be part of the pilot effort
over-monetizing can cause too much To ensure the efficacy and integrity of the to measure the social return on invest-
skepticism.” This critical advice enabled case study, Children’s Aid, the advisory ment of the Children’s Aid community
TFP staff to develop a reliable evaluation committee, and TFP staff agreed to limit school model. These sites were chosen
method for The Children’s Aid Society. the case study to a sample of “full- because of the comprehensive program
service” elementary and middle schools approach and longevity of the programs
Review and Refine the for the three most recently completed at these school sites. Both school sites
Theory of Change school years, 2007 to 2010. Full-service are considered “full service,” meaning
The relationship between the program schools include four major service areas: they offer the full array of Children’s Aid
components offered by Children’s Aid expanded learning opportunities (includ- program services. The Children’s Aid
and the respective goals those compo- ing afterschool and summer programs); Society has operated the schools since
nents intend to achieve is known as on-site or school-linked health and 1993 and 1992, respectively.
a “theory of change.” Children’s Aid’s mental health services; parent educa- P.S. 5/Ellen Lurie Elementary
theory of change is representative of tion and engagement; and other family School has a student body of approxi-
that of other community school models. support services. These four service areas mately 800 students. The Salomé Ureña
Therefore, TFP staff analyzed the address all eight community school goals. de Henríquez Campus (Salomé Ureña) is
goals of the Coalition for Community The Children’s Aid case study more complex, because three schools are
Schools and The Children’s Aid Society sought to answer these questions: housed on one campus: the City College
to identify eight primary goals of • What is the SROI of a Academy of the Arts, M292 (grades 6
community schools: sample of Children’s Aid-affiliated to 12); an Intermediate School, IS 218
• Children are ready to elementary schools? (grades 6 to 8); and Middle School 322
enter kindergarten. • What is the SROI of a (grades 6 to 8). Combined, these three
• Students are active in the school and sample of Children’s Aid-affiliated schools serve a student body of approxi-
in the community. middle schools? mately 1,300 students.
• Students succeed academically. • How do the various Children’s Aid Most adult participants in the
• Students are healthy physically, program components contribute to Children’s Aid-offered services at these
socially, and emotionally. the overall return on investment? sites are parents of the enrolled students;
• Students live and learn in a safe and • If possible, what is the SROI of a however, community residents other
supportive environment. random sample of peer elementary than students or their parents also
• Families are involved with their and middle schools? participate in these services. The breadth
children’s education. of the programming at these sites sets a
The Finance Project / The Children’s Aid Society 13
TFP SROI Case Study FINAL-lo v2.indd 13 6/12/13 10:14 AM“The community-wide approach where a school is the hub of holistic services is a recipe for
success. The Vito Marcantonio School (P.S.-I.S. 50) works with organizations like the Children’s
Aid Society to help its students succeed. The Harlem Children’s Zone approach may be too
costly to replicate in every neighborhood, but its framework, as evidenced by P.S.-I.S. 50, should
serve as a model for at-risk communities everywhere.”
—Alma J. Powell, Chairwoman, America’s Promise Alliance
The New York Times, May 11, 2009
solid baseline for determining the social collection tools, such as data from the cost, the value of food costs for
return of the Children’s Aid services Peabody Picture Vocabulary Test (PPVT) afterschool programs provided by
not only on participants of particular or percentage estimates from standard- the city’s education department, and
programs, but also on other students ized test scores. (See Data Limitations on the value of volunteer staff and other
attending the schools. This is known as page 15.) in-kind services.
the “spillover effect.”
Collect Cost and TFP staff collected all relevant cost
Establish a Data Outcome Data and budget data for PS 5 and Salomé
Collection Process Two types of data are required for the Ureña from 2007 to 2010 and averaged
A project team at The Finance Project SROI analysis: cost data and outcome the cost over that three-year period as the
worked closely with key members of The data. Cost data, known as the “value of operating cost of the community schools.
Children’s Aid Society staff (Jane Quinn, the investment,” reflects the monetary They worked with identified Children’s
vice president for community schools value of the resources required to operate Aid contacts to track and collect all cost
and director of the National Center for community schools. Outcome data, and budget data. The Children’s Aid
Community Schools; and Katherine known as the “value of the benefit,” is Society collected budget data separately
Eckstein, director of public policy) to the perceived benefit translated into a for the programs operated at each school.
identify and collect student, parent, and monetary value using financial proxies. It also captured separate budget data for
community indicators on both regular The pilot study used data for Children’s the regular day school budget, which is
school day activities and Children’s Aid Aid community schools from academic funded through city, state, and federal
activities at PS 5 and Salomé Ureña. years 2007–08, 2008–09, and 2009–10, funding sources.
The data collection process also mostly available through the New Five peer schools were used as the
included working with Children’s Aid York City Department of Education’s comparison group for this study. All
community schools’ director of quality databases and in-house data, including comparison schools were matched by
control, Angela Rodriguez, and director The Children’s Aid Society’s independent key demographics to the Children’s Aid
of fiscal operations, Robert Aguirre. Mr. evaluator, ActKnowledge. school sample. To measure the SROI,
Aguirre was responsible for gathering budget information also was collected on
and delivering the cost and budget data, Cost Data. To calculate the social return the sample of five peer schools. Because
while Ms. Rodriguez worked to obtain on investment, TFP staff first determined most of the funding that schools receive
the right outcome and indicator data. As what it cost to produce the results is based on the Fair Student Funding
needed, several other key stakeholders, achieved by the Children’s Aid commu- Allocation, a formula that allocates fund-
including the Children’s Aid community nity schools. To get a “true” cost, three ing to all public New York City Schools,
school directors at each of the study sites types of cost categories were considered: budget data was collected to verify that
(Madelyn Gonzalez at PS 5 and Migdalia • Program costs, including all staffing per-student expenditures generally were
Cortes-Torres at Salomé Ureña) and an costs, materials, and supplies for equivalent between the peer schools and
external evaluator provided outcome data providing the direct services; Children’s Aid schools.
and information regarding the programs • Overhead/administrative costs,
at the two study sites. All cost and including the costs of providing Outcome Data. Outcome data deter-
outcome data were then shared with TFP support to all the Children’s Aid mines the impact, or added value, of
staff, which they managed, reviewed, and community schools, such as payroll the community schools’ key program
shaped as part of the SROI analysis. and benefits, program oversight and components, such as afterschool
Deciphering differences between management, and policy develop- programs, parent support services,
preexisting and new data proved chal- ment, as well as the actual cost of and on-site health services. TFP staff
lenging. Much of the preexisting data operating the schools as recorded by provided Children’s Aid with a checklist
was not available in the format required the New York City Department of to help staff understand what outcome
for the analysis. Therefore, TFP staff Education; and data was available on multiple program
relied heavily on raw data from The • In-kind costs, including the value components, including health, after-
Children’s Aid Society or used average of the space provided to Children’s school, and early childhood programs.
figures from already established data Aid community schools at a reduced The checklist also was used to track
14 Measuring Social Return on Investment for Community Schools: A Case Study
TFP SROI Case Study FINAL-lo v2.indd 14 6/12/13 10:14 AMData Limitations
Longitudinal Data
Data that tracks individual student outcomes over time was not available. For example, the graduation rate of students
who have attended Children’s Aid elementary and or middle schools was unknown, so estimates had to be used. It is
also unknown to what extent students who have attended Children’s Aid community schools have experienced nega-
tive outcomes, such as spells in juvenile or adult corrections, unemployment, or receipt of Temporary Assistance for
Needy Families.
Incomplete Data
Unlike middle schools, where an evaluation has been completed on Children’s Aid 21st Century Community Learning
Center afterschool programs, no evaluations that include high schools have been completed. One evaluation, conducted
from 1993 to 1999 by Fordham University, included elementary schools. Although previous evaluation data was limited,
The Children’s Aid Society was able to obtain some raw student data, primarily on participation in the Children’s Aid
services. Individual student data was unknown, so a percentage estimate was used to determine impact when using
standardized test scores and environmental survey data from the New York City Department of Education.
The Finance Project / The Children’s Aid Society 15
TFP SROI Case Study FINAL-lo v2.indd 15 6/12/13 10:14 AMdata collected from the New York City A list of measurable indicators was and Salomé Ureña), each with particular
Department of Education and other used to develop an inventory checklist beneficiaries: children from birth to
sources, such as the U.S. Census Bureau, for each beneficiary. The measurable age five (PS 5 only), students, families,
New York City Police Department, New indicators are linked to the list of more and the school community. An impact
York State Division of Criminal Justice than 40 social, educational, environmen- map was developed for each group of
Services, New York City Department tal, and health-related outcomes achieved beneficiaries, which followed the inven-
of City Planning, and New York City according to the eight major goals. The tory checklist described earlier and in
Department of Health and Mental checklist is composed of recommended Appendix B. Actual available data points
Hygiene. For example, the city education community school outcomes and were used to populate a Microsoft Excel
department collects a significant amount indicators categorized by beneficiary (see impact map. Each of these impact maps
of performance and accountability data Appendix B: Data Inventory Worksheet). can be found in Appendix C: Impact
on all schools, including student perfor- It was used to collect outcome data at the Maps by Site and Beneficiary. A sample
mance and school climate information, two Children’s Aid sites, when available, of the first part of an impact map for
through a school survey and quality for the three-year period 2007 to 2010. the birth-to-age-five beneficiary group is
reviews. Regular school day student The purpose of collecting three years found in Table 1.
indicators from a randomly selected of data was to determine an average for TFP staff encountered several
set of comparison peer schools also each outcome to help gauge consistency challenges when analyzing a comparison
were collected. over time. Although The Children’s Aid peer group. Specifically, the enrollment
Society would like to see improvements numbers of the peer schools usually
Identify Outcomes and across all outcomes, the average of outnumbered the enrollment numbers
Indicators To Be Measured the outcome data accounts for larger at the Children’s Aid sites. This observa-
and Collected increases or decreases over time. tion was troublesome, because the
A community school model has direct multiplier for the benefit was larger for
and indirect beneficiaries. The Children’s Develop an Impact Map the peer group than for the Children’s
Aid Society focuses on four major The eight identified goals created Aid sample. As a result, the measure of
direct beneficiaries: the framework for an impact map of total impact was skewed for the impact
• Infants and young children, from Children’s Aid community school activi- map. Cost data for the comparison
birth to age five; ties. An impact map is used to capture group also was skewed, because the
• Students; how an activity makes a difference, what only data source was the New York
• Families; and the kind of difference, and to whom. In City Department of Education. It was
• School Community addition to a “monetization” process, unclear whether other program activities
in which the outcomes were assigned a took place at the selected group of peer
Although other stakeholders related to dollar value corresponding to benefits schools. Subsequent studies will require
Children’s Aid community schools exist, or cost savings, this information is used additional outreach to the comparison
including staff, volunteers, funders, to calculate and analyze Children’s Aid’s schools to ascertain the impact.
and taxpayers, this study focused on social return on investment.
the impact on those most affected by Children’s Aid’s study design
community school activities. included two sets of school sites (PS 5
16 Measuring Social Return on Investment for Community Schools: A Case Study
TFP SROI Case Study FINAL-lo v2.indd 16 6/12/13 10:14 AMTable 1: Birth-to-Age-Five Beneficiary Group—Impact Map Layout, Part 1
Outcome Indicator Indicator 2008 2009 2010 Three-year
Proxy Average/
Estimate
Children attend early Total enrollment and Total enrollment 134 136 138 136
childhood programs. attendance in Head Start,
Early Head Start, or other Average daily attendance 118 120 121 120
formal early child care
programs offered by
Children’s Aid.
Children have adequate Number of visits to community Health center visits by children 296 342 217 285
physical well-being. school health center for early 4 years old and younger (does
childhood checkups. not include first aid)
Children have attained Measures of child literacy PPVT scores for a nationally 29 (52%) 29
cognitive and early and language development: representative sample
literacy skills. recognizing letters; counting
to 20 or higher; understanding Number of students enrolled 28 (50%) 28
concepts of print, listening, in the community school’s
and speaking; and reading or reading program
pretending to read.
The Finance Project / The Children’s Aid Society 17
TFP SROI Case Study FINAL-lo v2.indd 17 6/12/13 10:14 AMStep 3: Model and should be conducted with site coordina-
Calculate the SROI tors and staff, Children’s Aid program
evaluators, and other stakeholders to
Efforts to determine financial values and better understand the value of these
proxies, calculate impact, and calculate measures, which are not easily quantifi-
the SROI comprise the last step. able. Without this information, TFP was
unable to answer the research question,
Determine Financial Values “How do the various Children’s Aid
and Proxies program components contribute to the
Based on the available outcome data, overall return on investment?”
TFP staff identified financial values
and/or proxies for identified outcomes Calculate Impact
using the research literature. This Once a complete inventory of the costs
process is referred to as “monetizing” and monetized benefits for Children’s
the outcomes. Monetizing an outcome Aid was established, TFP staff calculated
helps assign a financial value to the social the impact of the outcomes using the
benefits produced. following steps:
The process of determining the • Multiply the financial value by the
financial value for each outcome for quantity of the outcomes, which
which The Children’s Aid Society equals a total unit value.
had data varied. TFP staff conducted • Repeat the process for each outcome
extensive research of third-party sources to arrive at the total unit value/impact
to identify and assign the most accurate for each set of outcomes.
proxies possible. When feasible, average • Aggregate the total to arrive at the
costs were used and both fixed costs and overall impact of the outcomes for
variable costs were noted. The proxies related beneficiaries.
included the price for a service, social
validation (e.g., worth to the stake- This process is illustrated in the second
holder), cost savings, average household section of the impact map example in
spending, and travel costs. Table 3 and is the representation of the
Camper enjoys the beautiful In addition, many of the proxies full collection of data points broken up
weather at The Children’s had to be converted into an indexed by beneficiary, outcome, and proxy value.
value to represent the New York City Microsoft Excel was used to track and
Aid Society’s Wagon Road dollar in 2010. This included an inten- calculate the totals.
summer camp outside New sive process of finding the appropriate After an impact map for each
York City. population size and adjusting for infla- beneficiary has been calculated, the next
tion. Once an indexed value was deter- step requires adding the total costs from
mined on the appropriate outcomes, the the cost data and the total monetized
— The Children’s Aid Society financial proxies were carefully organized benefits from the impact calculations.
by outcome attributed to a specific Table 4 demonstrates the total costs and
beneficiary (see Appendix D: Monetized benefits for PS 5. The impact map for
Benefits). each beneficiary by school site is included
Several outcomes do not have in Appendix C: Impact Maps by Site
a direct financial proxy. Table 2 lists and Beneficiary.
outcomes that should be considered in
the results of the SROI analysis but are Calculate the SROI
not calculated in the formula. To further The last three steps TFP staff used to
strengthen this case study, interviews calculate the SROI include subtracting
18 Measuring Social Return on Investment for Community Schools: A Case Study
TFP SROI Case Study FINAL-lo v2.indd 18 6/12/13 10:14 AMTable 2: Outcomes Without a Direct Financial Proxy
Beneficiary Outcome
Children birth to age five Children have developed social and emotional skills.
Children birth to age five Children have adequate motor development.
Children birth to age five Children are motivated to learn.
Students Students demonstrate competencies based on the Collaborative for Academic, Social, and Emotional Learning.
Family Parents, teachers, and peers have high expectations for youth.
Family Flexible options for parent engagement are evident.
School Community Teachers improve student performance.
School Community Strong and effective school leadership exists.
School Community Teachers understand their students and have cultural competence.
Table 3: Birth-to-Age-Five Beneficiary Group—Impact Map Layout, Part 2
Outcome Indicator Impacted Financial Total Unit Value
Population Value
(three-year
average)
Children attend early childhood Total enrollment 136 $10,847 $1,475,192
programs.
Average daily attendance See total enrollment.
Children have adequate physical Health center visits by children 4 years old 237 $17,172 $4,069,764
well-being. and younger (does not include first aid)
Children have attained cognitive and PPVT scores for a nationally representative 29 See cost savings above.
early literacy skills. sample
Number of students enrolled in the 28 See cost savings above.
community school’s reading program
TOTAL $5,544,956
The Finance Project / The Children’s Aid Society 19
TFP SROI Case Study FINAL-lo v2.indd 19 6/12/13 10:14 AMTable 4: PS 5—Total Costs and Benefits for The Children’s Aid Society
Total Investments Total Benefits
Children’s Aid–operated early childhood program(s) $988,347 Birth to Five $5,544,956
Children’s Aid programming, including afterschool and $801,497 Student $44,247,955
other programs for children and families
Family $0
New York City Department of Education individual $7,819,451
school operations School $965,736
Health center operations 340,900 TOTAL $50,758,647
In-kind services donated by the New York City Department $171,494
of Education or local businesses to support Children’s Aid
operations, including value of volunteer time
TOTAL $10,121,690
Table 5: PS 5—Cost/Benefit Summary and SROI Calculation (at 27 Percent Deadweight)
Total Investments Total Benefits
Children’s Aid-operated early childhood program(s) $988,347 Birth to Five $5,544,956
Children’s Aid programming, including afterschool and $801,497 Student $44,247,955
other specific programs for children and families
Family $0
New York City Department of Education individual $7,819,451
school operations School $965,736
Health center operations 340,900 TOTAL $50,758,647
In-kind services, including donated volunteer time $171,494
TOTAL $10,121,690
Deadweight @ 27% Year 1 Year 2 Year 3 Year 4 Year 5
(i.e., Children’s Aid
can claim 73% of
the benefits)
$37,053,812 $27,049,283 $19,745,977 $14,414,563 $10,522,631
Net Present Value of Total $37,053,812 $27,049,283 $19,745,977 $14,414,563 $10,522,631
Benefits =
1.02 1.04 1.06 1.08 1.10
$36,327,267 $25,998,926 $18,607,075 $13,316,828 $9,530,671
Net Present Value= $103,780,767
Net Present Value $103,780,767
SROI3 = SROI3 = 10.3
Value of Investment $10,121,690
20 Measuring Social Return on Investment for Community Schools: A Case Study
TFP SROI Case Study FINAL-lo v2.indd 20 6/12/13 10:14 AMthe deadweight loss, converting figures to the community school strategy and by ranking six outcomes with an
to a net present value, and computing implementation in the schools analyzed associated impact by high, medium,
the SROI. The last few steps in the (deadweight at 10 percent); medium and low. The six known outcomes
process required a great deal of math, meaning a mid-range percentage of the are these: students have access to
but the calculations were easily done in change can be attributed to the commu- education services and supports inside
Microsoft Excel. nity school strategy and implementation and outside the school; students
in the schools analyzed (deadweight at attend school regularly and stay
Subtract Deadweight. Deadweight 25 percent); and low meaning a small in school; students do not repeat
is the percentage of benefit that would percentage of the change in that outcome grades; students are connected to
have happened regardless of the presence can be attributed to the community caring adults in the school and the
of the Children’s Aid community school school strategy and implementation in community; students have adequate
program components. Deadweight is an the schools analyzed (deadweight at 50 physical well-being; and students
important factor in sensitivity analysis. A percent). have access to quality dental, health,
sensitivity analysis assesses the extent to For the various beneficiary groups, and mental health services. Of the six
which impact estimates are attributable Clark, Quinn and Negrón estimated the outcomes, Children’s Aid determined
to the Children’s Aid community school following deadweights: that attribution was high in three
program components. This is done by • Infants and young children—10 areas, medium in two areas, and low
subtracting the total deadweight from percent deadweight; Children’s Aid in one area.
the total value of benefits by beneficiary believes that 90 percent of the change • Salomé Ureña students—16 percent
for each year over the anticipated benefit in this area is attributable to the deadweight; this value was calculated
period (t). community school early childhood by ranking seven outcomes with an
For the pilot study, Heléne Clark programs on the basis that these pro- associated impact by high, medium,
of ActKnowledge (external evaluator) grams consistently receive the highest and low. The seven known outcomes
and Jane Quinn and Richard Negrón ratings for their outcomes during are these: students have access to
from Children’s Aid reviewed each federal reviews. In addition, these education services and supports inside
outcome in which there was an associ- programs enroll extremely high-risk, and outside the school; students
ated impact for infants and young low-income children who would be attend school regularly and stay
children, students, families, and the unlikely to develop appropriate skills in school; students are achieving
school community. They developed a and attitudes without intervention. academically; students are connected
rationale for assigning a deadweight value Moreover, the programs have addi- to caring adults in the school and the
to each outcome (see Appendix E: SROI tional literacy enrichment activities community; students have adequate
Deadweight Rationale). They rated each that have been shown in a random physical well-being; students have
outcome as having high, medium, and assignment study to boost children’s access to quality dental, health, and
low attribution—with high meaning a literacy attainment. mental health services; and students
large percentage of the change in that • PS 5 students—22 percent dead- have access to health and physical
outcome is assessed as being attributable weight; this value was calculated education opportunities. Of the seven
The Finance Project / The Children’s Aid Society 21
TFP SROI Case Study FINAL-lo v2.indd 21 6/12/13 10:14 AM“The leaders of the Children’s Aid Society were, from the beginning
of their work, aware of the importance of building programs that
were comprehensive and creative and that allowed for individual
attention, started early and involved parents.”
—Joy G. Dryfoos, Education Researcher and Writer
Community Schools in Action: Lessons from a Decade of Practice (Oxford University Press, 2005).
outcomes, Children’s Aid determined percent of the total benefit is attribut- Value of Benefits = Aggregated financial
that attribution was high in four areas able to Children’s Aid. value of all beneficiaries in the analysis
and medium in three areas. r = discount rate, 2 percent
• Families—not applicable; no positive Convert benefits to net present value. t = time, 5 years
or negative benefit was determined. To determine the SROI, TFP staff
• School Community—50 percent calculated the net present value of the Calculate the SROI. After completing
deadweight; for the only known benefits. The net present value reflects these steps, the SROI for Children’s Aid
benefit—teachers are highly quali- the conversion of the costs of invest- community schools was calculated using
fied—Children’s Aid indicated that ments in Children’s Aid community the following equation:
being a community school does schools in prior years to costs in current
not have an impact on the teacher dollars. It is the sum of all the periodic Net Present Value of Benefits
assignment system. Research indicates cash flows adjusted to present-day value SROI = Net Present Value of
that schools in very disadvantaged at the appropriate discount rate (r) and Investments
neighborhoods are likely to have the benefit period (t).7 The net present value
least qualified teachers. of the benefits is the numerator within The last of these steps can be difficult to
the SROI equation. The discount rate follow. The results and numerical calcula-
By averaging the total deadweight among (r) is the figure that makes the computed tion from these steps is demonstrated in
each of these beneficiary groups for present value comparable now and in Tables 5 and 6.
PS 5 and Salomé Ureña, the following the future. It is used to discount future
deadweight values were used for the values to present value. It can be thought
SROI analysis: of as a reversed interest rate, where future
• PS 5—deadweight at 27 percent, amounts are reflected today, with the
which is the average deadweight value present value being smaller.8 In the case
of infants and young children (10 of Children’s Aid, the analysis assumed a
percent), students (22 percent), and 2 percent discount rate, which is consis-
the school community (50 percent). tent with the inflation rate between 2009
This indicates that 73 percent of and 2010.9 The time period (t) was esti-
the total benefit is attributable to mated at five years. The net present value
Children’s Aid. (NPV) of the benefits can be calculated
• Salomé Ureña—deadweight at by using the following calculation:
33 percent, which is the average
deadweight value of students (16 Value of Benefitst
percent) and the school community NPV =
(50 percent). This indicates that 67 (1 + r)t
7. Tom Ralser, ROI for Nonprofits: The New Key to Sustainability (Hoboken, NJ: John Wiley and Sons, 2007).
8. Ibid.
9. U.S. Department of Labor, Bureau of Labor Statistics, Consumer Price Index Inflation Calculator, http://www.bls.gov/data/inflation_calculator.htm.
22 Measuring Social Return on Investment for Community Schools: A Case Study
TFP SROI Case Study FINAL-lo v2.indd 22 6/12/13 10:14 AMTable 6: Salomé Ureña—Cost/Benefit Summary and SROI Calculation (at 33 Percent Deadweight)
Total Investments Total Benefits
Children’s Aid-operated child care program(s) N/A Birth to Five N/A
Children’s Aid programming, including afterschool and $959,835 Student $51,519,957
other specific programs for children and families
Family $0
New York City Department of Education individual $3,827,595
school operations School $262,705
Health center operations 958,700 TOTAL $51,782,662
In-kind services, including donated volunteer time $124,657
TOTAL $5,870,787
Deadweight @ 27% Year 1 Year 2 Year 3 Year 4 Year 5
(i.e., Children’s Aid
can claim 73% of
the benefits)
$34,694,384 $23,245,237 $15,574,309 $10,434,787 $6,991,307
Net Present Value of Total $34,694,384 $23,245,237 $15,574,309 $10,434,787 $6,991,307
Benefits =
1.02 1.04 1.06 1.08 1.10
$34,014,102 $22,342,596 $14,676,019 $9,640,130 $6,332,242
Net Present Value= $87,005,090
Net Present Value $87,005,090
SROI3 = SROI3 = 14.8
Value of Investment $5,870,787
The Finance Project / The Children’s Aid Society 23
TFP SROI Case Study FINAL-lo v2.indd 23 6/12/13 10:14 AMAt P.S. 5, healthy cooking is also for boys.
—The Children’s Aid Society
24 Measuring Social Return on Investment for Community Schools: A Case Study
TFP SROI Case Study FINAL-lo v2.indd 24 6/12/13 10:14 AMConclusion
The SROI measures the value of estimates were derived from existing The Children’s Aid Society can use the
Children’s Aid community school data, which was not easily translated current findings not only to demonstrate
benefits relative to the costs of achiev- into the form required for the the value of the Children’s Aid com-
ing those benefits. It is the ratio of the study, or raw student data, which munity schools, but also to support
net present value of the investment. is not always a good representation decisionmaking when choosing which
The SROI results for the Children’s of outcome. programs to keep. For example, if a rela-
Aid community school sites (PS 5 and • Researching a comparison group tively low investment in programming at
Salomé Ureña) were positive. In fact, The can help The Children’s Aid Society the middle school and high school levels
Children’s Aid Society programs at PS assess the difference between the produces high outcomes, this program
5 produce a 10.3 to 1.0 ratio; at Salomé impact of a traditional school and the may be prioritized over more costly pro-
Ureña, a 14.8 to 1.0 ratio. A ratio of 10.3 impact of a school with the expanded grams with low outcomes. Specifically,
to 1.0 indicates that an investment of $1 and extended services offered by Children’s Aid can review its impact
delivers $10.30 in social value; a ratio of Children’s Aid. This knowledge would map to determine whether programs
14.8 to 1.0 indicates that an investment enable Children’s Aid to strengthen that yield higher outcomes, such as the
of $1 delivers $14.80 in social value. its understanding of the difference in Carrera Adolescent Pregnancy Prevention
When presenting these ratios impact achieved through the addi- Program or Go! Books, should be contin-
to stakeholders, The Children’s Aid tional investment by Children’s Aid ued or expanded. The impact map can
Society will need to determine how best and its supporters beyond the invest- also help decisionmakers assess what pro-
to represent these figures and which ments already made in a traditional grams have high participation and low
sensitivity level is more appropriate; in school. It also is important to show participation, such as specific afterschool
other words, how much of the benefit funders the significant student, family, components. Ultimately, this informa-
can Children’s Aid credibly claim? The and community outcomes observed tion can be used to demonstrate to key
detailed approach Children’s Aid took because of Children’s Aid. stakeholders the value of Children’s Aid
in estimating deadweight among each • Expanding this study to include community schools to students, families,
outcome allows for a sound justification more school sites would be valuable. and communities.
in its ability to claim 73 percent of the So, too, would focus group discus- Last, the findings provide clear
benefit for PS 5 and 67 percent of the sions with key stakeholders (e.g., quantitative evidence that investments
benefit for Salomé Ureña. parents, teachers, and site staff) to in Children’s Aid community schools are
While the preliminary findings on assess the value of outcomes that making a demonstrable difference in the
Children’s Aid community schools are are not easily quantifiable. Doing so community. This evidence of real quanti-
promising, the study could be strength- would give Children’s Aid community fiable social benefits is what leaders need
ened. Specifically, research in these school leaders a better understanding to maintain their support of community
additional areas would bolster the results: of how the various program compo- schools and to increase that support in
• Solidifying the impact estimates nents contribute to the overall return search of additional significant social
would be an important next step on investment. returns on those investments.
for this study. Many of the impact
The Finance Project / The Children’s Aid Society 25
TFP SROI Case Study FINAL-lo v2.indd 25 6/12/13 10:14 AMYou can also read