Centre for Academic and Personal Excellence
←
→
Page content transcription
If your browser does not render page correctly, please read the page content below
Student-Centred Personalized Integrated Learning
               Environment within a Community of Learners

          Centre for Academic and Personal Excellence

    CHARTER SCHOOL ANNUAL EDUCATION RESULTS REPORT 2017-2018
& CHARTER SCHOOL THREE YEAR PLAN FOR EDUCATION 2018/2019–2020/2021

                             NOVEMBER 30, 2018

                               201 5 Street SW
                              Medicine Hat, AB
                                  T1A 4G7
                             TEL: (403) 528-2983
                             FAX: (403) 528-3048
                             www.capeisgreat.org

                             Member of TAAPCS
Table of Contents

Accountability Statement                                                                                                                                                                           3
Permalinks                                                                                                                                                                                         4
Vision & Mission                                                                                                                                                                                   4
Principals & Beliefs                                                                                                                                                                               5
CAPE Profile                                                                                                                                                                                       6
Issues & Trends                                                                                                                                                                                    6
Accountability Pillar Summary                                                                                                                                                                      8
Program Review                                                                                                                                                                                     9

Key Messages                                                                                                                                                                                       15

Combined Report & Plan
Charter School Goals                                                                                                                                                                               16

            Goal 1: CAPE School is focused on achieving academic excellence                                                                                                                        16
                       Outcome 1: Student learning is improved so that students are working at their own personal best                                                                             16
                       Outcome 2: Student progress shows above average growth                                                                                                                      22
                       Outcome 3: Students become well-rounded individuals with a broad knowledge base which they can apply in flexible contexts                                                   24
                       Outcome 4: Students have a greater awareness of the world around them through exposure to other cultures, ideas, and beliefs and integrate ideas from various disciplines   26

            Goal 2: CAPE School is focused on achieving personal excellence                                                                                                                        28
                       Outcome 1: Students acquire personal and interpersonal skills so that they may become productive citizens of the world and life-long learners                               28
                       Outcome 2: Students learn the importance of caring for others, learn respect for others, and treat others fairly in both smaller and larger contexts                        30

Provincial Outcomes
                                                                                                                                                                                                   32
Outcome 1: Alberta’s student are successful                                                                                                                                                        32
Outcome 2: Alberta’s education system supports First Nations, Métis, and Inuit students’ success                                                                                                   44
Outcome 3: Alberta’s education system respects diversity and promotes inclusion                                                                                                                    45
Outcome 4: Alberta has excellent teachers, and school and school authority leaders                                                                                                                 46
Outcome 5: Alberta’s education system is well governed and managed                                                                                                                                 47

Summary of Financial Results 2016-2017 & Budget 2018 Summary                                                                                                                                       48
Capital and Facility Projects                                                                                                                                                                      51
Summary of Facility and Capital Plans                                                                                                                                                              51

Parental Involvement                                                                                                                                                                               52
Communication Plan 2017-2018                                                                                                                                                                       53
Whistleblower Protection                                                                                                                                                                           55

APPENDIX A: School Demographics                                                                                                                                                                    56

                                                                                                           2 of 63
Accountability Statement
The Annual Education Results Report for the 2017-2018 school year and the Education Plan for the three years commencing September 1, 2018, for CAPE
Public Charter school were prepared under the direction of the Board in accordance with its responsibilities under the School Act. This document was
developed in the context of the provincial government’s business and fiscal plans. The Board has used the results reported in the document, to the best of its
abilities, to develop the Education Plan and is committed to implementing the strategies contained within the plan to improve student learning and results.

The Board approved this combined Annual Education Results Report for the 2017/2018 year and the three-year Education Plan for 2018/2021 on November
28, 2018.

_______________________
Janine Bide
CAPE Board Chair

                                                    Basketball and Badminton Teams
                                                       New Endeavours at CAPE

                                                                           3 of 63
Combined Plan 2018/2019-2020/2021 AERR 2017/18: http://www.capeisgreat.org/education

Average Class Size Report 2017-2018: http://www.capeisgreat.org/education

Audited Financial Statement 2017-2018: http://www.capeisgreat.org/finance

Budget Report Form 2018-2019: http://www.capeisgreat.org/finance

The Fall 2018 Update to the Budget is posted on the school’s website: http://www.capeisgreat.org/finance

CAPE Capital Plan 2019/2020-2021/2022: N/A

CAPE Communication Plan 2018-2019: http://www.capeisgreat.org/governance

Our Vision

To promote the development of knowledge, skills, attitudes, and values that support 21st century citizenry and life-long
learning within a holistic, personalized, integrated, flexible learning environment.

Our Mission

To foster the development of academic and personal skills through the provision of a personalized, integrated program so that
each child or student may achieve success in the pursuit of personal and academic goals, strive for personal excellence,
become engaged thinkers and ethical citizens with an entrepreneurial spirit, independent learners, and world citizens.

                                                                  4 of 63
Principles and Beliefs

CAPE believes that:

1. Each student, as an individual, presents with particular academic and personal needs because of a variety of factors.

2. Students have the greatest potential of becoming successful students and life-long learners when placed in a student-centred
environment.

3. Students are best served through a personalized integrated program which is flexible, innovative, and responsive.

4. The school, as a collaborative instructional team, creates a shared learning atmosphere for all members to develop and maintain
a student-centred learning environment. Students are grouped and/or streamed to create highly effective learning environments.

5. Parents, as partners in the learning community, provide valuable perspectives and support for their students and deserve to have
a choice in an educational program which best supports individualized learning.

6. The community is a partner in the learning as it provides the domain for opportunities and experiences which expand beyond
the school, including leadership, collaboration, diversity, and resourcefulness.

               Numeracy

                                                                                          Paint Night Fundraiser

                                                             5 of 63
CAPE Profile

CAPE School is located within the City of Medicine Hat, a city of about 63 000 people in the south-eastern corner of Alberta. This area is
rich in natural resources, such as natural gas, and it is steeped in the farming/ranching tradition. Within the area there is a flourishing
scientific community as well as several organizations promoting the fine arts. Young people in the area have access to highly qualified
instructors in the fields of music, painting, pottery, and more, as well as sports such as soccer, minor hockey, and baseball. CAPE School is
located within easy access to all parts of the city, which is an asset especially in view of our community partnerships. We are within a short
distance of the downtown core, City Hall, the Medicine Hat College, the Cultural Centre, the Miywasin Centre, the Medicine Hat Library,
the Esplanade Museum and Art Gallery, the YMCA, the Family Leisure Centre, skating and curling rinks, swimming pools such as the
Crestwood Pool, parks such as the Lions Park, and artists’ studios. CAPE opened its doors in September 1994. It operated as a private
school for one year with the goal and purpose of fostering academic and personal excellence. Its education plan was designed to achieve
these goals. CAPE has been operating since September 1995 as a charter school. The school's goals remain unchanged, and its mandate is
to foster academic excellence (a personal academic excellence) and personal excellence. As of September 30, 2017, CAPE has an
enrolment of 213 students; 27 in Kindergarten, 72 in grades 1-3, and 114 in grades 4-9. Classes are capped at 18 +/-1 for grades K-3, and at
22 +/-1 for grades 4-5, and 24=/-1 for grades 6-9. Each K-3 class is supported by a certificated FTE teacher and a FTE educational assistant.
Further supports are provided in response to the needs of each group. Grades 4-9 are supported by FTE certificated teachers and, if the
demographics of the group warrant, one or more FTE educational assistant. The student-teacher ratio is at 15.7:1 (if one includes assistants:
9.5:1). Our staff consists of a FTE teaching staff of 13.5, 10.0 FTE educational assistants, 1.5 FTE administrators, 1 FTE Director of
Student Services (registered psychologist), and 3 FTE administrative assistants.

                                                             Issues & Trends

* Our Population
Our population is diverse and challenging. We support students with mild/moderate and severe needs, gifted/talented and gifted disabled,
ELL, and Program Unit Funding (PUF) children as well as ‘average’ students. Some of our students are hindered by emotional, social, and/
or behavioural issues. During the 2017-2018 academic year, 16% of our student population had mild/moderate codes, 4.2% gifted/talented
codes, 0.5% gifted/disabled codes, 2.4% severe disability codes, and 8.5% were ELL. 90% of our children/students were coded or
required extra supports. 100% of our population has IPPs. When our population is compared with Alberta’s student population, it is clear
that we have a larger percentage of students with needs than would be expected in a typical Alberta classroom. Specific information on this
comparison can be found in APPENDIX A. CAPE provides a safe, caring, and supportive learning environment for each learner. The
learning environment is purposely designed to support student engagement, the pursuit of personal best, capacity, and citizenship. School
staff is understanding, accepting, and responsive to the distinct characteristics and needs of each student. Each child and student has an IPP
developed with input from the students, parents, and teachers, through goal setting meetings. Educational assistants, administration,
Director of Student Services, and external services are included when applicable. In addition, the IPP is data-driven and based on
assessments. More information about our student population and their needs can be found in APPENDIX A.

                                                              6 of 63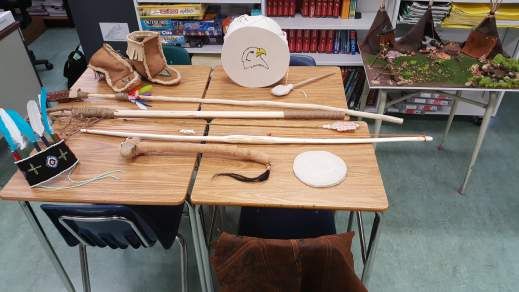
* Low Retention Rate
CAPE’s retention rate has historically been quite low. Every year, some of our students transition to other programs for a number of reasons:
moving into high school, feeling ready for larger class sizes, wishing to access extracurricular activities or other specialized programs, or wanting
to be with friends. This transition out is also influenced by transportation constraints. If parents can drive, students attend. If parents cannot drive
or find a suitable transportation arrangement, then students transition. This is especially true when economic downturns force parents into various
work schedules. As of September 30, 2017, 22% (47) of our student body was new to CAPE, a slight decrease from the previous year. Obviously
kindergarten children are new to us. Other students enter our grades 1-9 program. Our program seems to be attracting students through word of
mouth and referrals from parents and friends, other schools, and health professionals. This has historically presented CAPE with a great challenge;
to financially and academically support not only our returning population but also a large number of ‘new’ students that come to us behind grade
level and/or with challenges. Of those students new to CAPE for the 2017-2018 academic year 26% were 1 year below grade level and 22% were
2 years below grade level in Literacy while 26% were 1 year below grade level, 13% were 2 years below grade level , 9% were 3 years below
grade level, and 4% were 4 years below grade level in Numeracy. CAPE has responded by developing a strong research-based, data-driven
assessment program, the provision of educational assistants, wrap-around services and external supports (at additional costs), as well as targeted
programs such as the I.S.E.E. (Integrated Setting for Enrichment Education) Program. The staff has routinely engaged in professional development
initiatives so that they may better meet the ever-changing needs of the students. The administration has utilized all available internal and external
services to provide the students with the needed academic, social, psychological, and emotional support. The Board of Directors has provided
financial support for all such efforts. This has been a costly endeavour; one that places severe strain on CAPE’s budget.

* Results
CAPE’s Annual Education Results Reports have constantly indicated very strong stakeholder satisfaction with the program, student supports,
governance, and administration as evidenced by our Accountability Pillar and School Survey results. Our High School Completion cumulative
data irrefutably indicates that our students are equipped with the knowledge, skills, and attitudes to not only complete high school, but enter the
work force, engage socially, and contribute to society (November 2018 data indicate that 90.7% completed high school in 3 years and an
additional 5.9% in 4 years). The CAPE 2018 Provincial Achievement Tests grade 6 scores were very good. 100% of the grade 6 students that
wrote were in the acceptable standard in all of the tests. 31.8% of the students that wrote were in the Standard of Excellence in Language, 22.7% in
Mathematics, 87.5% in Science and 75% in Social Studies. Of the grade 9 students that wrote 100% were in the acceptable standard in Language,
science and social studies while 87.5% (1 student) were in the acceptable standard in mathematics. 12.5% of the students that wrote were in the
Standard of Excellence in Language, 25% in Mathematics, 60% in Science and Social Studies. Therefore, only one of the scores was below
acceptable standard.

* Low Student-Adult Ratio
CAPE’s low student/teacher ratio, the high number of educational assistants, and the full-day, every-day kindergarten program continue to impose
significant constraints on CAPE’s financial stability. The Board of Directors is fully and painfully aware of this, but continues to support the
program because of (1) the fundamental belief that every child and student deserves and needs a personalized program so as to achieve one’s
personal and academic goals and (2) because research indicates that students are better prepared for learning and grade 1 when engaged in a full-
day, every-day kindergarten. (September 30, 2017 Student-teacher ratio: 15.7:1, if educational assistants are included: 9.5:1)

                                                                       7 of 63
Accountability Pillar Overall Summary
Annual Education Results Reports - Oct 2018
School: 6005 Centre for Academic and Personal Excellence
                                                                                                                      CAPE                                    Alberta                                               Measure Evaluation
               Measure Category                                          Measure
                                                                                                       Current      Prev Year Prev 3 Year       Current     Prev Year Prev 3 Year
                                                                                                                                                                                            Achievement                Improvement                   Overall
                                                                                                        Result        Result    Average          Result       Result    Average

Safe and Caring Schools                             Safe and Caring                                       90.9         88.1         90.1          89.0         89.5          89.4             Very High                  Maintained                 Excellent

                                                    Program of Studies                                    74.5         78.5         81.1          81.8         81.9          81.7            Intermediate                 Declined                    Issue

                                                    Education Quality                                     92.4         92.3         94.3          90.0         90.1          89.9             Very High                  Maintained                 Excellent
Student Learning Opportunities
                                                    Drop Out Rate                                          *             *             n/a         2.3          3.0          3.3                   *                          *                          *

                                                    High School Completion Rate (3 yr)                    n/a           n/a            n/a        78.0         78.0          77.0                 n/a                        n/a                       n/a

                                                    PAT: Acceptable                                       91.8         64.1         67.3          73.6         73.4          73.3             Very High            Improved Significantly           Excellent
Student Learning Achievement (Grades K-9)
                                                    PAT: Excellence                                       42.7         12.0         13.2          19.9         19.5          19.2             Very High            Improved Significantly           Excellent

                                                    Diploma: Acceptable                                   n/a           n/a            n/a        83.7         83.0          83.0                 n/a                        n/a                       n/a

                                                    Diploma: Excellence                                   n/a           n/a            n/a        24.2         22.2          21.7                 n/a                        n/a                       n/a
Student Learning Achievement (Grades 10-12)
                                                    Diploma Exam Participation Rate (4+ Exams)            n/a           n/a            n/a        55.7         54.9          54.7                 n/a                        n/a                       n/a

                                                    Rutherford Scholarship Eligibility Rate               n/a           n/a            n/a        63.4         62.3          61.5                 n/a                        n/a                       n/a

                                                    Transition Rate (6 yr)                                n/a           n/a            n/a        58.7         57.9          59.0                 n/a                        n/a                       n/a
Preparation for Lifelong Learning, World of Work,
                                                    Work Preparation                                      86.4         92.8         94.2          82.4         82.7          82.4             Very High                   Declined                    Good
Citizenship
                                                    Citizenship                                           85.5         83.8         87.3          83.0         83.7          83.7             Very High                  Maintained                 Excellent

Parental Involvement                                Parental Involvement                                  90.5         97.2         94.6          81.2         81.2          81.0             Very High                  Maintained                 Excellent

Continuous Improvement                              School Improvement                                    80.1         82.5         86.6          80.3         81.4          80.7                High                     Declined                 Acceptable

Notes:
1. Data values have been suppressed where the number of respondents/students is fewer than 6. Suppression is marked with an asterisk (*).
2. Overall evaluations can only be calculated if both improvement and achievement evaluations are available.
3. Results for the ACOL measures are available in the detailed report: see "ACOL Measures" in the Table of Contents.
4. Student participation in the survey was impacted between 2014 and 2017 due to the number of students responding through the OurSCHOOL/TTFM (Tell Them From Me) survey tool.
5. Aggregated PAT results are based upon a weighted average of percent meeting standards (Acceptable, Excellence). The weights are the number of students enrolled in each course. Courses included: English Language Arts (Grades 6, 9, 9 KAE), Français
   (Grades 6, 9), French Language Arts (Grades 6, 9), Mathematics (6, 9, 9 KAE), Science (Grades 6, 9, 9 KAE), Social Studies (Grades 6, 9, 9 KAE).
6. Participation in Provincial Achievement Tests was impacted by the fires in May to June 2016. Caution should be used when interpreting trends over time for the province and those school authorities affected by this event.
7. Aggregated Diploma results are a weighted average of percent meeting standards (Acceptable, Excellence) on Diploma Examinations. The weights are the number of students writing the Diploma Examination for each course. Courses included: English
   Language Arts 30-1, English Language Arts 30-2, French Language Arts 30-1, Français 30-1, Mathematics 30-1, Mathematics 30-2, Chemistry 30, Physics 30, Biology 30, Science 30, Social Studies 30-1, Social Studies 30-2.
8. Caution should be used when interpreting evaluations and results over time for Mathematics 30-1/30-2, as equating was not in place until the 2016/17 school year. Alberta Education does not comment on province wide trends until it has five years of equated
   examination data.
9. Participation in Diploma Examinations was impacted by the fires in May to June 2016. Caution should be used when interpreting trends over time for the province and those school authorities affected by this event.
10.Weighting of school-awarded marks in diploma courses increased from 50% to 70% in the 2015/2016 school year. Caution should be used when interpreting trends over time.
11.Due to the change from previous data source systems to Provincial Approach to Student Information (PASI), Rutherford Scholarship Eligibility Rate results prior to 2015 are not available.
12.2016 results for the 3-year High School Completion and Diploma Examination Participation Rates have been adjusted to reflect the correction of the Grade 10 cohort.

Report Generated: Sep 26, 2018                                                                                                8 of 63                                                                                                   Report Version 1.0
Locked with Suppression for Oct 2018                                                                                                                                                                                       Data Current as of Aug 24, 2018
                                                                                                                                   2
Program Review 2017-2018 & Future Plans

                                          student-centred integrated, personalized program supported by engaged staff, parents and community
                                                                                ‘a community of learners’

     Area               Program                                 Evidence of Success 2017-2018                                                     Moving Forward in 2018-2019

Students    Kindergarten Readiness to Learn    96.2% of children in K ready for grade 1 as determined by         After a year of intense research and planning, CAPE implemented daily literacy and numeracy blocks
                                                                                                                 in the 2017-2018 academic year to teach focused skills to homogenous groups of learners. Our
                                               the teacher. (Determination of readiness is based on
                                                                                                                 defined literacy program combines reading and comprehending with writing and representing.
                                               successful completion of the kindergarten program as              Students investigate the four purposes of writing; read samples, discuss and work to model their own
                                               described in the Kindergarten Program Statement.)                 writing from the examples. Numeracy blocks blend basic math skills that require daily practice with
                                                                                                                 focused math work that can be applied to real world contexts. Cross referencing the data from
                                                                                                                 standardized tests, with input and observations from teachers, the students were divided into fairly
                                                                                                                 homogenous groups. These groups are therefore not grade level assigned, but are current skill level
            Literacy and Numeracy 1-9          •46.6% of grades 1-9 students showing higher than typical         assigned. Skill grouping means that it is possible for students in grade 4 and grade 8 to be working on
                                               growth (66th -99th SGP) on the STAR MATH.                         the same concepts. These literacy and numeracy programs are school-wide and are supported by the
                                                                                                                 timetable. Assignment of responsibilities to teachers is done according to teacher strengths and areas
                                               •52.3% of grades 1-9 students showing higher than typical         of expertise. Once a student meets the skills in one group, the student is advanced to another. At a
                                               growth (66th -99th SGP) on the STAR READING.                      minimum, students are reassessed 3 times a year with standardized assessments. With each report
                                                                                                                 card, parents will know if their child is working below, at or above grade expectations and if the
                                               •85.7% of grades 1-9 students that were below benchmark           growth demonstrated is limited, expected, or above expectations in both literacy and numeracy. As
                                               (below grade level) at the beginning of the year but moved        such, we are focused on student growth and demonstration of competencies.Literacy and numeracy is
                                               closer to being at benchmark (at grade level) by the end of       the responsibility of all teachers and educational assistants. Even though it is the responsibility of the
                                                                                                                 teachers to design, implement, and assess literacy and numeracy programming, they are supported by
                                               the year on the STAR MATH.                                        educational assistants, the administration, the Director of Student Services and the Superintendent.
                                               •75.7% of grades 1-9 students that were below benchmark           Our literacy and numeracy team of four was tiered so that it was very clear who was overseeing each
                                                                                                                 tier of student intervention. Tier 1, overseen by the principal and one teacher with a background in
                                               (below grade level) at the beginning of the year but moved
                                                                                                                 assessment, focuses on strategies for all. This means promoting strategies that can be used in all
                                               closer to being at benchmark (at grade level) by the end of       classrooms, by all teachers, for all learners. Tier 2, overseen by the principal, the Director of Student
                                               the year on the STAR READING.                                     Services, and the Literacy Support Educational Assistant, focuses on targeted strategies for small
                                                                                                                 groups and for students who are not demonstrating expected growth. Tier three, overseen by the
                                               •74.8% of students in grades 4-9 who achieve the CAPE             Director of Student Services and the Literacy Support Educational Assistant, designs and delivers
                                               acceptable standard (cut score of 65%) in the core subjects       targeted 1-1 or 1-2 interventions and frequent assessments for students who are far below expectations
                                               final exam marks.                                                 and not showing growth. Groupings are fluid. Students are assessed both by teachers and by
                                                                                                                 standardized measures. Graded benchmarks were created and provided to teachers to track student
                                               •44.6% of students in grades 4-9 who achieve the CAPE             growth by demonstration of skills. The groups, being fluid, allow for students to grow at their own
                                               standard of excellence (cut score of 80%) in the core             pace. In 2018-2019, we have made changes based on the learning from last year. We designated a
                                               subjects final exam marks.                                        literary purpose for each term; narrative, informative and persuasive. Likewise, numeracy strands
                                                                                                                 were also assigned a term focus. This allowed students to move more fluidly between groups.
                                               •88.3% of students in grades 4-9 who achieve the CAPE             Kindergarten students are now required to spend the first term within the kindergarten literacy level to
                                               acceptable standard (cut score of 65%) in the core subjects       develop printing skills. On-line assessments are done every six weeks and recorded. Data entry and
                                               year-end marks.                                                   analysis was delegated to a literacy lead teacher and and educational assistant. All educational
                                                                                                                 assistants were trained in fluency and specific assistants have been trained with dialogic reading.
                                               •43.7% of students in grades 4-9 who achieve the CAPE             Research about literacy and numeracy will be included more at workshops, along with benchmarking
                                               standard of excellence (cut score of 80%) in the core             practice and reviewing student work.
                                               subjects year-end marks.

            One-on-One Computing               71.8% of students in grades 4-9 who receive 80% or higher         This program, which began in 1994 for the grades 6 to 9 students, was expanded to
                                                                                                                 include the grades 4 and 5 students. CAPE is now using iPads for all grade 4-9 students.
                                               on the technology final year mark.                                All classrooms have Apple TVs or SmartBoards. The Board has been working with
                                                                                                                 Apple and CSI on a lease program that is affordable and that replaces our ‘near defunct’
                                                                                                                 technology with current devices. Students from K-9 and their parents use the websites
                                                                                                                 to retrieve information. School does not stop when the dismissal bell rings!

                                                                                    9 of 63
Area               Program                                Evidence of Success 2017-2018                                                      Moving Forward in 2018-2019

Students   Integrated, Personalized Program   •94.6% of the grade 4-9 students and 85.5% of parents are satisfied       Continued
                                              that their academic knowledge and performance has improved.
                                              •9.4% of the grade 4-9 students and 94.4% of parents are satisfied
                                              with the effectiveness of programs at CAPE.                               Students are an integral part of the Individual Program Plan development.
                                              •92.9% of the grade 4-9 students and 95.7% of parents are satisfied       Students are requested to be present for goal setting meetings and update
                                              with the CAPE Integration Program.                                        meetings.
                                              •91.7% of the grade 4-9 students and 81.5% of parents are satisfied
                                              or very satisfied with the CAPE Personalization Program.
                                              •82.8% of the grade 4-9 students and 86.8% of parents are satisfied       Student voice has led to the re-instatement of integrated projects during the
                                              or very satisfied that they are receiving instruction targeted to their   Friday morning time in September 2017 academic year. These projects
                                              specific needs.                                                           proved were successful and are therefore continuing to be offered in
                                                                                                                        2018-2019 year. These projects integrate a number of subject areas, reach
                                                                                                                        into the community, address academic and personal areas and provide
                                                                                                                        student choice in learning.

           Integration Projects               • Friday absenteeism had decreased significantly.                         Integration via projects was an integral part of the CAPE Program in the early years. All
                                                                                                                        elective subjects were integrated in the afternoon time. Some projects were one week in
                                              • Slight increase in satisfaction with a broad program of                 length while some were as many as 4 weeks in length. Each project focused on one
                                                studies.                                                                main curriculum area and integrated many other areas of studies. September 2006 saw
                                                                                                                        the Integration of subject pairs, Language/social and math/science while September
                                                                                                                        2009 brought about Total Integration as Humanities and Sciences. Students clearly told
                                                                                                                        us that they missed the projects. As a result, Friday projects were re-introduced in
                                                                                                                        September 2017. Once again projects visibly provide students with choice in education,
                                                                                                                        combines skills from a number of areas, and allows students to work with others from
                                                                                                                        different grades. Examples of projects include Agriculture (This project allows students
                                                                                                                        to have a hands-on experience with gardening and making a sustainable food source),
                                                                                                                        Community Leadership (What does it take to be a good leader? In this project, students
                                                                                                                        learn how to develop a cooperative team to address an area of need in the community),
                                                                                                                        First Nations Appreciation (This project allows students to learn about the rich heritage
                                                                                                                        and structures of First Nations cultures in history and now. Art, music, dance and
                                                                                                                        storytelling are all key parts of this study) and STEM (This project challenges students
                                                                                                                        each week to meet a design task that uses science, technology, engineering, and math).
                                                                                                                        Projects continue in 2018-2019.

           Student Engagement                 87% of parents are satisfied or very satisfied that their                 Continued, but integrated into the program.
                                              student’s level of academic/intellectual engagement has
                                              increased over the course of the year, 89.6% feel the same                Data from the annual satisfaction student, parent, and teachers surveys are
                                              about social/behavioural/participatory engagement, and                    still collected and analyzed.
                                              87.8% about emotional engagement.
                                              95% of those parents that believe that their child’s level of
                                              engagement has increased, are satisfied or very satisfied that
                                              this greater engagement has resulted in greater
                                              achievement.

           Second Languages                   90.8% of parents and 92.9% of students are satisfied or very              The second language program has been suspended until such time as a
                                              satisfied with the CAPE Culture-Based Second Language                     competent fluent certificated teacher with solid knowledge of the culture(s )
                                              Program overall.                                                          can be secured.

                                                                                       10 of 63
Area Program Evidence of Success 2017-2018 Moving Forward in 2018-2019
Parents Intake Interviews 100% of parents that participated in intake interviews. During the 2018-2019 academic year parents of K-9 students have again
been invited to participate in Intake Interviews with their child’s teacher.
This time provides an opportunity for parents to get to know the teachers
and support staff, the school program, the purpose and usage of the class
websites and planners, and to ask questions and provide input about their
child. Most importantly, it supports the development of relationships
between teachers and parents.
Goal Setting Meetings 83.4% of parents that participated in goal setting meeting. These student-parent-teacher meetings are held in September. Parents,
teachers, and students collaborate in the development and updating of the
students’ Individual Program Plans (IPP) by completing a learning profile
for the student, identifying students’ personal and/or academic goals, areas
of concern and the impact to the student, goals, and strategies to support the
student.
Parent-Student-Teacher 97.9% of parents participated in at least one conference. These goal setting meetings are followed by Student-Parent-Teacher
Conferences conferences in November and March and, again in June. The November and
March meetings are term meetings and serve as a means of monitoring the
students’ progress and update IPPs. The June meeting reviews the year’s
progress and sets the direction for the following year; a transitional meeting.
Parent Engagement 71% of parents were involved in activities in support of the Four years ago, the large percentage of parents stated not knowing about the
school. components of CAPE’s program such as the I.S.E.E. or Second Language or
June 2018 Survey results: integration or personalization on CAPE’s annual surveys. This was
•90.14% of parents reported being aware of available on alarming. Class websites or blogs were introduced four years ago in an
line information. effort to capitalize on the widespread use of technology to increase parental
•0% reported accessing on line information. awareness of and knowledge about CAPE’s program. The hope was that
•76.67% reported that the information was of value to them. with knowledge, came engagement. The data are encouraging as they
•25.4% reported that their use of on line information has indicate a slow but steady increase in the use of the sites and an increase in
increased. engagement.
•65.52% reported being better informed about their
student’s work. CAPE has engaged in a complete re-working of its website so that it will be
78.95% reported being better informed about what is accessible from multiple devises, easier to navigate and more reliable.
happening within the school. CAPE has also entered into a contractual agreement with CSI to replace all
63.16% repotted being a more engaged parent. iPads for grade 4 through 9 students with the latest ones. This should
This increase in use of the on line resource seem to have increase access to information and improve efficiency. These two initiatives
caused an increase in familiarity with our integration and may have an impact on students’ and parents’ use of the on line information
personalization programs as well as components of them; an and the technology which may in turn affect knowledge of CAPE’s
average of 7.76% of parents report not knowing enough program, in addition to the every day happenings within the school.
about CAPE’s programs to be satisfied or dissatisfied with Therefore, data will continue to be collected during the 2018-2019 academic
one or more than one component of the CAPE Program. year .
11 of 63Area Program Evidence of Success 2017-2018 Moving Forward in 2018-2019
Instructional Collaborative planning regarding Ten (10) Collaborative planning were scheduled. Collaborative Planning meetings are scheduled to take place once a month.
Staff the integrated, personalized This is continuing because the collective problem solving abilities of the
program. group has proven effective in meeting the needs of students more quickly
than referring to services or trying strategies that may not be required.
Administration will continue to meet every 2-3 weeks to discuss targeted
students and the progress they are making with implemented supports.
Professional Learning CAPE has been engaged in Action Research for many years. CAPE continues to be involved in Action Research as a tool to foster
Each year brings a unique group in each of the classes. As a professional development that not only promotes more effective and efficient
result the strengths and needs of each group changes year to teaching but, most importantly, results in greater student engagement and
year. In response to each particular group’s needs, teachers achievement. Dr. David Townsend has kindly offered sessions at our school
develops research-based Action Research studies. The goal at the beginning of our Action Research efforts. We have also partnered with
is to increase student learning by effectively addressing the Dr. Sharon Allen, formerly of the Medicine Hat College and, through her,
needs of a group or the entire class. Some of these Action with the University of Lethbridge. She has worked with our certificated staff
Research efforts can be found on our website. In addition, in developing Action Research projects. Dr. Lannie Kanevsky, Simon Frasier
the staff takes advantage of every opportunity to engage in University, has kindly worked with us on gifted education. TAAPCS
on-site professional learning. Leadership Learning sessions have provided our administration team with
valuable insights and an opportunity to grow as educators and leaders. Our
financial resources are extremely limited. We therefore get creative in our
professional development endeavours.
STEM
Mythology
Science-History-Art Integration
12 of 63Area Program Evidence of Success 2017-2018 Moving Forward in 2018-2019
Community Sustained focus on student About 140 community organizations and individuals were This program is an integral part of our community (of learners) and will
involvement with community actively involved in support of the academic program at continue.
agencies and individuals aims to CAPE. Here is a short list of some f those involved:
develop a sense of social justice
and social responsibility, citizenry, APARC
acceptance and respect for Big Brothers Big Sisters
diversity, awareness of community Clarion Hotel
needs, altruism and volunteerism, City of Medicine Hat
and provide students with role Safety City
models and environments within Chinook Greenhouses
which students can experience Strolling Acres Greenhouse
success, and much more. Echo Dale Farm
Skyview Growers
Icy Mountain Water
Meadowlands Retirement Facility
Riverview Care Centre (retirement facility)
Medicine Hat College
Medicine Hat Exhibition & Stampede
Medicine Hat Mavericks
Medicine Hat Tigers
Medicine Hat and Redcliff Public Libraries
Medicine Hat School of Performing Arts
Medicine Hat Police Service
Teoda Lodge
Esplanade Arts & Heritage Centre
St. John’s Church
Panorama Bowling Lanes
Paradise Valley Par 3
Petland
Medicine Hat & District Food Bank
Medicine Hat Interpretive Centre
Medicine Hat Regional Hospital
Medicine Hat Fire Department
Medalta Potteries
Windmill Garden Centre & Butterfly House
Calgary Zoo
Telus Spark Science Centre
Cypress Hills Provincial Park
Drew Barns
Dr. V.L. Di Ninno (consultant)
13 of 63Publications 2017-2018:
1. Di Ninno, T. “Effective Stakeholder Engagement within a Small Rural Charter School”, The CASS CONNECTION Spring 2018
2. Di Ninno, T & J. Gordon. “Community Connections”. CASSA Leaders & Learners, Winter 2017-20183.
Presentations 2017-2018:
J. Gordon. “CAPE’s Personalized Program: Every Student Matters”, CASSA Conference, July 2018
National Student Achievements 2017-2018:
1. Omnia Rajab “Stem Cells” Young Citizens National On-Line Competition, Spring 2018
Partnership with the Medicine Hat College 2017-2018:
1. Two (2) student teachers from Medicine Hat College (fall and spring semesters)
2. Presentations to education students from Medicine Hat College in the spring
3. Two (2) volunteers from the Social Work program at the MHC
Practica 2017-2018
1. Practicum student, from the Child & Youth Care Counsellor program at Medicine Hat College. Michaela from January through April 2018.
2. A Master of Counselling Psychology student from Athabasca University from September 2017 – April 2018, ran both individual and group counselling
sessions.
14 of 63CAPE PUBLIC CHARTER SCHOOL ANNUAL EDUCATION RESULTS REPORT 2017-2018
Key Messages:
• CAPE school continues to support student success through our personalized, integrated program.
• CAPE’s targets remain very high, as in the past (very high expectations).
• CAPE continues to meet a significant percentage of its targets; 86.8% ( 33/38) of our charter goals targets and 50% of the provincial goals targets were met. The
results for the targets not met were within 9% of the targets. The low number of participants does affect the final satisfaction rate and ultimately whether or not the
targets are met.
• CAPE’s academic achievement data show that our students are learning and are achieving their personal and academic goals.
• There has been a significant increase in the number of students achieving outcomes in literacy and numeracy and therefore either moving closer to grade level or
reaching grade level.
• There has been an increase in student engagement.
• CAPE’s stakeholder satisfaction with the CAPE Program continues to be very high, as in the past.
• 49.3% of CAPE parent completed our annual satisfaction survey.CAPE’s rate of student, Board, and teacher survey returns continues to be very high.
• CAPE’s rate of student, Board, and teacher survey returns continues to be very high.
• Staff professional development supports student learning and achievement.
• School based Action Research initiatives continue to support student learning and achievement.
• Partnerships with post-secondary institutions are becoming stronger.
• Sharing of information about our program has increased via provincial and national publications and presentation at one national conference.
• Parent engagement with the school and their student’s learning and achievement is increasing.
• CAPE’s collaboration with stakeholders and community continues to strengthen.
• CAPE continues to operate in a fiscally responsible manner.
• Our students continue to do very well once they leave CAPE, as clearly demonstrated by our High School Completion Rate.
Regional Heritage Fair
15 of 63CHARTER SCHOOL GOALS
Combined Report & Plan
CAPE Charter School Goal 1: CAPE School is focused on achieving academic excellence.
Outcome 1: Student learning is improved so that students are working at their own personal best.
Education Report 2017-2018 Education Plan 2018-2021
Performance Measures: Data Source Actual Actual Actual Actual Actual Target Target Target Target
2013-14 2014-15 2015-16 2016-17 2017-18 2017-18 2018-19 2019-20 2020-21
1.1.1 Percentage of children in K ready Formative 94.5% 94.4% 95.65% 100% 96.2% 93% REMOVED
for grade 1 as determined by the Teacher
teacher. (Determination of readiness is Assessment TARGET
based on successful completion of the MET
kindergarten program as described in
the Kindergarten Program Statement.)
1.1.1 NEW 2018-2019 Percentage of Standardized Star Early Literacy Baseline (2017-2018): 85% 87% 89% 91%
Kindergarten children whose literacy Tests
skills are such as to make them ready
for grade 1 as determined via
1) Star Early Literacy (reading Easy CBM Baseline (2017-2018): 56% 60% 65% 70%
comprehension) and
2) Easy CBM (reading fluency).
1.1.2 Percentage of K children that Teacher 91.5% 72% 94% 89.3% 100% 78% REMOVED
show increased academic engagement Checklist
over the course of the year as TARGET
determined by the teacher. MET
1.1.3 Percentage of students in grades Formative 92.9% 96.2% 92.3% 86.7% 94.4% 85% REMOVED
1-3 ready for the next grade as Teacher
determined by the teachers. Assessment TARGET
(Determination of readiness is based MET
on successful completion of the
program as described in the Guiding
Principles for the primary grades.)
1.1.2 NEW 2018-2019 Percentage of Standardized Star Math Baseline (2017-2018): 66% 70% 75% 80%
grades 1 - 3 students whose numeracy Tests
skills are such as to make them ready
for the next grade as determined via
Star Math.
1.1.3 NEW 2018-2019 Percentage of Standardized Star Reading Baseline (2017-2018): 68% 70% 74% 78%
grades 1 - 3 students whose literacy Tests
skills are such as to make them ready
for the next grade as determined via Easy CBM Baseline (2017-2018): 46% 50% 55% 60%
1) Star Reading (reading
comprehension), San Diego Baseline (2017-2018): 72% 75% 80% 85%
2) Easy CBM (reading fluency), and
3) San Diego (Independent reading
level).
16 of 63CAPE Charter School Goal 1: CAPE School is focused on achieving academic excellence.
Outcome 1: Student learning is improved so that students are working at their own personal best (con’t).
Education Report 2017-2018 Education Plan 2018-2021
Performance Measures: Data Source Actual Actual Actual Actual Actual Target Target Target Target
2013-14 2014-15 2015-16 2016-17 2017-18 2017-18 2018-19 2019-20 2020-21
1.1.4 Percentage of grades 1-3 Teacher 88.9% 55.4% 76.5% 97.3% 100% 63% 70% 75% 80%
students that show increased Checklist
academic engagement over the
TARGET
course of the year as
determined by the teacher. MET
1.1.5 Percentage of grades 1-9 Standardized 57.7% 44.2% 66.7% 85.9% 77.6% 48% 60% 65% 70%
students with typical or higher Tests
growth/(35+ SGP) on the
TARGET
STAR MATH.
MET
1.1.6 Percentage of grades 1-9 Standardized N/A N/A 62% 84.9% 78.5% 48% 60% 65% 70%
students with typical or higher Tests
growth/(35+ SGP) on the
TARGET
STAR READING.
MET
Having Fun at the Spring Fling
Chelsia & the Butterfly; Butterfly House
17 of 63CAPE Charter School Goal 1: CAPE School is focused on achieving academic excellence.
Outcome 1: Student learning is improved so that students are working at their own personal best (cont’d).
Education Report 2017-2018 Education Plan 2018-2021
Performance Measures: Data Source Actual Actual Actual Actual Actual Target Target Target Target
2013-14 2014-15 2015-16 2016-17 2017-18 2017-18 2018-19 2019-20 2020-21
1.1.7 Percentage of grades 1-9 Standardized N/A 52% 55% 52% 85.7% 54% 56% 58% 60%
students that were below Tests
benchmark (below grade
level) at the beginning of the
year but moved closer to TARGET
being at benchmark (at grade MET
level) by the end of the year
on the STAR MATH.
1.1.8 Percentage of grades 1-9 Standardized N/A N/A 59% 44% 75.7% 50% 54% 56% 58%
students that were below Tests
benchmark (below grade
TARGET
level) at the beginning of the
year but moved closer to MET
being at benchmark (at grade
level) by the end of the year
on the STAR READING.
1.1.9 Percentage of grades 1-9 Standardized N/A 44% 58% 76% 70.7% 50% 54% 56% 58%
students that are at benchmark Tests
(at grade level) at the end of
TARGET
the year on the STAR MATH.
MET
1.1.10 Percentage of grades Standardized N/A N/A 54% 73% 76.7% 52% 56% 58% 60%
1-9 students that are at Tests
benchmark (at grade level) at
TARGET
the end of the year on the
STAR READING. MET
18 of 63CAPE Charter School Goal 1: CAPE School is focused on achieving academic excellence.
Outcome 1: Student learning is improved so that students are working at their own personal best (cont’d).
Education Report 2017-2018 Education Plan 2018-2021
Performance Measures: Data Source Actual Actual Actual Actual Actual Target Target Target Target
2013-14 2014-15 2015-16 2016-17 2017-18 2017-18 2018-19 2019-20 2020-21
1.1.11 Percentage of Formative 90% 88.3% 81.6% 80% 88.3% 82% 85% 87% 89%
Teacher
students in grades 4-9 who Assessment
achieve the CAPE TARGET
acceptable standard (cut MET
score of 65%) in the core
subjects year-end marks.
1.1.12 Percentage of Formative 30.3% 26.6% 40.8% 39.4% 43.7% 42% 44% 46% 48%
Teacher
students in grades 4-9 who Assessment
achieve the CAPE standard TARGET
of excellence (cut score of MET
80%) in the core subjects
year-end marks.
1.1.13 Percentage of Summative 66.5% 75.6% 79.8% 73.5% 74.8% 77% 77% 80% 85%
Teacher
students in grades 4-9 who Assessment
achieve the CAPE TARGET
acceptable standard (cut NOT
score of 65%) in the core MET
subjects final exam marks.
1.1.14 Percentage of Summative 30.4% 43.7% 40.3% 36.2% 44.6% 42% 45% 50% 55%
Teacher
students in grades 4-9 who Assessment
achieve the CAPE standard TARGET
of excellence (cut score of MET
80%) in the core subjects
final exam marks.
19 of 63CAPE Charter School Goal 1: CAPE School is focused on achieving academic excellence.
Outcome 1: Student learning is improved so that students are working at their own personal best (cont’d).
Education Report 2017-2018 Education Plan 2018-2021
Performance Measures: Data Source Actual Actual Actual Actual Actual Target Target Target Target
2013-14 2014-15 2015-16 2016-17 2017-18 2017-18 2018-19 2019-20 2020-21
1.1.15 Percentage of School 71.9% 68.6% 58% 66.1% 77.7% 67% 78% 80% 85%
Survey
students in grades 4-9 that
show increased academic TARGET
engagement over the course MET
of the year as determined
by the teacher.
1.1.16 Percentage of School 96.8% 96.3% 96% 95.6% 92.9% 95% 95% 96% 97%
Survey
parents who are satisfied
with the quality of their TARGET
children’s education at NOT
CAPE. MET
1.1.17 Percentage of School 93.6% 88.8% 92.1% 88% 86.8% 89% 89% 91% 93%
Survey
parents that are satisfied
that their student is TARGET
receiving instruction NOT
targeted to their individual MET
needs.
1.1.18 Percentage of grades School 93.3% 89.6% 77.4% 87.5% 91.6% 84% 85% 86% 87%
Survey
4-9 students that are
satisfied that their academic TARGET
knowledge and MET
performance has improved
at CAPE.
20 of 63CAPE Charter School Goal 1: CAPE School is focused on achieving academic excellence.
Outcome 1: Student learning is improved so that students are working at their own personal best (cont’d).
Education Report 2017-2018 Education Plan 2018-2021
Performance Measures: Data Source Actual Actual Actual Actual Actual Target Target Target Target
2013-14 2014-15 2015-16 2016-17 2017-18 2017-18 2018-19 2019-20 2020-21
1.1.19 Percentage of Board, School 71.9% 87.0% 82.8% 88.5% 85% 85% 85% 87% 88%
Surveys
parents, and teachers
satisfied that services and TARGET
support for students such as MET
academic support,
counselling, and referrals
are easy to access and
timely at CAPE.
1.1.20 Percentage of School 96.8% 87% 82.1% 80.9% 83.9% 83% 83% 85% 88%
Survey
students in grades 4-9
satisfied that services and TARGET
support for students, such MET
as academic support,
counselling, and referrals,
are easy to access and
timely at CAPE.
• Of those students new to CAPE for the 2017-2018 academic year, 26% were 1 year below grade level and 22% were 2 years below grade level in Literacy while 26% were 1 year below grade level, 13% were 2 years below
grade level , 9% were 3 years below grade level, and 4% were 4 years below grade level in Numeracy. A number of our returning students also were below grade level in numeracy and literacy. However, 76% of grades 1-9
students that were below benchmark (below grade level) at the beginning of the year moved closer to being to grade level by the end of the year in literacy while and 86% moved closer to being at benchmark in numeracy. As
a result, 76% of our students are at grade level in numeracy and 77% in literacy at the end of the year. This is direct result of our revised numeracy and literacy program. Work continues as we endeavour to bring each
student to grade level.
• Kindergarten to grade 3 students have become more engaged learners and are ready for the next grade.
• 88.3% of students in grades 4-9 achieved the CAPE acceptable standard (cut score of 65%) and 43.7% achieved the CAPE standard of excellence (cut score of 80%) in the core subjects year-end marks (formative
assessment) while 74.8% of students in grades 4-9 achieved the CAPE acceptable standard (cut score of 65%) and 44.6% achieved the CAPE standard of excellence in the core subjects final exam marks (summative
assessment). These data are a strong indicator of the effectiveness of our program.
• 85% of Board, parents, teachers and student are satisfied that students receive the support they need, 93% of parents who are satisfied with the quality of their children’s education at CAPE, 87% of parents are satisfied that
their student is receiving instruction targeted to their individual needs, and 92% of grades 4-9 students that are satisfied that their academic knowledge and performance has improved at CAPE. These outstanding satisfaction
rates are strong indicators that stakeholders believe our program to be effective in preparing our students academically for future academic endeavours.
Strategies for Language Arts and Social Studies: (1) focus on writing as a process, (2) revised literacy program, (3) set literacy times subdivided by strand, (4) focus on vocabulary and specific terminology.
Strategies for Mathematics and Science: (1) re-focus on process (written and oral), test taking skills, comprehension, meaning and usage of symbols, and coping strategies, (2) revised numeracy program, (3) focus on
vocabulary and specific terminology.
PLEASE REFER TO PAGES 10-12.
21 of 63CAPE Charter School Goal 1: CAPE School is focused on achieving academic excellence.
Outcome 2: Student progress shows above average growth.
Education Report 2017-2018 Education Plan 2018-2021
Performance Measures: Data Actual Actual Actual Actual Actual Target Target Target Target
Source 2013-14 2014-15 2015-16 2016-17 2017-18 2017-18 2018-19 2019-20 2020-21
1.2.1 Percentage of grades 1-9 Standardized
Test
N/A N/A 40.2% 47.7% 46.6% 38% 45% 50% 55^
students showing higher than
typical growth (66th -99th
TARGET
SGP) on the STAR MATH.
MET
1.2.2 Percentage of grades 1-9 Standardized
Test
N/A N/A 35% 52.9% 52.3% 38% 45% 50% 55%
students showing higher than
typical growth (66th -99th
TARGET
SGP) on the STAR
READING. MET
1.2.3 Percentage of parents and School
Surveys
88% 87.6% 89.1% 88.4% 88% 89% 89% 91% 93%
students that believe that the
level of student engagement
TARGET
has increased and that this
engagement has resulted in NOT
greater achievement. MET
Demographic data clearly describes our population as diverse, challenging, and in need of supports. Overall, 90% of our students were coded or required extra supports, an increase over the
previous year.
Within this same population, about 46.6% are showing higher than typical growth (66th -99th SGP) on the STAR MATH and 52.3% in Star READING, and about 88% of our grade 4-8 students
and their parents believe that their level of student engagement has increased and that this engagement has resulted in greater achievement.
Strategies for Language Arts and Social Studies: (1)focus on writing as a process, (2) revised literacy program, (3) set literacy times subdivided by strand, (4) focus on vocabulary and specific
terminology.
Strategies for Mathematics and Science: (1) Re-focus on process (written and oral), test taking skills, comprehension, meaning and usage of symbols, and coping strategies.(2) Revised numeracy
program (3) focus on vocabulary and specific terminology.
After 1.5 years of program reviews, research, collaboration with our education manager, visits to other schools, and collaborative planning, CAPE implemented school-wide literacy and
numeracy programs in September 2017. It is expected that a minimum of three years are going to be required to begin to see the fruits of this effort. We also believe that these programs
will better support our challenging population as the students strive to acquire knowledge and skills preparation for high school, post secondary education, and the world of work.
PLEASE REFER TO PAGES 10-12.
• Staff continues to provide each student the required academic supports. In addition, staff is currently also working with individual students and small groups to support the development of
personal skills that will in turn promote higher academic achievement.
22 of 63HIGH SCHOOL COMPLETION
CAPE tracks its students as they move through high school and beyond. Of the students that attended
CAPE for two years or more, 62.9% have responded to our inquiries. The following data clearly
demonstrates the effectiveness of our program.
CAPE GRADUATION RATE CAPE STUDENTS POST HIGH SCHOOL
to November 2018 to November 2018
3.3%
5.9%
19.2%
27.3%
7.3%
16.2%
19.6%
90.8% 10.4%
Graduated in 3 Years
Graduated in 4 Years University
Did Not Graduate College
College and then University
Time Off or Worked then to College or University
Work
Unkown
23 of 63CAPE Charter School Goal 1: CAPE School is focused on achieving academic excellence.
Outcome 3: Students become well-rounded individuals with a broad knowledge base which they can apply in flexible contexts.
Education Report 2017-2018 Education Plan 2018-2021
Performance Measures: Data Source Actual Actual Actual Actual Actual Target Target Target Target
2013-14 2014-15 2015-16 2016-17 2017-18 2017-18 2018-19 2019-20 2020-21
1.3.1 Percentage of students in School 98.8% 94.4% 90.7% 89.6% 89.8% 88% 88% 90% 92%
grades 4-9, and their parents and Surveys
teachers satisfied that the students TARGET
have the skills to use information MET
technology to more effectively and
efficiently engage in task
completion, research, explore,
create, and generate opportunities
for learning.
1.3.2 Percentage of students in Formative 60.4% 46.8% 53.9% 60.2% 71.8% 50% REMOVED
grades 4-9 who receive 80% or Teacher TARGET
higher on the technology final year Assessment MET
mark.
1.3.3 Percentage of students in Teacher 72.3% 70.3% 63.8% 83.3% 94.2% 73% 78% 80% 85%
grades 4-9 that show increased Checklist
engagement in the Social/ TARGET
Behavioural/Participatory MET
Engagement over the course of the
year as determined by the teacher.
1.3.4. Percentage of Board, School 96.6% 98.2% 96% 95.1% 93.8% 95% 95% 97% 98%
teachers, parents, and students Surveys
satisfied that students are receiving TARGET
a solid grounding in language arts, NOT MET
mathematics, science, and social
studies at CAPE.
1.3.5 Percentage of Board, School 87.7% 82.5% 78.7% 84.4% 84.8% 82% 84% 86% 88%
teachers, parents, and students Surveys
satisfied with the opportunity for TARGET
students to receive a broad MET
program of studies, including fine
arts, career, technology, and health
and physical education.
24 of 63One of our historic issues is the low retention rate. In 2017-2018, 22% (i.e. about 46 students) of our population was new to CAPE. This also means that a significant
percentage of our parents are also new. Students seem to exit CAPE for three main reasons; family moves to other cities, transportation issues, and interest in specific
programs not offered at CAPE such as sports academies. In addition to this presenting significant financial and programming challenges, it also affects our school
satisfaction survey results since parents new to CAPE need time to become fully aware of our programs, our expectations, our assessment processes, and our discipline. For
example, school satisfaction survey results indicate a very high level of satisfaction with our core program and the quality of education received. The satisfaction rate drops
to 87% in the area of targeted instruction, and slightly lower about timeliness of supports. 49.3% of our parents (an increase of 7.5% over last year) and 97.1% of the 4-9
students (a decrease of 2.9% over last year) completed the annual school satisfaction survey. Our targets are very high and so meeting so many targets is another
indicator of the success of our program. PLEASE REFER TO PAGE 6.
The focus in September and October continues to be on assessments, teacher-parent-student conferences, IPP development, and program implementation. Each student is a
unique individual, with strengths and weaknesses that must be identified, and addressed collaboratively. While those students returning have a history that serves as a basis
from which to move forward, those new to us do not. They thus require added time and resources. Time is the one crucial factor in the development of the whole person, so
that students become well-rounded individuals with a broad knowledge base which they can apply in flexible contexts.
Strategies:
• Continued focus on personalized integrated programming.
• Continued focus on Student-Parent-Teacher Goal Setting Meetings
• Continued focus on teacher-parent-community partnership. PLEASE REFER TO PAGE 10-13.
• Continued use of classroom websites and blogs to inform parents.
Waterton Park Trip
Stack the Sleigh Christmas Drive in
Support of the Food Bank and
Women Shelter
25 of 63You can also read