Automobiles & Components - Sector - Team-BHP
←
→
Page content transcription
If your browser does not render page correctly, please read the page content below
Company Report
                                                        Automobiles & Components                                                                                                           NEUTRAL
                                                        Sector
                                                                                                                                                                                   June 24, 2019
                                                                                                                                                                                   THEME
                                                                                                                                                                                   BSE-30: 39,123

        Electric vehicles—question is when, not if? The automobile industry is at the cusp
        of a revolution with adoption of cleaner vehicles (electric and plug-in hybrid) over
        petrol/diesel vehicles. We believe while China, Europe and the US will be faster to
        adopt electric vehicles, the Indian market will also embrace these vehicles as battery
        costs come down. We expect 28% of automobiles (except commercial vehicles) in
        India to shift to EVs by FY2030 with scooters and three-wheelers adopting electric
        much faster than other segments.

        Scooters and three-wheelers will adopt electric faster than passenger cars

        We forecast 28% of automobiles (except commercial vehicles) will shift to electric and plug-in
        hybrid by FY2030. Scooters, three-wheelers and buses will likely shift faster to electric than
        other modes of transport. The key reasons for steady improvement in electric vehicle adoption
        will be—(1) electric vehicles will likely achieve total cost of ownership breakeven (assuming first
        replacement happens in 5 years) versus ICE vehicles in India by CY2025 (in scooters and three-
        wheelers total cost of ownership (TCO) has already been achieved), (2) the government FAME-II
        policy will accelerate the shift towards EVs, (3) the government plans to set up charging
        infrastructure across the country and (4) the OEMs plan to launch a number of electric vehicles
        in CY2020, which will offer significantly better performance than the current EVs in India.

        OEMs’ profitability will suffer initially as adoption rises in electric vehicles

        Profitability in electric vehicles will likely be negative in the initial few years due to (1) lack of
        economies of scale and (2) potentially aggressive pricing by OEMs to increase adoption levels of
        EVs. As the electric two-wheeler market will largely be controlled by existing OEMs only, we
        expect profitability on electric vehicle sales to converge towards current profitability over a
        period of time with increase in scale and reduction in costs. Having said that, (1) profitability
        from sale of spare parts will be at risk for OEMs as EVs have much lesser moving parts and
        require much lower maintenance costs and (2) profitability will also be impacted due to decline
        in residual value of internal combustion engines (ICE) vehicles, which can put pressure on
        pricing of ICE vehicles.                                                                                                                                                      Hitesh Goel
                                                                                                                                                                                      hitesh.goel@kotak.com
                                                                                                                                                                                      Mumbai: +91-22-4336-0878
        Impact on auto ancillaries will be negative for suppliers with engine and transmission parts
                                                                                                                                                                                      Nishit Jalan
        In terms of the impact on auto ancillaries, the shift towards EVs would be negative for                                                                                       nishit.jalan@kotak.com
        ‘traditional’ automotive component suppliers due to lack of an engine and reduction in                                                                                        Mumbai: +91-22-4336-0877

        transmission content in EVs (60% of vehicle cost in ICE). However, tire manufacturers,
                                                                                                                                                                                      Rishi Vora
        companies with presence in interior and exterior parts such as bumpers, door panel, instrument                                                                                rishi.vora@kotak.com
        panel, seats, rear-view mirrors, among others, will not be much impacted by the shift towards                                                                                 Mumbai: +91-22-4336 0874

        electric vehicles.

                                                                                                                                                                                         Kotak Institutional Equities
                                                                                                                                                                                         Research

                                                                                                                                                                                         Important disclosures appear
                                                                                                                                                                                         at the back

For Private Circulation Only. In the US, this document may only be distributed to QIBs (qualified institutional buyers) as defined under rule 144A of the Securities Act of 1933. This document is not for public distribution
and has been furnished to you solely for your information and may not be reproduced or redistributed to any other person. The manner of circulation and distribution of this document may be restricted by law or
regulation in certain countries, including the United States. Persons into whose possession this document may come are required to inform themselves of, and to observe, such restrictions.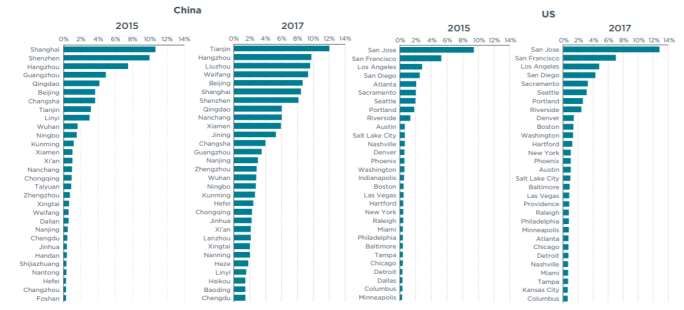
Automobiles & Components                                                                                                Sector

       TABLE OF CONTENTS

                    Adoption of electric vehicles: Question is when, not if? ...................................... 3

                    Understanding China’s electric vehicle industry ................................................ 10

                    Electric vehicle adoption in India will see a steady rise....................................... 15

                    Who are the beneficiaries in India and who are most impacted? ...................... 34

                    Appendix 1: Global companies are investing heavily in electric technology ....... 41

                    Appendix 2: Domestic EV company profiles ...................................................... 42

  2                                                                                        KOTAK INSTITUTIONAL EQUITIES RESEARCH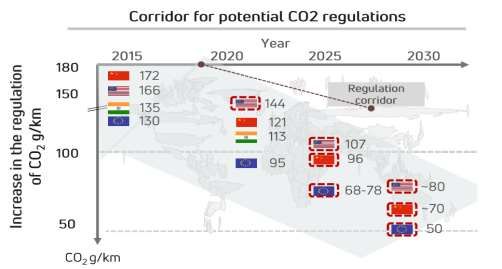
Sector Automobiles & Components
ADOPTION OF ELECTRIC VEHICLES: QUESTION IS WHEN, NOT IF?
The share of electric vehicles in the automobile industry is likely to increase significantly driven by falling
lithium ion battery costs, government support to electric technology and development of charging
infrastructure across the globe. China, Europe and the US will remain the key markets for electric vehicles,
while in India adoption will gradually increase.
The key reasons for faster adoption of electric vehicles globally are discussed below.
Sharp decline in lithium ion battery prices globally leading to decline in prices of
electric vehicles
One of the important drivers of an EV’s total cost of ownership (TCO) matching internal
combustion vehicles (ICE) is the cost of the battery pack (contributes ~50% of electric
vehicle cost currently). The price of the battery pack has fallen by 85% since CY2010.
However, the cost of the battery pack is still a major hurdle for faster adoption of EVs.
Lithium battery prices are expected to fall to US$94 per kW-hr by CY2024 and US$62 per
kW-hr by CY2030 (as per Bloomberg Intelligence estimates) mainly led by (1) higher volumes
due to mass market adoption, (2) use of alternate materials instead of expensive materials
like cobalt. Currently NMC111 (nickel, magnesium and cobalt in the ratio of 1:1:1) chemical
is used in automotive EV lithium ion battery but by CY2020, NMC811 composition will be
used, which will significantly reduce usage of cobalt in the battery, and (3) increase in
battery cell density, which will further reduce the cost of battery. Lower battery pack prices
will eventually lead to lower TCO for EVs as compared to ICEs.
Exhibit 1: Battery pack prices are expected to fall to $94 per kW-hr in CY2024 and to $62 per kW-hr
in CY2030
Historical and forecasted prices of battery pack, calendar year-ends, 2010-30 (in US$/ kW-hr)
Battery pack price (in $/kWhr)
1,400
1,160
1,200
1,000 899
800 707
650
577
600
373
400 288
214
176 155
200 138 124 112 102
94 87 81 76 71 68 64 62
-
2019E
2020E
2021E
2022E
2023E
2024E
2025E
2026E
2027E
2027E
2028E
2029E
2030E
2013
2014
2015
2010
2011
2012
2016
2017
2018
Source: Bloomberg NEF, Kotak Institutional Equities
Government supporting electric vehicles with incentives
Global plug-in hybrid and electric vehicle sales were 2.1 mn units in CY2018 (64% higher
than CY2017), which was ~2% of global automotive sales. China leads the race with sales
of 1.2 mn units (+78% yoy) followed by the US with sales of 0.35 mn (+79% yoy) and
Europe with sales of 0.4 mn (+34%) in CY2018. Some smaller markets like Scandinavian
countries supported EV sales through incentives, including (1) Norway, where 40% of the new
car sales were plug-in hybrids and electric, (2) Iceland had 17.5% of new car sales as EVs and
(3) 7.2% of car sales were EVs in Sweden in CY2018. Higher sales volume was mainly led by
governments’ (1) heavy investments in EV infrastructure and mobility solutions to encourage
supply and (2) subsidies, tax breaks and special driving privileges to incentivize demand.
Many governments are incentivizing to opt for electric mobility, each with their own
schemes (refer to Exhibit 3). Certain governments have eased the burden on purchase, lease
and road taxes to make EVs more attractive to consumers. Other benefits include the use of
special driving lanes, preferential or free parking and waiving of toll fees.
KOTAK INSTITUTIONAL EQUITIES RESEARCH 3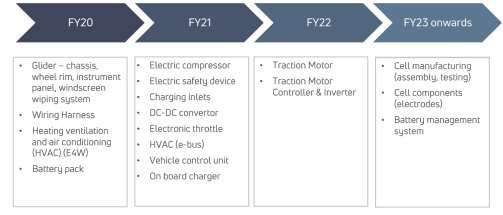
Automobiles & Components                                                                                                                                                  Sector

                                              Exhibit 2: China, US and Europe together comprise ~93% of the global electric vehicle sales in
                                              CY2018
                                              Geographic mix of electric vehicle sales, calendar year-end, 2018 (in %)

                                                                                           Others, 7.2%

                                                                    Europe, 19.5%

                                                                                                                                               China, 56.3%

                                                                        USA, 17.0%

                                              Source: Inside EVs, Kotak Institutional Equities

Exhibit 3: Norway has the best policy on EV
EV subsidy scheme by various governments, calendar year-end, 2018
Country/State              Subsidy criteria                                                                  Incentives
                           A tax credit is available for the purchase of a new qualified PEV that draws
                           propulsion using a traction battery that has at least five kilowatt-hours (kWh)
                           of capacity, uses an external source of energy to recharge the battery, has a
                           gross vehicle weight rating of up to 14,000 pounds, and meets specified
                           emission standards. The minimum credit amount is $2,500, and the credit
                                                                                                             $2,500 to $7,500 (This subsidies are available up and above the
United States of America   may be up to $7,500, based on each vehicle's traction battery capacity and
                                                                                                             respective state-subsidies given by each state)
                           the gross vehicle weight rating. The credit will begin to be phased out for
                           each manufacturer in the second quarter following the calendar quarter in
                           which a minimum of 200,000 qualified PEVs have been sold by that
                           manufacturer for use in the United States. This tax credit applies to vehicles
                           acquired after December 31, 2009.

                           In order to be eligible for eletric vehicle rebate program, annual household
                           income must be equal or below the income caps defined as: (1) $150,000 for
                                                                                                          Battery electric vehicles (BEV) - $2,500
                           single filers, (2) $204,000 for head-of-household filers and (3) $300,000 for
California                                                                                                Plug-in hybrid electric vehicles (PHEV)- $1,500
                           joint filers. Income which exceed the above levels are eligibile for fuel cell
                                                                                                          Hydrogen fuel cell electric vehicles (FCEV)- $ 5,000
                           electric vehicle rebates only. An addition $2,000 is availabe for lower-income
                           with household income less than 300% of the Fed poverty level.

                                                                                                             Greater than 120 miles - $2,000
                                                                                                             40-119 miles - $1,700
                           Drive clean rebate for electric cars depends on the EPA all electric range for    20-39 miles - $1,100
New York
                           the car model in New York                                                         Less than 20 miles - $500
                                                                                                             Electric cars with manufacturer's suggested retail price greater than
                                                                                                             $60,000- $500

                                                                                                             Incentives include: (1) No purchase/import taxes, (2) exemption from
                           Since the early 1990s, Norwegian government have gradually introduced             25% VAT on purchase, (3) No annual road tax, (4) 50% of the price
Norway
                           incentives for vehicles with zero emission.                                       for fossil fuel cars on ferries, public parking and toll roads, (5) 40%
                                                                                                             reduced company car tax and (6) access to bus lanes

                                                                                                             Greater than 400 km - CNY25,000
                           The subsidies can be availed only for models for pure battery electric cars
China                                                                                                        300-400 km - CNY18,000
                           with a driving range above 250 kilometers
                                                                                                             20-250-300 km - CNY 18,000

                           FAME II was recently incorporated with capital outlay for Rs100 bn spread
                           over the three years. The capital will be incured towards demand incentives
                                                                                                             Rs 10,000 per kWhr for all vehicles (capped at 20% of the vehicles
India                      and charging infrastructure. The demand incentive is linked to the battery
                                                                                                             cost)
                           capacity. Also, the subsides are capped at 20% of the cost of cars. 35,000
                           cars can avail subsidy benefits under FAME II scheme.

Source: Kotak Institutional Equities

        4                                                                                                                              KOTAK INSTITUTIONAL EQUITIES RESEARCH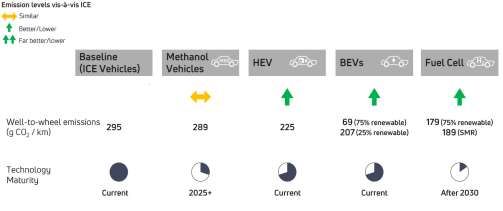
Sector                                                                                                       Automobiles & Components

                                          Sharp increase in electric charging infrastructure globally
                                          Electric charging infrastructure will play a key role in faster adoption of EVs globally. In the
                                          past few years, vehicle sales in some countries have been constrained by lack of public
                                          charging infrastructure. Although most EV charging takes place at home or work, availability
                                          of public EV charging infrastructure is an important consideration for EV buyers mainly due
                                          to (1) lack of dedicated parking spot near home, (2) quick charging capabilities and (3)
                                          eliminate the fear of range anxiety among customers. However, recently EV charging
                                          infrastructure is growing rapidly across the US, China and Europe. In January 2019, the
                                          Chinese Electric Vehicle Charging Infrastructure Promotion Agency reported 300,000 units
                                          of public chargers, up from 214,000 units last year. China has 2X the amount of charging
                                          stations than EU and ~4.5X that of the US.

                                          Exhibit 4: Number of charging posts have exponentially increased from CY2015
                                          Number of public and dedicated fleet EV posts in China, calendar year-ends, 2012-18 (in units)

                                           350,000
                                                                                                                                             299,800
                                           300,000

                                           250,000
                                                                                                                                213,900
                                           200,000

                                                                                                                 140,000
                                           150,000

                                           100,000
                                                                                                    49,600
                                            50,000                                      23,000
                                                          17,900        21,200

                                                 -
                                                          2012            2013          2014         2015         2016            2017        2018

                                          Source: China EV Charging Alliance, Kotak Institutional Equities

                                          Exhibit 5: US has ~67,000 public charging ports as on January 1, 2019
                                          Number of public and dedicated fleet EV posts in US, calendar year-end, 2010-18 (in units)

                                           80,000

                                           70,000                                                                                            67,395

                                           60,000
                                                                                                                                    50,627
                                           50,000
                                                                                                                         42,029
                                           40,000
                                                                                                              30,945
                                           30,000                                                  25,602
                                                                                         19,410
                                           20,000
                                                                             13,392

                                           10,000
                                                                   3,394
                                                         541
                                                -
                                                        2010       2011          2012     2013      2014       2015      2016       2017      2018

                                          Source: Alternative Fuels Data Center, US Department of Energy, Kotak Institutional Equities

  KOTAK INSTITUTIONAL EQUITIES RESEARCH                                                                                                              5
Automobiles & Components                                                                                                   Sector

                    Exhibit 6: Europe charging stations have grown at a CAGR of 62% over CY2010-18
                    Number of public EV charging stations in Europe, calendar year-ends, 2010-18 (in units)

                     180,000
                                                                                                                          155,247
                     160,000
                                                                                                              141,140
                     140,000

                     120,000
                                                                                                   98,002
                     100,000

                      80,000
                                                                                          55,524
                      60,000

                      40,000                                                     32,772
                                                                     22,039
                      20,000                              13,347
                                    3,201      5,515
                            -
                                    2010       2011       2012        2013       2014     2015      2016        2017       2018

                    Source: Inside EVs, Statista, Kotak Institutional Equities

                    Driving experience of luxury electric cars superior to petrol/diesel cars
                    Tesla has redefined the electric car space with the launch of Model S. Model S is the leader
                    in the luxury car segment in the US and beats Mercedes S-Class by a margin. Model S is
                    similar priced as S-Class and has superior performance than S-Class. Model S has better
                    acceleration than S-Class and reaches peak power at lower RPM than S-Class. Electric cars
                    are quieter than petrol cars and have better pickup due to high power at lower torque,
                    which makes the driving experience even more thrilling.

                    In the middle price segment in the US, Toyota Avalon has better performance than the
                    Volkswagen Golf electric (refer to Exhibit 8). Performance of electric vehicles in the mass
                    market segment is improving as battery prices are coming down.

  6                                                                                           KOTAK INSTITUTIONAL EQUITIES RESEARCH
Sector Automobiles & Components
Exhibit 7: Tesla Model S performance is superior than Mercedes Benz S450
Comparison of the features of Tesla Model S versus Mercedes Benz S450, April 2019
Mercedes Benz S450 AMT Petrol Tesla Model S
Cost to consumer ($) 91,250 89,750
Engine
Engine Type 8 cyclinder engine NA
Displacement 4 Litres NA
Power 463 hp @ 5250 rpm Motor 1: 502.9 hp (peak); Motor 2: 258.8 hp (peak)
Torque 516 lb-ft @ 2000 rpm Motor 1: 442.5 lb-ft (peak); Motor 2: 243.4 lb-ft (peak)
Brakes
Brakes front 4-wheel ABS Ventilated discs
Brakes rear 4-wheel ABS Ventilated discs
Performance
Mileage 17 miles per galon 315 miles per charge
Top speed (mph) 130 163
0-60 mph (sec) 5.4 3
0-100 mph (sec) 13.2 3.2
Suspension
Suspension-front Active suspension system with multi-link Smart Air suspension
Suspension-rear Active suspension system with multi-link Smart Air suspension
Tyres
Tyre size (Front) 245/45ZR19 245/45R 19
Tyre size (Rear) 275/40ZR19 245/45R 19
Wheel size (inch) 19 19
Dimensions
Length*Width*Height (inch) 206.9*74.8 * 58.8 196*77.3*56.9
Ground clearance (inch) 5 5.5
Kerb weight (lbs) 4,731 4,941
Battery Features
Type of battery NA Lithium-ion
Manufacturer NA Panasonic
Battery capacity NA 100kWhr
Charging time NA upto 80% in 40 minutes using supercharger
Voltage NA 400 V
Other Key Features
Standard warranty (Years) 4 4
Standard warranty (miles) 50,000 50,000
Battery warranty (Years) NA 8
Source: Company, Kotak Institutional Equities
KOTAK INSTITUTIONAL EQUITIES RESEARCH 7Automobiles & Components Sector
Exhibit 8: Toyota Avalon has a mileage of 125-186.4 miles per charge with a peak power of 134.1 hp
Comparison of the features of Toyota Avalon versus Volkswagen e-Golf, April 2019
Toyota Avalon XSE Petrol Volkswagen e-Golf SE
Cost to consumer ($) 36,580 38,895
Engine
Engine Type 6 cyclinder engine NA
Displacement 3.5 Litres NA
Power 301 hp @ 6600 rpm 134.1 hp @ 3300 rpm
Torque 267 lb-ft @ 4700 rpm 213.9 ft-lb (peak)
Brakes
Brakes front 4-wheel discs Ventilated discs
Brakes rear 4-wheel discs Ventilated discs
Performance
Mileage 22 miles per galon 125- 186.4 miles per charge
Top speed (mph) 116 93.2
0-100 mph (sec) 7.4 9.6
Suspension
Suspension-front MacPherson Strut MacPherson strut with telescopic shock absorbers
Suspension-rear Multi-link Multi-link with telescopic shock absorbers
Tyres
Tyre size (Front) P245/40VR19 205/55R16 19
Tyre size (Rear) P245/40VR19 205/55R16 19
Wheel size (inch) 19 19
Dimensions
Length*Width*Height (inch) 195.9*72.8 * 56.5 168.1*70.8*58.3
Ground clearance (inch) 5.3 5.6
Kerb weight (lbs) 3,638 3,560
Battery Features
Type of battery NA Lithium-ion
Manufacturer NA Samsung SDI
Battery capacity NA 35.8 kWhr
Charging time NA upto 80% in 34 minutes using CCS fast charging 50W
Voltage NA 323 V
Other Key Features
Standard warranty (Years) 3 6
Standard warranty (miles) 36,000 72,000
Battery warranty (Years) NA 8
Battery warranty (miles) NA 99,360
Source: Company, Kotak Institutional Equities
Electric vehicles are cleaner than ICE vehicles
CO2 emissions are much lower in hybrid and battery electric vehicles compared to an ICE
vehicle. As highlighted in Exhibit 9 below, well-to-wheel CO2 emissions (includes upstream
emissions of greenhouse gases from electricity production for an EV) of an ICE vehicle is 295
g/km as compared to 225g/km for a hybrid vehicle and 69-207g/km for a electric vehicle
(assuming 75%/25% of electricity is generated from renewable energy sources). Further, we
note that governments across the globe are coming up with stringent CO2 regulations,
which restricts the average fleet CO2 emissions for an OEM. For example—from CY2021,
the EU fleet-wide average emission target for new cars will be 95g CO2/km (earlier target
was set in CY2015 at 130g CO2/km). Europe will make these targets even more stringent
over the next 10 years (China and the US also have stringent regulations—refer to Exhibit 10
for details). Therefore, to meet the new CO2 targets, it is imperative for an OEM to gradually
shift towards EVs; requirement of quantum of shift towards EVs to meet regulatory norms
would depend on the potential CO2 regulations adopted by countries globally.
8 KOTAK INSTITUTIONAL EQUITIES RESEARCHSector Automobiles & Components
Exhibit 9: CO2 emissions are much lower in hybrid and battery electric vehicles compared to ICE
CO2 emissions from ICE vehicles, hybrid and electric vehicles
Source: Tata Motors, Kotak Institutional Equities
Exhibit 10: CO2 emission regulations are becoming much stricter globally
CO2 emission regulations globally over the next 10 years
Source: Tata Motors, Kotak Institutional Equities
KOTAK INSTITUTIONAL EQUITIES RESEARCH 9Automobiles & Components Sector
UNDERSTANDING CHINA’S ELECTRIC VEHICLE INDUSTRY
Electric vehicle sales in China have grown at phenomenal pace over the past five years with more than 1 mn
passenger EVs sold in CY2018 (~4% of total passenger vehicles sales) from just 15,000 units in CY2013. Key
growth drivers are (1) strong government support in terms of direct subsidies to buyers (up to 40-50% of
vehicle price), sales tax exemptions and also purchase of EVs for public services by the government (buses,
taxis, etc.) and (2) exemption from purchase of EVs in bigger cities where there is restriction on issuance of
overall number of new license plates (such cities account for more than 50% of overall EV sales in China). We
note that in April 2019, the government reduced subsidies on EVs by almost 50-60% (no subsidy now for low-
range EVs) and it also plans to abolish subsidies completely after CY2020. We believe that this could pose
challenges for industry growth going ahead and could also impact financial viability of companies.
Passenger electric vehicle sales in China crossed 1 mn units in CY2018
Electric passenger vehicle sales in China have grown at 132% CAGR over the past five years
(68% CAGR over the past three years) and crossed 1 mn units in CY2018, which is more
than total EV sales in Europe and the US, put together. We note that sales of passenger EVs
in China grew by almost 70% yoy in CY2018 even though overall passenger vehicle market
declined by 4% yoy—electric vehicles sales accounted for 4% of overall passenger vehicle
industry in CY2018 (refer to Exhibit 11 for details). Domestic Chinese OEMs have more than
90-95% market share in the EV segment—BYD, Kandi, Zhidou, Zotye, BAIC are major
players in the segment. Imported models of companies such as Tesla and BMW have very
low market share due to tariff on imported models (25%) and the import models are
excluded from subsidies and sales tax exemption. We note that unlike developed markets
where EV penetration is much higher in the luxury segment (courtesy Tesla), in China, bulk
of the EV sales are in low and mid-priced segments with pre-subsidy prices ranging from
RMB80,000 to RMB200,000; this could largely be due to (1) higher percentage subsidy in
these models and (2) inability of low-end car buyers to purchase ICE vehicles in top cities
where there is restriction on number of license plates that can be registered every year (refer
to Exhibits 12-14 for details).
Growth drivers: government support and lack of restriction on EV license plates
We discuss below two major drivers for such strong growth of electric passenger vehicle
sales in China.
Higher government subsidies. Due to dire need to control pollution levels, the
government has made significant efforts to promote electric vehicle sales in China. In
CY2010, the government announced its scheme to provide subsidies for purchase of an
electric vehicle of up to RMB60,000 per vehicle (translated to 30-50% of vehicle cost)—
such high incentive encouraged several domestic OEMs and suppliers to enter into the
segment and set up lithium-ion battery and electric vehicle manufacturing capacities. As
per news reports, currently there are almost 500 registered manufacturers for EVs in
China (global player such as GM, VW, BMW, Audi and Tesla have also chalked out
extensive plans to enter the EV segment in China) with annual capacity of around 4 mn
units. Higher subsidies and competitive pricing of EVs in the market due to presence of
multiple local players has led to significant spurt in sales of EVs in China over the past five
years. Additionally, the government has provided support through sales tax exemptions
on electric vehicles, direct purchase of EVs by the government for public utilities, etc. to
kick-start the industry. As per independent industry reports, total cumulative government
support for electric vehicle industry (including passenger vehicles and buses) could be
around RMB395 bn (~US$60 bn).
10 KOTAK INSTITUTIONAL EQUITIES RESEARCHSector Automobiles & Components
Over the years, a subsidy policy has evolved in China with greater focus on vehicles with
higher range (in terms of kms run per charge)—for example, in CY2010, when subsidiary
was announced, there was no restriction on vehicle range but in CY2017, the
government made it mandatory for battery electric vehicles to have range of at least 100
kms, which was increased to 150 kms in CY2018 and further to 250 kms in CY2019
(refer to Exhibit 15 for details). This is a move in the right direction as it would encourage
sales of better electric vehicles and would give impetus to stronger players in the industry
(leading to higher economies of scale but the flipside could be concerns around financial
viability or bankruptcies of several small companies).
Lack of restriction on license plates for EVs in major cities. In addition to cash
subsidies to car buyers, several bigger cities provide favorable policies such as the assured
issuance of a vehicle license and increased access to carpool lanes to EV purchasers. For
example, in several top cities in China such as Beijing, Tianjin, Shanghai, Hangzhou,
Guangzhou, Shenzhen, and Guiyang, etc., there is a cap on the number of vehicle
licenses issued each month in order to regulate the number of vehicles (done to reduce
congestion and pollution problems). Buyers of EVs, however, are exempt from this
restriction and assured of receiving a license along with the purchase of the vehicle. This
is a significant incentive to purchase EV particularly for those who want to buy an entry-
level vehicle (as they cannot afford to pay higher prices for license plates). As per city-wise
sales data (Source: ICCT), almost 50% of electric vehicles in China are sold in cities where
there is restriction on license plates imposed by the government (refer to Exhibit 17 for EV
sales data by cities/provinces).
Withdrawal of subsidies key challenge for sustaining strong future growth
As discussed above, significant government subsidies have been one of the major reasons
for strong growth in EV sales over the past five years. We note that in April 2019,
government reduced subsidies on EVs by almost 50-60% (no subsidy now for low-range EVs)
and it also plans to abolish subsidies completely after CY2020. In April 2019, subsidy for
pure battery electric cars with driving ranges of 400 km (250 miles) and above was cut by 50%
to RMB25,000/vehicle from RMB50,000/vehicle earlier. Further, in order to qualify for any
subsidy, electric cars need to have a range of at least 250 km as compared to minimum
range of 150 km as per earlier policy. Thus, there have been steeper cuts in subsidy for mid-
range electric vehicles (150-250 km range) while purchase of low-range EVs (below 150km
range) will not get any subsidies from the government. We note that growth in electric
vehicle sales came down single digits in May 2019 post reduction in subsidies by the
government. Additionally, we believe that withdrawal of subsidies for low to mid-range
vehicles could significantly impact financials of smaller companies and could also lead to
bankruptcies as well.
Exhibit 11: EV car sales form 4% of the total car sales in China in 2018
EV and total car sales in China, calendar year-ends, 2013-18 (units, %)
2013 2014 2015 2016 2017 2018
Sale volume
China EV car sales (units) 15,004 61,984 214,283 333,418 600,174 1,016,002
China total car sales (units) 17,407,424 19,652,266 20,482,454 24,788,366 25,387,109 24,384,121
EV as a % of total car sales 0.1 0.3 1.0 1.3 2.4 4.2
Source: CAAM, LMAC, Kotak Institutional Equities
KOTAK INSTITUTIONAL EQUITIES RESEARCH 11Automobiles & Components Sector
Exhibit 12: BYD is the leading player in EV in China
Company-wise breakup of EV car sales in China, calendar year-ends, 2015-17 (%)
2017 2015
Lifan, 2% Dongfeng,
Others, 3%
Chery, 4% 10% Others,
Chagan, 11%
4% BAIC, 21%
JAC, 4% BYD, 26%
JAC, 6%
SAIC, 7%
JMC, 7%
BYD, 17%
BAIC, 8% Kandi, 15%
Jiangnan,
Zotye, 9% 7%
SAIC, 11% Geely, 13%
Zhidou,
15%
Source: ICCT, Kotak Institutional Equities
Exhibit 13: In 2017, 68% of the BEV sales were micro cars in China
Vehicle segments of BEVs and PHEVs by sales in China, calendar year-end, 2017
Source: ICCT, Kotak Institutional Equities
12 KOTAK INSTITUTIONAL EQUITIES RESEARCHSector Automobiles & Components
Exhibit 14: Majority of the EV sales in China are of low to mid-priced models (before subsidy prices of RMB80,000-200,000)
Price of major EV and PHEV models in China (RMB)
NEV Models PHEV Models
Company Model Range (km) Price before subisidies (RMB) Company Model Range (km) Price before subisidies (RMB)
Changan Benni Mini 150 82,800 Changan Eado 60 160,900
ZhiDou D3 210 89,800 GAC GA3 PHEV 63 164,800
Baojun E100 155 93,900 Geely Emgrand 60 165,900
Zotye TT 150 105,000 Chery Arrizio 7e 50 179,900
ZhiDou D3 Premium 310 109,800 BYD Qin PHEV 55 185,900
JAC IEV6E 155 118,500 GAC GA5 PHEV 70 199,300
Yulon EV2 150 119,800 Roewe Ei6 PHEV 53 201,800
JMC E160 152 136,800 GAC Mitsubishi Qizhi 58 209,800
Changhe X5 260 143,000 GAC GS4 PHEV 58 209,800
Kandi K10 150 150,800 BYD Song DM 70 215,900
BAIC EC180 180 151,800 Roewe e550 60 239,800
Changan Benni 180 154,800 Roewe e950 60 255,900
Kandi K12 155 158,800 Changan Ford Mondeo 52 319,800
Dongfeng E30L 150 164,800 Audi A3 e-tron 50 399,800
Chery eQ 200 169,900 BMW i3 Rex 80 550,800
Dongfeng S50 EV 255 188,500 Audi Q7 e-tron 55 928,800
Changan Eado 200 192,300
Geely Emgrand 400 195,800
BYD e5 305 195,900
Zotye ZhiDou Z500 200 209,800
Dongfeng E70 351 212,800
BYD Qin EV300 300 235,900
BMW i3 246 422,800
Tesla Model S 75D 490 742,300
Source: CAAM, Kotak Institutional Equities
Exhibit 15: Chinese central government cut its EV car subsidies by ~55% in CY2019
Chinese Subsidy Rates for NEV Passenger Cars, calendar year-ends, 2010-19
2010 2017 2018 2019
BEV PHEV BEV PHEV BEV PHEV BEV PHEV
Central Government
Eligibility Requirements Battery Power (kW-hr) 15 10 — — — — — —
Range (km) — — 100 50 150 50 250 250
Lowest Speed Over 30 Minutes (km/hr) — — 100 — 100 — — —
Energy Intensity (wh/kg) — — 90 — 105 — 125 —
Amount (RMB thousands) Up to 60 Up to 50 20-44 20-25 15-50 22 7.5-25 9
Provincial Governments
From 2017, 50% of central gov’t — — Up to 22 10-12.5 7.5-25 11 — —
Total Subsidy (RMB thousands) Up to 60 Up to 50 30-66 30-37.5 22.5-75 33 7.5-25 9
Source: CAAM, Kotak Institutional Equities
Exhibit 16: China has spent approximated RMB394 bn for electrification plan over CY2009-17
China government spending on electrification of cars, calendar year-ends, 2009-17 (RMB bn)
Amount
Type (RMB billions)
Sales subsidies 245.0
Infrastructure subsidies 15.0
Research & Development 12.9
Government procurement 50.3
Sales tax exemption 70.0
Total 393.7
Total vehicle sales 929.1
Government spending as percentage of total sales 42.4
Source: Industry reports (CSIS estimates), Kotak Institutional Equities
KOTAK INSTITUTIONAL EQUITIES RESEARCH 13Automobiles & Components Sector
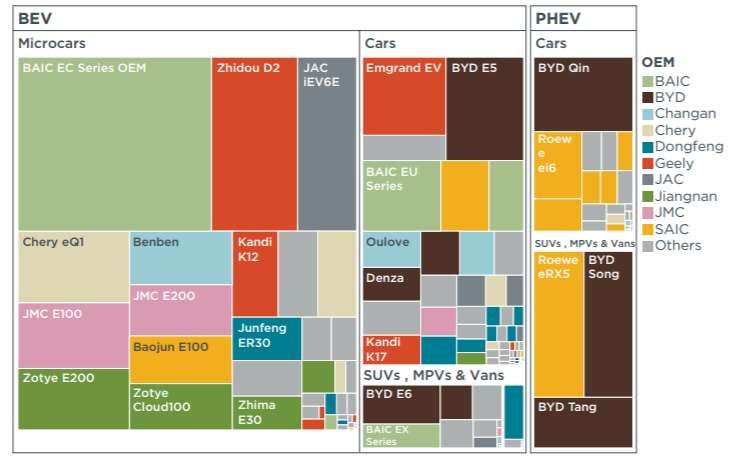
Exhibit 17: In China, the top 30 cities collectively represented 72% of the national electric car market in 2017
Top 30 cities EV sales break up in China and US, calendar year-ends, 2015-17 (%)
Source: ICCT, Kotak Institutional Equities
14 KOTAK INSTITUTIONAL EQUITIES RESEARCHSector Automobiles & Components
ELECTRIC VEHICLE ADOPTION IN INDIA WILL SEE A STEADY RISE
We believe adoption of electric vehicles in India will increase at a steady pace due to falling lithium ion
battery prices globally, government support to electric technology and development of charging
infrastructure. EV adoption has been slow to pick up in India due to low adequate government support to
EVs, high cost of ownership versus ICEs, lower availability of public charging infrastructure and relatively
inferior performance of electric vehicles versus ICEs currently available in the market. We expect that a
significant part of scooters and three-wheelers will shift to electric by FY2030, even as adoption in passenger
vehicles will be slow.
We forecast 28% of automobiles (excluding commercial vehicles) will shift to electric and
plug-in hybrid by FY2030. Scooters, three-wheelers and buses will likely shift faster to
electric than other modes of transport. The key reasons for steady improvement in electric
vehicle adoption will be—(1) electric vehicles will likely achieve total cost of ownership
breakeven (assuming first replacement happens in 5 years) versus ICE vehicles in India by
CY2025 (in scooters and thee-wheelers TCO has already been achieved), (2) the government
FAME-II policy will accelerate the shift towards EVs, (3) the government plans to set up
charging infrastructure across the country although currently charging infrastructure is at
nascent stage and (4) OEMs plan to launch a number of electric vehicles in CY2020, which
will offer significantly better performance than the current electric vehicles in India.
Exhibit 18: We expect electric vehicles to form 28% of the total industry volumes by FY2030
Annual volume forecasts for automotive demand, March fiscal year-ends, 2019-30 (mn units, %)
Electric fleet
Auto ICE Electric proportion (%)
2019 25.3 25.2 0.1
2022 30.2 29.3 0.9 3.1
2025 35.1 30.6 4.6 13.0
2030 40.2 29.1 11.1 27.6
CAGR (%) 3.6 1.1 50.5
Source: Kotak Institutional Equities estimates
Exhibit 19: We expect electric vehicles to form 12% of the total auto industry population by FY2030
Annual population forecasts for automotive industry, March fiscal year-ends, 2019-30 (mn units, %)
Electric fleet
Auto ICE Electric proportion (%)
2019 175.1 175.1 —
2022 265.1 263.7 1.5 0.6
2025 326.5 316.1 10.4 3.2
2030 439.9 388.5 51.3 11.7
CAGR (%) 7.3 6.3
Source: Kotak Institutional Equities estimates
TCO of electric vehicles are converging versus ICE vehicles
We analyzed the total cost of ownership of ICE vehicles versus electric vehicles over 50,000
kms of vehicle run to understand the cost of ownership of electric vehicles. Electric vehicles
are more expensive than petrol vehicles but if we compare the cost of ownership levels of
electric vehicles, we come to the following conclusions.
KOTAK INSTITUTIONAL EQUITIES RESEARCH 15Automobiles & Components Sector
TCO of electric scooters are lower than petrol scooters. We compared cost of
ownership of Ather S340 scooter with Honda Activa 110cc. Ather S340 is `33,903 more
expensive than Activa (including incentive by the government) but the running cost saving
is `78,125 (based on charging from normal charger at home) over 50,000 kms. Hence
customer can break even on his higher capital cost on Ather S340 at around 22,000 kms
(typically 2 years assuming 10,000 kms run annually). If we remove government incentive
of `22,000, electric scooter is `55,903 expensive than Activa, then the breakeven
increases to 3.3 years. Hence in terms of cost of ownership, electric scooters have become
cheaper than petrol scooters as the life of lithium ion battery is 15 years while a life of a
petrol scooter is 10 years. Post BS-VI, the cost of petrol scooter will increase by `7,000,
then the breakeven for Ather S340 versus Honda Activa will reduce to 1.6 years (with
government incentives) and 2.9 years (without government incentives).
Scooter is also a product that is widely used in urban India where the power availability is
significantly better than rural India. In FY2030, we estimate battery prices will drop from
$250/kW-hr currently to $100/kW-hr led by scale benefits and higher specific and
volumetric energy density as battery chemistry improves, which will reduce the price of e-
scooter by `23,750. Thus, customers can break even in less than one year (without
government subsidies) in FY2030. In FY2030, we expect urban and rural mix in the
scooter segment to be 50:50 and we estimate 75% of the urban customers and 25% of
the rural customers (due to charging infrastructure constraints and poor quality of power
supply in the rural areas) will shift towards electric scooters. Hence we estimate that 50%
of scooters will shift to electric by FY2030. Currently the shift towards electric scooters
is not significant because of limited production capacity of existing players like Hero
electric, Ather Energy, and Okinawa, etc. while the bigger players like Hero, Honda, Bajaj
and TVS Motors haven’t launched electric scooters yet. However, most of these players
are planning to launch electric scooters in the next one year. The government has
restricted incentives under the FAME-II scheme to only 1 mn two-wheelers over FY2019-
22 but we believe that the shift to electric scooters could happen without incentives as
well.
Exhibit 20: We expect electric vehicles to form 32% of the total two-wheeler volumes by FY2030
Annual volume forecasts for two-wheelers, March fiscal year-ends, 2019-30 (mn units, %)
Two-wheelers ICE Electric Electric fleet proportion in 2-Wh (%)
2019 21.2 21.1 0.1 0.3
2022 25.2 24.4 0.8 3.3
2025 28.9 24.7 4.2 14.5
2030 31.3 21.2 10.1 32.3
CAGR (%) 3.1 0.0 49.4
Source: Kotak Institutional Equities estimates
Exhibit 21: We expect electric vehicles to form 13.5% of the total two-wheeler population by FY2030
Annual population forecasts for two-wheelers, March fiscal year-ends, 2019-30 (mn units, %)
Two-wheelers ICE Electric Electric fleet proportion in 2-Wh (%)
2019 142.8 142.8 —
2022 219.0 217.7 1.3 0.6
2025 268.8 259.2 9.5 3.5
2030 347.7 300.7 47.0 13.5
CAGR (%) 7.1 5.9
Source: Kotak Institutional Equities estimates
16 KOTAK INSTITUTIONAL EQUITIES RESEARCHSector Automobiles & Components
Exhibit 22: E-scooter is more affordable compared to gasoline scooter over 50,000 kms run
Comparison of the cost of ownership of an electric scooter with that of a gasoline scooter, April 2019, prices
of electricity and vehicle as of Mumbai
Ather Energy
e-scooter (S340) Honda Activa
On-road price (Rs) 135,230 79,327
Incentives (Rs) 22,000 —
Cost to consumer (Rs) 113,230 79,327
Battery size (Kwh) 2.7
Electricity cost (Rs/kwh) 8.0
Range at full charge (km) 55
Electricity cost (Rs/km) 0.4
Electricity cost (Rs) 19,636 —
Fuel cost (Rs) — 98,125
Maintenance cost (Rs) 2,500 7,500
Total cost of ownership of vehicle
135,366 184,952
over 50,000 kms (Rs)
Cost of ownership/month (Rs) 2,256 3,083
Cost of ownership/year (Rs) 27,073 36,990
Source: Kotak Institutional Equities estimates
Exhibit 23: In FY2030, e-scooter customer will be able to break even at less than 1 year
Comparison of the cost of ownership of an electric scooter with that of a gasoline scooter, March fiscal year-
end, 2030
Ather Energy
e-scooter (S340) Honda Activa
On-road price (Rs) 111,480 98,633
Incentives — —
Cost to consumer (Rs) 111,480 98,633
Battery size (Kwh) 2.7
Electricity cost (Rs/kwh) 13.7
Range at full charge (km) 55
Electricity cost (Rs/km) 0.7
Electricity cost (Rs) 33,585 —
Fuel cost (Rs) — 98,125
Maintenance cost (Rs) 3,849 11,546
Total cost of ownership of vehicle
148,913 208,304
over 50,000 kms (Rs)
Cost of ownership/month (Rs) 2,482 3,472
Cost of ownership/year (Rs) 29,783 41,661
Source: Kotak Institutional Equities estimates
KOTAK INSTITUTIONAL EQUITIES RESEARCH 17Automobiles & Components Sector
Exhibit 24: We expect rural mix to improve to 60% in the two-wheeler segment by FY2030
Urban-rural mix, March fiscal year-ends, 2019-30E (mn units, %)
Two-wheeler volumes (mn units) Mix (%)
Year Urban Rural Urban Rural
2019 10.2 11.0 48.1 51.9
2020E 10.5 11.8 47.2 52.8
2021E 10.8 12.6 46.3 53.7
2022E 11.0 14.2 43.7 56.3
2023E 11.2 15.5 42.0 58.0
2024E 11.5 16.3 41.2 58.8
2025E 11.6 17.3 40.0 60.0
2026E 11.8 17.7 40.0 60.0
2027E 12.0 18.0 40.0 60.0
2028E 12.3 18.4 40.0 60.0
2029E 12.5 18.8 40.0 60.0
2030E 12.8 19.1 40.0 60.0
2019-30E CAGR (%) 2.1 5.2
Source: Kotak Institutional Equities estimates
TCO of electric motorcycles higher than petrol motorcycles due to higher size of
batteries. We compared cost of ownership of an electric motorcycle with Hero 125cc
Super Splendor. There are no electric motorcycles in the market but we are assuming
estimated price of the Tork6X for our calculations. Tork6X will likely be `55,056 more
expensive than Super Splendor after including incentives by the government but the
running cost saving would be `58,364 (based on charging from normal charger) over
50,000 kms. Hence customer can break even on his higher capital cost on Tork6X at
around 47,000 kms (typically 4.7 years assuming average 10,000 kms run annually). If we
remove the government incentive of `22,000, electric motorcycle is `77,056 expensive
than Super Splendor, then the breakeven increases to 6.6 years. Hence, in terms of cost
of ownership, electric motorcycles are still expensive than petrol scooters due to higher
size of lithium ion battery in electric motorcycles versus electric scooters. Electric
motorcycles require more power than electric scooters.
Post BS-VI, the cost of petrol bike will increase by `7,000, then the breakeven for electric
bike versus Hero Super Splendor will reduce to 4.1 years (with government incentives)
and 6 years (without government incentives).
Commuter bikes are used both in urban and rural India. Currently the shift towards
electric bikes is not significant because of lack of product availability in the market while
the bigger players like Hero, Honda, Bajaj and TVS Motors haven’t launched electric bikes.
However most of these players are planning to launch electric bikes over the next 2-3
years. We estimate that the shift in electric motorcycles will start happening when the
electric battery cost falls below US$200/kW-hr levels, which is likely to happen by CY2023
in India. In FY2030, we expect battery prices to fall to US$100/kW-hr and we believe the
shift to electric will not happen in premium motorcycle segment (due to inability of e-
motorcycle to provide high power) and economy segment (breakeven would be closer to
four years due to lower prices of economy segment gasoline bikes). Hence, we expect
executive segment (which is 60% of the motorcycle segment) to shift towards electric.
We expect customers to reach breakeven in ~3.2 years (without government subsidies) in
FY2030. In FY2030, we expect urban and rural mix in the motorcycle segment to be
around 33% and 67%, respectively and we estimate 70% of the urban customers and
15% of the rural customers (due to charging infrastructure constraints and poor quality
of power supply in the rural areas) will shift towards electric motorcycles. We estimate
that 20% of motorcycles will shift to electric by FY2030 in India.
18 KOTAK INSTITUTIONAL EQUITIES RESEARCHSector Automobiles & Components
Exhibit 25: Gasoline motorcycles are at par as compared to electric motorcycle in TCO
Comparison of the cost of ownership of an electric motorcycle with that of a 100cc petrol bike, April 2019,
Prices of electricity and vehicle as of Mumbai
E-motorcycle
(Lithium ion battery) Hero Splendor
On-road price (Rs) 150,000 72,944
Incentives (Rs) 22,000 —
Cost to consumer (Rs) 128,000 72,944
Battery size (Kwh) 4.5
Electricity cost (Rs/kwh) 8.0
Range at full charge (km) 100
Electricity cost (Rs/km) 0.4
Electricity cost (Rs) 18,000 —
Fuel cost (Rs) — 71,364
Insurance cost (Rs)
Maintenance cost (Rs) 2,500 7,500
Total cost of ownership of vehicle
148,500 151,808
over 50,000 kms (Rs)
Source: Kotak Institutional Equities estimates
Exhibit 26: In FY2030, e-motorcycle customer will be able to break even in ~3.2 years
Comparison of the cost of ownership of an e-motorcycle with that of a gasoline motorcycle, March fiscal year-
end, 2030
E-motorcycle
(Lithium ion battery) Hero Splendor
On-road price (Rs) 110,416 90,697
Incentives — —
Cost to consumer (Rs) 110,416 90,697
Battery size (Kwh) 7.0
Electricity cost (Rs/kwh) 13.7
Range at full charge (km) 100
Electricity cost (Rs/km) 1.0
Electricity cost (Rs) 47,890 —
Fuel cost (Rs) — 71,364
Insurance cost (Rs)
Maintenance cost (Rs) 3,849 11,546
Total cost of ownership of vehicle
162,154 173,606
over 50,000 kms (Rs)
Source: Kotak Institutional Equities estimates
KOTAK INSTITUTIONAL EQUITIES RESEARCH 19Automobiles & Components Sector
Three-wheelers may shift to electric sooner than expected. We compared cost of
ownership of electric three-wheeler (Mahindra Treo) with CNG three-wheeler of Bajaj
Auto. As per our calculations, Mahindra Treo is `40,372 more expensive than CNG three-
wheeler after including incentives by the government but the running cost saving is
`45,495 (based on charging from normal charger) over 50,000 kms. A three-wheeler
runs at least 25,000 kms annually, so we estimate that the customer will recover his
higher capital cost in 2 years. Even if we exclude the government incentive, the customer
will recover his upfront capital cost in 4 years. A customer runs a three-wheeler at least
for 10-15 years, so it is quite possible that customer will shift to electric provided electric
three-wheeler could match the performance of CNG three-wheeler.
Post BS-VI, the cost of CNG three-wheeler will increase by `5,000, then the breakeven for
electric three-wheeler versus CNG three-wheeler will reduce to less than 2 years (with
government incentives) and less than 4 years (without government incentives).
By 2030, we expect battery prices to fall to US$100/kW-hr, which will result in upfront
cost of e-rickshaw lower than that of CNG/diesel rickshaw. Hence, we expect e-rickshaw
to become cheaper than CNG/diesel rickshaw by FY2030. However, we believe
infrastructure constraints in the rural areas will hinder complete transition towards e-
rickshaws. Hence, we expect that 52% of three-wheelers will shift to electric by
FY2030 in India.
Exhibit 27: We expect electric vehicles to form 52% of the total three-wheeler volumes by FY2030
Annual volume forecasts for three-wheelers, March fiscal year-ends, 2019-30 (mn units, %)
Electric fleet
3W ICE Electric proportion (%)
2019 0.7 0.7 —
2022 0.8 0.7 0.1 8.0
2025 0.9 0.6 0.3 28.0
2030 1.1 0.5 0.6 52.0
CAGR (%) 3.8 (1.9)
Source: Kotak Institutional Equities estimates
Exhibit 28: We expect electric vehicles to form 30% of the total three-wheeler population by FY2030
Annual population forecasts for three-wheelers, March fiscal year-ends, 2019-30 (mn units, %)
Electric fleet
3W ICE Electric proportion (%)
2019 5.4 5.4 —
2022 6.2 6.1 0.1 1.5
2025 7.2 6.6 0.6 8.3
2030 9.3 6.5 2.8 30.2
CAGR (%) 4.2 1.4
Source: Kotak Institutional Equities estimates
20 KOTAK INSTITUTIONAL EQUITIES RESEARCHSector Automobiles & Components
Exhibit 29: E-three wheelers are cheaper than CNG three-wheelers on total cost of ownership
Comparison of the cost of ownership of an electric three-wheeler with that of a CNG three-wheeler, April
2019, Prices of electricity and vehicle as of Mumbai
Mahindra Treo SFT Bajaj RE CNG
On road price (Rs) 325,053 234,681
Incentives (Rs) 50,000 —
Cost to consumer (Rs) 275,053 234,681
Battery size (Kwh) 7.4
Electricity cost (Rs/kwh) 8
Range at full charge (km) 130
Electricity cost (Rs/km) 0.5
Electricity cost (Rs) 22,677 —
Fuel cost (Rs) — 63,171
Maintenance cost (Rs) 5,000 10,000
Total cost of ownership of vehicle over
302,730 307,852
50,000 kms (Rs)
Source: Kotak Institutional Equities estimates
Exhibit 30: Upfront capital cost of e-rickshaws will be lower than CNG/diesel rickshaws by FY2030
Comparison of the cost of ownership of an e-rickshaw with that of a CNG rickshaw, March fiscal year-end,
2030
Mahindra Treo SFT Bajaj RE CNG
On road price (Rs) 260,053 291,796
Incentives (Rs) — —
Cost to consumer (Rs) 260,053 291,796
Battery size (Kwh) 7.4
Electricity cost (Rs/kwh) 8
Range at full charge (km) 130
Electricity cost (Rs/km) 0.5
Electricity cost (Rs) 22,677 —
Fuel cost (Rs) — 63,171
Maintenance cost (Rs) 7,697 15,395
Total cost of ownership of vehicle over
290,427 370,362
50,000 kms (Rs)
Source: Kotak Institutional Equities estimates
Shift to electric in passenger vehicle segment will be muted. We compared cost of
ownership of electric passenger vehicle with Maruti Swift VXi petrol. We have computed
cost of electric car with 40 kW-hr battery capacity, which can give a range of 200 kms on
single charge for comparison with a hatchback for our analysis.
Electric car will likely be `585,500 more expensive than Maruti Suzuki VXi petrol after
including incentive by the government, but the running cost saving is `128,000 (based on
charging from normal charger) over 50,000 kms. Hence, customer can break even on his
higher capital cost at around 228,000 kms (typically 23 years assuming average 10,000
kms run annually). If we remove government incentive of `110,000, electric car is
`695,500 more expensive than Swift and the breakeven increases to 27 years. Hence, in
terms of cost of ownership electric cars are still very expensive than petrol cars due to
higher size of lithium ion battery in electric cars.
KOTAK INSTITUTIONAL EQUITIES RESEARCH 21Automobiles & Components Sector
Post BS-VI, the cost of petrol Swift will increase by `14,000, then the breakeven for electric
car versus petrol car will reduce to 22 years (with government incentives) and 26.5 years
(without government incentives). When the lithium ion battery price reduces to
US$100/kW-hr by CY2030 from US$250/kW-hr currently, the electric car cost will reduce
by `350,000 and assuming petrol car price increases by 20% by then from current levels,
then also the breakeven for electric car versus petrol car will only reduce to 5 years. Hence
we believe in the personal car segment, shift to electric cars will be very limited until the
government gives significant incentives. The charging of cars at home also takes 8-10
hours to charge an 11 kW-hr battery currently in Mahindra e20, which is not practical. So
the cars will need to incorporate DC chargers and inverters for fast charging of cars at
home and the government will need to install fast chargers across cities to support
electric cars.
In the taxi segment, the economics is more favorable for electric taxis than in personal
segment due to higher usage of cars in the taxi segment. A taxi operator drives around
30,000 kms a year and we assume an electric car will need at least 200 km range in the
electric car with a DC charger and inverter for fast charging. As per calculations, the taxi
operator can break even his upfront capital cost after 55,000 kms at current cost, which
is approximately 1.8 years. A taxi driver drives the taxi at least for 60,000 kms, so the
economics for electric car should work in the taxi segment. The availability of charging
infrastructure will be essential for the electric cars to pick up pace in the taxi segment.
However, the economics will still be unfavorable for electric cars in this segment even
when battery costs reduce to US$100/kW-hr from current US$250/kW-hr as the
breakeven will still be around ~5.4 years (without government incentives). We believe
transition to electrification in the car segment will take more time and will mostly happen
in the fleet segment initially, given the government’s aggressive push towards electrifying
the automotive industry. Hence, we estimate that only 5% of passenger vehicles will
shift to electric by FY2030 in India, which will be mostly taxi segment. The taxi
segment forms 7-8% of passenger vehicle industry in India currently.
Exhibit 31: We expect electric vehicles to form only 5% of the total PVs volumes by FY2030
Annual volume forecasts for PVs, March fiscal year-ends, 2019-30 (mn units, %)
Electric fleet
PV ICE Electric proportion (%)
2019 3.4 3.4 —
2022 4.2 4.1 0.0 0.7
2025 5.3 5.2 0.1 2.0
2030 7.6 7.2 0.4 5.0
CAGR (%) 6.4 6.0
Source: Kotak Institutional Equities estimates
Exhibit 32: We expect electric vehicles to form 2% of the total PV population by FY2030
Annual population forecasts for PVs, March fiscal year-ends, 2019-30 (mn units, %)
Electric fleet
PV ICE Electric proportion (%)
2019 26.3 26.3 —
2022 39.3 39.2 0.1 0.2
2025 49.9 49.6 0.3 0.6
2030 82.0 80.6 1.5 1.8
CAGR (%) 9.1 9.0
Source: Kotak Institutional Equities estimates
22 KOTAK INSTITUTIONAL EQUITIES RESEARCHSector Automobiles & Components
Exhibit 33: Electric cars cost of ownership is significantly higher than petrol cars
Comparison of the cost of ownership of an electric car versus petrol car, April 2019, prices of electricity and
vehicle as of Mumbai
Model electric car Maruti Swift Vxi
On road price (Rs) 1,395,547 700,074
Incentives 110,000 —
Cost to consumer 1,285,547 714,074
Battery size (Kwh) 40
Electricity cost (Rs/kwh) 8
Range at full charge (km) 200
Electricity cost (Rs/km) 1.6 —
Electricity/Fuel cost (Rs) 80,000 280,536
Insurance cost (Rs) 151,178 53,786
Maintenance cost (Rs) 25,000 50,000
Total cost of ownership of vehicle over
1,541,725 1,098,395
50,000 kms (Rs)
Source: Kotak Institutional Equities estimates
Exhibit 34: In taxi segment, cost of ownership of electric car is also high currently
Comparison of the cost of ownership of an electric car versus CNG car in taxi segment, April 2019, prices of
electricity and vehicle as of Mumbai
Model electric car taxi Ertiga petrol Vxi
On road price (Rs) 1,400,000 949,350
Incentives 110,000 —
Cost to consumer 1,290,000 949,350
Battery size (Kwh) 40
Electricity cost (Rs/kwh) 8
Range at full charge (km) 200
Electricity cost (Rs/km) 1.6 —
Electricity/Fuel cost (Rs) 80,000 325,000
Insurance cost (Rs) 151,178 72,937
Maintenance cost (Rs) 25,000 50,000
Total cost of ownership of vehicle over
1,546,178 1,397,287
50,000 kms (Rs)
Source: Kotak Institutional Equities estimates
KOTAK INSTITUTIONAL EQUITIES RESEARCH 23Automobiles & Components Sector
Exhibit 35: In FY2030, e-car customer will be able to break even in ~5.4 years
Comparison of the cost of ownership of an e-car with that of a gasoline car, March fiscal year-end, 2030
Model electric car Maruti Swift Vxi
On road price (Rs) 1,045,547 870,454
Incentives 0 —
Cost to consumer 1,045,547 870,454
Battery size (Kwh) 40
Electricity cost (Rs/kwh) 14
Range at full charge (km) 200
Electricity cost (Rs/km) 2.7 —
Electricity/Fuel cost (Rs) 136,827 280,536
Insurance cost (Rs) 113,263 94,295
Maintenance cost (Rs) 38,486 76,973
Total cost of ownership of vehicle over
1,334,123 1,322,257
50,000 kms (Rs)
Source: Kotak Institutional Equities estimates
Electric buses are significantly costlier than ICE buses and even luxury buses. The
shift to electric buses will be purely driven by government incentives and support as cost
of vehicles is significantly higher than normal CNG buses and even luxury buses. We
estimate only 10% of buses will shift to electric by FY2030 due to budget
constraints of the state governments.
Exhibit 36: We expect electric vehicles to form 10% of the total bus volumes by FY2030
Annual volume forecasts for bus, March fiscal year-ends, 2019-30 (units, %)
Electric fleet
Buses ICE Electric proportion (%)
2019 39,421 39,421 —
2022 47,374 44,374 3,000 6.3
2025 63,055 58,055 5,000 7.9
2030 101,551 91,551 10,000 9.8
CAGR (%) 7.6 6.7
Source: Kotak Institutional Equities estimates
Exhibit 37: We expect electric vehicles to form 7% of the total bus population by FY2030
Annual population forecasts for bus, March fiscal year-ends, 2019-30 (units, %)
Electric fleet
Buses ICE Electric proportion (%)
2019 583,172 583,172 —
2022 637,044 630,044 7,000 1.1
2025 693,403 673,503 19,900 2.9
2030 897,845 837,945 59,900 6.7
CAGR (%) 3.4 2.8
Source: Kotak Institutional Equities estimates
24 KOTAK INSTITUTIONAL EQUITIES RESEARCHSector Automobiles & Components
Exhibit 38: Electric bus cost of ownership is significantly higher than diesel bus
Comparison of the cost of ownership of an electric bus with that of a diesel bus, April 2019
Goldstone-BYD K7 bus Volvo 8400 (diesel)
On road price (Rs) 16,100,000 8,117,920
Incentives 3,912,000 —
Cost to consumer (Rs) 12,188,000 8,117,920
Battery size (Kwh) 195.6
Electricity cost (Rs/kwh) 6
Range at full charge (km) 218
Electricity cost (Rs/km) 5.4
Electricity cost (Rs) 269,174 —
Fuel cost (Rs) — 1,155,833
Maintenance cost (Rs) 100,000 200,000
Total cost of ownership of vehicle over
12,557,174 9,473,753
50,000 kms (Rs)
Source: Kotak Institutional Equities estimates
FAME-II scheme by Government of India is a step in right direction but more
investment is required to achieve targets set out by the government
The Government of India has outlined an investment of `100 bn under the FAME-II scheme
over three years (FY2020-22 period) to encourage faster adoption of electric and hybrid
vehicles. Out of this `100 bn, `86 bn will be used for subsidizing electric vehicle purchase.
The government expects this scheme would help electric and hybrid vehicles to achieve a
scale of 1.56 mn vehicles in 3 years mainly in 2-wheeler and 3-wheeler segments. Essentially,
the government expects only 2% of 2-wheeler and 3-wheeler domestic passenger vehicle
volumes to shift towards electric and plug-in hybrids by FY2022. Under the FAME-I scheme,
the government had spent only `8 bn in FY2016 and FY2017. FAME-II policy has fixed the
overall incentive at `10,000/kW-hr (capped at 20% of vehicle cost) for all vehicles except
buses and `20,000/kW-hr (capped at 40% of vehicle cost) for buses. The government is also
planning to link incentives to localization plan of EV components. As highlighted in Exhibit 33,
Tata Motors plans to localize EV components in India quite aggressively but major
localization of battery cells and battery management systems will likely happen after FY2023.
Localization of battery cells and battery management system is essential to drive down costs
and accelerate the shift towards electric vehicles, especially in the four-wheeler segment.
We estimate 26% of automobiles (except commercial vehicles) will shift to electric by
FY2030 and we estimate the government will need to spend US$40 bn over FY2020-30
period to encourage adoption of electric vehicles assuming the government will give
incentives for electric vehicles until CY2025, post CY2025, we believe electric vehicles will
achieve TCO breakeven with ICE vehicles. Savings on oil imports by the shift towards electric
vehicles will be US$25 bn over FY2020-30, while the incentives given by the government will
be higher to increase adoption of EVs.
KOTAK INSTITUTIONAL EQUITIES RESEARCH 25You can also read