Long Term Passenger Rolling Stock Strategy for the Rail Industry - Third Edition, February 2015
←
→
Page content transcription
If your browser does not render page correctly, please read the page content below
Long Term Passenger Rolling Stock
  Strategy for the Rail Industry
       Third Edition, February 2015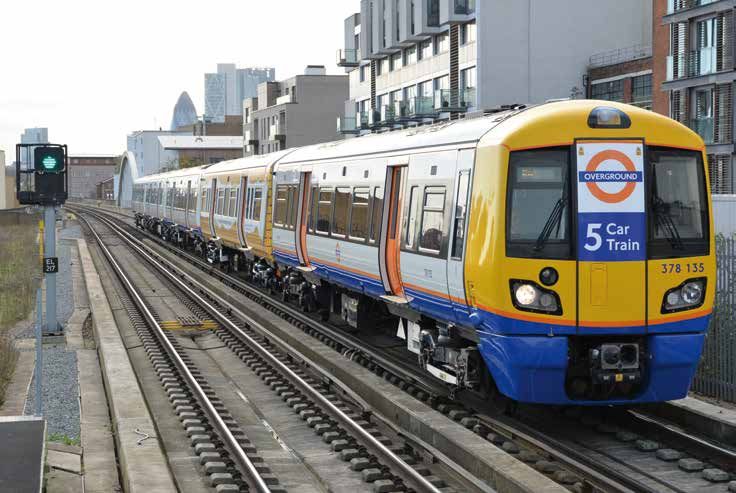
This Long Term Passenger Rolling Stock Strategy has been
produced by a Steering Group chaired by Richard Brown,
and comprising senior representatives of:
• Abellio
• Angel Trains
• Arriva
• Eversholt Rail Group
• First Group
• Go-Ahead Group
• Keolis
• National Express
• Network Rail
• Porterbrook Leasing
• Rail Delivery Group Executive Team
• Stagecoach
Now in its third edition, it incorporates input from train builders, the Railway
Industry Association, and other stakeholders.
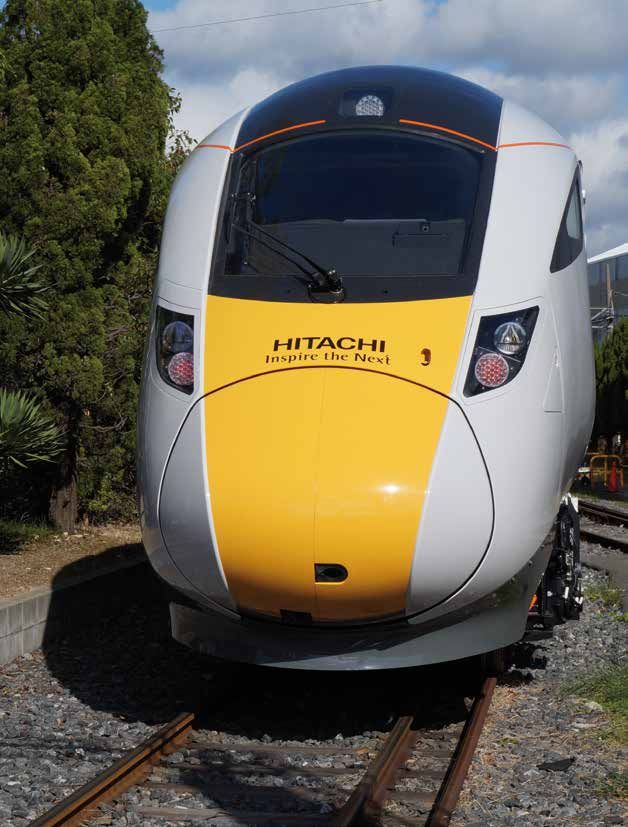
Cover Photos:
A BR-procured Arriva Trains Wales Type A Class 150 DMU of 1986; a Siemens SWT Type E Class 450
‘Desiro’ EMU introduced in 2002; and a Hitachi Southeastern Type G Class 395 ‘Javelin’ EMU of
2006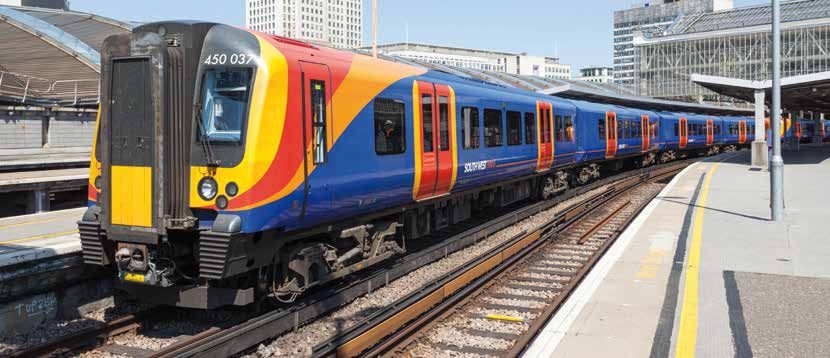
Foreword by Claire Perry MP,
Parliamentary Under Secretary of State for Transport
I would like to thank the rail industry for this most recent update of the Long Term Passenger Rolling
Stock Strategy.

I am pleased to see how it has developed since the first edition was published in February 2013. It
is now well established as a key element in the industry’s Long Term Planning Process and provides
a coherent road map for all those who are involved with the improvement and expansion of the
railway network and its train services.

Since 2004, the UK has seen the largest growth in the number of rail passenger journeys in Europe.
We are moving more people to more places than ever before – passengers who expect ever-
higher levels of reliability, comfort and services such as Wi-Fi. This incredible growth brings many
challenges, but is being matched by a level of investment in railway infrastructure and new trains
that is without precedent in recent times. We know that we are playing catch-up, with an ever-
increasing number of passengers travelling on fleets which will continue to require refurbishment
and renewal. It is absolutely vital that investment in rolling stock keeps pace with this Government’s
massive investment in track and infrastructure. In addition to the benefits for passengers, this will
produce a major potential benefit for the economy and will open up export opportunities for railway
vehicles, equipment and expertise.

It is also good to see tangible evidence of steps to grow the numbers and skills of the rail engineering
workforce, with the construction of the National Training Academy for Rail at Northampton, and the
National College for High Speed Rail in Birmingham and Doncaster. It can truly be said that there has
never been a better time to seek employment in the rail industry.

The future is bright, and the committed construction of large fleets of innovative trains will bring
many benefits for passengers, the economy and the environment.

Claire Perry MP

Contents

    6   A. Introduction - Goals and Scope

    8   B. Principal Changes Incorporated in this Third Edition of the RSS

    9   C. The Approach Adopted for the Strategy

   11   D. Planning for Growth - Sources of the Assumptions Adopted

   14   E. Electrification – Prioritisation and Analysis

   16   F. The Present Fleets and Future Capability Requirements

   19   G. Fleet Sizes and Compositions Calculated for each Scenario

   22   H. Rolling Stock Requirements in CP5 and CP6

   25   I. Customer Benefits and Fleet Reliability

   28   J. Standardisation Issues

   30   K. Depot and Infrastructure Requirements

   33   L. Improving Value for Money from the Rolling Stock Fleets

   36   M. Conclusions

        Appendices:
        • Timelines of Key Activities
        • Categorisation of Rolling Stock Types
        • Committed Rolling Stock for Delivery in CP5 and CP6

   46   Glossary

A BR-procured Northern Rail Type A Class 142 ‘Pacer’ DMU introduced in 1985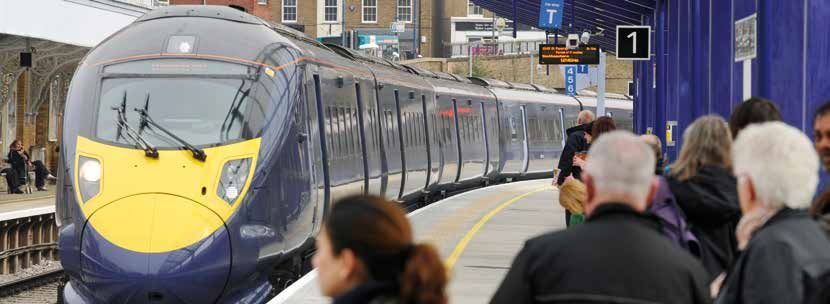
Executive Summary
This is the third edition of the Long Term Passenger Rolling Stock Strategy (RSS), first published in
February 2013. Like its predecessors it sets out a range of forecasts for the likely size and mix of the
national rolling stock fleet to accommodate future passenger numbers over 30 years. Produced by a
pan-industry group comprising vehicle owners, operators and maintainers, Network Rail and the Rail
Delivery Group, it has been welcomed by government, investors, and other stakeholders.

The analysis is based on the medium term and long term forecasts of peak period passenger demand
that are used for rail industry planning purposes and are recognised by government. Over the next
2-3 years the RSS will become increasingly focused on providing inputs to the industry-wide planning
process for the five-year regulatory Control Period commencing in April 2019 (CP6).

In the previous edition of the RSS we expressed some concerns about the present need to let
short contracts with some existing franchisees, and about the limitations on the DfT’s operating
expenditure budget. It is now clear, however, that these factors are not preventing longer term
considerations (such as the benefits of improved quality and efficiency produced by new trains) from
influencing investment decisions. The number of new electric vehicles committed for delivery in
the five-year period that commenced in April 2014 (CP5) and in the early years of CP6 has continued
to rise, and is now approaching 3,800. This represents a capital cost of more than £6 billion, at an
average build rate of 12 vehicles per week, compared with an average of just four vehicles per week
in the five years of CP4. Vehicle owners and train operators have also become increasingly innovative
at adapting and extending the lives of older vehicles.

The total net increase in fleet size is forecast to be lower in CP6 than in CP5, following completion
of the very large orders for the Thameslink, Crossrail and IEP projects. Britain’s rail industry and its
suppliers have several times experienced large fluctuations of demand for new vehicles and other
equipment, and it is important that this is avoided so far as possible in future if the confidence
of investors and the supply chain is to be increased. This would be helped by early Government
commitment to a specific programme of electrification for CP6.

Some new and additional non-electric vehicles will be required in CP5 and early in CP6, as a result of:
     • the existing levels of crowding and continuing strong growth of passenger demand on some
        non-electrified routes;
     • the assumed replacement of the ‘Pacer’ vehicles; and
     • the rate of completion of the committed programme of electrification.
The short-term requirement for additional non-electric vehicles is forecast to be in the range of 350
to 500 vehicles.

The longer term conclusions of the RSS are largely unchanged however. Peak and off-peak passenger
growth across all market segments is forecast to continue and it will be necessary to expand the
rolling stock fleet to avoid crowding. The total passenger fleet is forecast to grow by between 52%
in the ‘Low’ scenario and 99% in the ‘High’ scenario over the next 30 years, and the proportion
of vehicles that will use electric traction is forecast to rise from 69% today to over 90% by 2029 in
all scenarios. The analysis indicates that between 13,000 and 19,000 new electric vehicles will be
required over the 30 years to 2044. Electrification will in many cases permit longer trains, and will
enable diesel trains to be transferred to non-electrified routes, where growth has been constrained
by lack of sufficient vehicles. The modelling of electrification and growth demonstrates a reduction
in rolling stock unit costs of more than 30% in all scenarios. The strategy emphasises the resulting
benefits to passengers, including improvements to punctuality and reliability.

                                                                                                           5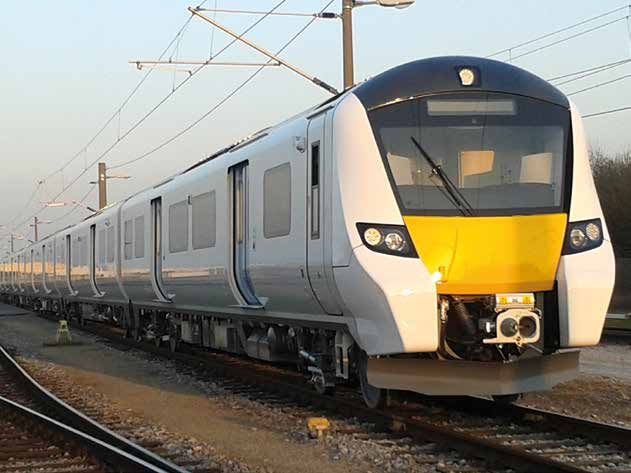
A.Introduction – Goals and Scope
    1.      This is the third annual edition of the Long Term Passenger Rolling Stock Strategy (RSS).
            The production of the first edition of the RSS in February 2013 marked the first time since
            privatisation that the industry had committed to develop a collaborative, industry-led strategy
            for passenger rolling stock. It was also the first time that the long term rolling stock implications
            of growth, electrification, HS2 and other major projects had been modelled and considered
            together. The work has been and is being led and funded by a Steering Group (RSSSG)
            comprising senior representatives of the Rail Delivery Group (RDG, including Train Operating
            Company (TOC) Owner Groups and Network Rail) and the three principal rolling stock owners
            (ROSCOs). RSSSG is chaired by Richard Brown. RSSSG has in the last year taken over the work
            on rolling stock cost reduction opportunities in CP5 and CP6 which was being developed by
            RDG. Joint meetings between RSSSG and senior members of the Department for Transport
            (DfT) Rail Executive are held twice per year.

    2.      The need for a high-level, long term RSS as a way of helping to forecast future requirements
            for fleet size and composition was originally articulated by the Association of Train Operating
            Companies (ATOC) in its discussion paper ‘Rolling Stock and Value for Money’ published in
            December 2011. That paper set out a number of proposals for delivering better value for
            money from rolling stock and was welcomed in the March 2012 Government Command Paper
            ’Reforming our Railways’. Among the recommendations of the Command Paper were that
            putting the TOCs and the ROSCOs, rather than DfT, in the lead for planning and delivering rolling
            stock through a market-based approach is the best way forward, and that development of a
            long term RSS would help shape expectations, giving more visibility to the supply chain, and
            thereby achieving long term, whole-system benefits. RSSSG has been encouraged by ministerial
            endorsement of this approach.

    3.      The fundamental aim of the RSS is as follows:

         Set out the dimensions of industry-wide rolling stock requirements over a 30-year horizon in the
         context of growth, committed and likely network developments and the direction of government
         policy, without imposing constraints on the market to deliver appropriate solutions.

         A key objective of the Strategy must be to promote better value for money from the rail industry.
         The Strategy should therefore as a minimum indicate the manner in which it might reduce not
         only rolling stock unit costs and wider industry costs, but also increase train capacity, route
         capacity and industry revenues.

    4.      The RSS is intended to add value by:
            • providing a backdrop for and an input to longer term planning, by train builders and their
               suppliers, ROSCOs, Network Rail and TOCs;
            • identifying opportunities to smooth peaks and troughs of workload;
            • highlighting priorities for further Value for Money (VfM) work;
            • facilitating a whole-system approach to strategy, bringing together infrastructure, demand
               growth, train services and fleet scenarios;
            • assisting investors to understand the longer term prospects and opportunities for the
               industry; and
            • identifying and analysing issues of concern for the medium and long term.

6
5.   From the outset, the approach adopted for the RSS has principally been to work from the
     perspective of forecast growth in long term peak period passenger demand (i.e. as opposed
     to growth in total passenger miles) and its implications for each TOC and for different types of
     rolling stock. This in turn has enabled RSSSG to develop a number of scenarios for future fleet
     size. The emerging work has been discussed regularly with the train builders that are members
     of the Railway Industry Association (RIA), and this is continuing. RIA, the train builders and their
     suppliers have welcomed the creation of the RSS and its annual updates, and the RSS will be a
     key input to the Industrial Strategy and ongoing work of the newly-formed Rail Supply Group
     (RSG). The first edition of the RSS fed into the CP5 Industry Strategic Business Plans, for England
     & Wales, and for Scotland respectively, published in January 2013. The RSS is now established
     as an integral part of the industry’s Long Term Planning Process (LTPP). The LTPP was endorsed
     by the Office of Rail Regulation (ORR) in April 2012 and focuses principally on infrastructure
     requirements and also has a 30-year horizon. The combination of this RSS and the LTPP work –
     together with the plans for new high speed rail infrastructure, all to be regularly updated - will
     continue to provide the overall picture for rail development over the next thirty years. The RSS
     is now focussing increasingly on the inputs for CP6:
     • The Initial Industry Plans (IIPs, September 2016);
     • The High Level Output Specifications (HLOSs, June 2017); and
     • The Industry Strategic Business Plans (ISBPs, January 2018).

6.   In the first RSS published in February 2013, RSSSG set out the key principles which should apply
     with regard to the provision of rolling stock. Alongside government’s important role in setting
     out the strategic direction and the desired outcomes, these were that:
     • the franchising model is the best mechanism to deliver value for money rail services;
     • rolling stock provision should be the result of market-driven solutions, procured in a
         competitive environment; and
     • the whole-life, whole-system costs and benefits of rolling stock must be optimised.

7.   In its second edition, published in February 2014, the RSS:
     • considered the implications of the then recently-announced changes to the franchising
         programme and the DfT’s role in negotiating some new short franchises in the form of Single
         Tender Actions (STAs) with incumbent TOCs (see Section B on page 8);
     • updated and rolled forward the forecasts for the size and composition of the national
         passenger fleet to 2043 in the light of forecasts of peak passenger demand over 10 years and
         30 years as included in the Market Studies published by Network Rail in October 2013 (see
         Sections D, G and H on pages 11, 19 and 22);
     • considered how standardisation of rolling stock, subsystems and/or their key outputs can
         help to optimise route capacity and provide other benefits (see Section J on page 28); and
     • produced a high level estimate of incremental depot and berthing requirements that will be
         required over 10-year and 30-year horizons, as an input to the LTPP (see Section K on page 30);
     • summarised the key dates relating to franchising, electrification and other infrastructure
         enhancements, deliveries of new rolling stock and other significant rolling stock
         enhancements in a series of Timeline charts (see Appendices 1 to 3).

These and the other sections of the RSS have all now been refreshed and updated as necessary in the
light of new information. The principal new material and assumptions contained in this third edition
of the RSS are summarised in Section B on the next page.

                                                                                                            7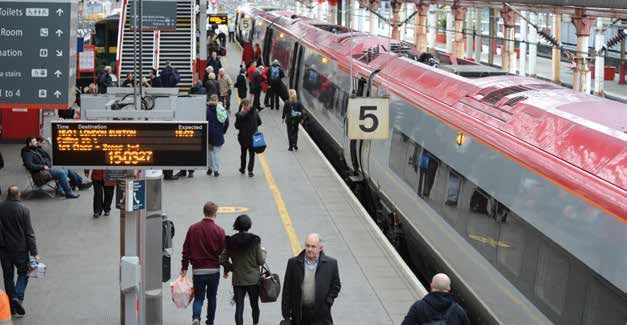
B. Principal Changes Incorporated in this Third Edition of the RSS
    8.   In the February 2014 RSS we expressed concern that two of the first three new franchises then
         being let in England and Wales were heavily shaped by the large centrally-procured contracts
         for the Intercity Express Programme (IEP) and the trains for the Thameslink project respectively;
         and that the scope for adopting the principles of paragraph 6 above might be further curtailed
         by the DfT’s need to negotiate STAs with some existing franchisees, limitations on the DfT’s
         operating expenditure budget, and the need for the DfT to rebuild its rail resources and
         capabilities.

    9.   We recognised the short term pressures faced by the DfT, but stated that we believed that the
         principles of our approach still held true and that it was important to mitigate the risks which
         those pressures might pose to securing long term value for money.

    10. In particular, we stated that care must be taken that:
        • guidance from DfT should not be interpreted as, and should not become (however
            inadvertently), the specification of inputs;
        • short term savings in rolling stock costs to meet the DfT’s medium term budget constraints
            should not be made at the expense of whole-life, whole-system value. (For example, the
            business case for some enhancements such as re-tractioning for some older fleets would
            become progressively weaker, the longer that they were deferred); and
        • the need for short term action should not constrain competitive tension and innovation.

    11. RSSSG undertook a constructive dialogue with the DfT on these issues. We are pleased to
        report the strong evidence that the DfT (and Transport Scotland and Transport for London
        (TfL)) do indeed understand the longer-term opportunities to secure value for money from
        rolling stock. In particular it will be noted that our forecasts contained in Section H on page
        22 of the quantities of new rolling stock to be delivered in CP5 and CP6 have been significantly
        increased by the confirmation of additional orders for new trains for the new Essex Thameside,
        Thameslink (for Gatwick Express and Moorgate services), ScotRail and Caledonian Sleepers
        franchises, the South West Trains (SWT) TOC, and the London Overground concession. A
        material factor here has been the inclusion in franchise ITTs and in franchise bid evaluation
        criteria for credit to be given for incremental quality to be delivered, and in some cases for
        benefits to be delivered beyond the life of the franchise.

    12. The increased emphasis on credit being given for quality to be delivered by franchises and
        concessions, which RSSSG totally supports, together with continuing high levels of growth in
        peak period passenger demand and concerns about the pace of completion for the committed
        electrification projects, has made it certain that some additional non-electric rolling stock will
        be required in CP5. This is discussed in Sections E, F, G and H on pages 14 to 24.

    13. A new section I has been added on pages 25 to 27. This emphasises the customer benefits of
        the RSS, including improvements in punctuality to be produced by growth in fleet reliability.

    14. Against this background, the analysis undertaken for the February 2014 RSS has been reviewed
        and rolled forward to 2044. The long term conclusions about the size and composition of
        the fleet are largely unchanged, being demand-led and based on a range of assumptions and
        scenarios for growth in peak passenger demand and for future railway electrification.

8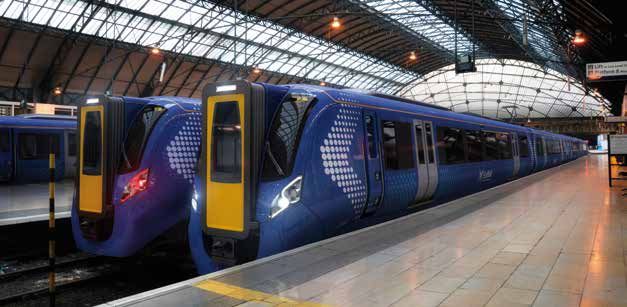
C. The Approach Adopted for the Strategy
15. Scenarios for fleet size have been modelled by five-yearly Control Period for the whole of the
    ‘main line’ passenger fleet including Scotland, London Overground, Crossrail, and HS2 but not
    the light rail, tram-train, LUL, or international fleets.

16. Each of the existing fleets has been categorised by one of seven generic types of train:
    A. Shorter Distance Self-Powered (diesel, generally with 75 mph maximum speed);
    B. Middle Distance Self-Powered (diesel, with 90/ 100 mph capability);
    C. Long Distance Self-Powered (diesel, with 100/ 110/ 125 mph capability);
    D. Shorter Distance Electric (generally with 75 mph maximum speed);
    E. Middle Distance Electric (with 90/ 100/ 110 mph capability. Some future trains may require
       115 or 125 mph capability);
    F. Long Distance Electric (with 100/ 110/ 125/ 140 mph capability); and
    G. Very High Speed Electric (140 mph and above, for domestic services on HS1 and HS2).

17. In response to requests, information about which of the existing fleets have been categorised
    in each of these seven categories is contained in Appendix 4. Individual class numbers have
    not been used in the analysis of future fleet sizes beyond CP5. The RSS is not a ‘cascade plan’
    for the deployment of rolling stock, nor is it in any way prescriptive. Consistent with RSSSG’s
    support for market-based approaches, it is in no sense intended to constrain TOCs and funders
    from making the best possible decisions about rolling stock procurement, maintenance,
    enhancement, life extension and replacement based on thorough business case analysis at the
    time.

18. To develop these scenarios, we started with expectations for growth in peak period passenger
    demand, using the long term forecasts contained in the Route Utilisation Strategies (RUSs)
    published by Network Rail in 2011. These forecasts were consistent with those in the ISBPs
    published in January 2013. As outlined in Section D on page 12, we subsequently tested our
    projections using forecasts of peak period passenger demand over ten years and 30 years
    as included in the Market Studies published by Network Rail in October 2013. We then
    incorporated the effect of electrification scenarios by examining the various options listed in
    the 2009 Electrification RUS and prioritising these. To do this, we drew on the methodology
    used in that RUS and concentrated principally (but not solely) on those route sections where
    electrification would permit more efficient operation of passenger trains.

19. Using these inputs, three composite scenarios were defined and modelled as follows.
    • ‘Low’ - Low growth combined with a good level of capacity utilisation efficiency growth
       (this is the relationship between peak passenger demand growth and fleet size growth, see
       paragraphs 25 and 29 below) and a low level of future electrification.
    • ‘Medium’ - Medium growth combined with a medium level of capacity utilisation efficiency
       growth and a medium level of future electrification.
    • High’ - High growth combined with a poor level of capacity utilisation efficiency growth and a
       high level of future electrification.

20. At the heart of the RSS, and facilitating its future updating, is a spreadsheet model. The RUS-
    based peak period passenger demand forecasts for growth and the selected electrification
    scenarios are route-specific, and these have been used to provide bottom-up inputs to the
    spreadsheet model using the existing franchise map for convenience (with the addition of
    Crossrail and HS2). For each TOC, the total fleet size has been determined for each of the three
    composite scenarios in the year 2044, and the implications for each of Control Periods CP5 to
    CP8 have then been determined by working backwards from that date.

                                                                                                       9
21. These forecasts and scenarios for long term peak period passenger demand growth, fleet
         utilisation efficiency growth and electrification cannot, of course, quantify unpredictable
         external factors (e.g. energy shortages), or options for future government policy e.g. in relation
         to fares policy, investment in rail infrastructure, policies on crowding, road pricing etc. The RSS
         has taken some account of such uncertainties by developing the three composite scenarios and
         by treating the RSS as a living entity. As is demonstrated by the fact that this is now the third
         edition of the RSS, the intention is that RSSSG will continue to update the RSS to reflect industry
         and external developments including the franchising programme and emerging government
         policy.

     22. The electrification programmes considered and modelled are illustrative. Since publication of
         the first edition of the RSS in February 2013, Network Rail has also undertaken an update of the
         Electrification RUS that was published in 2009 - see Section E on page 14. This will be published
         for consultation in the very near future. Network Rail has also published more details of the
         CP5 infrastructure enhancements programme through its CP5 Enhancements Delivery Plan.
         This is updated every three months, as more detail of scope and milestones become available
         for each significant project. When the CP5 Enhancements Delivery Plan was first published,
         many of the projects (about £7bn out of £12.4bn) were at an early stage of development, with
         high degrees of uncertainty and risk. This made it difficult for the ORR to determine efficient
         levels of funding. The ORR has therefore set up the Enhancements Cost Adjustment Mechanism
         (ECAM) to determine the levels of funding required when a single option has been identified for
         each project.

     23. The 2011 RUSs contain, and the new Route Studies will update, many route-specific
         infrastructure and timetable options for increasing capacity over the next five to 30 years.
         Some of the presently committed enhancements including the Thameslink, Crossrail and HS2
         projects will provide additional capacity well beyond these timescales. On many routes it will
         be possible to lengthen trains or run more trains within the existing infrastructure. On others,
         schemes to be included in the Route Studies would be needed to provide sufficient paths,
         station capacity, depots and rolling stock stabling capacity. The costs and benefits of many of
         these schemes have not yet been established. The LTPP will address these issues progressively,
         route by route, repeated and updated on a five-year cycle. Train operators, ROSCOs and
         Network Rail work through these processes to help find good value for money outcomes and to
         develop an overall rail development strategy, mindful of the need to improve industry efficiency
         and to reduce total levels of subsidy. Further information about incremental infrastructure,
         maintenance depots and berthing capacity is contained in Section K on page 30.

     An Alstom Virgin West Coast Type F Class 390 ‘Pendolino’ train introduced in 2001

10
D. Planning for Growth – Sources of the Assumptions Adopted
24. Total passenger miles grew by 106% in the 19 years between 1994 and 2013, an average
compound rate per year of 3.9%. (Source: ORR data). Even in the six years of lower economic
growth after 2007, the average annual growth in passenger miles was 3.5%, significantly out-
performing other transport modes in Great Britain and other railways in Europe. (See ‘Growth
and Prosperity’ published by ATOC in July 2013). This indicates that the rail industry has
successfully increased volumes through actions such as capacity improvement, marketing and
new trains. This generates more revenue, which helps pay for the very substantial investment
programme that the industry is undertaking in CP5. The same opportunity exists in future to
help pay for capacity improvement.
25. To assess the implications for the number of vehicles needed in the future, we examined
the long term relationship between demand and passenger fleet size. The 106% increase
in passenger miles to 2013 was achieved with an increase of just 11% in the total national
passenger fleet size. This major increase in fleet utilisation efficiency since privatisation has
been achieved by much improved marketing and utilisation of spare off-peak capacity, and has
been assisted by the following factors:
• Replacement of Mark 1 EMUs and DMUs and Mark 2 coaching stock with sliding-door
vehicles, which provided more capacity for peak period passengers;
• Introduction of trains with metro-style interiors for some inner suburban services south of
the River Thames;
• Elimination of most locomotives and non-passenger carrying vehicles for the Virgin West
Coast and CrossCountry TOCs (meaning that more of the train is available for carrying
passengers);
• Achievement of higher levels of fleet availability, and of higher average train speeds on some
routes;
• Introduction of automatic passenger load weighing and counting technology on many fleets
(which has led to more efficient utilisation of rolling stock).
In spite of these factors, peak period crowding has become a problem on many routes. This has
led to the major programmes of investment in infrastructure and rolling stock which are now
coming to fruition in CP5.
26. The forecasting methodology adopted for the RUSs and Route Studies focuses primarily on
route-specific peak period passenger volumes and peak capacity, since that is what determines
strategic level planning of railway infrastructure, rolling stock and timetables. Peak period
passenger demand has risen more slowly than off-peak passenger demand, but is nevertheless
significant. For example, in the last three years, morning peak TOC passenger numbers into
London have increased at a compound rate of 1.5% per year, while the average for ten regional
cities in England and Wales has been 2.6% per year. (Source: DfT data).
27. The fleet size growth forecasts in the Medium scenario of the RSS are based directly on the
route-specific forecasts of long term growth in peak period rail passenger demand that are
included in the 2011 RUS documents, extrapolated to 2044. In the case of peak flows to and
from London, the L&SE RUS methodology has the merit of taking account of present levels of
peak crowding.
28. The Low and High growth forecasts represent a range of possible outcomes for future rolling
stock capacity requirements. For all routes, these Low and High forecasts of future fleet
capacity have been modelled as 0.7 and 1.3 respectively (i.e. ± 30%) of the Medium forecast
of the required fleet capacity in 2044, this being judged to be a reasonable range of likely
outcomes making allowance both for uncertainties in future peak period passenger demand
growth and in future capacity utilisation efficiencies.
1129. Growth in peak demand of higher than the Medium case may occur, as each additional
(presently uncommitted) future route enhancement or service enhancement may itself produce
some additional peak period growth requiring fleet growth. Conversely, the franchise bidding
process can unlock opportunities to improve capacity utilisation further (for example through
improvements in fleet availability or fleet utilisation). This would be facilitated by flexibility in
franchise specifications and change mechanisms in franchise contracts, and by TOCs continuing
to adopt and improve the range of ideas listed in paragraph 25 above. The easiest of such
opportunities have already been implemented, but more can be achieved through the effective
specification and management of franchises. This can be facilitated by:
• continuing improvements in timetable patterns;
• introduction of more vehicles with ‘metro’-style interiors for short-distance services for
which the DfT has for some time permitted higher levels of standing, coupled with some
greater route-specific flexibility in franchise specifications regarding standing in peak periods
for middle distance services;
• introduction of new industry-wide metrics for and benchmarking of peak capacity utilisation,
as an aid to effective management of capacity;
• changing the profile of peak demand; and
• replacement over time of many or most of the remaining trains formed of Mark 3 and Mark
4 rolling stock which have non-passenger carrying vehicles (locomotives, power cars and
driving trailer vehicles).
30. Network Rail published three new Market Studies in October 2013, for the L&SE, Long-Distance
and Regional Urban markets respectively which underpin the next five-year cycle of the LTPP.
The peak period passenger demand forecasts contained in the Market Studies will form an input
to the Route Studies being published by Network Rail over the next three years.
31. The Market Studies are important in that:
• they provide forecasts of peak passenger demand by main route (and for the principal
regional cities) in 2023 and 2043, whereas the previous 2011 RUS documents covered a
period of around 20 years only; and
• they incorporate four alternative composite long term demand scenarios comprising a wide
range of macro-economic and micro-economic factors, demographics, ‘consumer tastes’, and
‘the supply of travel opportunities’.
32. The demand forecasting methodology used in the Market Studies is very close to that used in
the 2011 RUS documents. We have checked the range of 30-year forecasts contained in the
Market Studies and have identified a high degree of consistency with the range of the national
fleet size forecasts for 2044 as published in Table 3 of this RSS. A ‘Conditional Output’ specified
in each of the Market Studies is to plan to accommodate the high growth scenario in passenger
journeys forecast to occur by 2043. The Route Studies use the high growth scenario for each
route or regional city contained in the Market Studies, as the basis for developing 30-year
options for future infrastructure capacity on each route.
33. Additional data is provided in the Market Studies in the form of 10-year forecasts for peak
passenger demand growth for all of the principal routes to London, for ten regional cities in
England and Wales, and for all-day flows between pairs of 13 British cities. The degree of
overall correlation with the RSS Table 3 figures for fleet sizes in 2024 is again good. As in the
February 2014 RSS, this has provided a 10-year focus on future fleet sizes, as described in
Sections G and H on pages 19 to 24.
1234. We have also included estimates of fleet requirements for HS2 based on the latest available
information from HS2 Ltd and discussions with them about options for growth after initial
service introduction. We have adopted a wide range of assumptions in the three scenarios for
the rolling stock volumes that will be required to operate high speed and intermediate services
on the existing long-distance routes after capacity has been released by HS2.
The first Hitachi Type F Class 800 ‘Super Express Train’, to be introduced on the Great Western and
East Coast routes from 2017
13E. Electrification – Prioritisation and Analysis
35. As outlined in this RSS, route electrification offers major new opportunities to reduce unit
costs of rolling stock operation and to provide additional capacity, reliability and environmental
benefits as the network progressively shifts from relying heavily on diesel trains on many of the
nation’s principal long-distance and commuter routes to one in which diesels are increasingly
used only on the more lightly used secondary routes.
36. The present total national Network Rail track mileage is 19,336 single track miles (excluding
depots and sidings, referred to in this RSS as ‘track miles’ - source Network Rail Annual Return
2014). Of this, 8,008 track miles (41.4%) are electrified and 11,312 track miles (58.6%) are
non-electrified. 64 track miles of new electrification were completed in 2013/14, in the North
West of England and in Scotland. In the whole of CP4 there were 204 track miles of new
electrification. Following the completion of around 1,850 track miles of electrification currently
authorised, 51% of total track miles will be electrified. The currently assumed completion
dates for all of the committed electrification schemes are shown in the Timelines contained
in Appendices 1 to 3, based on Network Rail’s CP5 Enhancements Delivery Plan published in
December 2014.
37. Although the DfT cannot yet commit to a rolling programme of electrification beyond CP5, the
direction of government policy is to continue such a programme into CP6 and beyond. Views
were sought by the DfT on this in response to the 2012 HLOS. The formal response of Network
Rail (supported by inputs from an industry-wide stakeholder group) will be contained in the
update of the Electrification RUS, to be published for consultation in the near future. Separately
an Electrification Task Force, led by MPs and Rail North with advice from Network Rail, will
present the case for further electrification in the North of England. Transport Scotland’s CP5
HLOS already contains a specific objective of a rolling programme of electrification amounting
to approximately 60 single track miles per annum, following the completion of the Edinburgh to
Glasgow Improvements Programme (EGIP) electrification.
38. The 2009 Electrification RUS listed 131 route sections as candidates for future electrification.
Each route was rated by Network Rail in the RUS in relation to four separate criteria:
A. Facilitating efficient operation of passenger services;
B. Facilitating efficient operation of freight services;
C. Providing diversionary routes for electric trains; and
D. Facilitating new electrified passenger services.
39. For ranking in terms of ability to facilitate efficient operation of passenger services, Network Rail
calculated a metric for each route section of the total number of annual passenger vehicle-miles
which might be converted from diesel to electric operation, divided by the number of track
miles requiring electrification in that route section (with a higher number indicating a probable
better case in that the cost of electrification does not greatly increase with usage of the route).
40. Taking account of this data, and the extent to which electrification would release good mid-life
diesel units to increase capacity where needed on other non-electrified routes, and also taking
some regard of the other ranking factors in paragraph 38 above, we produced an indicative
ranking of route sections that might be electrified in CP6 and beyond (subject to business case
development, affordability and negotiation of satisfactory commercial terms).
41. Low, Medium and High scenarios for electrification have been constructed as shown in Table
1 below. This is a strategic view only, designed to give a potential sense of scale for the
electrification programme beyond CP5. The timing and phasing of electrification of individual
14routes have been considered in the updated Electrification RUS, and will be determined through
the LTPP. The ranking and evaluation of electrification schemes provides a pool of possible
projects from which a long term rolling programme could be constructed. The RSS is intended
to illustrate and quantify the implications which such a rolling programme might have for the
national passenger rolling stock fleets.
Table 1 – Illustrative Electrification Scenarios (% of Total Track Miles that might be
Electrified by the end of CP8 in 2034)
Low Medium High
% Electrified 62% 71% 77%
Source – Analysis based on data provided by Network Rail from the 2009 Electrification RUS
42. We have adopted the results from a sensitivity test on the ‘Low’ scenario of the RSS to illustrate
what would be the consequences of a slower overall rate of electrification in CP5 through to
CP7, pending the development of new assumptions once an electrification programme for
CP6 is developed through the LTPP and is approved by government. Any reprogramming of
the completion dates of the currently planned electrification projects would have adverse
consequences as outlined in paragraph 70 below.
43. The analysis for the updated Electrification RUS has included appraisals of the business case
for electrification of many routes. When finalised this will form an input to the IIP and to
the next edition of the RSS. We are still some way from government underwriting a specific
electrification programme for England and Wales in CP6 and beyond, but the scenarios
contained in our own modelling for the RSS are consistent with the direction of government
policy.
44. Conversion of DC-electrified routes to AC or to dual-voltage capability has been ignored for
the purpose of this analysis. There is one such scheme that is being evaluated by Network
Rail in CP5, this being between Basingstoke and Southampton as part of the ‘Electric Spine’
route. Such conversion here or elsewhere, if and where there is a business case, is likely to
lead to replacement of existing BR-procured DC rolling stock and/or retrofit of existing post-
privatisation EMUs. Given that examination of the business case for DC to AC conversion is still
at an early stage, we have not made specific allowance for any replacement or modification of
these fleets. Our analysis assumes that DC to AC conversion will not lead to an increase in total
vehicle numbers beyond that which would be required for growth.
Artist’s impression of Hitachi Type E AT200 EMUs, to be introduced on ScotRail from 2017
15F. The Present Fleets and Future Capability Requirements
45. Details of the composition of all of the existing fleets (in use, rather than stored), and of
committed changes to the end of March 2015, are summarised in Table 2 below, using the
definitions in paragraphs 15 and 16 above. The totals here and elsewhere in the RSS include
both passenger-carrying and associated non-passenger carrying vehicles in passenger trains
(the latter including locomotives, power cars and driving trailer vehicles). These are not rigid
categorisations. For example, some of the existing InterCity 125 (HST) Type C diesel trains that
will be displaced by IEP trains or by electrification may be used on services currently operated
by Middle Distance Type B DMUs if their operating characteristics are suitable and if there is a
business case to do this. The committed transfer of HSTs to work in short formations on Scottish
internal intercity services is one such example.
Table 2 – Present Fleet Composition (including Committed Changes to March 2015)
Generic Type Total Vehicles, March 2015
A. Shorter Distance Self-Powered (diesel, 1,057
generally with 75 mph maximum speed);
B. Middle Distance Self-Powered (diesel, with 1,357
90/ 100 mph capability);
C. Long Distance Self-Powered (diesel, with 100/ 1,495
110/ 125 mph capability);
D. Shorter Distance Electric (generally with 75 2,366
mph maximum speed);
E. Middle Distance Electric (with 90/ 100/ 110/ 5,178
115/ 125 mph capability);
F. Long Distance Electric (with 100/ 110/ 125/ 1,148
140 mph capability);
G. Very High Speed Electric (140 mph and 174
above, for domestic services on HS1 and HS2).
TOTALS 12,775
Source: Analysis from ROSCO and ATOC data for the end of March 2015
46. Figure 1 on the next page shows that, of the 12,775 vehicles:
• 6,104 (48%) have been built since privatisation (i.e. in the last 18 years); and
• 1,023 (8%) are owned by parties other than the three largest ROSCOs (e.g Voyager Leasing),
principally in categories C, D and E.
16Figure 1 Present Age and Ownership of the National Passenger Rolling Stock Fleet
Age of Existing Fleets
13% BR 1970s
BR 1980s
48% 23% BR 1990s
Post Privatisation
Ownership of Existing Fleets
16%
Angel 8%
Eversholt 34%
Porterbrook
31%
Other
27%
Source: Analysis from ROSCO and TOC
data for the end of March 2015
47. For the future, ‘Self-Powered’ units will include any type of train which cannot collect electrical
power when in motion, from an overhead or third rail source. This may include classic diesel-
powered units and also ‘hybrid’ units incorporating an internal combustion engine or fuel cell
with some form of electrical or mechanical energy storage. ‘Electric’ units include not only
straight-electric but also ‘bi-mode’ trains (such as Hitachi’s IEP Trains) which can both collect
power when in motion from an overhead or third rail source, and also generate power from an
on-board source. Some electric units may in future include some form of electricity storage for
operation away from overhead or third rail power sources, subject to a satisfactory business
case and continuing development of power storage technology. The present trial fitment of
an additional battery pack to a standard Class 379 EMU is the first such experimental project,
this being known as the Independently Powered EMU (IPEMU). FutureRailway is organising
a competition to encourage the development of novel technical solutions which can provide
improved energy efficiency for self-powered vehicles (the ‘Power Train Challenge’). Both
FutureRailway and the Rolling Stock Portfolio group of the Technical Strategy Leadership Group
(TSLG) propose to provide funding for an experimental self-powered unit that can demonstrate
these and other innovative technologies. In the long term it will be important to develop an
alternative power source for self-powered vehicles that is not dependent on diesel or other
fossil fuels, for those routes that have a very low priority or business case for electrification.
48. It has been widely expected that present and future EU legislation regarding emissions from
diesel engines (Directive 97/68/EC and its subsequent amendments, implemented in Great
Britain as the Non-Road Mobile Machinery (Emission of Gaseous and Particulate Pollutants)
Regulations 1999 and 2013, known as NRMM) will increasingly make it difficult to procure and
operate new DMUs having underfloor diesel engines, with an affordable business case. Indeed,
EU consultation on further tightening of the rules is now underway. Our present understanding
of the associated issues is as follows.
17• Existing EU and UK legislation does not prevent the continued operation of any of the
present British DMU fleets, thanks to an amendment agreed in 2011.
• None of the present British DMU fleets are at any risk of being unable to operate as a result
of non-availability of diesel engines or spare parts for diesel engines.
• Legislation prevents any more engines of the present types being manufactured for these
fleets, but engine components can be manufactured and a float of additional spare engines
will become available for the older DMUs when electrification starts to reduce the size of
these fleets in future years.
• The NRMM 2013 Directive contains an Extended Flexibility Scheme which allows engines on
existing trains to be replaced with new Stage IIIA compliant engines (rather than with the
later standard Stage IIIB compliant engines). The only Stage IIIA compliant engine currently
fitted to a British DMU is the MTU 1800 series engine fitted to the Class 172 DMUs built by
Bombardier in 2010-11. No TOC or ROSCO has to date needed to consider whether this or
any other Stage IIIA compliant engine might one day have to be fitted to any existing British
DMU.
• It is probably unlikely that a business case can be made at present to fit a Stage IIIB
compliant diesel engine (or engines) to any of the existing British DMU types. The D-Train
project being developed by Vivarail proposes to examine the feasibility, reliability and
business case of fitting pairs of smaller Stage IIIB compliant automotive diesel engines
beneath former LUL vehicles.
Further discussion of new-built or additional self-powered rolling stock being required in CP5 or CP6
is contained in Sections G and H on pages 19 to 24.
49. Some overlap is already occurring in the distinction between Categories E and F. On the south
end of the West Coast Main Line, and on other principal electrified (and to be electrified) long
distance main lines, maximum route capacity and revenues will most probably be achieved if
high capacity, high performance electric trains (in some cases with a maximum speed of 110,
115 or 125 mph) are introduced for middle distance flows. There are trade offs to be made
between track capacity and the capacity of individual trains. Trains with a top speed of more
than 117 mph lose some passenger capacity because of the EC’s Technical Specification for
Interoperability (TSI) requirements relating to passengers in the leading vehicles of higher speed
trains. (See Sections J and K pages 28 to 32).
Trial conversion of a Bombardier Greater Anglia Type E Class 379 ‘Electrostar’ EMU of 2010 to be
the first IPEMU
18G. Fleet Sizes and Compositions Calculated for each Scenario
50. As described in paragraph 19 above, the three growth and capacity utilisation scenarios have
been combined with three electrification scenarios to obtain three composite scenarios within
the spreadsheet model, for each TOC, for each Control Period to 2044. The aggregated results
are summarised in Table 3 on the next page.
51. The key developments over 30 years highlighted in Table 3 are:
• an overall increase of 52-99% in the size of the total national passenger fleet;
• the electric fleets rising from 69% of the national fleet today to 92-95%; and
• the self-powered fleets falling from 31% of the national fleet today to 5-8%.
52. It can be deduced that in the Low scenario, a minimum of 13,000 new electric vehicles would be
required by 2044, from today’s base position. This figure comprises the sum of:
• 9,000 which is the net increase in electric vehicles over 30 years, in the Low scenario;
• 4,000 to replace most of the BR-procured electric fleets (all of which will be a minimum of 50
years old in 2044).
53. In the Medium and High scenarios, this minimum total of 13,000 new electric vehicles to
be constructed by 2044 would rise to 16,000 and 19,000 respectively. This equates to a
construction requirement for electric trains averaging approximately 8, 10 or 12 vehicles per
week respectively in the three scenarios over 30 years. This would be a significant increase over
the average rate of construction of new electric and diesel vehicles during CP4 of just 4 vehicles
per week.
54. The projected changes in the size and composition of the national passenger fleet for the
Medium Scenario are shown in Figure 2.
Figure 2 – Changes in Fleet Size and Composition, 2015 - 2044 (Medium Scenario)
25,000
20,000
G. Very High Speed Electric
15,000 F. Long Distance Electric
E. Middle Distance Electric
D. Shorter Distance Electric
10,000 C. Long Distance Self-Powered
B. Middle Distance Self-Powered
A. Shorter Distance Self-Powered
5,000
0
2015 2019 2024 2029 2034 2044
Source: Analysis as in Table 3.
19Table 3 – Aggregated Results of Fleet Size Changes for the National Passenger Fleets to 2044 (Low, Medium and High Scenarios)
Committed Forecast CP5, March 2019 Forecast CP6, March 2024 Forecast CP7, March 2029 Forecast CP8, March 2034 Forecast 10, March 2044
Sub-Group Total Vehicles Total Vehicles Total Vehicles Total Vehicles Total Vehicles Total Vehicles
March 2015 Low Med. High Low Med. High Low Med. High Low Med. High Low Med. High
A. Shorter Distance 1,057 879 850 913 701 535 557 462 432 411 451 405 356 437 371 301
Self-Powered
B. Middle Distance 1,357 1,442 1,314 1,373 1,053 1,009 1,096 924 626 738 903 613 701 936 714 784
Self-Powered
C. Long Distance 1,495 1,132 1,213 1,286 690 575 631 87 149 198 87 149 198 87 149 198
Self-Powered
D. Shorter Distance 2,366 2,953 3,074 3,100 3,232 3,307 3,383 3,294 3,476 3,648 3,448 3,638 3,874 3,534 3,823 4,105
Electric
E. Middle Distance 5,178 6,442 6,729 6,837 7,560 7,972 8,171 8,548 9,443 10,134 9,291 10,548 11,730 10,227 12,060 13,795
Electric
F. Long Distance 1,148 1,728 1,749 1,782 2,189 2,575 2,697 2,522 2,989 3,436 2,246 3,010 3,799 2,496 3,382 4,298
Electric & Bi-Mode
G. Very High Speed 174 174 174 174 174 174 174 654 662 686 1,397 1,436 1,507 1,485 1,532 1,603
Electric
TOTALS 12,775 14,750 15,103 15,465 15,599 16,146 16,709 16,491 17,776 19,250 17,823 19,799 22,164 19,202 22,031 25,084
Effective Capacity
Growth on October 1% 17% 20% 22% 24% 28% 32% 31% 41% 52% 41% 57% 76% 52% 74% 99%
2014
Self-Powered Totals 3,909 3,453 3,377 3,572 2,444 2,118 2,284 1,472 1,207 1,347 1,440 1,167 1,255 1,460 1,234 1,283
Electric & Bi-Mode
8,866 11,297 11,726 11,893 13,155 14,028 14,424 15,018 16,569 17,903 16,382 18,632 20,909 17,742 20,797 23,801
Totals
Electric & Bi-Mode
69% 77% 78% 77% 84% 87% 86% 91% 93% 93% 92% 94% 94% 92% 94% 95%
%
Source: Analysis using TOC-specific and route-specific peak period growth forecasts and illustrative electrification scenarios as described in this RSS.55. The current committed programme of electrification, if continued into CP6 and beyond, can
produce a flow of mid-life DMUs for use on non-electrified routes, (subject to commercial
terms). Based on the electrification scenarios in this RSS and the figures in Table 3 it had been
assumed that there would be no requirement for any new or additional diesel or other self-
powered rolling stock on a significant scale in CP5 or CP6 unless or until hybrid technology
matures and the business case becomes sufficiently strong, or until such time as new
environmental legislation makes the operation of the present diesel-engined vehicles non-viable
(see paragraph 48). The February 2014 RSS stated that small orders of additional new self-
powered vehicles might be required, however. This topic is developed further in Section H on
page 22.
56. RSSSG has been actively engaged with RIA and with the train builders and other suppliers who
are members of RIA during the development of this strategy. The implications of the RSS for
the manufacturing and maintenance communities are clear and either directly or indirectly
should have a positive impact. The involvement of all parties in these discussions has been
extremely constructive, sharing key data and emphasising the most beneficial direction of travel
for UK rail. This approach has developed RSSSG’s thinking, further demonstrating the value of
collaborative working.
57. The train builders have emphasised that the short, medium and long term forecasts stretching
out 30 years which are provided in the RSS, far from being of merely theoretical interest, are of
great value to their future business strategies, and have in specific cases been discussed in some
detail with their parent companies. The RSS is now recognised as a key input to the Industrial
Strategy to be developed by the recently established Rail Supply Group (RSG).
58. The train builders and RIA have emphasised their firm belief that:
• the procurement of new rolling stock is normally best undertaken by TOCs with ROSCOs;
• the ROSCOs’ role is crucially important for addressing residual value;
• procurement decisions should be based on optimisation of whole-system life-cycle value ;
• procurement evaluation criteria and weighting for rolling stock investments must be
transparent and proportionate;
• the DfT’s approach to deliverability is important e.g. for ‘new’ vs ‘life extended’ rolling stock
decisions, and in franchise bid evaluation;
• batch sizes and continuity of ‘beat rates’ (i.e. the rate of production) for new rolling stock
have major impacts on build efficiency, cost, and ability to innovate; and
• full service maintenance provision by the manufacturer can in their view produce a better
train, but typically needs a maintenance contract period of around 10 years to justify the
investment required.
A Bombardier East Midlands Trains Type C Class 222 ‘Meridian’ DMU introduced in 2004
21H.Rolling Stock Requirements in CP5 and CP6
59. For the second edition and again for this third edition of the RSS, we felt it important to review
the impact of our assumptions for the fleet over Control Periods CP5 and CP6, covering ten
years. RSSSG had already checked the fleet size forecasts derived for 2019 for consistency with
rolling stock analysis undertaken as an input to the Industry Strategic Business Plan (ISBP) for
CP5 which was published in January 2013.
60. Section 5.2.6 of the ISBP for England & Wales (but containing in this instance rolling stock data
for Scotland also) stated that the total of new vehicles in CP5 could be “up to 4,150”, including
a nominal 2,400 vehicles for Thameslink, Crossrail and IEP. The figure was expressed in this way
to reflect a range of potential options, depending on which routes might best be able to make
the business case for new vehicles as opposed to cascaded vehicles, and/or around the strength
of the business case for enhancement or life extension of existing and cascaded vehicles.
61. RSSSG has continued to review the emerging intelligence on such business cases. The ISBP
forecast of up to 4,150 new vehicles to be delivered in CP5 is still consistent with the High
scenario of Table 3 of this RSS. The commitments for new vehicles contained in the winning
bids for the recently let franchises has demonstrated the impact of credit being given by
franchisors for incremental quality to be delivered, and in some cases for benefits to be
delivered beyond the life of the franchise, as outlined in paragraph 11 above. This has altered
the relative attractiveness of new vehicles compared with the continued operation and life
extension of existing vehicles.
62. Our updated analysis of fleet sizes in CP5 and CP6 indicates that 1,109 new EMU vehicles are
now committed for delivery in CP5 (for England, Wales and Scotland, and including TfL’s rail
concessions), in addition to 2,240 electric or bi-mode vehicles for the Thameslink, Crossrail
and IEP projects to be delivered by the end of CP5. This makes a total of a minimum of 3,349
new electric or bi-mode vehicles to be delivered during this Control Period. This compares
with a figure of 3,050 new electric or bi-mode vehicles in CP5 quoted in the February 2014 RSS.
Orders have already been placed for 3,019 or 90% of this total of 3,349 vehicles. This is a very
large requirement for new vehicles in a single five-year period, and can be compared with the
total of 1,055 new electric and diesel vehicles delivered in CP4. Furthermore, a total of 428
vehicles for the Crossrail and IEP projects, and for the Essex Thameside franchise, have already
been committed for delivery in the early years of CP6. The forecast delivery dates of committed
rolling stock orders (and of some other fleet requirements) in CP5 and early CP6 are shown in
the Timelines contained in Appendices 1 to 3 of this RSS. A summary of the committed rolling
stock that will be delivered in CP5 and CP6 is attached as Appendix 5.
63. The total number of new electric or bi-mode vehicles to be delivered in CP5 could yet rise
further when new franchises are let if the efficiency, quality and capability of new electric trains
can justify replacement of older electric trains. None of the present electric fleets has a fixed
or absolute technical life, however. The ability of fleet owners to offer life extension and other
enhancements to their TOC customers, on EMUs cascaded from the Thameslink and Crossrail
projects, means that there is now an unprecedented degree of liquidity in the EMU market in
Britain. New fleets will have the greatest advantages where they offer additional functionality
and therefore greater overall value for money.
64. Our updated fleet size forecasts contained in Table 3 of this RSS show the ‘Electric and Bi-
mode’ fleet totals increasing by between 1,900 and 2,500 over the course of CP6, in the three
scenarios. This compares with a forecast increase of between 2,500 and 3,100 vehicles over the
course of CP5 (April 2014 to March 2019). It is not possible to predict how many older electric
22You can also read