Shyamasis Das, Chandana Sasidharan, Anirudh Ray 2019 - Alliance for an Energy ...
←
→
Page content transcription
If your browser does not render page correctly, please read the page content below
Shyamasis Das, Chandana Sasidharan, Anirudh Ray
2019

                                                  i
June 2019

     CHARGING INDIA’S BUS TRANSPORT - A Guide for Planning Charging Infrastructure for Intra-city Public Bus
     Fleet

     Suggested citation:
     Das, S., Sasidharan, C., Ray, A. (2019). Charging India’s Bus Transport. New Delhi: Alliance for an Energy
     Efficient Economy.

     About Alliance for an Energy Efficient Economy:
     Alliance for an Energy Efficient Economy (AEEE) is a policy advocacy and energy efficiency market enabler
     with a not-for-profit motive.

     About Shakti Sustainable Energy Foundation:
     Shakti Sustainable Energy Foundation seeks to facilitate India’s transition to a sustainable energy future
     by aiding the design and implementation of policies in the following sectors: clean power, energy efficiency,
     sustainable urban transport, climate policy and clean energy finance.

     Contact:
     Shyamasis Das
     Principal Research Associate & Lead – Power Utility & Electric Mobility
     Alliance for an Energy Efficient Economy (AEEE)
     New Delhi
     E: shyamasis@aeee.in

     Disclaimer:
     The views/ analysis expressed in this report/ document do not necessarily reflect the views of Shakti
     Sustainable Energy Foundation. The Foundation also does not guarantee the accuracy of any data included
     in this publication nor does it accept any responsibility for the consequences of its use. This report is based
     on the best available information in the public domain. Every attempt has been made to ensure correctness
     of data. However, AEEE does not guarantee the accuracy of any data nor does it accept any responsibility for
     the consequences of use of such data.

     Copyright:
     © 2019, Alliance for an Energy Efficient Economy (AEEE)

     *For private circulation only.

ii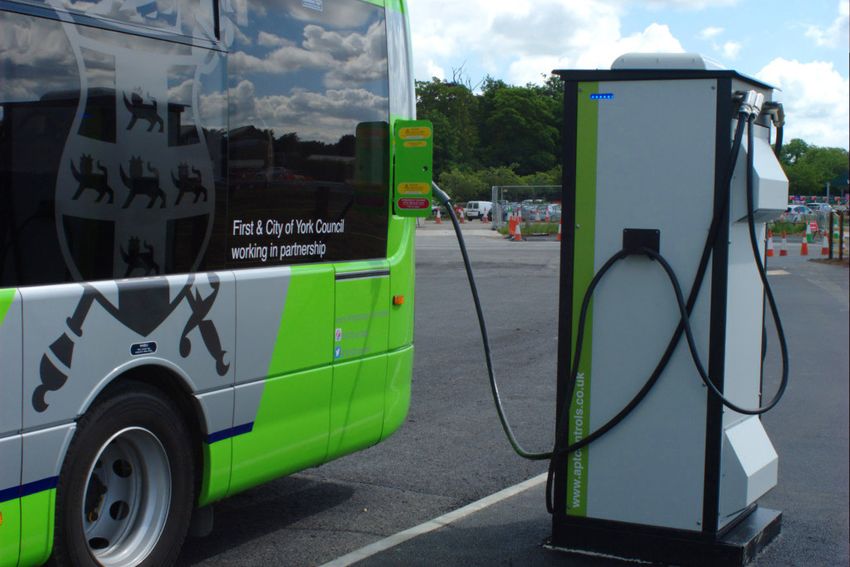
A Guide for Planning Charging
Infrastructure for Intra-city Public Bus Fleet

                                                 i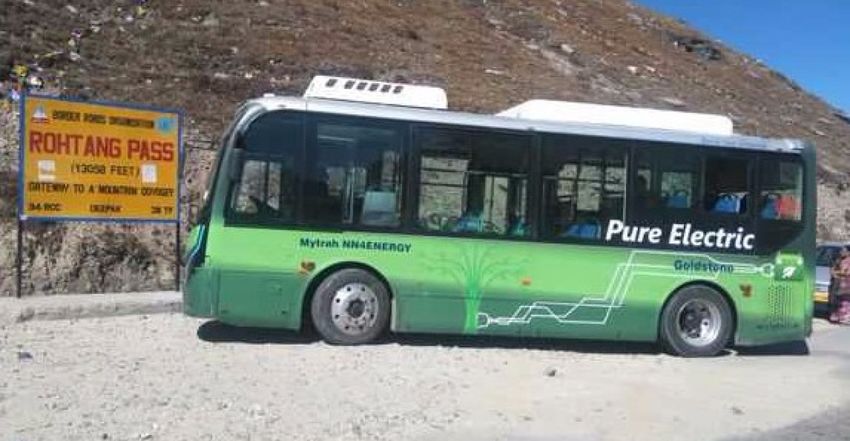
ii
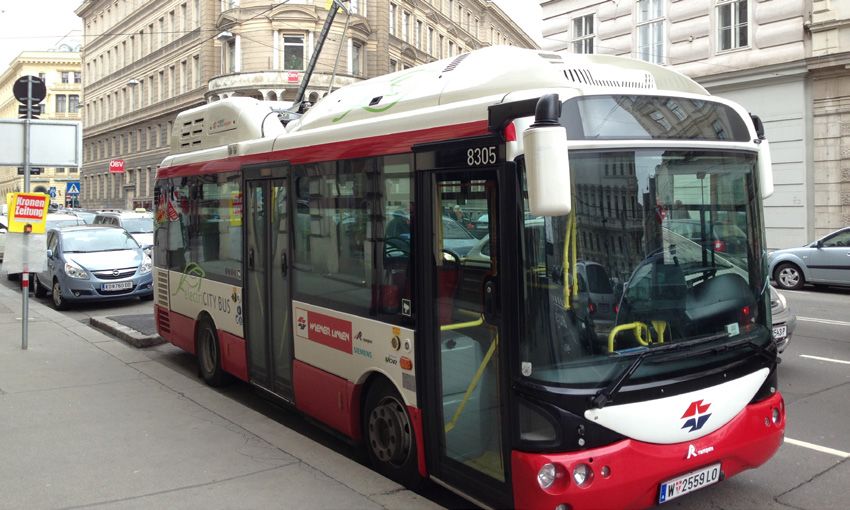
Table of Contents

1.   INTRODUCTION AND BACKGROUND                                            1
         Instances of electrification of public bus fleets in India         3
         Need for investigation – planning of charging infrastructure       4

2. OBJECTIVE, SCOPE AND APPROACH                                            5

3. REVIEW OF E-BUS CHARGING TECHNOLOGIES                                    7
     An overview of EVSE classification practices worldwide                 7
         Possible ways to classify charging technologies                    9
     Classifying charging technologies for analyses                        10
         AC charging		                                                     11
         DC charging                                                       13
         Inductive charging                                                16
         Battery swapping                                                  18

4. COMPARATIVE ASSESSMENT OF THE CHARGING OPTIONS                          21

5. SETTING THE CONTEXT FOR E-BUS OPERATION IN
     THE INDIAN CITIES		                                                   25
     Intra-city public bus network characteristics                         25
     Electric bus specifications                                           28
         Available e-bus models                                            28
         Size of an e-bus                                                  28
         Battery capacity of e-buses                                       29
         Energy consumption and driving range of e-buses                   30

6. POSSIBILITIES OF BUS CHARGING AND SELECTION OF
     “BEST-FIT” CHARGING TECHNOLOGY                                        33

7.   FRAMEWORK FOR EVALUATION OF REQUIRED CHARGING                              .
     CAPACITY AT A DEPOT                                                   39
     Case I:    Time headway on the most frequent route is greater than/        .
                equal to effective charging time for an e-bus              40
     Case II:   Time headway on the route is less than the effective
     			        charging time for an e-bus                                 41
     Practical applications of the devised relations                       41
         Scenario 1:   Designated time for charging e-buses same as
        				           the network’s daily operating hours                 42
         Scenario 2:   Designated time for charging e-buses spanning
        				           full day, i.e. 24 hours                             43

8. WHAT IT WOULD TAKE TO SET UP CHARGING STATIONS                          45

APPENDIX A - CHARGING TIME ESTIMATION                                      49
APPENDIX B – REFERENCE SHEET FOR DCFC PLUG-IN CHARGER                      50
REFERENCES.                                                                51

                                                                                    iii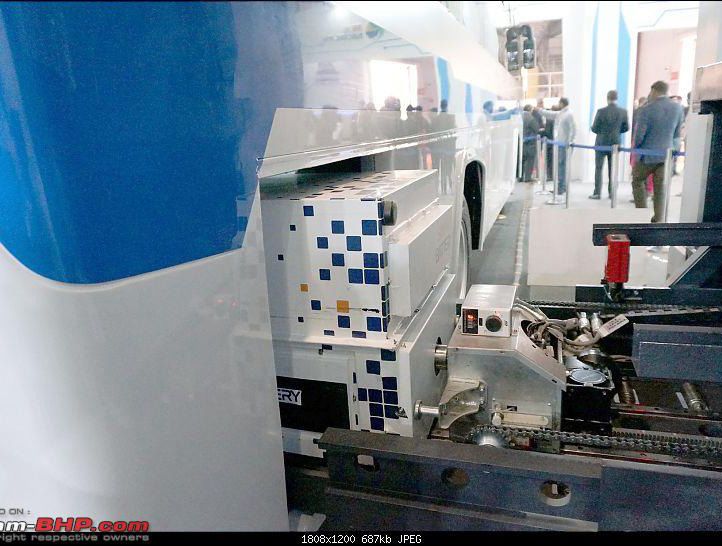
iv
1 Introduction
  and background

The National Electric
Mobility Mission Plan
(NEMMP) launched by the
Government of India (GoI) in
2013 aims to realise around
6-7 million electric vehicles                GoI has also expressed its intent
                                             to achieve 100% EV sales by
(EVs) on Indian roads by
                                             2030. In the Union Budget
the year 2020 (Press                         for 2015-16, the government
Information Bureau, 2015).                   launched the FAME (Faster
                                             Adoption and Manufacturing of
(Hybrid and) Electric Vehicles) scheme for 6 years till 2020. Phase-I of the
scheme initially spanned over financial years 2015-16 and 2016-17 with a
budget of H7950 million (Ministry of Heavy Industry and Public Enterprises,
2015). The Department of Heavy Industry (DHI), the nodal agency to
operationalise the FAME scheme, subsequently extended the Phase-I till
31st March 2019 with an increased kitty of H8950 million. The initial phase
of this scheme was chiefly concerned with incentivising the demand for EVs,
development of a technology platform, setting up of charging infrastructure
throughout the country, and execution of pilot projects. On 8th March 2019,
DHI notified the next phase of FAME with a budget of H100 billion which
becomes effective from 1st April 2019 for three years (Ministry of Heavy
Industries and Public Enterprises, 2019). In Phase-II of the scheme, priority
is given to public and commercial vehicle segments while offering the demand
incentives.

In spite of the ambitious outlook of GoI towards electrification of vehicles,
adoption of EV in the country is yet to pick up. Among different factors,
high EV cost, range anxiety, primarily due to lack of charging stations, and
EV charging time pose significant barriers to EV uptake. The perceived
complexity and associated cost of EV-adoption deter the vehicle users
to shift from an age-old, dependable transport technology i.e., Internal
Combustion Engine (ICE)-based vehicles to an entirely new format which
has limited precedence in the country till now. On the flip side, an EV has a
compelling competitive advantage over a comparable ICE-vehicle.

                                                                                 1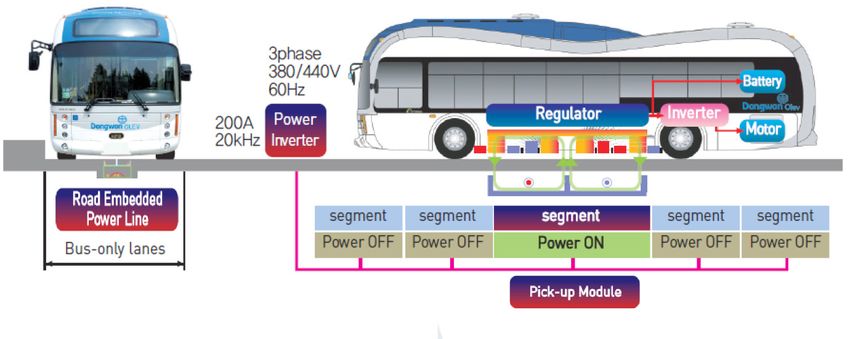
It is found that the Total Cost of Ownership (TCO)1 of an EV could be
                       considerably lower than an equivalent ICE-vehicle if the vehicle usage level
                       (total distance travelled by a vehicle over the lifetime) is sufficiently high. The
                       reason being the savings from the lower operating cost of an EV due to less
                       energy consumption per km can potentially offset the higher upfront cost of
                       an EV (University of Central Florida, Orlando, FL, 2018). This cost-advantage
                       is envisaged to improve further in the near future with the decline in the price
                       of a lithium-ion battery.

                       As the TCO of an EV becomes more attractive with higher usage, there is
                       a strong driver for specific vehicle segments in India which are generally
                       characterised with high per vehicle annual distance travel to adopt electric
                       technology. Considering the competitive advantages of an EV and the current
                       range anxiety, intra-city public buses in India merit consideration to switch to
                       electric – an opinion echoed by an existing study titled “The Case for All New
                       City Buses in India to be Electric” (Khandekar et al., 2018).

                       On the ground also, one can observe that the effort towards electrification of
                       intra-city public bus fleets is gaining traction. For instance, on 31st October
                       2017 DHI issued an Expression of Interest (EoI) soliciting proposals from
                       states or city administrations for multi-modal electric public transport and
                       also solely electric buses. The selected cities are eligible to receive funding
                       under the FAME scheme.

                       The State Road Transport Undertakings (SRTUs) in India are an essential
THE STATE ROAD         stakeholder in this transition because of the fact that they manage over
                       1,00,000 buses across India registering over 524 billion passenger-km
TRANSPORT
                       annually (Ministry of Statistics and Programme Implementation, 2017).
UNDERTAKINGS (SRTUS)   From the points of view of reducing fuel consumption and local air pollution
IN INDIA MANAGE        and meeting climate goals, making the transition to electric buses from
OVER 1,00,000          conventional diesel-run buses2 also augurs well for the government
BUSES ACROSS INDIA     considering state-owned public bus fleets account about 14% of total diesel
REGISTERING OVER 524   consumption in the transport sector (Press Information Bureau, 2014).
                       Hence, the state-owned public bus segment is regarded as a sweet spot of
BILLION PASSENGER-
                       the nation-wide effort to shift to electric mobility. Apart from SRTUs, in many
KM ANNUALLY            Indian cities, a significant share of public bus fleets is operated by the private
                       sector. Because of the high upfront cost to procure buses and set up charging
                       stations, at present private bus operators may hesitate to migrate to electric
                       technology; however, in view of the declining cost of EV battery which would
                       improve the bus TCO further, it is matter of time this segment of public bus
                       fleet would gradually shift to electric format.

                       Irrespective of whether the transition to electric format happens today
                       or tomorrow, extreme care must be taken while rolling out electric buses
                       (e-buses) – any major disruption in the service of the public bus network in
                       a city could have grave implications. It is worthwhile to mention here that
                       a majority of the public transport demand in India, in both rural and urban
                       areas, is met through bus transport. This is evident from the findings of
                       the National Sample Survey Office (NSSO) in 2016 which states that 66%
                       and 62% of the households in rural and urban areas respectively reported
                       expenditures on bus transport (NSSO, 2016).

                       1   TCO includes capital and operating costs of a vehicle.
                       2   Some cities like Delhi have CNG buses.

2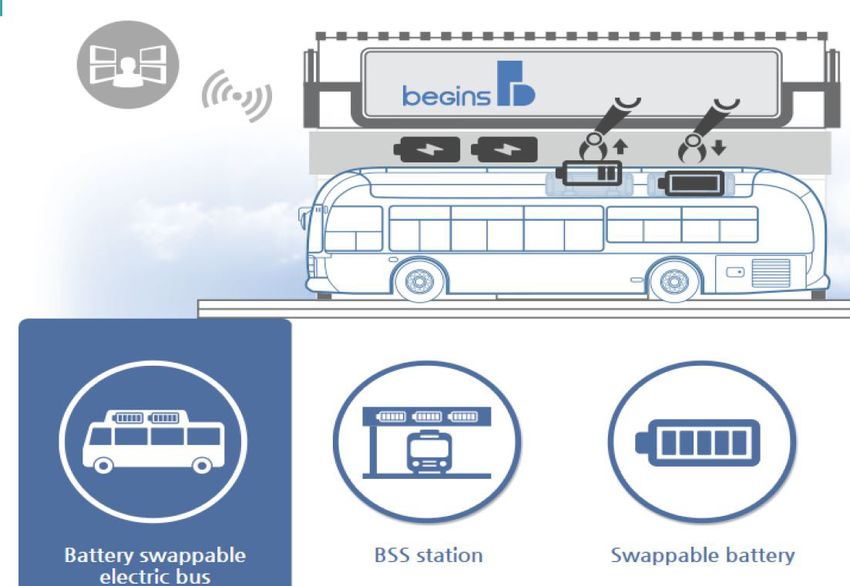
INSTANCES OF ELECTRIFICATION OF PUBLIC BUS FLEETS IN INDIA
                     In recent times, SRTUs in major Indian cities are contemplating to introduce
                     e-buses in their vehicle fleets. In response to DHI’s Expression of Interest
                     (EoI) dated 31st October 2017 which invited proposals from million-plus cities
                     and special category states, 44 cities submitted 47 proposals for multi-
                     modal electric public transport, out of which 11 cities were selected for pilot
                     projects. The government has sanctioned a total of 390 buses wherein Delhi,
                     Ahmedabad, Bengaluru, Jaipur, Mumbai, Lucknow, Hyderabad, Indore and
                     Kolkata will be given subsidy for 40 buses each, while Jammu and Guwahati
                     will get subsidy for 15 buses each (UITP, 2018). Telangana State Road
                     Transport Corporation (TSRTC) has already procured 5 e-buses of 12 m
                     standard length for its fleet in Hyderabad.

                     It is worth mentioning here that before the aforesaid EoI was floated, there
                     have been few instances of commercial operation of e-buses for public
                     transport. For example, Himachal Pradesh Transport Corporation (HPTC)
APPROXIMATELY        procured fully electric buses (Figure 1) from the erstwhile Goldstone-BYD
161 E-BUSES ARE      joint venture and started operating them on the Kullu - Manali - Rohtang
ALREADY PLYING ON    Pass route since September 2017. The Goldstone-BYD (now Olectra-BYD)
                     tie-up had also conducted trials of their buses in Delhi, Mumbai, Bengaluru,
INDIAN ROADS AS IN
                     Hyderabad, Chandigarh and Rajkot (The Hindu BusinessLine, 2018). In
MARCH 2019           Mumbai, Brihanmumbai Electric Supply and Transport (BEST) has acquired
                     hybrid electric buses from Tata Motors and fully electric buses from Olectra-
                     BYD and is operating these buses on select routes since March 2018 (The
                     Hindu, 2018).

                     FIGURE 1: 9 M LONG ELECTRIC BUS DEPLOYED IN HIMACHAL PRADESH [SOURCE: (SWARAJYA STAFF, 2017)]

                     It is reported that approximately 161 e-buses are already plying on Indian
                     roads as in March 2019 (Balakrishnan, 2019). Many of the e-buses are
                     operational without availing subsidy benefits under FAME scheme. The Pune
                     Mahanagar Parivahan Mahamandal Limited (PMPML) recently deployed 25
                     e-buses of 9-m length under gross cost contract model (Bengrut, 2019).
                     The Kerala State Road Transport Corporation (KSRTC) has also started to
                     operate 9-m long e-buses on both inter-city and intra-city routes
                     (Radhakrishnan, 2019) (Dogra, 2019).

                                                                                                                     3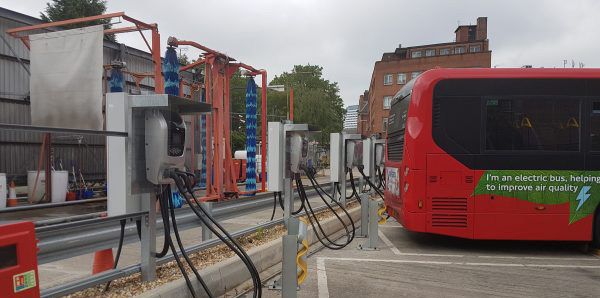
Few large-scale procurements of e-buses for public transport are also
                       expected. For example, the Govt. of Delhi has approved the procurement
                       of 1,000 e-buses in 2019. The Govt. of Tamil Nadu is also planning to
                       procure 2000 e-buses (TOI, 2019). The Bangalore Metropolitan Transport
                       Corporation (BMTC) is also reported to have decided to procure 80 e-buses
                       (TNM, 2019).

                       NEED FOR INVESTIGATION – PLANNING OF CHARGING INFRASTRUCTURE
                       Electric mobility in India and around the globe is at its infancy and evolving
                       rapidly. On the one hand, many of the vehicle, battery and charging
                       technologies are yet to be tested sufficiently in the real-world situation, and
                       some are still at a prototype stage. On the other hand, the consumers are
                       trying to understand the nuances of using an EV and figure out how they can
                       shift to this new format without disturbing their mobility and compromising
                       with their travel preferences. Moreover, EV-transport is unique from the rest
                       of the road transportation modes due to the fact that its implementation
                       is inextricably linked with the electricity distribution sector. Connection
EV-TRANSPORT IS        to the required service voltage of the electricity distribution network and
UNIQUE FROM THE        uninterrupted and inexpensive supply of electricity are some essential
REST OF THE ROAD       requirements for running charging stations.

TRANSPORTATION
                       As the public bus fleets in the cities are embarking on the electric journey,
MODES DUE TO           there is very little space to make errors as it may adversely impact the public
THE FACT THAT ITS      transport system of the city. Rolling out e-buses may pose as a double-
IMPLEMENTATION IS      edged sword to the bus service providers3.
INEXTRICABLY LINKED
WITH THE ELECTRICITY   Deployment of charging stations in a meticulous way is critical for a bus
DISTRIBUTION SECTOR    service provider to achieve smooth operation of its e-bus fleet and make
                       the corresponding electrification investment worthwhile. In order to make a
                       seamless transition to electric mode, it is imperative that the establishment of
                       required charging infrastructure is planned in advance and with enough due-
                       diligence. Among the different operating factors, the range of an e-bus and
                       charging time could potentially impact the service of a public bus fleet.

                       Currently, the bus service providers are not familiar of the e-bus operation
                       and the charging technologies and do not have the necessary technical and
                       commercial know-how to manage e-bus fleets, especially to plan and set up
                       charging infrastructure. Also, the OEMs or third-party operators in India are
                       on a learning curve – they are yet to garner sufficient hands-on experience
                       in supporting bus service providers to operate fully electric bus fleets. This
                       engenders the need to carry out comprehensive research on the current e-bus
                       market and study the operation of a typical intra-city bus fleet in an Indian
                       city in light of possible electrification.

                       3   Include SRTUs and private bus operators

4
2 Objective, scope
and approach
The study “Charging
India’s Bus Transport”
intends to facilitate the
transition of the public To this end, the exercise sets three
bus mobility in a Tier-I main objectives:
or Tier-II city in India to 1. To develop a tool for evaluating
a fully electric format the suitability of different
charging technologies and
by shedding interesting
making an objective decision to
insights into the e-bus select the “best-fit” technology
and charging technology for charging a typical intra-city
market and providing public e-bus fleet
definitive guidance to set 2. To formulate a framework
up charging infrastructure for examining the optimum
charging capacity required to
for an intra-city e-bus
meet the charging demand of
fleet. This is arguably an intra-city public e-bus fleet
the most detailed study on a route
undertaken on e-bus 3. To create tools which would
transport in the Indian serve as a useful guide to set up
charging stations for an e-bus
context.
fleet
The study recognises the need to take a holistic approach to achieve the set
objectives, i.e., to take into cognizance the types of charging technologies and
their technical and commercial details, the available electricity distribution
network, the current e-bus specifications, the intra-city bus operation and
route features, and the space requirement, all together.
5The investigation entails the following main steps:
Understanding the different categories of EV charging
technologies prevalent in matured EV markets and developing
a classification framework specially curated for the Indian
scenario
Carrying out a comparative assessment of the e-bus charging
options and identifying the plausible charging technologies for
the Indian bus fleet
Reviewing the specifications of the e-bus models and the
principal features of an intra-city bus transport network in a
Tier-I or Tier-II Indian city
Identifying the possibilities of charging of a public e-bus
fleet in a city on a route
Developing a unique Multi-Criteria Decision Matrix for
selection of best-fit charging technology for each charging
possibility
Assessing different possible cases of routes of a public e-bus
transport network, based on the relation of headway with
average charging time for an e-bus
Formulating relations between the operation parameters to
evaluate the optimum charging capacity required to meet the
charging demand of an intra-city public e-bus fleet on a
route in the given cases
Testing the effectiveness of the devised relations by
applying real-world values
Providing a much-needed overview of the technical, financial,
spatial and management aspects which are critical from
the point of view of planning the establishment of charging
stations for a public e-bus fleet
The outcome of this exercise should be considered in the context of the
specifications of the e-bus models4 and charging technologies currently
available in the market, and the principal features of an intra-city bus
transport network in a Tier-I or Tier-II Indian city.
It should be borne in mind that the recommendations on the selection of
charging technology and the planning of charging stations are based on the
intra-city public bus network features commonly seen in the Indian cities.
The purpose of this report is to provide general guidance for setting up
charging infrastructure for public buses in an Indian city, and the outcome of
this study should not be construed as specific to a city. The concerned bus
service provider is advised to plan the charging infrastructure for its bus fleet
according to the existing bus network and the route features of a particular
fleet.
4 Only fully electric bus models have been considered.
63 Review of
e-bus charging
technologies
Charging technology, often
known as a type of Electric
Vehicle Supply Equipment
Charging technologies currently
(EVSE) refers to the deployed worldwide for charging
apparatus required to re- e-buses are diverse in their
charge the battery of an method of electricity transfer,
power output levels, control and
EV. A charger is effectively
communication capabilities,
the interlink between the etc. (IEA, 2018). The lack of
electricity distribution international standards for
network and an EV and EVSEs makes it challenging to
primarily consists of an compare the different charging
technologies available in the
electricity transfer equipment,
market in a consistent way and
a communication system and make an appropriate decision
connector(s). to select a suitable charging
option for e-buses. Given this
challenge, at the very outset, this study intends to create a framework to
categorise the EV charging technologies for e-buses based on certain salient
features such as their method of electricity transfer, power output levels, etc.
This would help perform objectively a comparative assessment of a range of
charging technologies in the context of e-bus charging.
AN OVERVIEW OF EVSE CLASSIFICATION PRACTICES WORLDWIDE
NO UNIVERSAL STANDARD: The design parameters of an EVSE depend
equally on the available electricity distribution network as much as the
charging requirements of an EV. As neither the electricity grid design is
uniform internationally, nor the EV charging requirements are identical across
vehicle segments, there is no established universal standard to classify the
charging technologies. However, one can observe certain regional standards
in prominent EV markets, including the US, Europe and China. An overview of
the standardisation attempts for classifying EVSEs is presented below.
7US: One of the recognised classification standards for EVSEs is based on the
charging power levels or simply “Levels”5. As early as 1996, three EVSE levels
were defined in the US. The functionality and safety requirements were set for
each level (Morrow, Karner, & Frankfort, 2008). Level 1 and Level 2 charging
were defined for single-phase voltage available in residential and commercial
buildings whereas charging at three-phase voltage, via AC or DC, was
classified as Level 3. The initial US classification covered electricity transfer
by both conduction and induction within the prescribed Levels. Subsequent
revisions of the standard have diluted the classification based on power
levels, shifting focus to the method of electricity transfer 6 (National Electric
Code Commitee, 2016). The details of the original three Levels defined for
EVSEs are presented in Table 1.
TABLE 1: PRESCRIBED STANDARD FOR EVSES IN THE US
EVSE Levels Voltage rating (V) Current range (A) Power range (kW)
Level 1 120 15 - 20 1.4 - 2.4
Level 2 240 20 - 100 4.8 - 24
Level 3 480 V or above 60 - 400 50 - 350
EUROPE: Europe defines four charging Modes7 as shown in Table 2 based on
the charging rates, output power levels as well as the communication between
EV and EVSE (Spöttle et al., 2018). Europe’s Modes for EVSE are different
from US Levels as the former gives adequate consideration to EV-EVSE
communication. The 120V voltage level is not prevalent in Europe and there is
no European counterpart for US Level 1. Both single-phase and three-phase
AC connections are allowed under the first three modes. Mode 3 covers smart
charging aspects such as controlled charging and vehicle-2-grid functionality
(Vesa, 2019). Europe also defines a separate subclass for DC charging under
Mode 4.
TABLE 2: STANDARD FOR EVSES IN EUROPE
Voltage Maximum current Power
Modes Description
rating (V) rating (A) range (kW)
Mode 1 Slow AC charging in households 250 / 480 16 3.7-11
Slow AC charging with semi-active
Mode 2 connection to vehicle to communicate 250 / 480 32 7.4-22
for safety purposes
AC charging with active connection
Mode 3 between charger and vehicle for safety 250 / 480 32 14.5-43.5
and communication for smart charging
DC fast charging, active connection
Mode 4 600 400 38-170
between charger and vehicle
CHINA: The charging standards established in China are primarily for
conductive charging via AC or DC. China had adopted erstwhile European
standards8 and subsequently developed its own charging standards9 for
conductive charging system. Hence, the Chinese standard for conductive
electricity transfer encompasses the four European charging Modes
5 As defined by the Infrastructure Working Council formed by Electric Power Research Institute (EPRI) and subsequently
codified in the National Electric Code (NEC) under article 625
6 The latest revision of NEC (NFPA 70E) separates provisions related to conductive and inductive power transfer and carves
out another subclass for DC charging
7 The modes are defined in the international industry norm DIN IEC 61851
8 GBT 18487.3.2001 and GB/T 20234.2.2001 adopting International Electrotechnical Commission (IEC) standards
9 GB/T 18487.1.2015 covering Electric Vehicle Conductive Charging System, and GB/T 20234.1, GB/T 20234.2 and GB/T 20234.3
for connection set for conductive charging
8described above. China is also reported to be working along with CHAdeMO10
association to work on a DC fast charging standard for charging power up to
900 kW suitable for large vehicles including electric buses (Boyd, 2018).
REST OF THE WORLD: Other than the major three EV markets, the attempts
at standardisation of EVSEs are quite limited or rudimentary. For example,
South Korea is an interesting market for e-buses, which has seen the
implementation of pilot projects using wireless charging and battery swapping
technology. However, the country has no established standard for either of
the technologies. The existing standardisation for EVSEs in South Korea
pertains only to conductive charging, as described in Table 3 (Park, 2016).
TABLE 3: EVSE CLASSIFICATION IN SOUTH KOREA
Charging Type Voltage rating (V) Power rating (kW)
Mini AC charging 220 50
POSSIBLE WAYS TO CLASSIFY CHARGING TECHNOLOGIES
Charging technologies deployed all over the world can be categorised based
on the following four major aspects:
� Technology used in electricity transfer
� Power output of the charger
� Communication and protection protocols
� Type of connection
1. TECHNOLOGY FOR ELECTRICITY TRANSFER: The primary
characterisation of EVSEs can be done based on the method of electricity
transfer. EVSE charging can be performed through a wired connection
i.e., by conduction or wirelessly i.e., via induction. In the case of the
former, the electricity transfer can be achieved using AC or DC. Battery
swapping is the third method of electricity transfer where a fully charged
battery replaces a depleted battery. Both battery swapping and inductive
technologies have seen limited commercial deployment, and hence,
standardisation efforts for both these technologies are yet to mature11.
2. POWER OUTPUT: The power output of the charger can be either AC or
DC12. However, the power output range of an EVSE is inextricably linked
to the supply voltage which is readily available in the distribution network,
the maximum output current rating allowed at each voltage and the
charging requirement of an EV.
3. COMMUNICATION AND PROTECTION PROTOCOLS: The third aspect
that has governed the characterisation of an EVSE is communication
technology and protection protocols. It is seen that with the progressive
increase in charger power output, the associated communication and
protection protocols also get more complex. Improved communication
technologies between EVSE and EV facilitates the application of smart
charging functions.
10 CHAdeMO association is an e-mobility collaboration platform which is involved promotion of the CHAdeMO DC charging
standard
11 IEC 61980-1:2015 for wireless charging and IEC 62840-1:2016 for battery swapping systems are the international stan-
dards available for the technologies
12 It is important to note that EVSE that facilitates AC charging which requires On-board charger on the Electric Vehicle. DC
charging is performed in cases where the vehicle charger is not On-Board.
94. CONNECTION BETWEEN EV AND EVSE: In the case of conductive
charging, an EVSE has two types of designs - plug-in or pantograph.
Plug-in connectors13 are common and used in both AC and DC charging.
Pantograph connectors are mostly used in charging at high power using
DC. There is no physical connection between EV and EVSE in case of
inductive charging and battery swapping.
A snapshot of the possible charging technology characterisation is presented
in Figure 2.
Electricity Transfer techonlogy
Conductive Inductive Battery Swapping
DC AC
Level 1
Power Output
Level 2
Levels
Level 3
Mode 4 Mode 1
Communication
and Protection Mode 2
protocols
Mode 3
Pantograph Plug in No physical connection
Connection between EV and EVSE
FIGURE 2: WAYS OF CHARACTERISING DIFFERENT TYPES OF CHARGING TECHNOLOGIES
CLASSIFYING CHARGING TECHNOLOGIES FOR ANALYSES
Charging technologies currently deployed in different parts of the world
greatly vary with functional attributes and applications. Absence of a global
standard of these technologies makes it a challenging task to evaluate
and distinguish them under appropriate categories or sub-categories. To
make an objective assessment of these different technologies, it is therefore
deemed critical to develop a suitable framework for classifying the charging
technologies based on the key attributes. The proposed framework also
considers the standard practices followed in India’s distribution network,
wherever applicable14. The proposed approach for classifying the available
charging technologies is presented in Figure 3. The details of the categories
are given below.
13 Type 1/Type 2/CCS/CHAdeMO/GB-T are common plug-in connectors used in different protocols for AC/DC charging. They
are accounted for under plug-in type of connectors.
14 Standard Voltages of 230V single phase circuit, and 415/11000/33000 for three phase circuits.
10AC Level 1
Charging technology
Conductive AC charging AC Level 2
categories
Inductive AC Level 3
Battery Swapping DC Plug-in
DC Charging
DC Pantograph
FIGURE 3: CATEGORIES OF CHARGING TECHNOLOGIES
AC CHARGING
An EV can be charged by conductive AC charging technology provided
the former has an on-board charger which can convert supplied AC to DC
power for charging the vehicle battery. AC charging is the most prevalent
type of charging since the grid supplies the electricity in AC. Also, AC
charging technology offers better economy of service in comparison with
DC charging, where the cost of the converter and other auxiliary equipment
adds to the charger cost. However, AC charging is only possible when the
vehicle has an on-board charger, and the capacity of the on-board charger
limits the capacity of AC charging. AC Charging can be categorised into
three levels: Level 1, Level 2 and Level 3 considering the standard service
voltages available worldwide. The classification broadly follows the Level-
based standard of US, with less stress on the associated communication and
protection requirements. The upper limits for power output in relevant cases
are set using standard practices15 applicable to the Indian distribution grid.
CASE STUDY: SHENZHEN, CHINA
The Chinese city of Shenzhen is the pioneer in adopting electric mobility to fight air
pollution (Guardian, 2018). The city has successfully electrified its e-bus fleet of over
16,000 buses operated by three bus companies: Shenzhen Eastern Bus Company,
Shenzhen Western Bus Company and Shenzhen Bus Group (ISGF, 2018) (Hall, Cui, &
Lutsey, 2018). The e-bus operators collaborated with charging infrastructure providers
to establish charging facilities at depots and the bus routes maintaining a 1:3 charger-
to-bus ratio (Lu, Xue, & Zhou, 2018). Both AC and DC charging technologies are
employed for charging the e-buses in the city (Eurabus, 2017). One of the most common
chargers employed for BYD-supplied buses is an AC charger rated at 80 kW, 415 V, three
phase supply (ISGF, 2018). The typical charging time reported in case of overnight
charging at the depot is around 2 hours. However, there are also charging stations
installed en-route, which are reported to charge the buses in approximately 40 minutes
(Eurabus, 2017). The lead time for setting up the charging stations in 13 depots with 20
to 40 charging stations at each depot was reportedly around three months, while the
process of grid connection took six months. It is also reported that current transformer
stations were built at the depots in order to adjust the charging Voltage (Eurabus, 2017).
15 Maximum current in 230 V single phase AC circuit is considered as 32 A in accordance with the rating of highest single
pole MCB available
11AC LEVEL 1
AC Level 1 charging takes place at the lowest service voltage prevalent
in some parts of the world. The salient technical specifications of Level 1
charging are stated in Table 4.
AC Level 1 charging is an established charging TABLE 4: AC LEVEL 1 TECHNICAL
method for EVs as it is a simple plug and SPECIFICATIONS
play charging which needs no ancillary Voltage (V) 120
infrastructure. Hence, the capital cost of
Input current (A) 15 - 20
charging equipment is negligible. The area
required for AC Level 1 EVSE is also minimal as Output power (kW) 1.4 - 2.4
they are generally wall mounted. However, the
applicable service voltage level is not available in the Indian grid. Also, there is
no reported case of charging of e-buses at AC Level 1.
AC LEVEL 2
AC Level 2 charging entails single-phase TABLE 5: AC LEVEL 2 TECHNICAL SPECI-
charging performed at the most common FICATIONS
service voltage in the world, as shown in Table Voltage (V) 230
5. There is a case for Level 2 charging in India Input current (A)16 6 - 32
as single-phase connections at 230 V is
Output power (kW) 1.4 - 7.6
typical in electricity distribution.
AC Level 2 charging is also a simple plug and play charging using chargers
on board the EV, and it generally requires no ancillary infrastructure. The
cost estimates of the EVSE and ancillary infrastructure are shown in Table
6. Most of the AC Level 2 chargers at the
given power level are wall mounted like TABLE 6: COST ESTIMATES FOR AC LEVEL 2
AC 1 chargers. The availability of service Cost of charging
8,000-64,000
equipment (H)
voltage, almost no technical complexity
and insignificant capex requirement makes Cost of ancillary
Nil
infrastructure (H)
AC 2 a suitable option for charging most
vehicle segments in India. However, there is Total cost of
8,000-64,000
EVSE (H)
no confirmed case of AC Level 2 charging of
e-buses globally at these power levels17.
AC LEVEL 3
AC Level 3 is the category which considers vehicle charging at three-phase
AC distribution voltage level. The minimum voltage level associated with AC 3
charging in the Indian context is 415 V. Table
7 lists the salient technical specifications TABLE 7: AC LEVEL 3 CHARGER TECHNICAL
covering a range of AC Level 3 chargers SPECIFICATIONS
currently available in the Indian market. The Voltage range (V) 415 or above
converter that is on board the EV limit the
Power output (kW) 20 - 8018
maximum power output of the EVSE in this
category (Navigant, 2018).
16 The maximum current is restricted to 32A considering the rating of highest single pole MCB prevalent in India, though
US Level 2 charging allows currents till 100 A. Maximum Power is also calculated at 32A
17 The minimum power level reported for charging of fully electric buses is 20 kW, which will be a 3-phase charging ac-
cording to Indian standards (ZeEUS, 2017).
18 Lowest range and highest range set according to rating of AC charger available for e-bus in market (BYD, 2019; ZeEUS,
2017)
12The AC Level 3 chargers (Figure 4) available in the market are generally
designed for wall-mount with minimal area requirement. However, those
delivering high charging power require additional ancillary equipment
including step down transformers, associated HT and LT switchgear, cables,
protection system and SCADA
system. AC Level 3 chargers with TABLE 8: COST ESTIMATES FOR AC LEVEL 3
smart charging capability will Cost of charging
3,50,000 -6,40,000
have additional equipment to equipment (H)
facilitate the communication and Cost of ancillary
2,50,000 -4,00,000
control functions needed for smart infrastructure (H)
charging. The cost-estimates of AC Total cost of EVSE (H) 3,50,00019-10,40,000
Level 3 EVSE are presented in Table
8 (Spöttle, et al., 2018).
ONE SHOULD AC Level 3 charger with output power as low as 22 kW is typically used for
BEAR IN MIND charging plug-in hybrid e-buses as seen in the European market (ZeEUS,
THAT AC LEVEL 2017). However, the focus of this study is on fully electric vehicles, and hence,
a charger of higher power output rating is
3 CHARGING IS TABLE 9: SPECIFICATIONS OF A TYPICAL
selected for further analysis. The technical AC 3 BUS CHARGER CONSIDERED FOR
ONLY FEASIBLE IF specifications of a typical AC charger20 for ANALYSIS
THE E-BUS HAS e-bus are presented in Table 9 (BYD, 2019) Input voltage (V) 415
AN ON-BOARD (ISGF, 2018) (V6 News Telugu, 2017).
Output voltage (V) 415
CHARGER. One should bear in mind that AC Level 3
Maximum output current (A) 126
charging is only feasible if the e-bus has an
on-board charger. Maximum output power (kW) 80
FIGURE 4: AC III E-BUS CHARGERS IN THE UK [SOURCE: (IAN, 2018)]
DC CHARGING
DC chargers can be classified into two categories based on the design
of the charging systems - plug-in or pantograph. This categorisation is
irrespective of the charging power level. A key advantage of DC charging over
AC charging is the former does not require on-board charger in the EV. Only
in case of continuous charging via catenary, on-board chargers would be
necessary21 (Siemens, 2017).
19 Lower cost is defined without considering cost of ancillary equipment as at lower power levels ancillary equipment is
not necessary
20 The specifications are presented for 80kW (2x40kW) chargers employed by BYD in charging electric buses
21 Refer to Case study: On-Line charging via catenary in Vienna
13CASE STUDY: ON-LINE CHARGING VIA CATENARY IN VIENNA
The city of Vienna is home to a unique bus charging case where the existing electricity
infrastructure for tram-system is utilised. Since October 2012, the transport company,
Wiener Linien has started commercial operation of e-buses in two bus routes with 12
buses which are charged continuously via catenary (Figure 5). The buses have on-
board DC-DC converters and bottom-up pantograph systems that facilitate DC charging
at 60 kW. The electricity is
drawn to the on-board battery-
charging system from the
existing overhead line of the
tram system. Besides, batteries
of the buses are charged at the
respective terminals of the bus
routes. Each bus with 96 kWh
battery reportedly takes 6 - 8
minutes for charging per cycle
(Siemens, 2014). The Italian
bus manufacturer Rampini and FIGURE 5: ELECTRIC BUS CHARGING VIA CATENARY USING
Siemens formed the consortium AN ON-BOARD BOTTOM-UP PANTOGRAPH SYSTEM IN
VIENNA [SOURCE: (WIKIMEDIA, 2013)]
to execute this project (Siemens,
2017)
DC PLUG-IN
DC plug-in charging entails DC charging by a plug-in connection. The
minimum voltage level associated with
this type of charging is 415 V in the TABLE 10: DC PLUG-IN TECHNICAL
SPECIFICATIONS
Indian context. The primary technical
specifications for the range of DC plug-in Output voltage range (V) 150 - 750
chargers (Figure 6) currently available in Power output (kW) 50 - 150
the market (ZeEUS, 2017) are presented in
Table 10.
Cost-estimates shown in Table 11 show that DC plug-in chargers are
generally costlier than AC chargers (Spöttle et al., 2018) (Elin, 2016). Just
like an AC Level 3 charger with high
output power, DC plug-in charging TABLE 11: COST-ESTIMATES FOR DC PLUG-IN
at higher power level would require Cost of charging 16,00,000 -
additional ancillary equipment including equipment (H) 22,00,000
step down transformers, associated HT Cost of ancillary 2,50,000 -
infrastructure (H) 4,00,000
and LT switchgear, liquid cooled cables,
protection system and SCADA system. 16,00,00022 -
Total cost of EVSE (H)
26,00,000
The estimated minimum area requirement
for a DC plug-in charger is 2 sq.m.
50 kW DC plug-in chargers are commonly reported to be used for charging
e-buses (Siemens, 2017) (Proterra,
2016). 150 kW DC plug-in chargers TABLE 12: SPECIFICATIONS OF A TYPICAL DC
capable of charging three e-buses PLUG-IN BUS CHARGER
sequentially are also available in the Input voltage (V) 415 or above
market (ABB, 2018). Nevertheless,
Maximum power (kW) 70
the DC plug-in charger with 70 kW23
22 Lower cost is defined without considering cost of ancillary equipment as at lower power levels ancillary equipment is
not necessary.
23 Additional details are not available in public domain for the 70 kW chargers deployed by Tata Motors in Kolkata (Char-
ger manufacturer is Mass-Tech)
14rating which found mention in a recent e-bus tender result in India has been
considered for further analysis in this study (Khandekar et al, 2018) (refer to
Table 12).
FIGURE 6: DC PLUG-IN CHARGER FOR AN E-BUS IN THE UK [SOURCE: (JORAIR, 2017)]
DC PANTOGRAPH
This category includes DC charging via pantograph with on-board bottom-
up (Figure 5) or off-board top-down (Figure 7) configuration (Krefeld, 2015)
(Siemens, 2017). The minimum voltage
required for this type of charging is TABLE 13: DC PANTOGRAPH TECHNICAL
415 V in the Indian context. The salient SPECIFICATIONS
technical specifications for the range of DC Output voltage range (V) 150 - 750
pantograph chargers currently available
Power output (kW) 150 - 650
in the market are stated in Table 13 (ABB,
2017) (ZeEUS, 2017).
It is worthwhile to mention here that DC pantograph charging technology
is expensive and requires auxiliary infrastructure including distribution
transformer (DT), associated LT and HT
switchgear, cables, protection system, TABLE 14: COST ESTIMATES FOR DC
SCADA system, etc. (Mäkinen J. , 2016). PANTOGRAPH
The estimated cost of the charging system Cost of charging 32,00,000 -
is to the tune of over H12 million (refer equipment (H) 1,12,50,000
to Table 14) (Elin, 2016) (Spöttle et al., Cost of ancillary 6,00,000 -
infrastructure (H) 12,50,000
2018). Typical area requirements for a
DC Pantograph system and a DC Plug-in 38,00,000 -
Total cost of EVSE (H)
1,25,00,000
system are considered to be similar.
DC pantograph systems are found to be employed for charging e-buses
with off-board chargers or on-board converters24 (Siemens, 2017). E-buses
having ultra-capacitors as energy storage options are also found to be
charged via DC pantograph. DC pantograph systems rated 150 kW or above
24 Refer to Case study: On-Line charging via catenary in Vienna
15are deployed mostly in the European
TABLE 15: SPECIFICATIONS OF A TYPICAL DC
markets (ZeEUS, 2017). The e-buses PANTOGRAPH BUS CHARGER
observed in such cases also have
Input voltage (V) 415 or above
corresponding arrangements that
facilitate charging via pantograph Output voltage (V) 150-750
method. The salient technical Maximum output current (A) 500
specifications for a typical DC Maximum output power (kW) 300
Pantograph charger considered for
this study are stated in Table 15.
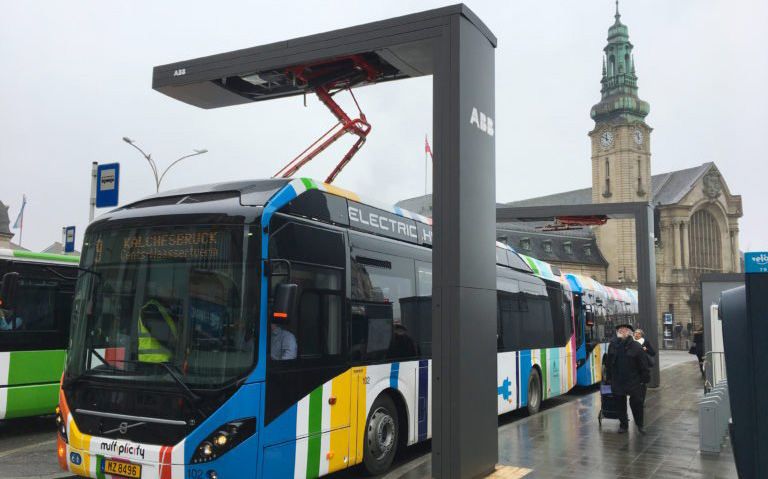
FIGURE 7: DC PANTOGRAPH CHARGING OF E-BUS USING AN OFF-BOARD BOTTOM-DOWN ARRANGEMENT
IN LUXEMBOURG [SOURCE: (KYLE, 2017)]
CASE STUDY: DC PANTOGRAPH CHARGING IN THE CITY OF GENEVA
The city of Geneva employs DC pantograph-based technology for charging trolley
e-buses (ABB, 2019). The city’s public transport operator, Transports Publics Genevois
(TPG) along with Swiss bus manufacturer HESS and charging infrastructure provider,
ABB piloted e-buses on the route connecting the city’s airport to suburban areas
(Wagenknecht, 2017). The 18m long TOSA e-buses operate without catenary and are
charged at selected bus stops, terminals and depots instead. The e-buses are charged
at three different output power levels: 600 kW, 400kW and 45 kW. The 600 kW ‘flash’
charging stations which provide a quick power boost in a short span of 15-20 seconds
are reportedly the fastest in the world. The 400 kW and 45 kW charging stations charge
the battery for 5 and 30 minutes respectively.
INDUCTIVE CHARGING
The inductive charging category includes all charging technologies which
achieve wireless transfer of electricity, either by static or dynamic induction.
The minimum voltage required for this type of charging is 415 V in the Indian
context. The salient technical
TABLE 16: INDUCTIVE CHARGING TECHNICAL PARAMETERS
specifications for a range of
inductive chargers currently available Output voltage range (V) 415 or above
in the market are presented in Table Power output (kW) 50-250
16 (Wave, 2019).
As far as economics is concerned, inductive charging technology using
underground power delivery systems are found to be expensive, although
16the required area for installation is minimal. These systems require auxiliary
infrastructure including special high-frequency transformer, associated
LT and HT switchgear, cables, protection
TABLE 17: COST ESTIMATES FOR
system, SCADA system, vehicle alignment INDUCTIVE CHARGING
monitoring system, etc. The estimated cost
Cost of charging 2,25,00,000
of an inductive charging system is more than equipment (H) or above
H 22 million (refer to Table 17) (Elin, 2016).
Cost of ancillary 3,80,000 -
infrastructure (H) 7,20,000
Wireless charging is not a conventional Total cost of 2,28,80,000
technology for charging of e-buses. EVSE (H) or above
Wireless transfer technology is also
prone to electromagnetic interference
related challenges (Ahn, 2017). In most cases, the technology is used
for range extension of EVs (Wave, 2019) (Stewart, 2014). However, the
technology merits consideration in the context of e-bus charging given the
implementation of On-Line Electric Vehicle (OLEV) systems at Gumi and
Sejong in South Korea. The Milton Keynes
Demonstration Project is another example of
TABLE 18: SPECIFICATIONS OF TYPICAL
INDUCTIVE BUS CHARGER CONSIDERED
inductive charging (Miles & Potter, 2014). The FOR ANALYSIS
technical specifications of a typical charger Input voltage (V) 415
considered for analysis are based on the
Maximum current (A) 200
Korean OLEV system (refer to Table 18) (Ahn,
2017). Maximum power (kW) 200
CASE STUDY: WIRELESS CHARGING IN GUMI
The city of Gumi, South Korea debuted in e-bus operation in 2014, where the fleet
is charged via induction (Ahn, 2017). The Korea Advanced Institute of Science and
Technology (KAIST) developed the proprietary magnetic resonance technology used for
charging e-bus batteries under a $69 million funding from the government (Yeon-soo,
2019). Every On-Line Electric Vehicle (OLEV) e-bus is equipped with a special receiver
which can collect electric power wirelessly from the underground power supply while
in motion or at the stationary condition. An inductive charging station (Figure 8) with a
rated output power of 200 kW also has special equipment which converts the electricity
received from the grid to high-frequency currents (Suh, 2014). The project has a total
144m underground power supply system in the 24 km route which was installed post a
regulatory revision allowing power line installation on the road. The OLEV systems are
reported to operate at an efficiency of 85%.
FIGURE 8: INDUCTIVE CHARGING OF E-BUS IN KOREA
17BATTERY SWAPPING
Battery swapping based charging entails cases where depleted vehicle
batteries are swapped with fully charged batteries. This is not a common
technology in practice for charging of e-buses. A few trials of battery
swapping in the bus segment have been reported in China (Hua, 2012), South
Korea (Park, 2016) and Taiwan (Alees, 2014). On the other hand, a pilot
e-bus project involving battery swapping is underway at Ahmedabad in India
(Wangchuk, 2019) (John, 2019) (Sun Mobility, 2018).
Battery swapping system consists of the battery charging system and the
battery swapping mechanism. Hence, the technical parameters for a battery
swapping system would depend on both the charging point for batteries and
the swapping infrastructure. Hardly any information is available on the power
requirement for swapping operation. The minimum voltage required for this
type of charging is considered to be 415 V in the Indian scenario.
The time required for swapping may range between 2.5 minutes to 10 minutes
(Wangchuk, 2019) (Alees, 2014). Battery swapping technology requires
special equipment such as battery-swapping arms and battery movement
system, along with the battery charging system, which would potentially
increase the capital and operating
TABLE 19: COST ESTIMATES FOR BATTERY
costs. The ancillary infrastructure would SWAPPING
also include distribution transformer,
Cost of charging 3,20,00,000
associated LT and HT switchgear, cables, equipment (H) or above
protection system and SCADA system. Cost of ancillary 2,50,000-
The estimated cost for battery swapping infrastructure (H) 4,00,000
infrastructure is presented in Table 19 Total cost of 3,22,50,000
(Spöttle, et al., 2018). EVSE (H) or above
CASE STUDY: JEJU ISLAND
South Korea is a unique market for e-buses where charging by conductive, inductive
and battery swapping technologies have been employed. E-buses with battery
swapping technology operate on Jeju Island (Park, 2016). The e-buses used in this
project has 51 kWh battery bank which is mounted on the roof of the bus. The battery
swapping stations (Figure 9) located at the bus-stops have battery charging facilities
and robotic systems for swapping. At the swapping station, there are two automatic
robotic systems to remove the depleted battery from the bus and attach a fully charged
battery. The swappable batteries used in this project weigh approximately 760 kg and
has a special shock absorption design feature (Begins, 2019).
FIGURE 9: SCHEMATIC REPRESENTATION OF BATTERY SWAPPING STATION IN JEJU ISLAND, KOREA
[SOURCE: (BEGINS, 2019)]
18CASE STUDY: AHMEDABAD
The city of Ahmedabad can be considered as an outlier in India’s e-bus landscape. It
is the only city which is carrying out a trial of ‘battery swap’ technology (Figure 10).
The city is the home to a unique Bus Rapid Transit system which is used as the test
bed for the demonstration of this technology. However, battery swappable buses
only constitute one-third
(18 out of 50) of e-buses
currently deployed in the
city (Vora, 2019). The initial
trial of the battery swappable
model with smaller, lighter
battery packs (Wangchuk,
2019) and shorter range
(Shyam, 2018) is planned to
service a 31km route in BRTS
(Indian Express, 2019). Bus
manufacturer, Ashok Leyland
has collaborated with the
energy service provider, Sun
Mobility to implement the
battery charging infrastructure
and swapping system (Sun FIGURE 10: BATTERY SWAPPING DEMONSTRATION FOR
Mobility, 2018). THE E-BUS MODEL USED IN AHMEDABAD, INDIA [SOURCE:
(REHAAN, 2018)]
1920
4 Comparative
  assessment of
  the charging
  options

Taking into cognizance that it may not be plausible to employ every available
charging technology to recharge the entire range of EV segments (e.g., 2- and
3-wheelers, 4-wheeler passenger cars, buses, light commercial vehicles, etc.),
the study undertakes a thorough comparative assessment of the above-
mentioned charging options using a set of critical parameters to identify the
ones which could be practically employed for charging e-buses in India (refer
to Tables 20(a) and 20(b)). The values and details of the parameters are
considered based on the technical and financial specifications observed in the
market and are applicable in India’s context.

                                                                                 21
TABLE 20 (A): COMPARATIVE ASSESSMENT OF THE AVAILABLE OPTIONS FOR CHARGING ELECTRIC BUSES
Parameters AC Level 1 AC Level 2 AC Level 3
Input voltage from grid
120 a 230 b 415 or above b
(V)
Output range of
chargers available in 1.4 - 2.4 d 1.4 - 7.6 e 20 - 80 f
market (kW)
Output power
considered for analysis 2.2 i 6.8 i 80 j
(kW) h
Charging/ Swapping
55 - 65 hours o 17 - 20 hours o 1.5 - 2 hours o
timen
Electricity connection Required service voltage
LT HT
required q (HT/ LT) is not available in India
No ancillary No ancillary Distribution Transformer, HT /
Ancillary infrastructure
infrastructure required infrastructure required LT switchgear, cables, protection
required r
(simple plug and play) (simple plug and play) relays and SCADA
Auxiliary energy
Nil Low Low
consumption
Area requirement per
0.09 (wall mounted) 0.8 0.8
EVSE (m2)
Capital cost of charging
Negligible 8,000 - 64,000 3,50,000 - 6,40,000
technology s (H)
Cost of ancillary
0 0 2,50,000 – 4,00,000
infrastructure s (H)
Cost of electricity for Required service voltage As per LT connection
As per HT connection norms
charging is not available in India norms
10% of installation cost for periodic maintenance t; 2% of installation cost for regular
Maintenance cost (%)
maintenance t
Ease of drawing Not difficult; service Moderately difficult; possible
Service voltage is not
electricity from the voltage is available from to draw electricity through a DT
available in India
distribution network a regular wall outlet connected to a HT line
Established
precedence for No No Yes
charging buses
22TABLE 20 (B): COMPARATIVE ASSESSMENT OF THE AVAILABLE OPTIONS FOR CHARGING ELECTRIC BUSES
Inductive
Parameters DC Plug-In DC Pantograph Battery swapping
charging
Input voltage from grid
415 or above b 415 or above b 415 or above b 415 or above b, c
(V)
Output range of
Data not publicly
chargers available in 50 - 150 g 150 - 650 g 50 - 250 g
available c
market (kW)
Output power
No typical value
considered for analysis 70 k 300 l 200 m
assumed c
(kW) h
Charging/ Swapping
1.7 - 2 hours o ~ 25 minutes o Not reported 2.5 - 10 minutes p
timen
Electricity connection
HT HT HT HT c
required q (HT/ LT)
Distribution Distribution Distribution
Distribution
Transformer, HT / Transformer, HT Transformer, HT /
Transformer, HT
Ancillary infrastructure LT switchgear, /LT switchgear, LT switchgear, road
/LT switchgear,
required r liquid cooled cables, liquid cooled embedded cables,
cables, protection
protection relay and cables, protection protection relay
relays and SCADA
SCADA relays and SCADA and SCADA
Auxiliary energy
Low Medium High High
consumption
Area requirement per No typical value
2 2 2
EVSE (m2) assumed c
Capital cost of charging 32,00,000 – 2,25,00,000 or 3,20,00,000 or
16,00,000 – 22,00,000
technology s (H) 1,12,50,000 above above
Cost of ancillary 6,00,000 –
2,50,000 – 4,00,000 3,80,000 – 7,20,000 2,50,000 – 4,00,000
infrastructure s (H) 12,50,000
Cost of electricity for As per HT connection As per HT As per HT As per HT
charging norms connection norms connection norms connection norms
10% of installation cost for periodic maintenance t; 2% of installation cost for regular
Maintenance cost (%)
maintenance t
Difficult; must
Moderately Moderately
be drawn only
Moderately difficult; difficult; possible difficult; possible
Ease of drawing from an 11/33
possible to draw to draw electricity to draw electricity
electricity from the kV substation
electricity through a DT through a DT through a DT
distribution network which is not as
connected to a HT line connected to a HT connected to a HT
accessible as a HT
line line
line
Established
precedence for Yes Yes Limited u Limited u
charging buses
a Voltage set according to parameters specified in the National Electric Code k Rating of TATA electric charger as per the tender information available
(NEC), USA (Morrow, Karner, & Frankfort, 2008) (Khandekar A. et al., 2018)
b Voltage set at the typical single phase and three phase AC distribution in l Assumed based on the study of e-bus chargers in the market (ZeEUS, 2017;
India ABB, 2017)
c Depends on both charging point for battery and the swapping infrastructure m Rating of OLEV electric charges in South Korea (Park, 2016)
d Power range set considering 12-20A input current range specified in NEC n For rated battery capacity of 200 kWh
(Morrow, Karner, & Frankfort, 2008) o Refer Appendix A - Charging time estimation for more details
e Power range set considering 16-32A input current range for the Indian p Swapping time set based on available details (Wangchuk, 2019) (Alees, 2014)
context, which also follows European modes defined for AC charging (Spöttle q Connection requirement is assessed as per India’s grid code
et al., 2018) r Requirement assessed based on industry accepted standards (Mäkinen J.,
f Lowest range and highest range set according to of rating of AC charger 2016)
available for e-bus in the market (BYD, 2019; ZeEUS, 2017) s Costs are estimated based on available literature and market values (Spöttle
g Power range set according to the range of e-bus chargers available in the et al., 2018) (Navigant, 2018) (EVConnectors, 2019) (SPDCTL, 2018) (IndiaMART,
market (ZeEUS, 2017) (ABB, 2017) (Siemens, 2017) (Wave, 2019) 2019)
h Considering charging requirement for one e-bus at a time t Periodic maintenance every four years and regular maintenance every year
i Highest possible power considered at power factor 0.9 u Few pilot cases of inductive charging and battery swapping for electric buses
j Rating of BYD e-bus charger available in the market (BYD, 2019) have been reported.
23Based on the practicality-assessment (as summarised in Table 20), it is found that:
AC-I technology requires a service voltage which is not prevalent in India.
There is no confirmed case of AC-II charging of e-bus globally at India’s power level
(5 Setting the
context for
e-bus operation
in the Indian
cities
This study is based on a practical context
that takes into account the specifications of
e-buses currently available in India and the
bus transport networks which are prevalent
in the Tier-I and Tier-II Indian cities.
INTRA-CITY PUBLIC BUS NETWORK CHARACTERISTICS
The study aims to deduce a model set of e-bus specifications and intra-city
bus network features for analysis of charging requirements. To this end, the
study reviews the principal features of a typical intra-city public bus transport
network commonly seen in Tier-I and Tier-II cities in India. The research
identifies the following key features.
1. The network may be with/ without a dedicated corridor.
2. The bus network consists of depots/ terminals (generally referred to as
nodes) where the bus trips begin or end.
3. There are separate nodes for the start and end of a bus trip.
4. Certain portions of different bus routes may overlap.
5. The nodes currently act as spaces for:
i. Repairing and servicing the buses
ii. Parking buses overnight
iii. The drivers and conductors to rest post completion of a trip before
they start on their next trip
iv. Boarding or de-boarding of passengers who are beginning or
finishing their trips at the depot
v. Fleet operators to run their day-to-day operations
25You can also read