Value chain analysis of mango in Chittoor district, Andhra Pradesh (2017-2018) - MIDH
←
→
Page content transcription
If your browser does not render page correctly, please read the page content below
Value chain analysis of mango in Chittoor
        district, Andhra Pradesh
                        (2017-2018)

      PRECISION FARMING DEVELOPMENT CENTER,
             WATER TECHONOLGY CENTER
     PROFFESSOR JAYASHANKAR TELANGANA STATE
             AGRICULTURAL UNIVERSITY,
            RAJENDRANAGAR, HYDERABAD

                            Sponsored by
Ministry of Agriculture, Department of Agriculture and Co-operation
                     Government of India, New Delhi
(For official use only)

Value chain analysis of mango in Chittoor
        district, Andhra Pradesh
                 (2017-2018)

       PRECISION FARMING DEVELOPMENT CENTRE
             WATER TECHNOLOGY CENTRE
               PJTSAU, RAJENDRANAGAR,
                  HYDERABAD – 500 030.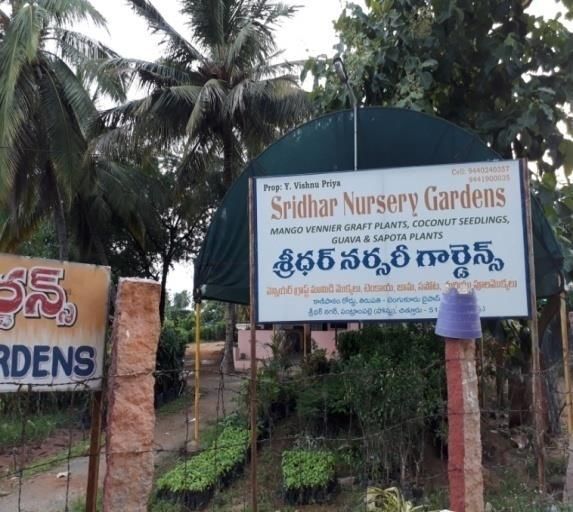
CONTENTS

Chapter                           Chapter Title                             Page No.
No.
          Abstract                                                               1-4
1.        Introduction                                                           5-8
2.        Status of Andhra Pradesh in mango cultivation                         9-14
3.        Materials and Methods                                                  15
4.        Results                                                              16-39
5         Constraints and action plans                                         40-51
7         Photographs                                                          52-57
          Annexure
I         Questionare for nursery units                                        58-59
II        Questionare for farmers                                              60-63
III       Questionare for traders                                               64
IV        Questionare for processing units                                     65-67
V         Process flow chart for mango pulp in canning units                    68
VI        Process flow chart for mango pulp in aseptic packing units            69
VII       Prescribed data of Nursery units on value chain study for mango      70-74
          in Chittoor district of Andhra Pradesh
VIII      Prescribed Data of Farmers on Value Chain Study for Mango in         75-78
          Chittoor District of Andhra Pradesh
IX        Prescribed data of Traders on value chain study for mango in         79-81
          Chittoor district of Andhra Pradesh
X         Presribed data of Processors in Chittoor district                    82-83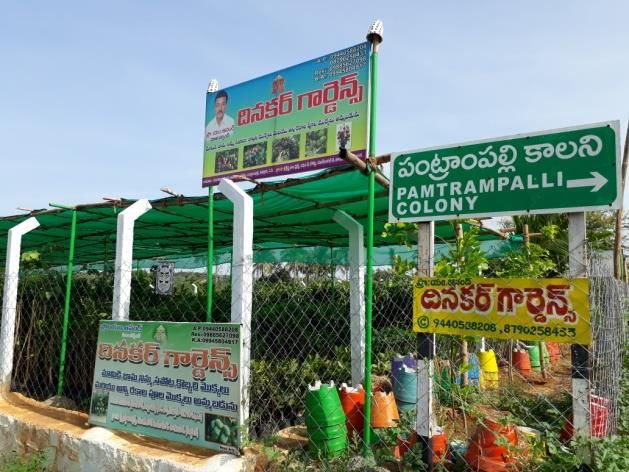
Abstract
        A Value chain is a network of facilities and distribution options. The chain of activities
gives the product more added value than the sum of added values of all activities. The ultimate
goal is to maximize value creation and minimizing cost. It increases the customer satisfaction
and manages the cost more effective.

        The study on ‘value chain analysis of mango in Chittoor district of Andhra Pradesh’
has been conducted during 2017 to analyze the area, production, marketing channels,
processing units, constraints for value chain and to arrive the actionable activities to be
undertaken to further encourage and strengthen the mango value chain system in Chittoor
district. Chittoor is the leading district with regard to area (77637 ha) and production (854007
t) of mango in Andhra Pradesh.

        A survey was taken up in different mandals of Chittoor district in which the total
mango sample farmers covered were 96, processors were 10, traders were 21, nursery units
were 11. Among the sample farmers, majority are in the age group of 45-50 years, the
education levels are intermediate and below tenth. The maximum number of farmers holding
an area of 2.5-5.0 acres. Major mango varieties grown are Totapuri, Banishan, Alphonso.
Majority of the mango processors are graduated and are in the age group of 45-50 and the
major value added mango product is mango pulp. Among the traders, majority are falling in
the age group of 55 to 60 years and possessing 20 to 30 years of experience in trading of
mango in Chittoor district.

        There are only two Govt. nursery units in Chittoor district, one is at Srikalahasthi
(producing nearly 1,00,000 saplings per year) and the other one is at Tirupathi (producing
nearly 25,000 saplings per year) , which are unable to meet the demand of farmers. The
nursery units expressed that Govt. is not giving license to them, facing problem with transport
and experiencing loss. Also, experiencing pest problem to the mango nursery. Private nursery
units are not propagating seedlings on their own and they are simply purchasing from different
districts and selling to the local farmers.

        On interaction with farmers, they expressed that, they want subsidy for fencing and
further increase in subsidy for drip installation. They are facing shortage of availability of
field labour. Maximum no. of farmers are unaware of insurance. They are unhappy with
traders commission of 5%. The occurrence of rainfall during flowering stage resulting in low
production levels. They expressed no proper ripening chambers facility in the mango

                                                 1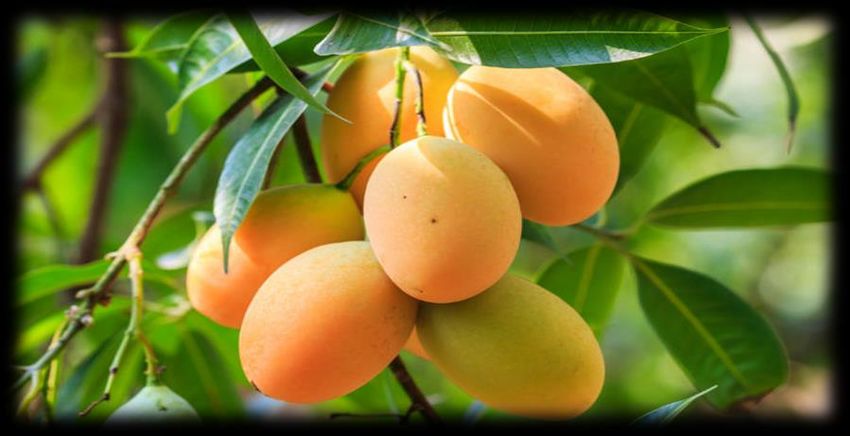
marketing yards. They are facing shortage of pack house facility also. The Govt. is providing
subsidy for pack houses but they are feeling difficulty to bear the initial capital investment.
They are expressed that the Govt. should encourage use of mango value added products more
and more officially in schools and different departments. There are about 14 Farmers
Producers Organizations (FPO’s / FPC’s) registered with the Dept. of Horticulture, A.P.
covering 2404 farmers and 5560 ha area.

       On interaction with the traders, in general they opined that export business is getting
declined. Some of the farmers are selling mangoes directly to processing units. Farmers are
asking to reduce the commission amount of 5%. They are facing heavy competition among
themselves and entry of big traders leading to loss of scope for small traders. They are facing
the constraint that buyers are not coming forward. They also expressed that there are no
ripening chambers in market yards.

       The processers expressed that they are facing problems in getting loans from the
banks, feeling the GST charges @ 12% as heavy when compared to the earlier tax of 5%.
They want concession in electricity charges during off season. They also expressed that Govt.
should further encourage use of value added mango products in all official activities like mid
day meals in schools and others.

       The Dept. of Horticulture, A.P. is taking different measures to encourage the export
of mangoes and other horticultural crops viz., formation of FPOs, arranging buyers sellers
meet, arranging conferences/workshops with FPOs & companies/retailers, providing 75%
assistance for formation, capacity building & development of infrastructure, providing
assistance for development of post harvest & marketing facilities like pack house / farm
collection unit, integrated pack houses, pre cooling units, cold storages, primary processing
units / minimal processing units fruit ripening chamber evaporative low energy cool chamber,
low cost produce storage structure, refrigerated transport vehicles / transport vehicles from 1
ton to 6 tones capacity based on actual need of FPO, farm mechanization equipments, custom
hiring centres, retail marketing outlets and any other pre / post harvest / marketing
infrastructure as per the local need.
       The following actionable points were arrived to further strengthen the mango value
chain in Chittoor district, Andhra Pradesh.
   1. Increase the Govt. nursery units in major mango growing mandals for supply of
       genuine planting material.

                                              2
2. Provide licenses to private nursery units and frequently arrange short term (1 to 3
   days) training programmes and reviews to the private nursery unit managers on pest
   management and maintaining healthy mango seedlings.
3. Including the item of fencing around mango orchards in the present subsidy
   programmes list of Govt. as wild animals attack is becoming major threat to farmers.
4. Arrange awareness programmes to farmers with regard to crop insurance to protect
   them in the events of unexpected calamities.
5. To encourage mechanization to reduce the dependence on limited labour availability,
   more no. of custom hiring centers may be established. The net work of custom hiring
   centers should be strengthened to such an extent that, the hiring of implements should
   be made very easy like by downloading an app in the smart phones and booking. (For
   ex. how the private cabs are booked now by citizens in different cities).
6. To facilitate establishing solar based cooling chambers at farm levels by including
   them under subsidies list and encouraging on educating on that aspect, as only 12
   cooling chambers (private) are available to store 854007 MT of mango.
7. To increase the solar based refrigerated transport facilities on custom hiring basis to
   increase the shelf life of mangoes and reduces the fruit losses and to preserve the fruit
   quality.
8. Increase the infrastructure facilities like pre cooling chambers, ripening chambers,
   pack houses at every market yard.
9. To arrange regular short term training programmes to farmers of different age groups
   to review their knowledge and update with regard to scientific management of
   cultivation aspects and export oriented awareness programmes.
10. For the processors, necessary leverage may be provided with regard to electricity
   charges during off season.
11. The rules with regard to the eligibility of the processors to receive the bank loans may
   be modified on discussions with the banking officials and processors.
12. The Govt. should encourage use of mango value added products and include them in
   different government schemes like mid day meals to school children, supply of rations
   to economically backward citizens etc.
13. Creating awareness programmes to attract young generation to enter in to the
   profession of agriculture / horticulture.
14. Include the subject of value chain in science subject at school and college levels
   education syllabus to increase the awareness from school children level.

                                               3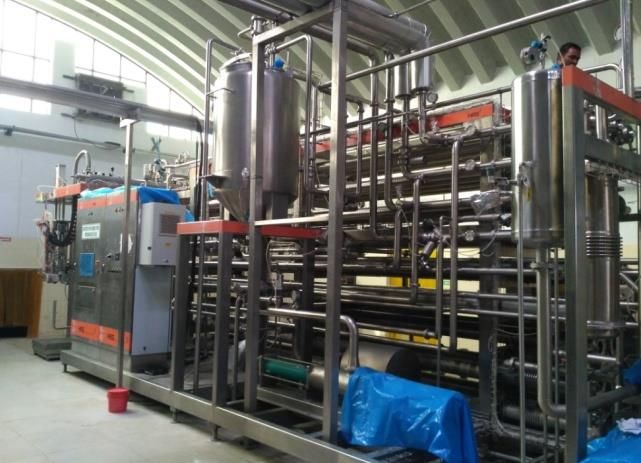
15. Encourage the organic cultivation in a large scale for quality production and premium
      price realization in clusters.
   16. Promotion of pack houses by the growers and promoters of Integrated pack houses by
      the FPOs to promote exports and group marketing.
   17. Protocols to be developed for packing and transport to distance markets within the
      country (Corrugated Fibre Board Cartons/boxes).
   18. Popularization of nutrient value of Mangoes to the public for increased consumption
      and better health for promotion of table varieties.
   19. Development of Market yards with Ripening chambers, Cold Rooms on custom
      service basis by the private enterprises.
   20. To request the South Central Railways to allot more parcel vans (20*25 BCN
      Wagons) and to run special trains to North India during the season.
   21. Promotion of direct marketing between farmers and processing industries to avoid
      middle men to get remunerative prices to the Mango Farmers.
   22. At present production is not meeting the demand of processing industries. There is
      need to promote processing varieties like Banglora, Alphanso e.t.c.
   23. Promotion of small scale industries for production of Mango jelly, candy, tandra and
      other value added products.
   24. Introduction of Technologies for different value added products like Solar Drying,
      minimal processing.
   25. Modernization of existing processing industries for IQF and other value added
      products and production of quality pulp with international standards.

Export of Mangoes:

   1. Providing cargo facility at International Airport, Tirupathi for export of Mangoes to
      South East Asian countries.

   2. Air Fright charges for perishable goods may have to subsidized.

   3. Promotion of Integrated Pack houses with vapour heat treatment and irradiation
      facilities to export to European and other destinations.

                                              4
1. Introduction
1.1 Botanical Name of Mango and its Cultivation

       The Mango, Mangifera indica L., which belongs to the family of Anacardiaceae, is
one of the most important tropical and subtropical fruits of the world and is popular both in
fresh and processed forms. It is called as the king of fruits on account of its nutritive value,
taste, attractive fragrance and health promoting qualities. In many languages it is called the
mother of all tropical fruits and is the national fruit of India. Mango has been in cultivation in
Indian subcontinent for well over 4,000 years and has been the most favorite fruit since ages.
Historical facts revealed that mango was introduced to India archipelago from the main land.
Some researchers are of the view that it had originated in the Indo –Burma region. Presently,
besides India, it is being cultivated world over especially, in the South and South-East Asian
countries, African countries, tropical Australia and the USA. In USA mango is grown mostly
in Florida, Hawaii, etc. Mango is also grown in Venezuela, Mexico, Brazil, West Indies
Island and Cambodia.

1.2 Mango in Sanskrit Scriptures

       Mango has been portrayed in the ancient paintings and sculptures, Hindu folklore and
mythology, legends and in the sacred Sanskrit scriptures dating back to 2000 BC. Mango
continued to be grown as a seedling tree until the establishment of the Moghul rule in India.
During the Moghul period seedling trees were designated as distinct varieties and attempts
were made to promote vegetative propagation. Akbar, the great Moghul emperor (1556 to
1605), planted mango orchards of 0.1 million trees near Darbhanga in Bihar. This was the
time when mango actually got royal patronage. In India the first systematic record of
varieties of mango was available in “Ain-e-Akbari”, the biography of Akbar, AD 1590, by
Abul Fazl. However, mango orchard remained the prerogative of the “Rajas and Nawabs” for
a very long time. Mango cultivation has now been taken up commercially.

1.3 Important Characteristics of Mango

       The mango tree is a large branched perennial tree with height of 30-40 m and a crown
radius spreading about 10 m. The flowers are produced in terminal panicles of 10-40 cm long
and each flower has 5 petals of 5-10 mm long. After flowering, the fruit, which is a drupe,
takes three to six months to ripe. The Mango fruit varies considerably in size, shape, color,
presence of fiber, flavor, taste and several other characters. The shape of the fruit varies from
round to ovate-oblong or longish, with the length ranging from 2.5 to 30 cm in different

                                                5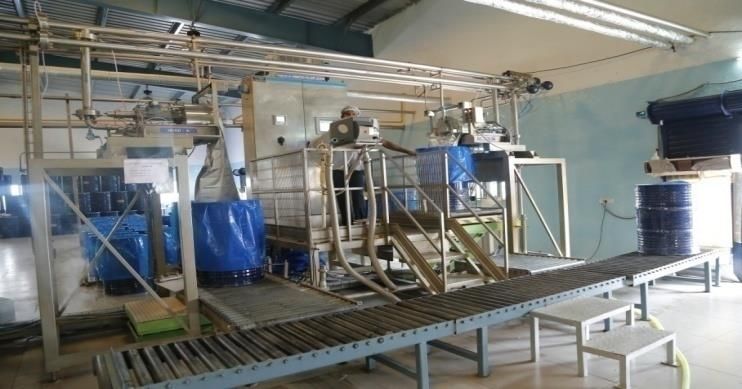
varieties. The weight of mango goes up to 2.5 kg for some varieties. However, the average
size of mango available in India marked weighs about 200- 350 grams. The ripe fruit is
yellow, orange or red in color; usually reddish on the side facing the sun. Mango is well
adapted to tropical and sub tropical climates. The ideal temperature ranged for mango is 240
to 300 C during the growing season, along with high humidity. A rainfall ranging from 890
mm to 1015 mm in a year is considered to be ideal for growing mangoes. Dry weather before
blossoming is conducive to profuse flowering. Mangoes, ripe or unripe, are widely used as a
fresh fruit. It is also used to make juice, milk shake, pulp, jam, jelly, pickle, and chutney.
Ripe mango is often cut into thin layers, desiccated, folded and then cut and sold as mango
chewy bars. Pieces of the fruit can be mashed and used in ice-cream. Dried unripe mango,
mainly amchur is used as a spice in India

1.4 Nutritional Value of Mango

       Mango is nutritious and an excellent source of carotene as compared to other fruits. A
100 gram of edible portion of the mango contains about 1,990 mcg of beta-carotene (vitamin
A), which is much higher than the same in other fruits. Eating mangoes in the season may
provide a store of vitamin A in the liver, sufficient to last for the rest of the year and highly
beneficial for the prevention of vitamin A deficient disorders, like night blindness. Mangoes,
both ripe and unripe, are good source of vitamin C. About 16 mg of vitamin C is present in
100 gram of mango. Ripe mango provides a good source of calories and supplies 74 kcal per
100 gram.

1.5 Commercialization of Agriculture— Traditional to New crop

       Mechanization, diversification and commercialization of agriculture resulted in
shifting of cropping pattern from traditional crops to new crops, which had contributed to the
increased area and production under Mango. Changing demand pattern also contributed
significantly to shifting of more area under production of mango. However, marketing and
processing of mango have not picked up commensurate with the level of production. Further,
supportive mechanism in the form of agriculture inputs, post-harvest infrastructure set up,
such as packaging, pre-cooling, cold storage, pack houses, marketing system, and
institutional credit have not come up in proportion to the increase in production of fruit. Even
though India is the world’s largest producer of mango, it accounts for less than one per cent
of global mango trade. Around 95 per cent of India’s mango exports are routed to the
Middle-East countries, whereas only 5 per cent is channeled to Europe and America, Japan,
Hong Kong etc. Further, exports of mangoes in the processed form remain limited. Besides,

                                                6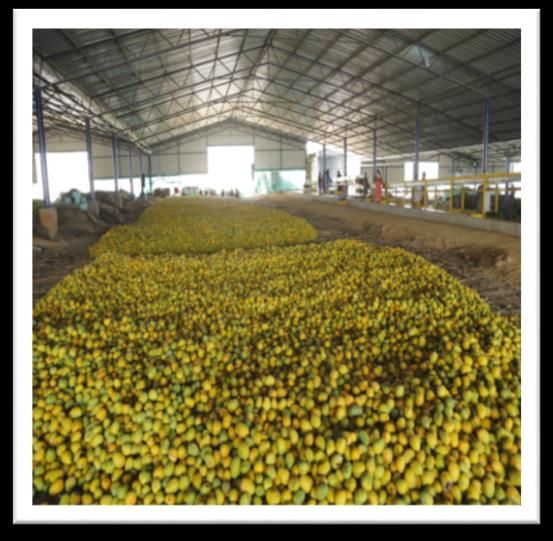
high perishability, absence of post-harvest facility, lack of standardized supply chain system,
etc. resulted in loss of about 25-30 per cent of the total mango production during post-harvest
period. This reduces further availability of fruits for consumption, value addition and export.
There are issues such as weak institutional arrangements, limited marketing facilities, lack of
coordination among the various organizations, etc. that have acted as hindrance to the growth
of mango. The whole lot of the issues encompasses the supply chain system (SCS) within the
mango-processing sector. The importance of this study on mango lies in addressing these
issues affecting the above mentioned parameter.

1.6 Value chain

           A Value chain is a network of facilities and distribution options. The chain of
activities gives the product more added value than the sum of added values of all activities.
The ultimate goal is to maximize value creation and minimizing cost. For increasing
customer satisfaction and managing cost more effective. A systematic approach to examining
the development of competitive advantage. The value chain has also been called supply chain
and the service chain. An operational strategy if implemented properly, will provide a new
dimension to competing: quickly introducing new customized high quality products and
delivering them with unprecedented lead times, swift decisions, and manufacturing products
with high velocity

1.7 Importance of Value Chain

           Any product without any value addition when sold in market in the raw form will
fetch relatively low price. Further there would not be much of product differentiation. At
each stage of supply chain, there would be additional cost without any additional value.
However, in value chain, at each stage, of the stake holder’s involvement there would be
additional value to the product in the form of packaging, processing, quality branding,
grading, etc. Therefore awareness and skill development to the farmers will help them in
identifying the market opportunities and tap the available potential resulting in enhanced
profits.

1.8 The Scope of the study

           The study covers a sample of nursery units, mango growers, mango processors,
traders, mango growers’ associations etc. The findings & recommendations are based on
discussions with the above samples from different categories and district level functionaries

                                               7
like, officials from the Department of Horticulture (DOH) at the district level marketing
committees.
1.9 Objectives of the value chain analysis
1. To conduct a sample survey in Chittoor district of Andhra Pradesh from different
partners of value chain of mango viz., nursery units, farmers, traders and processing
units.
2. To analyse the existing situation with regard to value chain of mango and study the
potential of mango value chain and constrains being faced by different partners of
value chain.
3. To arrive the actionable activities to be undertaken to further encourage and
strengthen the mango value chain system in Chittoor district.
82. Status of mango cultivation
Andhra Pradesh has emerged as 2nd largest fruit producing state in the country. In
Andhra Pradesh, mango is being cultivated in an area of 0.30 million ha with a
productivity of 2.73 million MTs.
Average productivity of mango is 10 ton per ha in AP compared to national average
of 7.2 ton per ha.
Uttar Pradesh is the leading state in mango productivity of 16.00 ton per ha while
Kenya is the leading country in world with a productivity of 48.8 ton per ha
Map of Chittore district, Andhra Pradesh
Fig 1: Administrative map of Chittoor district, Andhra Pradesh.
• There are total 66 mandals in Chittoor district.
• Major mango growing mandals (more than 1000 ha) – 25 no.
• Rompicherla (2023 ha), Yerravaripalem (2909 ha), Chandragiri(1978 ha),
Chinnagottigallu (2321 ha), Sodam (2881 ha), Pulicherla (3668 ha), Pakala (2889 ha),
Vedurukuppam (1033 ha), Ramachandrapuram (1382 ha), Vadamalapeta (2264 ha),
Puttur (2250 ha), Karvetinagar (2686 ha), Puthalapattu (1738 ha), Irala (3366 ha),
Somala (2340 ha), Chowdepalle (1181 ha), Thavanampalle (2773 ha),
Gangadharanellore (1483 ha), Chittoor (1385 ha), Palamaner (1188 ha), Baireddipalle
(1327 ha), Venkatagirikota (1273 ha), Ramakuppam (1210 ha), Bangarupalem (4163
ha) and Yadamarri (1620 ha).
9• Mandal having maximum area under mango:
Bangarupalem - 4163 ha
Pulicherla - 3668 ha
• Mandal having minimum area under mango:
Tirupathi (urban) – 13 ha
Nagalapuram – 47 ha
Area in ha
Chittoor 77637
62464
Ananthapuram 47686
43418
Kadapa 27500
(Source: Brouchure on Flavour of Andhra
15864Pradesh, 2017, Dept. of Horticulture, Govt. of A.P.
Visakhapatnam 14023
10520
Srikakulam 10232
9012
Prakasham 8458
6765
Guntur 1062
Fig 2: Area wise distribution of mango in Andhra Pradesh.
Production in MTs
854007
687104
687104
524546
Production in MTs
477598
302500
174504
154253
115720
112552
99132
93038
74415
Fig 3: Production of mango in Andhra Pradesh.
(Source: Brouchure on Flavour of Andhra Pradesh, 2017, Dept. of Horticulture, Govt. of A.P.
102.1 The predominant varieties cultivating in the Chittoor District
S.No Name of the variety Area (Ha)
1 Totapuri 37,889
2 Benishan 27,000
3 Neelum 25,000
4 Others 8,524
Total 98,413
2.2 Availability of different varieties of mango in market
S.No Name of the variety Availability of the fruit
1 Totapuri June – August
2 Baneshan May – June
3 Neelum July – September
4 Pulihora Round the year
5 Alphanso April – May
6 Rumani June
7 Mallika May
8 Kalepahad June
9 Imampasand May
2.3 Varietal wealth of Andhra Pradesh
The commercial mango varieties grown are Banganapalli, Suvarnarekha, Neelam,
Totapuri etc.
Varieties suitable for processing are Alphanso and Totapuri.
Varieties suitable for export are Immampasad, Benishan, Suvarnarekha and
Alphonso.
2.4 Varietal wealth of Chittoor district
The commercial mango varieties grown are
Banganapalli (Benshan)
Totapuri
Neelum
Mallika
11 Alphonso,
Kesar etc.
2.4.1 Banganapalli (Benishan)
Variety suitable for dry areas; fruit large sized; obliquely oval in shape, golden yellow in
colour; good keeping quality; good for canning; biennial in habit.TSS 14-19 % Producing
areas: Krishna, East Godavari, West Godavari, Guntur, Prakasham, Srikakulam,
Vizianagaram, Kurnool, Visakhapatnam, Nellore, Kadapa and Ananthapuram.It has got a
Geographical Indication (GI) tag, making Andhra Pradesh the proprietor of the variety known
for its sweetness.
2.4.2 Totapuri (Bangalora)
Fruits medium-large, oblong shaped with pointed base with golden yellow colour,good
keeping quality; used for processing, heavy and regular bearing variety.TSS 14-
16%.Producing areas: Vizianagaram, Visakapatnam, East Godavari, Krishna, Prakasham,
Nellore, Chittoor, Kadapa, Ananthapuram and Kurnool
2.4.3 Neelum
Fruit shape is oblong oval, color of skin is Greenish Yellow, skin texture is smooth, yellow
pulp colour. Late and regular bearer.TSS 19 %.Producing areas: Srikakulam, Vizianagaram,
Visakhapatnam, East Godavari, Krishna, Prakasham, Nellore, Chittoor, Kadapa, Kurnool and
Ananthapuram
2.4.4 Mallika: Regular bearer, large fruits of oblong elliptical shape and cadmium yellow
coloured. Fruit quality is good.
2.4.5 Alphanso
Grown in Maharashtra, Gujarat, Karnataka and Madhya Pradesh. Fruit medium in size, ovate
oblique in shape, orange yellow in colour; juice is moderate-abundant. Excellent keeping
quality, good for pulping and canning; mainly exported as fresh fruit to other countries. Flesh
develops spongy tissue.
2.4.6 Kesar
Fruit medium oblong with a red blush on the shoulders, Good keeping quality, ideal for
pulping and juice concentrates, early season variety
12Banganapalli (Baneshan) Totapuri (Bangalora)
Neelum Mallika
Alphanso Kesar
Fig 4: The list of mango varieties grown in Chittoor district of Andhra Pradesh
132.4 Govt. initiatives for promotion of mango in Andhra Pradesh.
Encouraging good Agriculture practices like INM/ IPM, organic cultivation, rejuvenation and
post harvest technologies in large scale for quality production and promotion of export of
mango.
The Govt. is providing financial assistance for establishment of pack houses, ripening
chambers, integrated pack house and functional market infrastucture etc. under National
Horticulture Mission, State plan and RKVY programmes. Rejuvenation of old orchards is
another important programme being implemented by the department to improve the
productivity of existing old orchards. In association with APEDA the Department is
implementing cluster development project for promotion of exports from Andhra Pradesh by
registering farmers in APEDA Hortinet website.
143. Materials and methods
To study the value chain analysis of mango in Chittoor district. The data has been
collected in the state Andhra Pradesh of Chittoor district in the prescribed format which is
enclosed in annexure –I, II, III, IV the total number of farmers are 96, processors are 10,
Traders are 21, Nursery units are 13.The detailed surveyed data of farmers, processors,
traders, nursery units in the Chittoor district of different mandals are enclosed in annexure V,
VI, VII, VIII. The data consists of mango sample growers age, education, land area,
production details, processors investment details, Traders details and nursery units. The list of
existing processing units in Chittoor district are provided in annexure IX.
Table 3.1 Details of data collected for value chain analysis in Chitoor.
Farmers 96
Processors 10
Traders 21
Nursery units 13
Total 138
Fig 5: Various channels in mango value chain
154. Results
4.1 Nursery units:
Qualitative and quantitative crops can essentially be produced from healthy plants
which in turn are produced only when their seedlings/ saplings are vigorous and healthy.
Nursery is consequently the basic need growing horticultural crops. Plant propagation
techniques and practices is the core of horticulture nurseries. The planting materials for
horticultural plantations are raised from seeds and vegetative parts.
We surveyed the following mango growing nurseries in Chittoor district.
Table 4.1 Nursery units and varieties supplied by them in Chittore district
S
Name of the Nursery Grower Varieties
No
Totapuri, Benishan, Neelum, Baganpalli and
1 Dinakar Gardens, Chittoor
Khader
Totapuri, Benishan, Neelum, Baganpalli and
2 Prabhakar Nursery Gardens, Chittoor
Khader
Totapuri, Benishan, Neelum, Baganpalli and
3 YMN Nursery gardens, Chittoor
Khader
Totapuri, Benishan, Neelum, Baganpalli and
4 Sridhar Nursery Gardens, Chittoor
Khader
Vishnu Teja Nursery Gardens, Totapuri, Benishan, Neelum, Baganpalli and
5
Chittoor Khader
Totapuri, Benishan, Neelum, Baganpalli and
6 Laxmi nursery gardens, Chittoor
Khader
Totapuri, Benishan, Neelum, Baganpalli and
7 Srikrishna Nursery Gardens, Chittoor
Khader
Sri Sai ram Nursery Gardens, Totapuri, Benishan, Neelum, Baganpalli and
8
Chittoor Khader
Totapuri, Benishan, Neelum, Baganpalli and
9 BRR Nursery , Chittoor
Khader
Totapuri, Benishan, Neelum, Baganpalli and
10 Suvera Nurseries, Chittoor
Khader
Totapuri, Benishan, Neelum, Baganpalli and
11 Chandra nursery gardens, Chittoor
Khader
Totapuri, Benishan, Neelum, Baganpalli and
12 Horticulture farm, Srikalahasti
Khader
16Totapuri, Benishan, Neelum, Baganpalli and
13 Horticulture farm, Tirupati
Khader
For our convenience we divided the nurseries in to three groups based on their
area i) Small scale: area < 10000 m2, ii) Medium scale: area 10000-20000 m2 and iii) Large
scale: >20000 m2.
Production details of small scale nursery (areaand Rs. 12000 respectively. The cost on labour was Rs. 100000. The total amount required to
spend for small scale nursery was Rs. 148357.
Table 4.4: Production details of medium scale nursery (area 10000-20000 m2)
Name of the Price per Mean gross
S.No. Quantity sold per year
variety sapling income (Rs)
Minimum Maximum Mean
1 Totapuri 240 480 345 70 24150
2 Benishan 960 960 960 70 67200
3 Neelam 600 960 780 70 54600
4 Mallika 336 600 504 70 35280
5 Khader 600 960 720 70 50400
231630
Production details of medium scale nursery (area 10000-20000 m2) are shown in
Table 4.4. In Totapuri variety total 345 plants were sold at 70 rupees per sapling. The mean
gross income gained was Rs. 24,150. In Banishan variety total 960 saplings were sold at 70
rupees per sapling. The mean gross income gained was Rs. 67,200. Total 780 saplings were
sold at 70 rupees per sapling and Rs. 54,600 gained in Neelam variety. In Mallika total 504
saplings sold at 70 rupees and Rs. 35,280 gained. In Khader total 504 saplings were sold at
70 rupees and Rs. 50,400 gained. The total amount gained from all the varieties was Rs.
2,31,630.
Table 4.5: Cost structure of medium scale nursery (area 10000-20000 m2) in rupees
Particular Mean total cost Cost per 1000 m2
Raw material 6964 130
Seed material 13236 247
Fertilizers 27575 514
Pesticides 12000 224
Irrigation 1200 22
Labour 150000 2799
210975 3936
Cost structure of medium scale nursery (area 10000-20000 m2) in rupees are
shown in Table 4.5. For medium scale nursery, mean total cost required of raw material was
at Rs. 6964. The seed material available at Rs. 13236. The mean total cost of fertilizers and
pesticides is Rs. 27575 and Rs. 12000, respectively. The mean total cost on labour was Rs.
150000. The Mean total cost required to spend for medium scale nursery is Rs. 210975.
18Table 4.6: Production details of large scale nursery* (area >20000 m2)
S.N Name of the Quantity sold per year Price per Mean gross
o. variety Minimum Maximum Mean sapling income (Rs
1 Totapuri 0 5000 2500 30 75000
2 Benishan 15000 50000 32500 30 975000
3 Neelam 0 5000 2500 30 75000
4 Mallika 5000 10000 7500 30 225000
5 Khader 5000 30000 17500 30 525000
1875000
*Horticulture farm nurseries, Department of Horticulture, A.P.
Production details of large scale nursery (area >20000 m2) are shown in Table 4.6.
In Totapuri variety total 2500 plants were sold at 30 rupees per sapling. The mean gross
income gained was Rs. 75,000. In Banishan variety total 32,500 saplings were sold at 30
rupees per sapling. The mean gross income gained was Rs. 9,75,000. Total 2500 saplings
were sold at 30 rupees per sapling and Rs. 75,000 gained in Neelam variety. In Mallika total
7500 saplings sold at 30 rupees and Rs. 2,25,000 gained. In Khader total 17,500 saplings
were sold at 30 rupees and Rs. 5,25,000 gained. The total mean gross income gained from all
the varieties was Rs. 18,75,000.
Table 4.7: Cost structure of Large scale nursery (area >20000 m2) in rupees
Particular Mean total cost Cost per 1000 m2
Raw material 127000 1551
Seed material 312500 3817
Fertilizers 625000 7633
Pesticides 75000 916
Irrigation 4000 49
Labour 400000 4885
1543500 18851
Cost structure of Large scale nursery (area >20000 m2) in rupees are shown in
Table 4.7. For Large scale nursery, the mean total cost required raw material was Rs. 127000.
The seed material available at Rs. 312500. The cost of fertilizers and pesticides was Rs.
625000 and Rs. 75000, respectively. The mean total cost on labour was Rs. 400000. The
mean total cost required to spend for large scale nursery was Rs. 1543500.
19Table 4.8: Return on Mango nursery units of different scale
Small scale Medium scale Large scale
Particulars (20000 m2)
Total cost 148357 210975 1543500
Gross income 172800 231630 1875000
Net income 24443 20655 331500
B:C 0.16 0.10 0.21
Return on Mango nursery units of different scale is shown in Table 4.8. The
total cost incurred on small scale nursery was Rs. 1,48,357, on medium scale nursery it was
Rs. 2,10,975, whereas for large scale nursery it was Rs. 15,43,500. The gross income of small
scale nursery, medium scale nursery and large scale nursery was Rs. 1,72,800, Rs. 2,31,630
and Rs. 18,75,000, respectively. Whereas, net income was Rs. 24,443, Rs. 20,655 and Rs.
3,31,500 for small scale nursery, medium scale nursery and large scale nursery, respectively.
Net income
350000
325000
300000
275000
250000
225000
Net income
200000
175000
150000
125000
100000
75000
50000
25000
0
Small scale nursery Medium scale nursery Large scale nursery
Fig 6: Net income of mango nursery units of different scale
4.2 Mango growing farmers:
The survey had done based on different age groups of mango sample growers in
Chittoor district of different mandals in which maximum range of the farmers are in the age
group of 45-50 years and minimum range of the farmers in the age group of 30-35 years, and
the highest number of sample mango growers are present in Bangarupalyam.
20Table: 4.9 Age wise Distribution of Mango growers
Mandals
S. Bangar Irala Thanva Y.V.Pa K.V.Pa Chitoor Chima Others Tot
Age
No upalya palli lem lli gorikol al
m
1 30-35 - - - - - - - 1 1
2 35-40 - - 2 - - - 1 - 3
3 40-45 11 - 2 3 - - - 2 18
4 45-50 16 14 - - 2 3 - - 35
5 50-55 11 6 - 3 - - - 20
6 55-60 1 4 4 - 1 - - - 10
7 60-65 - - 4 - - - - - 4
8 65-70 - - 4 - 1 - - 5
9 Total 39 24 16 6 4 3 1 3 96
18
16
14
12
30-35
10
8 35-40
6 40-45
4 45-50
2 50-55
0 55-60
k.v.palli
Thanvapalli
Irala
y.v.palem
chitoor
Chimagorikol
others
Bangarupalyam
60-65
65-70
Mandals
Fig 7: Age wise Distribution of Mango growers
The survey had done based on different levels of education of mango sample
growers in Chittoor district of different mandals in which maximum level of the growers are
intermediate and next level are below 10th.
21Table: 4.10 Distribution of Sample Mango Growers by level of Education
Mandals
S.N Tot
Education Bangaru Irala Thanv Y.V.P K.V Chitto Chimagori 0the al
o
palyam apalli alem Palli or kol rs
1 Below`10th 16 14 3 1 2 - - 2 38
2 SSC 3 2 6 3 2 2 1 - 19
3 Intermedia 19 8 4 3 - 1 - - 35
te
4 Degree 1 - 3 - - - - - 4
5 Total 39 24 16h 6 4 3 1 2 96
The survey had done in different mandals of Chittoor the total land is 282 acres in that
bangarupalyam farmers ranged majority and maximum no of farmers holding the area of 2.5 -
5.0 acres
20 Below`10th
18 ssc
Intermediate
16
Degree
14
12
10
8
6
4
2
0
0thers
Y.V.Palem
Irala
K.V Palli
Chittoor
Bangarupalyam
Thanvapalli
Chimagorikol
Mandals
Fig 8: Distribution of sample mango growers by level of education.
22Table 4.12 Land Size Distributions of Sample Orchards (in Acre)
Mandals
S.No Area Banga Irala Thanvap Y.V.Pal K.V.Pal Chitoo Chima Others
rupaly alli em li r goriko
am l
1 Below 2.5 2 11 - - 1 2 - -
2 2.5-5.0 29 13 1 1 1 1 - -
3 5.01-10 4 - 4 4 2 - - 3
4 10.01-25 - - 3 1 - - 1 -
5 Total 35 24 8 6 4 3 1 3
82
The study conducted and surveyed in different mandals of Chittoor in that Majority
have mango orchards in the maximum range of 2.5 to 5.0 ha and minimum range of mango
orchards of 5.01-10
Table 4.13 Area wise Distribution of sample mango orchards (Area in acre)
Mandals
S.N Bangar Irala Thanv Y.V.P K.V Chitto Chima others Total
Area
o upalya apalli alem Palli or gorikol
m
1 Below 19 12 - - 2 2 - - 35
2.5
2 2.5-5.0 19 5 11 1 3 1 1 4 44
3 5.01-10 7 - 6 7 - - - - 20
4 10.01-25 - - - - - - - - -
5 Total 45 17 17 8 5 3 1 4 99
The survey had done in Chittoor district of different mandals in that farmers are
growing Major varieties are Totapuri, Benishan, Alphonso.
Table 4.14 Varietal Distribution of Sample Mango Orchards
No Of Farmers Growing In Different Mandals
Varetial
S.N Tot
Distributio Banga Thanv Y.V.P K.V.P Chitoo
Chima
o rupaly Irala goriko others al
n apalli alem alli r
am l
1 Totapuri 39 25 15 2 1 3 - - 85
2 Bensihan 22 9 12 3 4 2 1 2 55
3 Alphonso 12 4 5 - 1 - - - 22
4 Mallika 2 4 - 4 3 1 - 2 15
5 Neelum 2 1 3 - 2 1 2 - 11
6 Kesar 1 1 - - - - - - 2
23Table 4.15: Establishment cost of mango orchard per acre in Chittoor district during
first year
Mean % of total
PARTICULARS Minimum Maximum
Rs/ acre cost
Fencing 0 33333 5229 10.0
Digging pits 1000 25000 3477 6.6
Manures & fertilizers 1000 50000 16407 31.4
Seed/transportation 0 25000 4646 8.9
Inter cultivation 0 25000 4469 8.5
Irrigation 0 33333 5552 10.6
Labour 1250 42857 11574 22.1
Land tax/year 150 6667 253 0.5
Miscellaneous 0 333 4 0.0
Total cost 51611
The details of establishment cost of mango orchard per acre in Chittoor district during
first year is presented in Table 4.15.
The total costs incurred during first year of mango cultivation amounted to Rs. 51611.
It can be seen that among different operational costs, manures and fertilizers formed the
major item with Rs. 16,407 (31.4 per cent). Next to manures and fertilizers, cost of labour
charges formed the major item of expenditure which worked out to Rs. 11,574 (22.1 per cent)
followed by irrigation (10.6 per cent), fencing (10.0 per cent) and seed/transportation (8.9 per
cent), inter cultivation (8.5 per cent) and digging of pits (6.6 per cent).
Table 4.16: Maintenance cost of mango during 2nd to 6th year
2nd year 3rd year 4th year 5th year 6th year
Particulars/ye % of % of % of % of % of
ar Rs/ac Rs/ac Rs/ac Rs/ac Rs/ac
total total total total total
re re re re re
cost cost cost cost cost
Gap filling 433 4.4 0.0 0.0 0.0 0.0
Manuring 833 8.5 433 7.4 400 8.0 655 12.4 900 15.4
Fertilizers 1333 13.7 1167 20.1 1100 22.0 1117 21.2 1183 20.3
Irrigation 433 4.4 317 5.4 400 8.0 383 7.3 500 8.6
Inter
2733 28.0 1000 17.2 0 0.0 0 0.0 0 0.0
cultivation
Plant
833 8.5 550 9.5 667 13.3 675 12.8 900 15.4
protection
Land tax 100 1.0 100 1.7 100 2.0 100 1.9 100 1.7
Labour 3050 31.3 2250 38.7 2333 46.7 2333 44.3 2250 38.6
9750 5816 5000 5263 5833
24Maintenance cost of mango during 2nd to 6th year are presented in Table 4.16. The
total costs incurred during 2nd, 3rd, 4th, 5th and 6th year were Rs. 9750, Rs. 5816, Rs. 5000, Rs.
5263 and Rs. 5833, respectively. The operations such as watering and weeding required more
human labour requirement.
Costs incurred towards labour during 2nd, 3rd, 4th, 5th and 6th year were Rs.3050.00
(31.3 per cent), Rs.2250.00 (38.7 per cent), Rs.2333.00 (46.7 per cent), Rs.2333.00 (44.3 per
cent) and 2250.00 (38.6 per cent), respectively. Costs incurred towards human labour were
increased from 2nd to 4th year and decreased from 4th to 6th year. It was mainly due to the
operations such as watering the plants, weeding, application of manures and fertilizers and
intercultural operations demanded more labour requirement in the earlier years. Inter
cultivation was taken up till 2nd and 3rd year only. Costs incurred towards Manures and
fertilizers during 2nd to 6th year ranged from Rs 833 to Rs.900 and Rs. 1333 to Rs. 1183,
respectively. Plant protection chemicals were applied from 2nd year onwards and the
expenditure on which came to Rs. 900 (15.4 per cent). As the plants grew up watering the
plants gradually increased, which raised the cost from Rs. 433 (4.4 per cent) to Rs 500 (8.6
per cent). Gap filling was done only in 2nd year.
Table 4.17: Maintenance cost of mango during 6th to 32nd year
6 to 10 years 11 to 20 year 21 to 32 years
% of % of % of
Rs/acre total cost Rs total cost Rs total cost
Gap filling
Manuring 675 11.4 552 9.5 565 9.6
Fertilizers 1230 20.7 1270 21.9 1262 21.5
Irrigation 525 8.8 525 9.0 524.5 8.9
Inter cultivation 0.0 0.0 0 0.0
Plant protection 909.5 15.3 858 14.8 910 15.5
Land tax 100 1.7 100 1.7 100 1.7
Labour 2500 42.1 2500 43.1 2500 42.7
Sum 5939.5 5805 5861.5
Maintenance cost of mango during 6th to 32nd year is given in the Table 4.17. The
total costs incurred towards mango cultivation during 6 to 10 years were Rs. 5939.5, 11 to 20
years were Rs. 5805 and 21 to 32 were Rs. 5861.5. Total costs were almost of the same
magnitude with little variations.
25The costs incurred on labour charges took major share from 6th to 32nd year. As the
age of the orchard increased, yield of the orchard, application of fertilizers, plant protection
measures, irrigation requirement also increased, which subsequently demanded more labour.
The total costs incurred towards fertilizer application in 6th to 10th year was Rs. 1230
(20.7 per cent), in 11th to 20th year was 1270 (21.9 per cent) and in 21st to 32nd year was Rs.
1262 (21.5 per cent). The cost incurred on fertilizers was more in 11-20 years time period and
it was decreased in 20-32 years time duration. The reason might be that as the economic life
of orchard was on the decline, not much care was taken in performing different operations by
the farmers. The total costs incurred towards manure application in 6th to 10th year was Rs.
675 (11.4 per cent), in 11th to 20th year was 552 (9.5 per cent) and in 21st to 32nd year was Rs.
565 (9.6 per cent).
The total costs incurred on plant protection during 6th to 10th year was Rs. 909.5 (15.3
per cent), during 11th to 20th year was 858 (14.8 per cent) and during 21st to 32nd year was Rs.
910 (15.5 per cent).
Table 4.18: Return on mango orchard per acre in different aged orchards
Particulars 1 2 to 5 6 to 10 11 to 20 21 to 32
Yield (t/acre) 0 0 5.3 7.2 6.8
Cost (Rs/acre) 51611 6457 5940 5805 5862
Returns
42400 57600 54400
(Rs/acre)*
Net income -51611 -6457 36460 51795 48538
*Mango selling price ranged between Rs. 8-12 per kg in the market. Rs. 8/ kg i.e. least price
considered to calculate gross returns.
Return on mango orchard per acre in different aged orchards is presented in Table
4.18. Mango grafts commence bearing from 5th year onwards. Earlier, stray fruits may appear
on the tree but it is advisable not to allow them to mature. Good yields are obtained from 6 th
year onwards.
During 6-10 year an acre of mango orchard yielded 5.3 tonnes, during 11-20 year 7.2
tonnes and during 21-32 year, it is reduced to 6.8 tonnes. This could be attributed to the fact
that production increased with increase in age, then stabilised and decreased thereafter.
The gross return from the orchard ranged from Rs 42,400 during 6-10 year duration, Rs.
57,600 during 11-20 year duration and Rs. 54,400 during 2-32 year duration. The net return
ranged from Rs -51,611 in 1st year to Rs 48,538 in 32nd year.
264.3 Post harvest:
Mangoes are generally harvested at maturity and ripened for optimum quality. Fruits
are handpicked and plucked with a harvester. The best way to observe maturity in mango is
color of the pulp, which turns cream to light yellow on maturity. The harvesting needs to be
done in the morning hours and fruits should be collected in plastic trays and kept in shades.
The fruits harvested with 8-10 mm long stalks appear better on ripening as undesired spots on
skin caused by sap burn are prevented. Such fruits are less prone to stem-end rot and other
storage diseases. The post- harvest losses in mangoes have been estimated in the range of 20-
30 percent from harvesting to consumption stage (Table 4.19)
Table 4.19. Preliminary screening of food losses in the selected food supply chain (FSC)
Mango Pulp in Chittoor district
Step in the Expected Critical Loss Points Comments/Remarks
FSC
Quantitative Qualitative
Production 5-10 % 5% Pre-harvest losses due to climatic
and conditions, diseases, and pests
Harvesting Physical damage of fruits due to
improper harvesting
Sorting 10 % 2% Culled fruits are sometimes lost
and completely or sold for less value
grading depending on the demand
Ripening– 10-15% 20 % Due to improper handling and
Traditional non-standard process
Process
Ripening – 3-6 % 10 % Due to internal injuries, fungal
Ripening infections, over maturity
Chambers
Harvesting– In order to reduce value loss and to remove the field heat, the produce should be
harvested during the coolest part of the day, i.e. in the morning.
Grading- A preliminary grading is done immediately after harvesting at the field level. The
mangoes are graded according to size and maturity.
27Desapping– Matured mangoes exude large amount of sap from the cut stem. As the sap
contain lots of resorcinol (oil), which burns the mango skin if contracted by the sap, the
mangoes are desapped by placing them in framework in an inverted position for two hours to
completely remove the sap from the fruit.
Processing– After the desapping process, the mango is processed in a post-harvest treatment
line having following operations in a common facility center (pack house).
4.4 Processing units:
The data has been surveyed that Maximum no of processors are preparing mango pulp
Table 4.20 Processing industries of Mango in Chittoor dist, that were surveyed.
S Value added
Name
No products
1 Tasa food pvt ltd, kottapalli(vellore) Mango pulp
A.Shashidaran, Abhishek shasidharan, Geetha shashidaran, Sun gold
2 Mango pulp
processed foods , Madupollur,Nalagampalli, Bangarupalem
3 Shashidar, Tropic fruit products, madras cross/pallur,Gudipalem Mango pulp
K. Govardhana Bobby, Suvera Processed Foods Pvt. Ltd, Aramgonda
4 Mango pulp
Road, Thavanampalli (M),Chittoor
G. Jayaprakash Reddy, Ranga fruit products, Madras cross road, Pallur,
5 Mango pulp
Gudipala(M), Chittoor
D. Srihari, E. Balaji Reddy, New Ranga Fruit Products, Gopalapuram
6 Mango pulp
(V), Narigepalli (P), Vellore, Chittoor
Tanveer, RMM foods products, Gangasagaram (V), Reddigunta (P),
7 Mango pulp
Vellore, Chittoor
S. Ramesh, Navya Foods Pvt Ltd., Mudigolam(V), Irala (P),
8 Mango pulp
Chittoor(D)
J. Shiva Kumar, Sri Manjunatha Fruit Canning Industries, Door No. 2-
9 1086/1 , Opp: Sherman girls School,Kongareddy pally, Chittoor, Mango pulp
Partnership base (6 Members)
M/S Maruti Fruit Canning industries, Village Gajulapply, Mandal
10 Mango pulp
Thavanampally. Dr. S. Anand Naidu.
28Table 4.21 Age wise Distribution of Mango processors
S. Mandals
Tot
N Age Bangaru Gudipale Thavana Narigepa Vellore Irala Kongare al
o palyam m palli lli ddy palli
1 45-50 - - 1 - - 1 1 3
2 50-55 - - - - - 1 - 1
3 60-65 1 - - - - - - 1
4 65-70 - 1 - 1 - - - 2
7
Maximum no of processors are in the age group of 45-50
Table 4.22 Education level of mango processors
Mandal
S.N Educatio Tot
o n Bangar Gudipal Thavan Narigep Vellore Irala Kongar al
upalya em apalli alli eddy
m palli
1 Graduate 1 2 1 1 2 1 1 9
Cost of processing in aseptic units presented in Table 4.23. These costs were spilt into
variable costs and fixed costs. The total cost of processing was Rs.2026.8 lakh. Of this, fixed
cost constituted nearly 12.6 per cent of which the major items were salaries to percent
employee (Rs. 178.8 lakh), depreciation on machinery (Rs. 47.6 lakh) and interest on fixed
capital (Rs. 19.5 lakh) and rest of the items were of minor importance.
Variable cost constituted over 87.4 per cent in total cost. Among the variable costs,
the major items were cost of packing material (Rs. 925.0 lakh) and cost of raw material
purchased (Rs. 781.2 lakh). Power charge and labour costs incurred were Rs. 37.5 lakh and
Rs. 28.0 lakh, respectively.
29Table 4.23: Cost of processing in aseptic units
Particulars
Costs (in Rs Percentage
Fixed cost lakh) of total cost
Salaries to percent employee 178.8 8.8
Depreciation on building 6.8 0.3
Depreciation on machinery 47.6 2.3
Depreciation on effluent treatment plant 2.3 0.1
Interest on fixed capital 19.5 1.0
Total Fixed cost 255.0 12.6
Variable cost
Cost of raw material purchased (including Transportation 781.2 38.5
Cost of packing material 925.0 45.6
Power charge 37.5 1.9
Labour 28.0 1.4
Other raw material 0.1 0.0
Total variable cost 1771.7 87.4
Total cost 2026.8
Table 4.24 provides information on Investment particulars of mango processing unit
with aseptic packing. The total investment of aseptic packing units which do processing was
around Rs. 1248.1 lakh.
The major item of investment was on machinery, on which the amount spent was Rs.
1029.4 lakh and accounted for nearly 82.5 per cent of total investment. Among investment on
machinery, aseptic steriliser cum fillers constituted 61.3 per cent of total investment (Rs.
765.0 lakh). The investment on pasteurizers and tip cutting machine was also high i. e., Rs.
113.3 lakh (9.1 per cent) and Rs. 40.0 lakh (3.2 per cent).
The next item of importance was the investment on Supporting machine, on which an
amount of Rs. 218.8 lakh was spent and this formed 17.5 per cent of total investment. Among
the Supporting machine the important item was transformers (Rs. 132.0 lakh), fork lift (Rs.
92.7 lakh) and water efficient treatment plant (Rs. 50.0 lakh) which together constituted 22
per cent of total investment.
30Table 4.24: Investment particulars of mango processing unit with aseptic packing
Particulars Costs Percentage
Details of machinery (in Rs lakh) of total cost
Fruit washing machine
Tip cutting machine 40.0 3.2
Belt conveyor 28.8 2.3
Destoner 26.7 2.1
Pulpers 19.8 1.6
Preheaters 29.5 2.4
Decanters 31.8 2.5
Pasteuizers 113.3 9.1
Balance tanks 12.0 1.0
Aseptic steriliser cum fillers 765.0 61.3
Total cost for machinery 1029.4 82.5
Supporting machine
Boilers 20.5 1.6
Generators 23.5 1.9
Cooling towers 11.0 0.9
Chillrs 18.3 1.5
Transformers 132.0 10.6
Fork lift 92.7 7.4
RO plant 8.0 0.6
Water efficient treatment plant 50.0 4.0
Total cost 218.8 17.5
Grand total 1248.1
Table 4.25 furnishes the details about Cost of processing in canning units. These costs
were split into fixed costs and variable costs. The total fixed costs amounted to Rs.167.5 lakh
which constituted 22.4 per cent of total costs (Rs.747.6 lakh). The total variable costs
amounted to Rs.580.1 lakh, which constituted nearly 77.6 per cent of total costs
Among the fixed costs, the major items were depreciation on machinery (Rs. 87.4
lakh), interest on fixed capital (Rs. 59.1 lakh), salaries to percent employee (Rs 11.3 lakh)
and depreciation on building (Rs. 8.5 lakh).
31The major items of variable costs were Cost of packing material (Rs. 250.0 lakh),
followed by Cost of raw material purchased (including Transportation (Rs 241.4lakh),
Labour (Rs. 65.5 lakh) and Power charge (Rs. 23.1 lakh).
Table 4.25: Cost of processing in canning units
Particulars
Costs (in Percentage
Fixed cost Rs lakh) of total cost
Salaries to percent employee 11.3 1.5
Depreciation on building 8.5 1.1
Depreciation on machinery 87.4 11.7
Depreciation effluent treatment plant 1.2 0.2
Interest on fixed capital 59.1 7.9
Total fixed cost 167.5 22.4
Variable cost
Cost of raw material purchased (including Transportation 241.4 32.3
Cost of packing material 250.0 33.4
Power charge 23.1 3.1
Labour 65.5 8.8
Total variable cost 580.1 77.6
Total cost 747.6
Table 4.26 provides information on Investment particulars of mango processing unit
with canning for raw fruit. The total investment of mango processing unit with canning for
raw fruit was around Rs. 1115.8 lakh.
These investments were split into machinery and supporting machine. The major item
of investment was on machinery, on which the amount spent was Rs. 729.0 lakh and
accounted for nearly 65.3 per cent of total investment. Among investment on machinery,
aseptic steriliser cum fillers constituted 25.4 per cent of total investment (Rs. 283.3 lakh).
The investment on fruit washing machine and pasteurizers was also high i. e., Rs. 180.9 lakh
(16.2 per cent) and Rs. 106.0 lakh (9.5 per cent). The investment on tip cutting machine and
belt conveyor was 30.0 lakh and 15.0 lakh, respectively. Also, the investment on pulpers,
preheaters and destoner was Rs. 12.3 lakh, Rs. 10.8 lakh and Rs. 10.7 lakh. Rest of items
were of minor importance as these costs constituted less than 5 per cent of total costs.
32The next item of importance was the investment on Supporting machine, on which an
amount of Rs. 386.8 lakh was spent and this formed 34.7 per cent of total investment. Among
the Supporting machine the important item was transformers (Rs. 300.0 lakh), boilers (Rs.
49.1 lakh), fork lift (Rs. 20.0 lakh) and generators (Rs. 1.9 lakh) which together constituted
34.2 per cent of total investment.
Table 4.26: Investment particulars of mango processing unit with canning for raw fruit
Particulars
Costs (in Percentage of
Details of machinery Rs lakh) total cost
Fruit washing machine 180.9 16.2
Tip cutting machine 30.0 2.7
Belt conveyor 15.0 1.3
Destoner 10.7 1.0
Pulpers 12.3 1.1
Preheaters 10.8 1.0
Decanters 50.0 4.5
Pasteuizers 106.0 9.5
Balance tanks 8.0 0.7
Reforming tanks 9.0 0.8
Scaling machinery 3.0 0.3
Retarts 2.0 0.2
Electric hoist machinery 8.0 0.7
Aseptic sterlizer cum fillers 283.3 25.4
Total cost of machinery 729.0 65.3
Supporting machine
Boilers 49.1 4.4
Generators 11.9 1.1
Cooling towers 3.8 0.3
Chillrs 2.0 0.2
Transformers 300.0 26.9
Fork lift 20.0 1.8
Total supporting machine cost 386.8 34.7
Total cost 1115.8
33Infrastructure availability in Chittoor district:
Total No. of Processing Units 85 No.
a) Aseptic units (200 Kg. pckg) 15
b) Canning units (3.1 Kg. pckg) 70
c) Aggregate Production Capacity 4,500 M. Tons / day
d) Cold Storage Units 12
Mango has huge scope for its different kind of processing products mentioned below in the
table 4.27
Table 4.27: Different kinds of mango products
Mango products
Raw Green mango Ripe mango
Pickles, Amchoor, Mango Beverages Pulp, Mango jelly, Beverage,
slices Squash, Mango leather
But in Chittor district people are going only for pulp, because of pulp industry
monopoly. However the pulp industries could process only around 4,05,000 MT of mango,
which is 47.2% of produced mango. There is still huge scope for other processing industries
like mango jelly, squash, beverages and pickles. However Galla group has started preparation
of beverages from mango, still there should be great need of encouraging other processing
materials.
Existing Mango market yards in Chittoor district: Five no.
1. Chittoor
2. Bangarupalem
3 . Pakala(Damalcheruvu)
4. Tirupati
5. Puttur
4.5 Export of mango from Chittoor:
From the total production i.e. 854007 MT only 208 tons (0.2 MT) was exported
during 2016 by different processing industries. In 2017 only 90 tons of fresh fruits were
34exported to Singapore and Malasia. The details of exports during 2016 were as follows in
table 4.28
Table 4.28: Status of exports during 2016
Name of the Variety Quantity exported Exported countries
exporters
Vistas investments Baneshan 58 tons Singapore, Brunei,
south east countries
Life style solutions Beneshan, Alphanso 70 tons Malaysia
Srini Food Park Baneshan, Alphanso 35 tons Japan,
UK, Singapore
Kishan suvida Baneshan 20 tons USA
producers ltd
CCD Baneshan 25tons Malaysia
Total 208 tonnes
However the exports during 2012-13 and 2013-14 were significantly greater the details were
as follows
Table 4.29. Exports of mango and its products during 2012-13
Sl. Quantity Value Destination
Name of Commodity
No. (M.T.s) (Rs. in Crores)
1 Mango fresh fruit 149 0.49 Middle East countries,
2 Mango Pulp 1,85,000 616.86 Singapore, Sri Lanka
Table 4.30: Exports of mango and its products during 2013-14
Sl.No Name of the product Quantity exported
1 Totapuri mango pulp 1,02,670.75 MT
2. Alphanso mango pulp 10761.39 MT
3. Fresh Mango fruits 27,057 kg
4. Mango concentrate 7224.84 mt
Andhra Pradesh in producing great amount of mango with high quality still there is
very tiny amount of mango is exporting. The major constraints are as follows.
a. European union imposing high duties for Indian Agri products like fruits, vegetables, fruits
puree & concentrates, spices, nuts e.t.c, but they are not charging duties for many other
countries, accordingly the importers willing to buy same products from other countries,
because they are getting goods at low price.
35b. For example: Andhra Pradesh mainly Chittoor district producing lot of Mango and other
fruits Pulp, Concentrate, but exporters from Andhra Pradesh able to export very less volume
of concentrates, because duty is 12% above, accordingly the processors are reducing the raw
material price at farm level to offer competitive price with other countries in international
market, which is directly impacting on farmers economically..
c. The sea and transport freights are too much variable, hence requesting you to support with
transport cost subsidies for exported goods from Andhra Pradesh.
d. The export packing material costs are varying frequently, hence requesting you to support
with packing material cost subsidies for exported goods from Andhra Pradesh.
Export Promotion Strategies
1. Strengthening infrastructure base,
2. Efficient post harvest management,
3. Improved packaging,
4. Including new markets,
5. Improving cold storage and transportation logistics,
6. Developing India brand mangoes and campaigning abroad about the quality,
7. Promoting an efficient export marketing network to optimize export, and
8. Setting up of more quality control laboratories in the Export Processing Zones.
4.6 Farmer producer organisations:
Farmer producer organisation (FPO) is collectivization of Producers especially small
and marginal farmers so as to form an effective association to collectively address many
challenges of agriculture effectively such as improved access to investment, technology,
inputs and markets. Department of Agriculture and Cooperation under Ministry of
Agriculture, Govt. of India has identified ‘Farmer Producer Organizations ‘registered under
the special provisions of the Companies Act, 1956 as the most appropriate Institutional form
around which the mobilization of farmers is to be made for building their capacity to
collectively leverage their production and marketing strength. The Department of Agriculture
and Cooperation (MoA) has setup ‘Small Farmers Agribusiness Consortium’ (SFAC), a
society under DAC, as designated Agency to act as a single window for Technical support,
Training needs, Research and Knowledge management and to create linkages to investment,
Technology and Markets. SFAC provides all round support to State Governments FPOs and
other entities engaged in promotion and development of FPOs
36You can also read