YEARBOOK 2020/2021 KEY TRENDS - Council of Europe
←
→
Page content transcription
If your browser does not render page correctly, please read the page content below

YEARBOOK
                               2020/2021
                                     KEY
                                 TRENDS

        TELEVISION, CINEMA,
     VIDEO AND ON - DEMAND
    AUDIOVISUAL SERVICES -
THE PAN - EUROPEAN PICTURE
→ Director of publication
Susanne Nikoltchev, Executive Director

→ Editorial supervision
Gilles Fontaine, Head of Department for Market Information

→ Authors
Francisco Javier Cabrera Blázquez, Maja Cappello, Laura Ene, Gilles Fontaine,
Christian Grece, Marta Jiménez Pumares, Martin Kanzler, Agnes Schneeberger,
Patrizia Simone, Julio Talavera, Sophie Valais

→ Coordination
Valérie Haessig

→ Special thanks to the following for their contribution to the Yearbook
Ampere Analysis, Bureau van Dijk (BvD), European Broadcasting Union - Media
Intelligence Service (EBU-M.I.S.), EURODATA-TV, LyngSat, WARC, and the members
of the EFARN and the EPRA networks.

→ Proofreading
Anthony Mills

→ Layout
Big Family

→ Press and public relations
Alison Hindhaugh, alison.hindhaugh@coe.int

→ Publisher
European Audiovisual Observatory
76 Allée de la Robertsau, 67000 Strasbourg, France
www.obs.coe.int

If you wish to reproduce tables or graphs contained in this publication please
contact the European Audiovisual Observatory for prior approval. Please note that
the European Audiovisual Observatory can only authorise reproduction of tables
or graphs sourced as “European Audiovisual Observatory”. All other entries may
only be reproduced with the consent of the original source.

Opinions expressed in this publication are personal and do not necessarily
represent the view of the Observatory, its members or of the Council of Europe.

© European Audiovisual Observatory (Council of Europe), Strasbourg 2021
YEARBOOK 2020/2021
     KEY TRENDS
   TELEVISION, CINEMA, VIDEO AND ON - DEMAND
AUDIOVISUAL SERVICES - THE PAN - EUROPEAN PICTURE
4 Y E A R B O O K 2020/ 2021 – K E Y T R E N D S
TABLE OF CONTENT

INTRODUCTION
     0 COVID-19 as an accelerator .  .  .  .  .  .  .  .  .  .  .  .  .  .  .  .  .  .  .  .  .  .  .  .  .  .  .  .  .  .  .  .  .  .  .  .  .  .  .  .  .  .  .  .  .  .  .  .  .  .  .  .  .  .  .  .  .  .  .  .  .  .  .  .  .  .  .  .  .  .  .  .  .  .  .  .  .  .  .  .  .  .  .  .  .  .  .  .  .  .  .  .  . 6

PRODUCTION
1.1 Film financing: Public support and broadcasters remain principal sources .  .  .  .  .  .  .  .  .  .  .  .  .  .  .  .  .  .  .  .  .  .  .  .  .  .  .  . 8
1.2 Gender equality: Still few female directors and screenwriters .  .  .  .  .  .  .  .  .  .  .  .  .  .  .  .  .  .  .  .  .  .  .  .  .  .  .  .  .  .  .  .  .  .  .  .  .  .  .  .  .  .  .  . 10
1.3 TV fiction: High-end TV series lead production growth.  .  .  .  .  .  .  .  .  .  .  .  .  .  .  .  .  .  .  .  .  .  .  .  .  .  .  .  .  .  .  .  .  .  .  .  .  .  .  .  .  .  .  .  .  .  .  .  .  .  .  .  .  .  . 12
1.4 Investment, budget and production rebound .  .  .  .  .  .  .  .  .  .  .  .  .  .  .  .  .  .  .  .  .  .  .  .  .  .  .  .  .  .  .  .  .  .  .  .  .  .  .  .  .  .  .  .  .  .  .  .  .  .  .  .  .  .  .  .  .  .  .  .  .  .  .  .  .  .  .  . 14
1.5 The nationality of European works and the revised AVMSD .  .  .  .  .  .  .  .  .  .  .  .  .  .  .  .  .  .  .  .  .  .  .  .  .  .  .  .  .  .  .  .  .  .  .  .  .  .  .  .  .  .  .  .  .  .  .  . 16

CIRCULATION
2.1 VOD: TVOD driven by films, SVOD by TV series .  .  .  .  .  .  .  .  .  .  .  .  .  .  .  .  .  .  .  .  .  .  .  .  .  .  .  .  .  .  .  .  .  .  .  .  .  .  .  .  .  .  .  .  .  .  .  .  .  .  .  .  .  .  .  .  .  .  .  .  .  .  .  .  .  . 18
2.2 Prominence on TVOD: European films are not discriminated .  .  .  .  .  .  .  .  .  .  .  .  .  .  .  .  .  .  .  .  .  .  .  .  .  .  .  .  .  .  .  .  .  .  .  .  .  .  .  .  .  .  .  .  .  . 20
2.3 Do films make it from cinemas to VOD?.  .  .  .  .  .  .  .  .  .  .  .  .  .  .  .  .  .  .  .  .  .  .  .  .  .  .  .  .  .  .  .  .  .  .  .  .  .  .  .  .  .  .  .  .  .  .  .  .  .  .  .  .  .  .  .  .  .  .  .  .  .  .  .  .  .  .  .  .  .  .  .  .  .  .  . 22
2.4 European film exports down in Europe, up in North America . . . . . . . . . . . . . . . . . . . . . . . . . . . . . . . . . . . . . . . . . . . . . 24

AUDIOVISUAL SERVICES
3.1 Pre-Brexit fragmentation of TV channel supply.  .  .  .  .  .  .  .  .  .  .  .  .  .  .  .  .  .  .  .  .  .  .  .  .  .  .  .  .  .  .  .  .  .  .  .  .  .  .  .  .  .  .  .  .  .  .  .  .  .  .  .  .  .  .  .  .  .  .  .  .  .  .  .  . 26
3.2 SVOD erodes linear TV viewing.  .  .  .  .  .  .  .  .  .  .  .  .  .  .  .  .  .  .  .  .  .  .  .  .  .  .  .  .  .  .  .  .  .  .  .  .  .  .  .  .  .  .  .  .  .  .  .  .  .  .  .  .  .  .  .  .  .  .  .  .  .  .  .  .  .  .  .  .  .  .  .  .  .  .  .  .  .  .  .  .  .  .  .  .  .  .  . 28
3.3 Diversity and inclusion in the audiovisual industries.  .  .  .  .  .  .  .  .  .  .  .  .  .  .  .  .  .  .  .  .  .  .  .  .  .  .  .  .  .  .  .  .  .  .  .  .  .  .  .  .  .  .  .  .  .  .  .  .  .  .  .  .  .  .  .  .  . 30

MARKETS
4.1 Focus on Observatory presidency country: United Kingdom.  .  .  .  .  .  .  .  .  .  .  .  .  .  .  .  .  .  .  .  .  .  .  .  .  .  .  .  .  .  .  .  .  .  .  .  .  .  .  .  .  .  .  .  .  .  .  . 32
4.2 Trouble began before the COVID-19 crisis .  .  .  .  .  .  .  .  .  .  .  .  .  .  .  .  .  .  .  .  .  .  .  .  .  .  .  .  .  .  .  .  .  .  .  .  .  .  .  .  .  .  .  .  .  .  .  .  .  .  .  .  .  .  .  .  .  .  .  .  .  .  .  .  .  .  .  .  .  .  .  . 34
4.3 COVID-19: Certain countries more at risk .  .  .  .  .  .  .  .  .  .  .  .  .  .  .  .  .  .  .  .  .  .  .  .  .  .  .  .  .  .  .  .  .  .  .  .  .  .  .  .  .  .  .  .  .  .  .  .  .  .  .  .  .  .  .  .  .  .  .  .  .  .  .  .  .  .  .  .  .  .  .  .  . 36
4.4 Cinema exhibition still developing in 2019 . .  .  .  .  .  .  .  .  .  .  .  .  .  .  .  .  .  .  .  .  .  .  .  .  .  .  .  .  .  .  .  .  .  .  .  .  .  .  .  .  .  .  .  .  .  .  .  .  .  .  .  .  .  .  .  .  .  .  .  .  .  .  .  .  .  .  .  .  . 38
4.5 Cinema: US market share in the EU up in 2019 .  .  .  .  .  .  .  .  .  .  .  .  .  .  .  .  .  .  .  .  .  .  .  .  .  .  .  .  .  .  .  .  .  .  .  .  .  .  .  .  .  .  .  .  .  .  .  .  .  .  .  .  .  .  .  .  .  .  .  .  .  .  .  .  . 40
4.6 Cinema: More than 1 billion admissions in the European Union in 2019 .  .  .  .  .  .  .  .  .  .  .  .  .  .  .  .  .  .  .  .  .  .  .  .  .  .  .  .  . 42
4.7 Home video: Physical retail drops to 50% . .  .  .  .  .  .  .  .  .  .  .  .  .  .  .  .  .  .  .  .  .  .  .  .  .  .  .  .  .  .  .  .  .  .  .  .  .  .  .  .  .  .  .  .  .  .  .  .  .  .  .  .  .  .  .  .  .  .  .  .  .  .  .  .  .  .  .  .  .  .  . 44
4.8 E-commerce advertising, the new online advertising star .  .  .  .  .  .  .  .  .  .  .  .  .  .  .  .  .  .  .  .  .  .  .  .  .  .  .  .  .  .  .  .  .  .  .  .  .  .  .  .  .  .  .  .  .  .  .  .  .  . 46
4.9 Pay TV: Italy weighs on European growth .  .  .  .  .  .  .  .  .  .  .  .  .  .  .  .  .  .  .  .  .  .  .  .  .  .  .  .  .  .  .  .  .  .  .  .  .  .  .  .  .  .  .  .  .  .  .  .  .  .  .  .  .  .  .  .  .  .  .  .  .  .  .  .  .  .  .  .  .  .  .  .  . 48
4.10 Tipping point for direct-to-consumer streaming services?.  .  .  .  .  .  .  .  .  .  .  .  .  .  .  .  .  .  .  .  .  .  .  .  .  .  .  .  .  .  .  .  .  .  .  .  .  .  .  .  .  .  .  .  .  .  .  .  .  . 50

PLAYERS
5.1 The biggest are becoming bigger.  .  .  .  .  .  .  .  .  .  .  .  .  .  .  .  .  .  .  .  .  .  .  .  .  .  .  .  .  .  .  .  .  .  .  .  .  .  .  .  .  .  .  .  .  .  .  .  .  .  .  .  .  .  .  .  .  .  .  .  .  .  .  .  .  .  .  .  .  .  .  .  .  .  .  .  .  .  .  .  .  .  .  .  . 52
5.2 More US companies among main Europe players .  .  .  .  .  .  .  .  .  .  .  .  .  .  .  .  .  .  .  .  .  .  .  .  .  .  .  .  .  .  .  .  .  .  .  .  .  .  .  .  .  .  .  .  .  .  .  .  .  .  .  .  .  .  .  .  .  .  .  .  .  . 54
5.3 Downward financial trend for public broadcasters                                                                                                                           .  .  .  .  .  .  .  .  .  .  .  .  .  .  .  .  .  .  .  .  .  .  .  .  .  .  .  .  .  .  .  .  .  .  .  .  .  .  .  .  .  .  .  .  .  .  .  .  .  .  .  .  .  .  .  .  .  .  .  . 56

5.4 TV production: European consolidation and internationalisation .  .  .  .  .  .  .  .  .  .  .  .  .  .  .  .  .  .  .  .  .  .  .  .  .  .  .  .  .  .  .  .  .  .  .  .  .  .  .  . 58
5.5 Measures taken in the audiovisual sector .  .  .  .  .  .  .  .  .  .  .  .  .  .  .  .  .  .  .  .  .  .  .  .  .  .  .  .  .  .  .  .  .  .  .  .  .  .  .  .  .  .  .  .  .  .  .  .  .  .  .  .  .  .  .  .  .  .  .  .  .  .  .  .  .  .  .  .  .  .  .  .  . 60

                                                                                                                                                                                                       Y E A R B O O K 2020/2021 – K E Y T R E N D S                                                                                                          5
0 INTRODUCTION
COVID-19 as an accelerator
Sizing the COVID-19 short-term business model for large blockbusters;
impact still, the race for on-demand leadership
may lead to integrated Hollywood studios
Initial research by the European Audiovisual
running their own SVOD services, and
Observatory suggests the audiovisual
favouring customer acquisition rather than
sector lost over 10% of its revenues in
the profitability of individual films.
2020 compared to 2019, and close to 15%
excluding on-demand services. This, in The US studios’ strategies will have
turn, translated into a loss in financing of important repercussions on the European
original European production of over EUR exhibition landscape. On the one hand,
3 bn (for the EU27 only), and EUR 2 bn exhibitors rely heavily on US films; on the
excluding sports. The sector is unlikely to other, European films appear to perform
return, in 2021, to 2019 activity levels, as comparatively well when freed from the
the COVID-19 impact may continue well competition of Hollywood blockbusters
into the year. Moreover, the crisis appears and there is hope their market share may
to have accelerated some existing trends - increase –albeit in a shrinking market.
and the sector may emerge deeply changed.
TV advertising: A tipping point?
Theatrical exploitation: Adaptation or
Until the COVID-19 crisis, TV advertising
disruption?
had resisted Internet advertising
Theatrical exploitation was an obvious competition comparatively well. The year
COVID-19 casualty in 2020. Lockdowns 2021 may however mark a tipping point.
repeatedly hit cinema attendance, with COVID-19 has again accelerated the weight
box-office takings dropping by 70% to 80% gain of e-commerce, which is capturing an
throughout Europe. The crisis came amidst increasing share of Internet advertising.
a continuous consolidation wave in the In the context of economic uncertainty,
industry and significant investment for new advertisers may choose to favour
sites and the modernisation of existing immediate sales rather than develop brand
ones. awareness.
The industry has tried to adapt to the Multiple launches of advertising-funded
new situation, either with a consensual video on demand services (AVOD) also
approach (the Hollywood studio Universal threaten the possibility for broadcasters
and AMC Theatres signed a revenue- to, through their catch-up services,
sharing agreement paving the way for a compensate for the advertising revenues
major shortening of the theatrical window), draining from their linear channels.
or more unilaterally (Warner decided to
release its whole 2021 line-up on the same
day in theatres and on its streaming service).
Pay services: SVOD and/or pay TV?
Several experts estimate that bypassing Clearly, the lockdowns have encouraged
theatrical release to favour subscription many more European households to
video on demand (SVOD) is not a viable experiment with SVOD or to stack
6 Y E A R B O O K 2020/ 2021 – K E Y T R E N D Ssubscriptions (cumulating several rental competes with much cheaper
subscriptions from different services). SVOD services, even if the latter don’t
Beyond this, though, the scope of content provide the same exclusive movies. More
available on SVOD services has expanded, importantly, a parallel may be drawn with
basically covering all genres previously music - to highlight the transformation of
assembled in pay TV packages, which, consumer preferences from ownership
in turn, have been negatively impacted of cultural products to ‘all you can eat’
by chaotic sports seasons. Still, pay TV subscription services.
distributors are,in the short term,protected
by the bundling of Internet access and pay
Contrasting visions
services. But the possibility of significant
cord-cutting (consumers switching from In this transformation age, there are two
legacy television distribution networks to strategic visions:
Internet services) has increased, with pay • A production-centric vision: Major
TV services reorienting their distribution platforms will inexorably become the
towards Internet and network operators dominant players in the audiovisual
refocusing on broadband Internet access services landscape. The main policy
as their core activity. objective will be to ensure the platforms
contribute to European production
Public funding: More sacrifice? by adapting the legal and financing
ecosystem.
Public funding of the audiovisual sector
mainly encompasses public financing of • An audiovisual services-centric vision:
public service broadcasters, film funds Reliance on US-based platforms results
and indirect production incentives. It in losses for the audiovisual services in
proved resilient, to an extent, in 2020, terms of wealth creation, employment,
insulated by annual budgets. But and creative control. The main policy
reductions loom because of the need to objective is to support Europe’s key
decrease public spending to pay back players by for example supporting small
COVID-19 debt. Further pressure on cinemas, improving the competitiveness
public financing comes as the resources of TV vs. Internet advertising, fostering
of public service broadcasters grow much cooperation between broadcasters
more slowly than those of their private (including positivity about mergers),
competitors. protecting the windows of legacy players,
etc.
Home video: Where did the money go? Designing the post-COVID-19 crisis
recovery measures for the audiovisual
Year after year, figures confirm that the
sector will hopefully bring a unique
transition of home video from physical
opportunity to clarify policy vision or at
to digital is resulting in massive revenue
least carefully balance the sometimes
losses. One obvious explanation is piracy.
diverging objectives it embraces.
Another hypothesis could be that digital
Y E A R B O O K 2020/2021 – K E Y T R E N D S 71 PRODUCTION
1.1 Film financing: Public support and broadcasters remain
principal sources
Unique insights into the financing European fiction films primarily
of European fiction films financed by direct public funding and
broadcasters
In its third year analysing the financing
structures of European fiction films, the European fiction films primarily financed by
Observatory, in collaboration with the direct public funding and broadcasters
European Film Agency Research Network The two most significant financing sources
(EFARN), collected detailed data about of European theatrical fiction films remained
the financing plans for 568 European live- direct public funding and broadcaster
action fiction films theatrically released investments, which accounted for 26%
in 2018, from 23 European countries. The and 21% of total financing, respectively,
analysis covered a cumulative financing followed by producer investments (17%).
volume of EUR 1.8 billion and covered Pre-sales and production incentives both
an estimated 49% of all European1 fiction accounted for 15% of total financing
films released in 2018. volume, respectively.
There appear, however, to be significant
Median budget for European
live-action fiction film releases: structural differences among individual
EUR 1.93 million countries regarding how films are financed.
Some divergences are apparently linked to
The data sample suggests the mean market size. The two most obvious ones
budget of a European theatrical fiction concern direct public funding and pre-sales.
film released in 2018 was EUR 3.16 The data clearly suggest that the weight
million, while the median sample budget of direct public funding in film financing
was EUR 1.93 million. However, average decreases with increasing market size,
budgets differ widely among countries. and vice versa: While representing only
Not surprisingly, they are higher in larger 20% of total financing in the four large
markets and smaller in countries with sample markets, direct public funding
lower box-office potential, as exploitation accounted for 43% in medium-sized and
in national markets remains key for most 54% in small sample markets. In contrast,
films. The median budget of a European the significance of pre-sales (other than
fiction film originating in the large sample those to broadcasters) as a financing source
markets was EUR 2.8 million, compared to increases with market size. Pre-sales tend
EUR 1.7 million for fiction films produced to carry most weight in large markets,
in medium-sized European markets, and where they in 2018 accounted for 17%,
EUR 1.2 million for fiction films from small compared to ‘only’ 8% in medium-sized
markets. and small sample markets. The sample
analysis also suggests there are structural
differences in how films of different budget
sizes are financed. Generally speaking, films
with a budget up to EUR 3 million depend
to a higher degree on direct public support.
1 In the context of this analysis, Europe (EUR 35) is defined as the (then) 28 EU member states plus Bosnia-Herzegovina,
Georgia, Iceland, Montenegro, North Macedonia, Norway and Switzerland.
8 Y E A R B O O K 2020/ 2021 – K E Y T R E N D S1.1
What were the five most significant
financing sources of European fiction
films released in 2018?
26% 21% 17% 15% 15%
Direct Broadcaster Producer Pre-sales Production
public investments investments incentives
funding
The smaller the market, the more significant
the share of direct public funding
Percentage share of direct public funding in total financing volume
by market size (2018 – est.)
54%
43%
20% Direct public funding
Other
Small markets Medium-sized Large markets
markets
Source: European Audiovisual Observatory
Y E A R B O O K 2020/2021 – K E Y T R E N D S 91 PRODUCTION
1.2 Gender equality: Still few female directors and screenwriters
The European Audiovisual Observatory Working dynamics by gender
(EAO) assessed the gender imbalance
In all groups, female professionals were
among directors and screenwriters of
slightly less active compared to their male
European feature films, TV films and fiction
counterparts. Between 2015 and 2018,
series produced between 2015 and 2018.1
91% of female directors only worked on
one single film, compared to 86% for male
Women are still a minority among directors. On average, women directed
directors and screenwriters seven fiction series episodes, compared to
Overall, women only represented 22% of nine episodes for men.
directors with at least one European feature Figures also show that, on average, women
film to their credit between 2015 and 2018. worked in teams with other colleagues more
In TV fiction, female directors accounted often than men and were proportionally
for an even smaller share (19%) of all more likely to work in gender-mixed teams,
directors. Instead, women’s presence was a pattern that can be detected across all
higher among screenwriters, where they sub-groups analysed. For instance, among
represented 25% of active professionals in feature films written by at least one female
film and 34% in TV fiction. In all groups, the screenwriter, 67% were co-written, in most
share of female professionals has remained cases (87%) together with at least one male
comparatively stable over the timeframe colleague.
analysed.
Therefore, only 18% of the feature films
For each job category, and in both film and in the sample were directed by a female-
TV fiction, the EAO also looked at average driven team, in other words by a majority of
female presence based on the gender female professionals in the role of director.
ratio of all the professionals involved in This share was lower (14%) for episodes of
each film or TV episode. Among directors, TV fiction series. Among screenwriters, the
the resulting average female presence share of works written by female-driven
was 20% for feature films and 15% for teams was 17% for films and 21% for TV
TV fiction; and among screenwriters, the fiction. Documentary is the film genre with
results were 24% for feature films and 31% the highest share of titles by female-driven
for TV fiction. teams, both looking at teams of directors
(25%) and screenwriters (25%).
1 The full report can be downloaded from the European Audiovisual Observatory’s website.
See “Female directors and screenwriters in European film and audiovisual fiction production”, July 2020
https://www.obs.coe.int/en/web/observatoire/industry/film
10 Y E A R B O O K 2020/ 2021 – K E Y T R E N D S1.2
What is the share of European feature
films directed by female-driven* teams?
18%
(Significant differences can be observed across countries)
Share of works by female-driven* teams of professionals (2015-2018)
21%
18% 17%
14%
Film Film TV fiction TV fiction
directors screenwriters directors screenwriters
* In this context, “female-driven” refers to feature films or TV fiction episodes by a majority (≥ 60%) of female
professionals working in each role.
Source: European Audiovisual Observatory / LUMIERE, Plurimedia
Y E A R B O O K 2020/2021 – K E Y T R E N D S 111 PRODUCTION
1.3 TV fiction: High-end TV series lead production growth
Over 1 100 titles and 13 000 hours Origin of TV fiction
in 2019
National broadcasters drive the production
A total of 1 131 new TV fiction titles1 and of TV fiction and define the format focus:
13 034 hours of TV fiction were produced high-end series in the United Kingdom,
in the European Union in 2019,2 slightly Germany, France; TV films in Germany,
above the average for the last five years France, Italy; longrunning soaps in Spain,
(2015 to 2019). Compared to the previous Poland, and Greece.
year, more titles were produced, but fewer
In 2019, Germany was the main producer of
episodes and fewer hours. The trend in
TV titles, Poland of TV episodes, and Spain
recent years shows growing interest in
of TV hours, but 2015 to 2019 averages
production of shorter formats: High-end
crown Germany as Europe’s main TV fiction
series (2 to 13 episodes) represented three
producer (titles, episodes and hours). It’s a
out of every five titles produced in 2019 – a
very different picture for 2 to 13 episode
54% growth in titles since 2015. This boom
series, for which the United Kingdom
in high-end series comes to the detriment
was the main producer of high-end titles,
of TV films: 29% fewer titles were produced
episodes and hours in the 2015 to 2019
in 2019 compared to 2015.
period. The five largest TV markets were
Still, TV series with more than 13 episodes also the five main producers of high-end
represented the lion’s share of episodes series, but looking at all titles produced,
(75%) and hours (70%) produced, due to the Poland, Portugal and Hungary were strong
weight of daily soaps and telenovelas. The episodes producers and Portugal, Poland
average duration per episode was almost and Greece provided big volumes of TV
double for high-end series (a commercial fiction hours.
hour) compared to series with more than
While public broadcasters traditionally
13 episodes (around half an hour) but
commission more titles than private ones,
continued decreasing for high-end series
private broadcasters commission more TV
(from 53 mins. on average in 2015, to 49
fiction hours, as they usually favour long-
mins. in 2019).
running series. Looking at high-end series,
Half the TV series titles produced (51%) with more titles originating from public
were new projects, but for high-end series, broadcasters, private broadcasters are
up to 59% were new projects and 41% catching up: In 2019 they commissioned
were new seasons of returning titles. almost half of all high-end hours produced.
Original TV fiction commissioned by
subscription video on demand services
continued expanding: 9% of high-end series
titles produced in 2019 (5% for all formats)
and 8% of high-end hours (2% for all formats).
1 itle refers here to TV film title and TV series season.
T
2 E
U28: Brexit in 2020; the United Kingdom is treated here as a still-EU member.
12 Y E A R B O O K 2020/ 2021 – K E Y T R E N D S1.3
Which TV fiction format showed
the biggest growth in Europe?
High-end TV series (2 to 13 episodes)
54% growth since 2015; 20% from 2018 to 2019
Number of TV fiction titles produced in the EU28 by format (2015-2019)
700 649
600
541
504
500 443
422
400
397
300
373
304
287 283
200
91 103 111
100 86 82
73 72 79 83 88
0
2015 2016 2017 2018 2019
TV Film 2 to 13 episodes 14 to 52 episodes More than 52 episodes
Source: European Audiovisual Observatory based on Plurimedia data
Y E A R B O O K 2020/2021 – K E Y T R E N D S 131 PRODUCTION
1.4 Investment, budget and production rebound
European film production grows again registering a notable rise in most Eastern
European countries, particularly in
Before the COVID-19 pandemic brought
Poland (+114%, +42 films, 31 of them
film shootings to a halt, the volume of
documentaries) and Russia (+27%, +38
film production in Europe increased by
films). In contrast, film production declined
6% in 2019, to an estimated total of 2 421
by 13% in Turkey (-24 films compared to
feature films produced (135 more films
2018) after years of sustained of growth.
than in 2018), of which 1 926 were of EU1
origin. This hike came after two years of
stagnation, and represented a rise of 13% Budgets and investment increased
compared to 2015. in 2019
The 2019 rebound was mainly driven by In 2019, average production budget
robust interannual growth (+13%) in the increased in 14 out of the 22 European
number of documentaries, to a total of 912 countries for which data were available.
titles (of which 782 were produced in the The increase was most notable for Czech
EU), while the number of fiction features productions (+187%), followed by Danish
only increased by 2%, to a total of 1 509 productions (+69%) and GB domestic films
films (of which 1 144 in the EU). (+47%). Average budgets dropped in eight
countries, including Belgium (-9%), France
Of all European feature films produced (-7%) and Norway (-7%), and they remained
in 2019, 81% were entirely national relatively stable in Austria and Portugal.
films, compared to 19% for majority Once again, GB inward investment films2
co-productions. Between 2015 and 2019, were the productions with the highest
the number of entirely national films grew average budgets in Europe, at GBP 7.7
by 16%, while the number of majority million (EUR 8.8 million), despite a sharp
co-productions remained comparatively decrease over the previous year (-26%).
stable over the same period, in contrast to Danish productions ranked second, with an
the first half of the decade, during which average budget of DKK 31.8 million (EUR
majority co-productions grew rapidly 4.3 million), followed by French productions
(+94% between 2010 and 2014). (EUR 3.8 million), and German films (EUR
In 2019, Italy was the EU country with 3.7 million).
the highest number of national film In 2019, overall film production investment
productions (312 films, 192 of them grew in eight out of the 13 countries
fiction), followed by France (240 films), for which data were available. Total film
and Germany (237). Spain was the most investment increased considerably in Italy
prolific country for documentary titles (131 (+25%), Denmark (+23%) and Germany
films). Film production levels developed in (+21%), and decreased in Sweden (-5%),
a heterogeneous manner across Europe, Ireland (-28%) and Belgium (-32%).
1 Includes the UK.
2 According to the BFI, inward investment films are productions substantially financed and controlled from outside
the UK but drawn, in practical terms, to the UK because of script requirements, filmmaking infrastructure or incentives
system advantages.
14 Y E A R B O O K 2020/ 2021 – K E Y T R E N D S1.4
How many feature films were
produced in Europe in 2019?
2 421 films (of which 1 926 of EU origin)
+6% over 2018, +13% over 2015
Source: European Audiovisual Observatory
Top 3 European countries for number of feature films produced (2019)
1 2 3
Italy France Germany
312 240 237
films films films
Source: European Audiovisual Observatory
Y E A R B O O K 2020/2021 – K E Y T R E N D S 151 PRODUCTION
1.5 The nationality of European works and the revised AVMSD
Assessing the nationality of audiovisual A recent comparative analysis by the
works, that is, knowing when a work is to be European Audiovisual Observatory5
considered ‘national’ or ‘European’ according – focused on the, at the time, 28 EU
to relevant legislation, is paramount for member states – showed that the vast
producers, public film funds, regulators majority of them have obligations in their
and service providers. The nationality of a respective national legislation that are
film or audiovisual work is usually defined the same as those in the AVMSD. Member
by domestic authorities based on criteria states are obliged to report every two years
which may vary from country to country and to the European Commission (EC) on the
even among institutions within the same application of the obligations. Generally,
country. This notion is particularly relevant it appears that the regulatory authorities
with regard to eligibility of funding. rely on information submitted by the AVMS
providers, with reports indicating a high
The status of ‘European work’ is, in turn,
level of trust in the data submitted. The EC
homogeneously defined by Article 1(1)n of
guidelines are used as guiding principles
the Audiovisual Media Services Directive
in this respect.
(AVMSD).1 The latter is fundamental in
the calculation of the transmission quotas Reports show that assessments occur on a
traditionally imposed on broadcasters limited, case by case basis, predominantly
(more than 50% of their transmission when the information received does not
time, excluding news, sports and other appear reliable. The main challenges in
categories, must be devoted to European the execution of these obligations include
works).2 The revised AVMSD3 extends these the volume of data to be processed, a lack
obligations to video on demand (VOD) of resources on the part of the regulatory
services (a minimum 30% share of their authorities, and the lack of centralised
catalogues – and ensured prominence).4 databases of audiovisual works with
homogeneous indicators.
A work that is considered to be ‘national’
by a member state according to rules on
film funding may not qualify as ‘European’
pursuant to the AVMSD. This is notably
the case for minority co-productions with
third countries, as the AVMSD stipulates
a majority share of production costs for
quota qualification.
1 irective 2010/13/EU of the European Parliament and of the Council of 10 March 2010 (Audiovisual Media Services
D
Directive - AVMSD). Available at https://eur-lex.europa.eu/legal-content/EN/ALL/?uri=CELEX%3A32010L0013.
2 Article 16, AVMSD.
3 irective (EU) 2018/1808 of the European Parliament and of the Council of 14 November 2018 amending Directive
D
2010/13/EU. Available at https://eur-lex.europa.eu/legal-content/FR/ALL/?uri=CELEX:32018L1808.
4 Article 13, AVMSD.
5 European Audiovisual Observatory (2020) Mapping of the regulation and assessment of the nationality of European
audiovisual works. European Audiovisual Observatory: Strasbourg. Available at https://rm.coe.int/mapping-of-the-regulation-
and-assessment-of-the-nationality-of-europea/16809ebe39.
16 Y E A R B O O K 2020/ 2021 – K E Y T R E N D S1.5
Does national legislation define domestic
and European works in the EU?
In most cases: Yes
Domestic works defined in 18 out of 28 countries
European works defined in 25 out of 28 countries
Definition of 'domestic works' Definition of 'European works'
NO NO
YES YES
Source: European Audiovisual Observatory
Y E A R B O O K 2020/2021 – K E Y T R E N D S 172 CIRCULATION
2.1 VOD: TVOD driven by films, SVOD by TV series
The European Audiovisual Observatory Most recent TV content found on
monitors, on an ongoing basis, the SVOD, but more European content
composition of video on demand catalogues on TVOD
(VOD), for films or TV content – a key topic While there are on average more TV seasons
as European audiences consume more on TVOD, TV content is the core business
video on demand and VOD players become for SVOD services. TV seasons on SVOD
obliged to offer a 30% European content are more recent than on TVOD, with the
share in their catalogues, as required by the bulk less than five years old. In May 2020,
revision of the AVMS directive. there was a larger choice of different TV
seasons on SVOD, but a bigger proportion
A 30% share for European films in of European TV content on TVOD. EU27
VOD catalogues in the EU27 TV content was predominantly of German,
Films, especially more recent ones, are the French, Spanish and Italian origin; these
bread and butter of transactional video on EU4 comprised 75% of the total. German
demand (TVOD) services, with an average TV seasons dominated the export of EU27
5 216 film titles for TVOD services compared TV content on TVOD services, and French
to an average 1 031 for subscription video TV content was the most exported EU27
on demand (SVOD) services in May 2020. content on SVOD.
TVOD services also had a slightly higher Cumulated TV content represented almost
share of European films in their catalogues 150 000 TV seasons available on European
compared to SVOD services, with 31% and VOD, most of it on SVOD. On TVOD, European
29%, respectively. content comprised 37% of the total, 23%
The biggest EU27 film exporters on TVOD on SVOD. Furthermore, with UK content
catalogues were France with a share of now counted as ‘other European’, the EU27
30%, Germany with 22%, Italy with 9% and accounted for 24% on TVOD but 10% on
Spain with 7%. For SVOD, these same four SVOD.
countries represented 66% of all exported National VOD services provided more
EU27 films. European content, more specifically on
Films produced in the United Kingdom TVOD, with 43% of the offering, while multi-
represented 8% of all films available on country services relied more heavily on US
TVOD and 6% on SVOD. content. The highest number of TV seasons
was found on tech players for TVOD and
pure VOD players for SVOD, and European-
owned services provided more European TV
content.
18 Y E A R B O O K 2020/ 2021 – K E Y T R E N D S2.1
What types of VOD businesses offer
the most content in Europe?
Tech and pure VOD players offer the highest
number of films and TV seasons
82% for TVOD and 66% for SVOD
TVOD - Films and TV seasons SVOD - Films and TV seasons
in catalogues in 2020 in catalogues in 2020
(in number of titles and %) (in number of titles and %)
7% 3% 12%
TV Distributor 12% 18% TV
51 962 22 962 Telecom 35 047 1%
8% Pure VOD Private equity
Telecom player 51 150
2 332
60 168 91 047
3%
Distributor
8 160
70% 29%
Tech Tech
535 079 85 422 37%
Pure VOD
player
107 766
Number Average number of Number Average number of
Core business of TVOD films and TV seasons Core business of SVOD films and TV seasons
catalogues per catalogue catalogues per catalogue
Distributor 15 2 038 Distributor 27 461
Pure VOD player 44 2 690 Pure VOD player 90 2 394
Tech 94 8 475 Tech 100 1 708
Telecom 19 5 574 Telecom 56 1 811
TV 13 7 637 TV 65 1 074
Private equity 7 602
Source: JustWatch, Filmtoro, La Pantalla Digital, EUROVOD catalogue data.
Y E A R B O O K 2020/2021 – K E Y T R E N D S 192 CIRCULATION
2.2 Prominence on TVOD: European films are not discriminated
Prominence on TVOD services reflects No significant gap between the share
their business-model of European works in catalogues and
their share of promotion
The analysis of the prominence of films
and TV content highlights the very A relatively high share of EU27 or European
characteristics of transactional video on works are promoted (26% and 39% of all
demand services (TVOD). On the one hand, titles promoted at least once, respectively).
TVOD’s business model primarily relies However, each EU27 or European work
on the sale or rental of a limited number is, on average, promoted less intensively
of recent high potential films. On the than a US film: EU27 and European works
other hand, these high potential films are account for 18% and 37% of promotion
supplemented by a ‘long tail’ offering of spots, respectively
older films and TV shows, which are hardly The promotion of European films is even
promoted. High-potential films are ‘pushed’ more concentrated than on average: the
towards consumers through intensive top 10 most promoted European films
promotion, whereas other programmes are accounted, in the sample, for 76% of all
made available for consumers looking for promotion spots dedicated to European
specific titles. films.
Figures also suggest strong differences in
Primarily recent theatrical films
the promotion of European works between
In this context, only a very small share of categories of TVOD services: on average,
a catalogue (1 to 2% of titles) is promoted TVOD services with a multi-country
each month. Moreover, promotion is not presence tend to promote a lesser share of
distributed evenly between titles: out of EU27 and European films (11% and 25% of
about 1 800 films promoted in October all promotion spots, respectively); and, for
2020, the 10 most promoted ones captured these services, the promotion of European
about 44% of all promotion efforts. films is even more concentrated (the top 10
Among these few highly-promoted works, most promoted European films accounted
the bulk were recent films, with 75% of film for 84% of all promotion spots dedicated to
promotion spots going to films produced in European films).
2019 or 2020. A total of 94% of promotion
spots were dedicated to films as opposed
to only 6% for TV content (mainly TV series).
It is also worth noting that films promoted
by TVOD services are mainly theatrical
films, either released in cinemas in the
country of the service (87% of all films) or
in another country (2%). The rest (11%) are
direct to VOD (and also sometimes direct
to DVD) films, not released in cinemas in
any country.
20 Y E A R B O O K 2020/ 2021 – K E Y T R E N D S2.2
Do TVOD services promote primarily
theatrical films?
Yes
89% of films promoted on TVOD
were theatrically released
Breakdown of films promoted at least once by a sample of 57 TVOD services
in 8 countries (October 2020)
Full Direct-
to-VOD 11%
2% Theatrically
87% released in
Theatrical but
Direct-to-VOD the country
in the country
Source: European Audiovisual Observatory analysis of AQOA data
Y E A R B O O K 2020/2021 – K E Y T R E N D S 212 CIRCULATION
2.3 Do films make it from cinemas to VOD?
More than 60% of films released On a country basis, TVOD vs. SVOD
in cinemas available on VOD exclusivity appeared to be the rule,
with some exceptions: films with higher
A total of 62% of all films on first release
admissions or originating from the US
in European cinemas between 1996 and
were more often available both on TVOD
2019 were present on video on demand
and on SVOD.
(VOD) in May 2020 in at least one European
country.1 The share is slightly lower than
the average for European films (56%), but, VOD increases circulation for films
in terms of absolute value, the number of with fewer admissions
European films that made it from cinemas Films were present in more countries on
to VOD was 2.6 times higher than the VOD, on average, than in cinemas: 6.9
number of US films. countries for films on VOD vs. 5.4 for films
The most successful films were widely in cinemas; of the 6.9 countries, about half
present: films available on VOD (in at least were countries where the film had not been
one country) accounted for about 98% of all previously released in cinemas. As regards
cinema admissions. Indeed, figures suggest European films, VOD brought the greatest
that the more admissions a film generates, number of additional territories for films
the more likely it is to be present on VOD: with 50 000, or fewer, admissions.
on average, films not present on VOD
generated about 10 000 admissions
Present in roughly seven countries,
on average
When released on VOD, films were present
in an average of 6.9 European countries. The
circulation of films was lower for European
films with, on average, 4.6 countries.
Availability on VOD was chiefly driven by
transactional video on demand (TVOD)
services, which accounted for 59% of total
VOD presence, vs. 41% for subscription
video on demand (SVOD) services. However,
the share of SVOD was higher for films with
a higher number of admissions in cinemas.
1 In this analysis, Europe refers to the European Union + the United Kingdom.
22 Y E A R B O O K 2020/ 2021 – K E Y T R E N D S2.3
Is VOD improving the circulation
of European films?
Yes
But mostly for films with fewer
than 50 000 cinema admissions
Average number of countries of presence for European films in cinemas
and on VOD by admission clusters (2015-2019)
-5.8
A
verage number of cinema release 19.2
countries (only films available on VOD)
Average number of VOD countries
13.4
-3.4
11.3
-1.7
7.6 7.8
-0.1 +0.6
+2.2 +0.7 4.7 4.6
5.9
4.6
3.9 4.0 4.0
3.3
1.8
1 - 50 000 50 001 - 100 001 - 500 001 - 1 000 000 - > 5 000 000 All films
100 000 500 000 1 000 000 5 000 000
Source: European Audiovisual Observatory
Y E A R B O O K 2020/2021 – K E Y T R E N D S 232 CIRCULATION
2.4 European film exports down in Europe, up in North America
Admissions to European film exports As export admissions to European films
in 2019 declined in most non-European territories
in 2019, interannual growth outside Europe
The European Audiovisual Observatory
was clearly the result of an 11.1 million
estimates that European films cumulatively
ticket jump in the number of tickets sold
generated 444 million admissions in
in the North American market (9.6 million
cinemas worldwide1 in 2019. This was 24
in the US). Excluding the admissions
million tickets fewer than in 2018 and 11
generated in the US, the annual market
million below the 2015-2019 average of
volume for European films outside Europe
455 million admissions.
would have been the lowest in five years.
While the overall number of export
Admissions to European films in China
admissions to European films (i.e. tickets
remained comparatively stable at 20.4
generated in non-national markets, both
million, below the five-year average of 24
within and outside Europe2) remained
million. The country remained the second
comparatively stable in 2019, at 180
largest export market for European export
million (1 million fewer than in 2018),
films in terms of admissions worldwide,
admissions generated in national home
ahead of Germany (12.2 million), France
markets fell to 264 million admissions,
(11.6 million) and Mexico (11.5 million).
down 23 million from the record 2018 high
of 287 million. At the same time, the share
of admissions to European films in non- UK films dominated European film
national markets increased slightly from exports
an estimated 39% in 2018, to 41% in 2019. A total of 730 European films were tracked
as on release in cinemas outside Europe
US drove export admissions in 2019, while as many as 3 752 European
to European films in 2019 films were released in at least one non-
national market in Europe. In both cases,
Outside of Europe, European films
2019 figures represented the highest
generated a total of 94 million tickets
number in five years.
in 2019 (7 million more than in 2018),
accounting for 52% of total export Once again, films produced in the UK took
admissions for the year. In Europe, on the the lion’s share of export admissions in
other hand, admissions to European films 2019, accounting for 44% of admissions to
in non-national markets totalled only 86 European export films worldwide, driven
million in 2019 (8 million fewer than in by the success of historical drama Downton
2018), marking a five-year low. Abbey (17.2 million tickets in non-national
markets worldwide).
1 he term “worldwide” refers to cumulative data for the 34 European and 14 non-European markets for which
T
comprehensive title-by-title data were available for compilation in the Observatory’s LUMIERE database.
2 D
ata available for the following 14 non-European markets: Argentina, Australia, Brazil, Canada, Chile, China, Colombia,
Hong Kong, Japan, South Korea, Mexico, New Zealand, Singapore, USA.
24 Y E A R B O O K 2020/ 2021 – K E Y T R E N D S2.4
What were the three most important
export markets for European films
in 2019?
1 2 3
US China Germany
(162 films selling (62 films selling (887 non-national
36.1 million tickets) 20.4 million tickets) European films selling
12.2 million tickets)
Source: European Audiovisual Observatory / LUMIERE, Comscore
Breakdown of admissions to European export films worldwide,
by production country (2019)
16%
Other European films
5% 44%
Belgian films UK films
5%
Russian films
6%
German films
6%
Spanish films
18%
French films
Source: European Audiovisual Observatory / LUMIERE, Comscore
Y E A R B O O K 2020/2021 – K E Y T R E N D S 253 AUDIOVISUAL SERVICES
3.1 Pre-Brexit fragmentation of TV channel supply
Over 11 000 TV channels available in channels was also observed in markets such
Europe as France and the Czech Republic.
At the end of 2019, 11 418 TV channels Both migrations and specialisations led to
were available in Europe,1 4 757 of them the fragmentation of TV channel supply,
local. Further, there were 3 069 on-demand and to call for a repositioning of the main
services2 available in Europe – 1 832 EU28 hubs for channels targeting non-
catch-up TV; 1 040 pay on demand; and domestic EU28 markets. The UK (34%), the
197 free on demand. Netherlands (22%) and Spain (10%) stood
out as the top three hubs for TV channels
There were 6 420 TV channels established
established in the EU28 and targeting other
in Europe (excluding local channels) at the
EU28 markets at the end of 2019, a sea
end of 2019, of which 4 657 were based
change from the top three hub distribution
in the EU28. Regulatory authorities issued
figures at the end of 2018: the UK (52%); the
5 496 TV broadcasting licences for the TV
Czech Republic (9%); and Luxembourg (8%).
channels (other than local) established
in Europe, of which 3 831 were issued in
UK share of EU28 TV channel supply
the EU28. Of the TV channels established
drops below 25%
in Europe, 91.5% belonged to a private
company (similar figure for the EU28). Despite pre-Brexit migrations of
broadcasting licences, the UK remained
Of the 1 011 pay on demand services
the most prominent TV channel supplier
established in Europe, 919 were based
in Europe, home to 1 026 TV channels.
in the EU28; among these, just 2% were
However, the United Kingdom’s share of
owned by public service broadcasting
overall TV channel supply in the EU28
organisations.
dropped by 6%, to 22%, year on year. This
was chiefly driven by the relocation of TV
Migration and diversification of TV
channels targeting countries outside the
channels ahead of Brexit
UK which ultimately accounted for 33% of
The year 2019 saw the big US television all UK-based channels in 2019 (down from
networks seeking to secure distribution 46% in 2018). The UK remained, though,
outside the United Kingdom (UK) for their the major hub for EU28-based TV channels
portfolio of international channels ahead targeting other EU28 markets in 2019.
of Brexit. Traditionally UK-based networks
Home to 237 pay on demand services,
such as Discovery, Viacom, Sony and SPI
the UK also led pay on demand supply.
International applied for (and were granted)
Accounting for 37% of all pay on demand
licenses chiefly in the Netherlands and
services targeting other EU28 markets it
Spain. On top of this relocation, the new
was also the major hub for international
host territories issued additional licences
pay on demand networks, followed by
for newly launched localised versions of
Ireland (25%) and Spain (13%).
these international franchises. This type
of diversification of flagship international
1 E
urope includes the MAVISE territories: EU28, Albania, Armenia, Bosnia and Herzegovina, Switzerland, Georgia, Iceland,
Liechtenstein, Montenegro, North Macedonia, Norway, Russia, Turkey as well as Morocco.
2 F
igures for on-demand services available in Europe include both free and pay services.
26 Y E A R B O O K 2020/ 2021 – K E Y T R E N D S3.1
Where did traditionally UK-based
broadcasting licences migrate to
primarily, ahead of Brexit?
The Netherlands
The main destination for the relocation and
specialisation of broadcasting licences in 2019
was the Netherlands, followed by Spain
Concentration of TV channels established in the EU28 targeting
other EU28 markets (2019 – in %)
LU 34% GB
8% TOP
FIVE
9% HUBS
CZ
10%
22%
ES
NL
Source: European Audiovisual Observatory analysis of MAVISE data
Y E A R B O O K 2020/2021 – K E Y T R E N D S 273 AUDIOVISUAL SERVICES
3.2 SVOD erodes linear TV viewing
Audiences are increasingly going online decrease over five years. This was followed
to consume audiovisual content. These by Iceland (25% less), Denmark (22% less)
changes in viewing behaviour have and Sweden (18% less). Finland, which has
prompted TV broadcasters to adapt. With below-EU-average television consumption,
the Internet no longer just a supplement has lost a further 5% over five years.
complementing traditional broadcasting,
TV broadcasters are investing more in Contraction of audience shares
OTT delivery systems and broadcaster of main TV channels and groups
on-demand services to better connect
There has been a general decrease in the
with their audiences online. The strong
concentration of the European audience
competition for audiences across
market due to a continued loss of share
broadcasting and between global and
by market leaders over time. Over a five-
local streaming players has left its mark on
year period from 2015 to 2019, average
viewing trends.
audience market shares of the four leading
TV channels in Europe’s1 national markets
Decline of television viewing contracted by 7%, slightly less than in the
Average daily television viewing per person EU as a whole (-6%).
continues to decrease at a pace faster than The four main TV groups recorded lower
anticipated. With a 3h34 daily average in audience losses, though, indicating that
2019, people in the EU28 were watching industry consolidation processes have
2% less television than the previous slowed the overall trend, enabling groups
year, a decline of 4% over five years. The to better maintain cumulated shares in the
average time spent in front of TV screens European national markets. Over a five-
by consumers in the countries covered by year period (2015-2019), average audience
the European Audiovisual Observatory was market shares of the four leading TV groups
even less with 3h25 in 2019, a 6% decline in Europe’s national markets contracted by
over a five-year period. 3.2%. In the EU as a whole, the average
In the Nordic countries, where the decline in audience shares was somewhat
subscription video on demand (SVOD) less pronounced (-1.7%).
market is booming, people generally The weight of public service broadcasting
watched less TV than elsewhere in Europe (PSB) groups in national audience markets
and viewing figures there decreased faster is also in decline. From 2015 to 2019,
than in other countries (20% less over the average audience market share of
five years). Consumers in Norway watched European2 PSBs contracted by 3%.
less than 2h of TV per day in 2019, a 33%
1 E urope includes the EU28, Bosnia and Herzegovina, Switzerland, Georgia, Iceland, North Macedonia, Norway and Turkey.
2 Includes EU (without Luxembourg and Malta) plus Armenia, Bosnia and Herzegovina, Switzerland, Georgia, Iceland,
North Macedonia, Norway, and Turkey.
28 Y E A R B O O K 2020/ 2021 – K E Y T R E N D S3.2
How much did average daily television
viewing drop in the Nordic countries
over five years (2015-2019)?
-20%
Five times as much as it did in the EU28 (-4%)
Average daily television viewing per person (2015-2019, in hh: mn)
03:43 03:42 03:41 03:38
03:34
03:39 03:37
03:33 03:33
03:25
02:34
02:28
02:19
02:09
02:03
2015 2016 2017 2018 2019
EU28 avg. daily viewing EUR-OBS avg. daily viewing Nordics avg. daily viewing
Source: European Audiovisual Observatory analysis of GLANCE audience data
Y E A R B O O K 2020/2021 – K E Y T R E N D S 293 AUDIOVISUAL SERVICES
3.3 Diversity and inclusion in the audiovisual industries
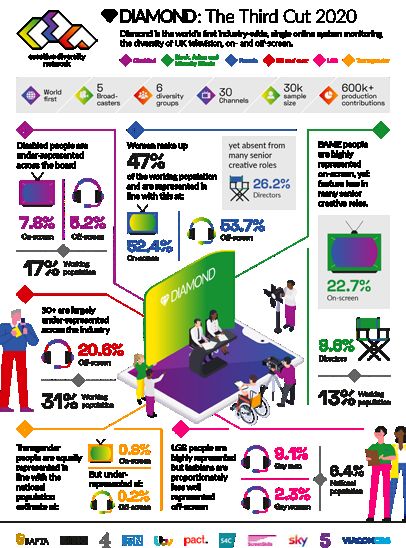
The issue of diversity and inclusion (D&I) both on and off-screen, and representation
has gained momentum in recent years, of Black, Asian & other Minority Ethnics
overall and, in particular, within the film (BAME) on-screen is higher when compared
and audiovisual industries. D&I exists, as an to the UK national population as a whole –
issue, both on- and off-screen. there is more work to be done in many
areas. These same two groups remain
Off-screen, D&I refers not only to access
absent from many senior creative roles,
to the workforce under equal conditions
BAME individuals are under-represented
in terms of salary, career development
in off-screen roles more generally, and the
and opportunities, as well as access to
over-50s are also largely under-represented
training, but also to a fair, proportional
across the industry. The industry as a
representation of society in decision-
whole is still struggling, in particular with
making positions – from creative executives
employment of disabled people. The overall
and film and TV commissioners, to festival
UK national figure for working-age disabled
programmers and representatives of public
people is 17%, but disabled people only
funding selection committees.
comprise 5.2% of contributions off-screen,
With regard to on-screen diversity, it is and 7.8% on-screen.
widely accepted that appropriate portrayal
Concerning solutions, there is a wide array
of under- or misrepresented groups in films
of tools to close the diversity gap that
and audiovisual works requires that people
are being implemented or promoted by
from those groups be actively and relevantly
public institutions (ministries, film funds,
involved in their production. According to
regulatory authorities, public service
this interpretation, people tend to focus
broadcasters [PSB]), private institutions
on stories which talk to and about them;
(private broadcasters and other media
following this logic, off-screen diversity at
services), industry associations and civil
the creative and decision-making stages is
society. These are aimed at either assessing
a conditio sine qua non for the achievement
the situation (studies, reports, barometers,
of on-screen diversity.
observatories), designing D&I plans and
Gathering and interpreting data on strategies (for instance, a PSB D&I charter),
workforce diversity is fundamental for setting mandatory or flexible requirements
understanding the extent of the problem (for instance, in a broadcaster’s or film fund’s
– and proposing solutions. A prominent commissioning guidelines), promoting the
example, in the UK, is the Creative Diversity access of certain groups to the workforce
Network’s report Diamond: The Third Cut,1 in the audiovisual industries (mentoring,
which reveals that while some progress training, establishing quotas), and raising
has been made – for example women’s awareness about the lack of diversity
representation is now aligned with that (campaigns).
across the working population overall,
1 Available at: https://creativediversitynetwork.com/diamond/diamond-reports/diamond-the-third-cut-report/.
30 Y E A R B O O K 2020/ 2021 – K E Y T R E N D S3.3
How diverse is the UK television
sector?
Source: http://creativediversitynetwork.com/wp-content/uploads/2020/02/Diamond-Third-Cut-Infographic-CDN-Public.pdf.
Y E A R B O O K 2020/2021 – K E Y T R E N D S 314 MARKETS
4.1 Focus on Observatory presidency country: United Kingdom
Second largest audiovisual market and ITV rank among the top 10 largest
in Europe audiovisual European companies; at the
very top of the list is UK-based Sky, which
With EUR 21.5 bn, the United Kingdom
was acquired by leading US cable operator
is Europe’s second-largest audiovisual
Comcast in September 2018.
market, second only to Germany. On a per
capita basis, the UK market appears to be
more developed than in the other largest A major exporter of TV channels
European countries. By the end of December 2019, i.e.
Distinctive features of the UK audiovisual immediately before Brexit, a still limited
market when compared to Europe averages number of TV channels had started to
include: relocate, mainly to the Netherlands and
Spain. Nonetheless, the United Kingdom
• a smaller share of revenues originating
remains by far the leading European country
from TV advertising (in a context where
by number of TV channels established. It is
Internet captures a much higher share
also the main hub for TV channels serving
of UK advertising expenditure than on
other European countries.
average in Europe);
• a higher share for pay service revenues, A film and TV production powerhouse
in particular as regards consumer
expenditure for video on demand The United Kingdom is among the top five
services. European countries in terms of number of
feature films produced and, by far, the main
Pay television in the UK is mostly driven by producer of high-end audiovisual TV series,
satellite (78% of pay TV revenues), whereas boosted by a long tradition of investment
IPTV remains comparatively small (and is by broadcasters and collaboration with
stagnating). the United States, and by a dedicated
production incentive scheme. However,
Host to 3 major television groups concern has recently emerged that the TV
production boom in the United Kingdom
At 3h02, the average daily time spent
may have undesirable effects, such as an
viewing television in the United Kingdom
inflation of budgets, a shortage of skills
is under the European average (3h25);
and the transformation of UK producers
the United Kingdom is also one of the
into executive producers with little control
European countries where TV viewing has
of exploitation rights.
decreased most (-15% between 2015 and
2019). The two major TV groups, the public In any event, UK production excellence
service broadcaster, the BBC, and private translates into strong exports, in particular
group ITV, account together for about 58% as regards TV series on video on demand.
of the audience, followed at a distance by For instance, the United Kingdom accounts
public but TV-advertising-funded Channel for close to 50% of all TV seasons available
4 and pay TV provider Sky. Both the BBC on subscription video on demand in Europe.
32 Y E A R B O O K 2020/ 2021 – K E Y T R E N D S4.1
How important are high-end TV
series to the UK production sector?
High-end TV series
account for 46%
of production investment
Up from 29% in 2014
Investment in films and high-end TV series in the UK
(2014-2019 – in % and bn GBP)
3.6 bn GBP
46%
2.2 bn GBP
29%
54%
71%
High-end TV series
Film
2014 2019
Source : BFI, Screen sector production, https://core-cms.bfi.org.uk/media/2833/download
Y E A R B O O K 2020/2021 – K E Y T R E N D S 334 MARKETS
4.2 Trouble began before the COVID-19 crisis
A declining market (for most segments) demand, however, is growing seven times
faster and now accounts for over 80% of
Even before the 2020 COVID-19 crisis,
the on-demand market.
the European audiovisual market showed
additional signs of deceleration across its
segments. In nominal value, the annual Long-term trends
growth rate between 2015 and 2019 was A bird’s eye view of audiovisual market
1.6%1 on average. But, discounting inflation, revenues shows slow but structural
the market remained flat. Excluding the evolutions:
on-demand segment, it even decreased by
1% per year in real terms. •
consumer spending on pay services is
tending to grow faster than resources
Among the legacy audiovisual services, (advertising, public funding) benefiting
pay TV has resisted comparatively well, free services;
due, in part, to the termination of the
cable TV digitisation process. Unlike in the •
the share of revenues going to
United States, cord-cutting (i.e. consumers audiovisual services vs. the share going
switching from pay TV to Internet on to the purchase or rental of individual
demand services) has not (as of end 2019) programmes is increasing;
induced a massive decrease in pay TV • the share of public funding within the
subscribers. sector’s revenues is decreasing;
But other market segments have been • the share of on-demand services within
either flat or in the red over the last revenues, although still modest (8% of all
five years in real terms: TV advertising, revenues; 17% of consumer spending in
increasingly affected by the progress of 2019) is constantly increasing.
online advertising; the public funding of
public service broadcasters, despite the COVID-19: Acceleration and disruption
evolution of the licence fee scheme in
certain countries; and the cinema box Initial findings regarding the impact of
office, despite a strong 2019. the COVID-19 crisis on the audiovisual
sector suggest that whereas pay TV and
Home entertainment continues to dive, public funding will probably have shown
as the digital purchase or rental of films some resilience, TV advertising will, on the
and TV series, despite sustained growth, one hand, have been deeply hurt by the
has nowhere near compensated for the economic recession and will, on the other,
shrinking of the physical market. probably recover more slowly than its
Over the last five years, on-demand services main competitor, online advertising. At the
have been the growth engine of the time of writing, it is unclear whether the
audiovisual sector. But the segment is quite second wave of confinement hitting Europe
heteroclite. Transactional video on demand in autumn 2020 will induce a structural
(i.e. the purchase or rental of an audiovisual long-term impact on cinema exhibition.
work) is maturing - although annual growth But figures do suggest that subscription
is still running at a dapper 6%, the rate of video on demand revenues were boosted
growth is decreasing. Subscription video on throughout the crisis.
1 E
U28 pre-Brexit data.
34 Y E A R B O O K 2020/ 2021 – K E Y T R E N D SYou can also read