BIHAR THE LAND OF BUDDHA - February 2018 - IBEF
←
→
Page content transcription
If your browser does not render page correctly, please read the page content below

BIHAR
THE LAND OF BUDDHA

 For updated information, please visit www.ibef.org   February 2018
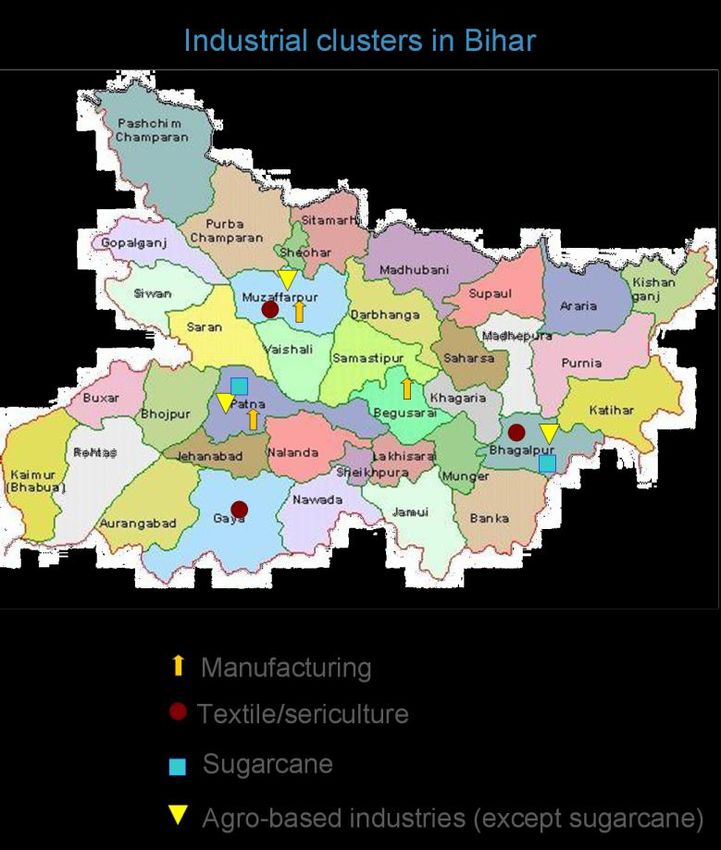
Table of Content

  Executive Summary……………….….…….3

  Advantage State……………………...……..4

  Bihar Vision……………………………...…..5

  Bihar– An Introduction….….…….…....…...6

  Annual State Budget 2017-18…………….16

  Infrastructure Status ………………………17

  Business opportunities ……………..…….37

  State Acts & Policies…….……….........…66

  Doing Business in Bihar……………..…...61

  State Acts & Policies……………………..62

EXECUTIVE SUMMARY
Fastest growing state in The Gross State Domestic Product (GSDP) of Bihar grew at a CAGR of 12.14% between 2011-12 and
India 2016-17.
Fastest per capita Bihar has witnessed strong growth in per capita net state domestic product. At current prices, per capita
income growth NSDP of the state grew at a CAGR of 10.35 per cent during 2011-12 to 2016-17.
Leader in the production
Bihar is the 3rd largest producers of vegetables & the 6th largest producer of fruits in India.
of fruits and vegetables
Bihar has high agricultural production making it one of the strongest sectors of the state. About 80% of the
Strong agriculture sector state’s population is employed in agriculture, which is much higher as compared to India’s average. The
state has developed as the number one state in the eastern region in terms of agricultural production.
Fifth largest mobile With 69.31 million mobile subscribers in February 2017, Bihar accounted for the third largest mobile
subscriber base subscriber base among all Indian states.
Source: Central Statistics Office, Ministry of Statistics and Programme Implementation, Ministry for Integrated Development of Horticulture, NSDP- Net State Domestic Product
3 BIHAR For updated information, please visit www.ibef.org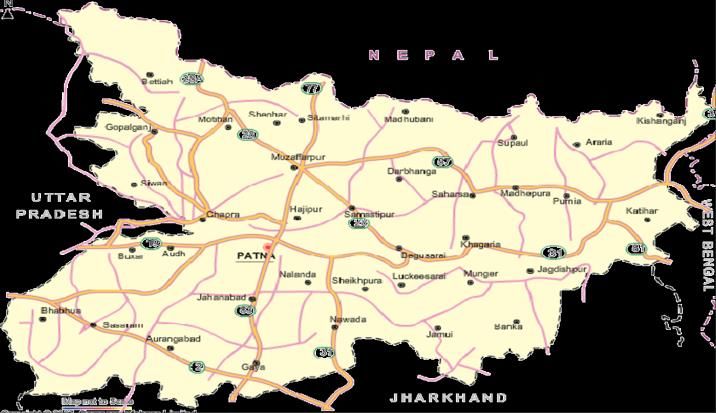
ADVANTAGE: BIHAR
GSDP High Economic Growth with flourishing Policy incentives NSDP
industries As per the women empowerment policy, the state is
State GSDP The per capita GSDP of Bihar increased at a CAGR of increasing its focus on women empowerment by State NSDP
grew at a 10.38%, between 2011-12 and 2016-17. ensuring availability of resources (education & grew at a
employment) for women, which would in turn lead to
CAGR of Food processing, dairy, sugar, manufacturing & CAGR of
increased contribution from women in development of
12.13% healthcare are some of the fast growing industries in the 12.10%
the economy
during state. The state has planned initiatives for the during
development of other sectors such as education & In May 2017, the state government has given around
2011-12 to tourism. 3.65 lakh government employees & 6 lakh pensioners 2011-12 to
2016-17 a revised pay scale from the month of May as per the 2016-17
7th pay scale recommendations
Advantage
Bihar
Rich labour pool Location advantage
The state has a large base of cost-effective industrial The state enjoys a unique location specific advantage
labour, making it an ideal destination for a wide range of because of its proximity to the vast markets of eastern
industries. & northern India, access to ports such as Kolkata &
The state has institutes of national importance such as Haldia & to raw material sources & mineral reserves
National Institute of Technology & Indian Institute of from the neighbouring states.
Technology, which provide skilled manpower to
industries.
GSDP: Gross State Domestic Product NSDP: Net State Domestic Product EBC: Extremely Backward Class
4 BIHAR For updated information, please visit www.ibef.org
STATE VISION
Knowledge and religious hubs to be built & will
. Agriculture to play a significant role with
attract 100,000 tourists per year by 2022. opportunities in food processing & agro-
Construct mega religious theme parks based industries.
(Buddhism & Jainism). Use quality seeds & fertilisers & upgraded
Eight centres for educational, cultural & technology
religious tourism planned. Provide institutional credit & crop insurance.
Planned roadmap for improved connectivity; Develop infrastructure with focus on roads &
luxury hotels to be constructed through PPP energy sector.
mode. GSDP Growth
Tourism
Tourism service centres to be set up.
Vision 2022
Health Education
Build medical institutions, create awareness & Achieve zero dropout rate in secondary
bring about technological advancements. education.
Introduce radiology & pathology services in Increase spending on building schools and
every district. colleges with easy access and upgraded
Government hospitals across 36 districts to be infrastructure.
provided with CT scan services. Launch policy initiatives to ensure
All government hospitals likely to commence compulsory enrolments
dialysis services. Open vocational training institutes.
Source: Confederation of Indian Industry
5 BIHAR For updated information, please visit www.ibef.org
BIHAR FACT FILE
The most commonly spoken languages in the state are Hindi,
English, Urdu, Bhojpuri, Maithili & Angika.
The 4 agro-climatic seasons and fertile soil of Bihar support
cultivation of a wide range of crops.
Parameters Bihar
Capital Patna
Geographical area (sq km) 94,163
Source: Maps of India Administrative districts (No) 38
Population density (persons per sq km) 1,106
Bihar is located in the eastern part of India. The state is surrounded Total population (million) 104.1
by Nepal in the north, West Bengal in the east, Uttar Pradesh in the
Male population (million) 54.3
west & Jharkhand in the south.
Female population (million) 49.8
The state has a number of rivers; the most important of which is the
Ganges. Sex ratio (females per 1,000 males) 918
Patna, Gaya, Bhagalpur, Muzaffarpur & Darbhanga are some of the Literacy rate (%) 61.8
key cities in Bihar.
Source: Government of Bihar website, Census 2011
6 BIHAR For updated information, please visit www.ibef.org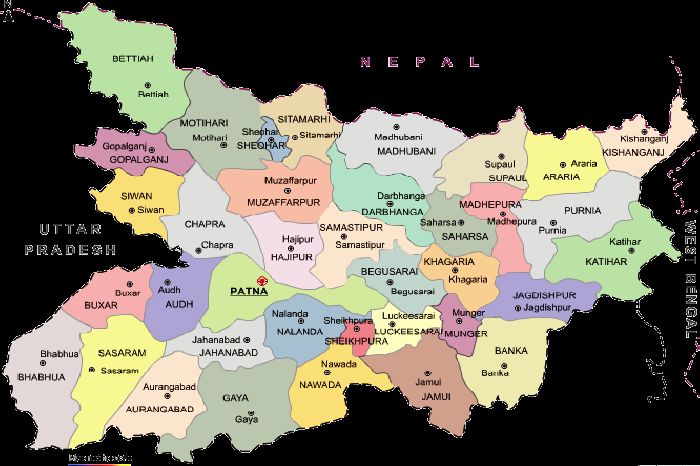
BIHAR IN FIGURES … (1/2)

     Parameter                                        Bihar       All states      Source

     Economy                                         2016-17       2016-17

                                                                                  Directorate of Economics & Statistics of Bihar,
         GSDP as a percentage of all states’ GSDP      2.88         100.0
                                                                                  Central Statistics Office
                                                                                  Directorate of Economics & Statistics of Bihar,
         GSDP growth rate (%)                         12.13         11.69
                                                                                  Central Statistics Office
                                                                                  Directorate of Economics & Statistics of Bihar,
         Per capita GSDP (US$)                       598.29        1,788.95
                                                                                  Central Statistics Office

     Physical Infrastructure

         Installed power capacity (MW)               4,090.54     334,399.83        Central Electricity Authority, as of January 2018

                                                                                     Telecom Regulatory Authority of India, as of
         Wireless subscribers (No)                  84,288,848   1,167,435,645
                                                                                                December 2017
                                                                                     Telecom Regulatory Authority of India, as of
         Internet subscribers (No)*                 22,750,000   429,230,000
                                                                                                September 2017
                                                                                    NHAI & Roads and Building Department, as of
         National Highway length (km)                 4,839         115,435
                                                                                                   June 2017

         Airports (No)                                  2            125                       Airports Authority of India

    Note: * includes Jharkhand

7        BIHAR                                                                   For updated information, please visit www.ibef.org
BIHAR IN FIGURES … (2/2)

      Parameter                                                              Bihar             All states    Source

      Social Indicators

          Literacy rate (%)                                                   61.8               73.0        Census 2011

          Birth rate (per 1,000 population)                                   26.8               20.4        SRS Bulletin

      Investments

                                                                                                             Department of Industrial Policy & Promotion, April
          FDI equity inflows (US$ billion)                                   0.1131             357.47
                                                                                                             2000 to September 2017

      Industrial Infrastructure

          PPP projects under construction (no)                                  7                 479        DEA, Ministry of Finance, Government of India

          PPP projects operational (no)                                         8                 717        DEA, Ministry of Finance, Government of India

    1Including   Jharkhand, PPP: Public-Private Partnership, SRS: Sample Registration System

8         BIHAR                                                                                             For updated information, please visit www.ibef.org
ECONOMIC SNAPSHOT – GSDP
In 2016-17, Bihar’s GSDP at current prices was around US$ 68 GSDP of Bihar at current prices (in US$ billion)
billion.
The state’s GSDP grew at a CAGR of 12.14% between 2011-12 and 80.0 CAGR 12.14%
2016-17.
70.0
68.0
60.0
59.3
53.2
50.0
49.2
43.8
40.0
38.3
30.0
20.0
10.0
0.0
2011-12
2012-13
2013-14
2014-15
2015-16
2016-17
Source: Directorate of Economics & Statistics of Bihar, Central Statistics Office
9 BIHAR For updated information, please visit www.ibef.orgECONOMIC SNAPSHOT – NSDP
In 2016-17, NSDP of Bihar was US$ 62.7 billion. Bihar’s NSDP at current prices (in US$ billion)
Average NSDP growth rate in the state was about 12.12% between
2011-12 and 2016-17. 70.0 CAGR 12.12%
60.0
62.7
54.6
50.0
49.1
45.3
40.0
40.5
35.4
30.0
20.0
10.0
0.0
2011-12
2012-13
2013-14
2014-15
2015-16
2016-17
Source: Directorate of Economics & Statistics of Bihar, Central Statistics Office
10 BIHAR For updated information, please visit www.ibef.orgECONOMIC SNAPSHOT – PER CAPITA GSDP
The per capita GSDP of Bihar increased from US$ 365.1 in 2011-12 Bihar’s per capita GSDP at current prices (US$)
to US$ 598.3 in 2016-17.
The per capita GSDP of Bihar increased at a CAGR of 10.38%, 700.0 CAGR 10.38%
between 2011-12 and 2016-17.
600.0
598.3
529.3
500.0
483.4
454.0
400.0
410.7
365.1
300.0
200.0
100.0
0.0
2011-12
2012-13
2013-14
2014-15
2015-16
2016-17
Source: Ministry of Statistics and Programme Implementation, Government of India
11 BIHAR For updated information, please visit www.ibef.orgECONOMIC SNAPSHOT – PER CAPITA NSDP
Bihar’s per capita NSDP increased from US$ 337.4 in 2011-12 to Per capita NSDP of Bihar at current prices (in US$)
US$ 552.4 in 2016-17.
Robust growth across secondary & tertiary sectors resulted in 600.0 CAGR 10.36%
growth in average per capita NSDP of Bihar at a CAGR of around
10.36% between 2011-12 and 2016-17.
552.4
The state government has taken measures to improve the 500.0
488.2
investment climate of the state & to achieve industrial growth rate
of 15% per annum. This will increase contribution of secondary
445.0
400.0
418.3
sector in the GSDP to more than 25%, in line with the National
380.1
Manufacturing Policy & Make in India initiative.
337.4
The Bihar Government formulated the Bihar Industrial Investment 300.0
Promotion Policy, 2016, to increase focus on the development of
support infrastructure, prioritising the core sectors & emphasising
on advanced technology, skill development, a modified structured 200.0
package of assistance & balanced regional development i.e.
uniformly extending the benefits of investment to all geographical
100.0
areas of the state.
0.0
2011-12
2012-13
2013-14
2014-15
2015-16
2016-17
Source: Directorate of Economics & Statistics of Bihar, Central Statistics Office
12 BIHAR For updated information, please visit www.ibef.orgECONOMIC SNAPSHOT – PERCENTAGE
DISTRIBUTION OF GSVA
The tertiary sectorµ contributed 59.90% to the GSVA of Bihar (at Visakhapatnam
Percentageport
distribution
traffic (million
of GSVAtonnes)
current prices) in 2016-17, followed by primary sector & secondary
sectorµ contributing 23.09% and 17%, respectively.
100%
Between 2011-12 and 2016-17, tertiary sector was the fastest 55.48% CAGR 59.90%
growing sector in the state, witnessing growth at a CAGR of 13.87%, 90%
followed by secondary sector, which witnessed growth at a CAGR of
80% 13.87%
9.95%, during 2011-12 and 2016-17.
This growth has been supported by various sectors such as 70%
manufacturing, electricity, gas & water supply; construction &
60%
services industries.
50%
In the state of Bihar, the primary sector witnessed growth at a CAGR
of 9.71%, between 2011-12 and 2016-17. 40% 18.76%
17.00%
As per Bihar’s Economic survey 2016-17, the tertiary & secondary 9.95%
30%
sectors registered a growth of 10.4% & 8.4%, respectively, over the
previous year, which is faster than the overall economic growth. 20% 25.76%
23.09%
10% 9.71%
0%
2011-12 2016-17
Primary Secondary Tertiary
Source: Sector-wise %share of GSVA
13 BIHAR For updated information, please visit www.ibef.orgECONOMIC SNAPSHOT – AGRICULTURAL PRODUCTION
During 2016-17, an area of 1,182.34 thousand hectares was used for Crop Annual production 2016-17 (‘000 MT)
production of horticulture crops in the state. The total production of
Rice 6,490
horticulture crops in 2016-17 stood at 18,624.31 thousand metric
tonnes. Wheat 4,750
Bihar is among the leading producer of fruits & vegetables in India. Total coarse cereals 2,430
Major crops produced in the state include sugarcane, rice, wheat, Total pulses 430
maize & potato.
Total food grains 14,100
During the period of Agriculture Road Map II from 2017-22, an
Onion 1,247.34
increase in construction of tissue culture laboratories in the state, is
anticipated. Honey 8.89
By the end of August 2016, there were around 407 food processing Plantation 98.27
units in the state, of which 278 were operational.
Sugarcane 14,680
Fruits 4,272.94
Vegetables 14,225.04
Leading districts of crop production
Rice Rohtas, Aurangabad, West Champaran, Gaya
Maize Madhepura, Khagaria, Saharsa, Katihar, Bhagalpur
Wheat Rohtas, East Champaran, Muzaffarpur, Siwan
Pulses Patna, Aurangabad, Bhojpur
Source: Economic Survey of Bihar, 2015-16, Horticulture Database 2014-15 National Horticulture Board, Department of Agriculture Co-operation & Farmers Welfare
14 BIHAR For updated information, please visit www.ibef.orgECONOMIC SNAPSHOT – FDI INFLOWS &
INVESTMENTS
Total FDI for Bihar & Jharkhand, between April 2000 and September FDI inflows1 in Bihar (in US$ million)
2017, stood at US$ 113 million.
50
Up to December 2017, a total of 539 investment proposals have 45
been approved by SIPB, of which 262 proposals are related to food 40 43
processing, 61 proposals related to manufacturing, 52 proposals for 35
30
plastic and rubber and so on.
25
20
15
10
5 11 10 10
8 1
-
2012-13 2013-14 2014-15 2015-16 2016-17 2017-18*
Investment intentions in terms of IEMs filed, LOIs/DILs issued
1000 899.3
800
600
400
193.6
200 72.4
23 19 7
0
2015 2016 2017^
Number of Investment Intentions Proposed Investments (US$ Million)
Source: Department of Industrial Policy & Promotion 1 Including Jharkhand, Ministry of Commerce & Industry, Government of India,2 - As of December 2016 IEMs – Industrial
Entrepreneur Memoranda, LOIs – Letters of Intent DILs – Direct Industrial Licences, * - data from April-September 2017, ^ - upto December 2017
15 BIHAR For updated information, please visit www.ibef.orgSTATE BUDGET 2017-18
The total expenditure for state as per budget 2017-18 is estimated to stand at around US$ 24.85 billion.
Name of Department Expenditure (US$ billion)
Education 3.92
Pension 3.09
Energy 1.69
Health 1.09
Home 1.16
Panchayati Raj 1.35
Other Department 8.54
Source: Andhra Pradesh State Portal, Directorate General of Commercial Intelligence and Statistics, Directorate of Economics and Statistics, AP NA – Not Available, (1)2014-15
16 BIHAR For updated information, please visit www.ibef.orgPHYSICAL INFRASTRUCTURE – ROADS
In January 2017, the government approved a highway project worth
US$ 731.51 million, to widen NH-2 in Jharkhand & Bihar.
Construction work of 2,232 km national highways through state fund,
2,104 km state highways under National Development Scheme &
251 km roads under the state plan was completed during 2015-16.
Source: Maps of India
During 2015-16, the total road length of Bihar stood at 209,758 km.
Bihar has 4,839 km of national highways & 4,253 km of state The government has plans for connecting all the unconnected
highways. Besides, the state has 11,054 km of major district roads. regions of the state with a population greater than 250 people, in the
road communication sector.
As of June 2017, 1,114 major & minor roads in the state were
completed under Mukhyamantri Setu Nirman Yojna along with 824 Moreover, during 2015-16, construction, widening & repairing of
major, minor & mega roads under various other heads. In the 2017- 12,554 km of major district roads was accomplished by the state
18 budget, capital outlay of US$ 1.03 billion is proposed for the government. As per budget 2016-17, for development of state
development of roads & bridges in the state compared to US$ highways & major district roads, action plans costing around US$
863.26 million in the 2016- 17 budget. 348.67 million & for construction of 20 bridges in the state, an action
plan of US$ 71.68 million was approved by the state government. As
In October 2016, Cabinet Committee on Economic Affairs (CCEA) per the 2017-18 budget, around US$ 855 million have been allocated
approved construction of a new highway project worth US$ 292 for construction of state highways and around US$ 70 million has
million, between Sahibganj in Jharkhand (NH-131A) to Manihari in been allocated to for the India- Nepal border end.
Bihar (NH-133B). A part of the stretch is a bridge over river Ganga.
In April 2017, the foundation stone for this bridge was laid.
Length (km)
Type of road
In November 2016, Government of India & Asian Development Bank (up to September 2016)
signed a US$ 500 million loan to build India’s longest river bridge
National highways^ 4,839
across Ganga to improve connectivity between North & South Bihar.
As of February 2017, the work on the bridge is expected to start soon State highways 4,253
and is expected to be completed by December 2020.
Major district roads 11,054
Note: ^ - as of June 2017
Source: Economic Survey of Bihar, 2015-16, NHAI, Ministry of Road Transport & Highways, State Budget 2015-16, Road Construction Dept., Bihar Rajya Pul Nirman Nigam Ltd
17 BIHAR For updated information, please visit www.ibef.orgPHYSICAL INFRASTRUCTURE – RAILWAYS
Hajipur in Bihar is the headquarter of the East-Central Railway. The
state’s main railway junctions are at Patna, Gaya, Muzaffarpur,
Katihar & Samastipur.
In 2015, the central government approved an FDI project worth US$
396.03 million with General Electric for manufacturing world class
diesel and electric locomotive at factories in Marhowrah, Bihar. As of
October 2017, the work is on track and the first of the 1,000
locomotives has arrived at Mundra Port.
Several link-lines, such as Muzaffarpur-Samastipur-Barauni-Katihar
& Muzaffarpur-Chapra-Siwan, have been converted to broad gauge
from metre gauge.
Source: Maps of India
Bihar is speeding up on execution of the Patna metro rail project &
has constituted an SPV for the same. In 2015, the Detailed Project
Report (DPR) has been submitted for the Patna metro project. The The construction work worth US$ 484.57 million, for rail-cum-road
DPR amount for the project is estimated at US$ 1.99 billion. The bridge on the Ganga river between Digha & Sonepur, near Patna is
work on the project is expected to start by April 2018. taken care by the railways. The state's share of US$ 205.71 million in
the total cost of the project would be paid by the Planning
In 2015, a plant was built for the Indian Railways in Saran district
Commission. The rail-cum-road bridge is now functional.
Bihar, at an estimated cost of US$ 247.5 million on an area of 285
acres. The plant has a capacity to produce 50,000 wheels of goods Construction work for 11 ROBs (road over bridges) on railway
wagons, passenger coaches & locomotives per year. Contract for crossings is under progress. As per Economic Survey 2015-16,
construction of project was awarded to Larsen & Toubro on EPC railways made a contribution of US$ 39.26 million & the state made a
basis. contribution of US$ 93.03 million in this project. On January 2, 2018,
the government gave its approval for 47 new ROBs.
Source: Economic Survey 2014-15
18 BIHAR For updated information, please visit www.ibef.orgPHYSICAL INFRASTRUCTURE – AIRPORTS
Bihar has 1 domestic airport in Patna & 1 international airport in Airport indicators April 2017- December 2017
Bodh Gaya. Several domestic airlines connect Patna to Delhi,
Kolkata, Mumbai, Lucknow, Bengaluru, Hyderabad & Ranchi. Parameter Patna Gaya
The airport in Bodh Gaya is used for international connectivity with
Aircraft movement (nos.) 16,192 1,561
Bangkok (Thailand), Colombo (Sri Lanka), Yangon (Myanmar),
Dhaka (Bangladesh), Paro (Bhutan) & Kuala Lumpur (Malaysia). In Passenger traffic (nos.) 2,266,593 109,040
March 2015, the Airports Authority of India announced plans to
Freight handled (tonnes) 5,419 0
develop the Indian Air Force airport of Bihar as an international
airport. This airport would be used for international transport
purposes. The Ministry of Civil Aviation has requested for 156 acres
of land from the Bihar state government.
Source: Airport Authority of India
19 BIHAR For updated information, please visit www.ibef.orgPHYSICAL INFRASTRUCTURE – WATERWAYS
The 1,620 km stretch of the river Ganges that flows between Allahabad in
Uttar Pradesh & Haldia in West Bengal has been declared ‘National
Waterway 1’, & is being developed by the Inland Waterways Authority of
India.
Patna has a low-level fixed terminal on National Waterway-1 for handling
containers. The National Inland Navigation Institute has been set up in
Patna to train vessel crews.
In 2015, the state government requested the central government for funding
the development of 6 rivers, including Gandak, Ghaghra, Koshi, Punpun,
Sone & Karamnasa, for inland waterways. This project is being undertaken
to make them navigable & connect 2,000 panchayats with waterways.
Source: Maps of India
As of May 2015, the central government has proposed an inland waterways
project through which several road projects are taken up with an investment
of US$ 8.3 billion which will facilitate transportation of cargo between Haldia
National Approximate
& Allahabad via Patna in Bihar. S. No State
Waterways length (km)
As per National Waterways Act, 2016, 111 waterways have been declared 1 NW-37 300 Bihar & UP
as National Waterways (NWs) including the 5 existing NWs. The techno-
economic feasibility for the newly declared 106 NWs has been initiated. 2 NW-40 340 Bihar & UP
Under this new scheme, 6 NWs have been planned in the state of Bihar. 3 NW-54 86 UP & Bihar
Under the plan for development of NW-1, ferry services, ship repair
4 NW-58 236 Bihar
facilities, roll-on roll-off (RO-RO) services, state-of-the-art terminals at
Kalughat & Gaighat will be developed in the state of Bihar. The projects are 5 NW-81 35 Bihar
likely to create direct & indirect employment for more than 50,000 people in
6 NW-94 160 Bihar
the state
Source: Bihar Report Card 2015, Press Information Bureau
20 BIHAR For updated information, please visit www.ibef.orgPHYSICAL INFRASTRUCTURE – POWER…(1/3)
As of December 2017, Bihar had a total installed power generation Installed power capacity (MW)
capacity of 4,090.54 MW, of which 3,024.32 MW was contributed
by central utilities, 530.70 MW by state utilities & 535.52 MW by 4,500.00
4,000.00
private utilities.
4,090.54
3,500.00
3,607.54
During the same time period, of the total thermal power plant 3,000.00
3,029.89
2,500.00
2,759.80
capacity, coal-based plants accounted for the largest share with 2,000.00
1,970.00
1,845.70
1,921.90
1,833.90
1,868.10
2,198.30
capacity contribution of 3,430.33 MW. 1,500.00
1,000.00
Hydropower plants accounted for a power generation capacity of 500.00
110 MW. Besides, 295.22 MW of installed power generation 0.00
2008-09
2009-10
2010-11
2011-12
2012-13
2013-14
2014-15
2015-16
2016-17
2017-18*
capacity came from renewable sources.
Power Supply in Bihar
Peak
Peak availability Deficit Deficit
Year demand
(MW) (MW) (%)
(MW)
2013-14 3,000 2,335 665 22.0
2014-15 3,500 2,831 669 19.0
2015-16 4112 3459 653 15.6
2017-18^ 4,521 4,515 6 0.1
Source: Central Electricity Authority, Bihar Economic Survey 2014-15, * - data upto January 2018, ^ - upto January 2018
21 BIHAR For updated information, please visit www.ibef.orgPHYSICAL INFRASTRUCTURE – POWER…(2/3)
The BSEB is a vertically integrated agency & is responsible for Forecast of Annual Requirement of Energy for Rural & Urban
generation, transmission & distribution of electricity in Bihar. As of households (in MU)
2015, BSPTCL operates a transmission network of 6,182 Km of 132
Household category 2016-17 2017-18 2018-19
K.V. Lines & 1,663 Km of 220 K.V. lines & 75 Km of 400 K.V. Line as
well as 97 operational EHV sub- stations with 7,360 MVA Existing electrified household 6,807 7,542 8,278
transformation capacity.
Unelectrified households when
5,525 9,158 13,557
In August 2015, NTPC planned to set up Kajra TPP 1320 MW, a new electrified
power project in Bihar. This would be undertaken as a joint venture
New household when electrified 1,246 2,150 3,252
of NTPC with the state government. However, during a review
meeting in August 2017, it was decided that a solar power plant will Total domestic requirement 13,578 18,850 25,087
be set up on the land acquired for this proposed project at Kajra,
Consumers other than domestic
instead of the thermal power plant. 7,760 9,312 11,175
(growing annually at 20%)
In January 2017, NTPC at Nabinagar, has started commercial New agricultural connections 2,739 4,888 7,573
operation of its 1st unit of 250 MW of Bhartiya Rail Bijlee Company
Ltd., thereby increasing its capacity to 46,178 MW. Total 24,077 33,050 43,835
In June 2017, a student studying in 12th grade from Model High
School in Naugachia town of Bhagalpur district, Bihar invented an Forecast of Peak Load and Energy Requirement
eco-friendly way of producing electricity from banana stems at a
national programme “Innovation in Science Pursuit for Inspired Peak load Energy requirement
Research (INSPIRE)“, implemented by the Department of Science & Year
(MW) (MU)
Technology.
2016-17 5,108 29,539
Note: TPP – thermal power plant
Source: Central Electricity Authority, Bihar Economic Survey 2015-16 Bihar State Power Holding Company, GOB BSEB - Bihar State Electricity Board
22 BIHAR For updated information, please visit www.ibef.orgPHYSICAL INFRASTRUCTURE – POWER…(3/3)
The peak load value in the state reached 3,459 MW in October 2015. Forecasted capacity expansion
Further, the construction of 2 new units of 195 MW each is under
process in the state, as per the budget 2016-17.
Household category 2016-17 2017-18 2018-19
The number of grid sub-stations in the state increased to 98, which
State thermal 720 720 720
led to increase in power evacuation potential of transmission
systems. State small hydro 88 88 208
Ashoka Buildcon has been awarded 5 power projects worth US$ Central generating stations
3,346.50 3,561.20 3,722.40
145.13 million in Bihar. The North & South Bihar Power Distribution thermal
Co Ltd., authorised the letter of intent for 5 districts, namely, West Central generating stations
469.53 1,344.53 1,344.53
Champaran, Sitamahri, Sasram, Munger & Patna, for carrying out hydro
rural electrification work in the state. The projects will be executed
Ipps projects (case1) 460 460 960
under the Deendayal Upadhyay Gram Jyoti Yojna.
JV/partnership (thermal) 584 1,500 2,873
As of December 2017, all 39,073 villages of Bihar have been
electrified. NCE/RNES 248 398 398
In January 2017, Bihar division of NTPC began commercial Total 5,916.03 8,071.73 10,225.93
operation of the first unit of 250 MW of Bharatiya Rail Bijlee
Company Ltd.
Source: Central Electricity Authority, Bihar Economic survey 2015-16, Bihar State Power Holding Company, GOB BSEB - Bihar State Electricity Board NCE = Non-Conventional Energy;
RNES = Renewable Energy Source
23 BIHAR For updated information, please visit www.ibef.orgPHYSICAL INFRASTRUCTURE – TELECOM (1/2)
According to Telecom Regulatory Authority of India (TRAI), Bihar Telecom Infrastructure (As of December 2017)
had nearly 84.29 million wireless subscribers and 271,606 wire-line
subscribers, as of December 2017. Wireless subscribers 84,288,848
The tele-density in the state stood at 60.22%, as of December 2017 Wireline subscribers 271,606
& as of March 2017, the state had 9,037 post offices. (1)
Internet subscribers 22,750,000
By the end of December 2017, 12,316,580 subscribers had
Tele density (in%) 60.22
submitted requests for mobile number portability in Bihar.
As of March 2017, Megasoft Limited, a BSE-listed managed service Performance status of BharatNet Project
company, secured a cloud enabled solution and services contract, (As of November 2017)
leased by the Bihar State Electronics Development Corporation
No. of GPs in Phase-I 5,202
(BELTRON)
Pipe laid (km) 12,971
Cable laid (km) 13,007
GPs for which cable laid 4,754
Postal facilities (As of March 2017)
Departmental Head Post Offices 32
Departmental Sub Post Offices 1,023
Branch Post Offices 7,982
Total Post Offices 9,037
Source: Telecom Regulatory Authority of India (1) As of September 2017
24 BIHAR For updated information, please visit www.ibef.orgPHYSICAL INFRASTRUCTURE – TELECOM (2/2)
Postal Traffic (2015-16)
Registered (‘000) 4,902
Unregistered (crore) 7.34
Speed Post (‘000) 9,707.9
International Speed Post (‘000) 0.5
Foreign Postal Unregistered (‘000) 1,665.9
(i) To Foreign Counters (‘000) 1,143.0
(ii) From Foreign Counters (‘000) 1,002.9
25 BIHAR For updated information, please visit www.ibef.orgDEVELOPMENT PROJECTS: URBAN INFRASTRUCTURE
Non metro markets like Patna & other tier II cities have grown rapidly in regard to consumption, thus becoming main target markets,
posing a huge potential of transforming themselves into new business centres in comparison with metro cities.
Urban Infrastructure in Bihar
Scheme Estimated cost US$ million
Solid Waste Management for Danapur, Khagaul and Phulwari 1.92
Khagaul Water Supply Scheme 2.18
Danapur Water Supply Scheme 11.44
Phulwarisharif Water Supply Scheme 4.09
Patna Water Supply Scheme 70.83
Solid Waste Management for Patna 6.13
Purchase of buses for Patna Urban Transport 6.62
Bodhgaya Water Supply Scheme 5.56
Bodhgaya Sewerage Scheme 15.92
Purchase of buses for Bodhgaya Urban Transport 1.12
Source: JNNURM, Ministry of Urban Development, Government of India, Bihar Economic Survey –2014-15, Department of Urban Development and Housing, GOB , JNNURM - Jawaharlal
Nehru National Urban Renewal Mission
26 BIHAR For updated information, please visit www.ibef.orgDEVELOPMENT PROJECTS: KEY PUBLIC-PRIVATE
PARTNERSHIP (PPP) PROJECTS
Project name Sector PPP type Project cost (US$ million) Stage
Khagaria-Bakhtiarpur section Roads BOT 355.4 Under bidding
Bridge across river Ganga connecting Bakhtiarpur-
Roads BOT-Toll 313.3 Construction
Shahpur Patori
Hajipur-Muzaffarpur Roads BOT-Annuity 196.0 Construction
Chappra-Hajipur Roads BOT-Annuity 171.0 Construction
Khagaria Purnea section Roads BOT -Annuity 138.5 Construction
Kosi Bridge Project Roads BOT-Annuity 90.9 Construction
Mokama-Munger Roads BOT-Annuity 74.3 Construction
Forbesganj-Jogbani Roads BOT-Annuity 15.6 Construction
Development of a new five star hotel at the site of
Tourism DBFOT 14.4 Under bidding
Hotel Kautilya Vihar at Patna
Development of a four star hotel at the site of
Tourism DBFOT 6.2 Under bidding
Gautam Vihar at Rajgir
Build-Operate-Transfer
Mokama-Munger NH-80 Road Project Transport 53.7 Operational
(BOT) Annuity
Build-Operate-Transfer
Road Upgradation (Purnea-Khagaria) Project Transport Not Available Operational
(BOT) Annuity
Source: Ministry of Finance, Government of India BOT: Build-Operate-Transfer, DBFOT: Design-Build-Finance-Operate-Transfer
27 BIHAR For updated information, please visit www.ibef.orgSOCIAL INFRASTRUCTURE – EDUCATION…(1/2)
The literacy rate of the state was recorded as 61.8%. Male literacy rate in the Education infrastructure (2015)
state is 71.2% and female literacy rate is 51.5%. In the 2016-17 budget, an
Universities: 22 (Out of which 21 are traditional and 1
amount of US$ 3.48 billion has been allotted for education, sports, art &
open)
culture sectors. In addition, the state allocated a sum of US$ 160.84 million
under capital outlay for the development of these sectors. Government colleges: 276
The total number of students enrolled in primary & upper primary (up to class Engineering/technical colleges: 23
VIII) schools rose to 21.6 million in 2014-15 from 17.7 million in 2007-08. The Medical colleges: 17
enrolment of girls in the state is progressing, with the rate of re-enrolment of
Local body colleges: 468
girls increasing at a faster rate than that of the boys. However, the dropout
rates have witnessed a decline over the past years. Teacher training colleges: 60
The state’s budget expenditure on the education sector has witnessed a
decline of 4.13%. In 2015-16, education expenditure in the state was US$ Reputed technical institutes in Bihar
3.63 billion, which decreased to US$ 3.48 billion in 2015-16. Development of 6 Indian Institute of Technology, Patna
institutions analogous to AIIMS are proposed by the central government at an
amount of around US$ 303.7 million, of which, one has been developed in National Institute of Technology, Patna
Patna, Bihar. National Institute of Fashion Technology, Patna
The prestigious IIT was established in Patna in August 2008. The institute
offers B.Tech programmes in 3 disciplines: Computer Science & Engineering, Reputed medical institutes in Bihar
Electrical Engineering & Mechanical Engineering. PhD programmes are
Indira Gandhi Institute of Medical Sciences, Patna
offered in Engineering, Science & Humanities & Social Sciences.
Jawaharlal Nehru Medical College, Bhagalpur
In March 2017, the state government passed the Bihar Private Universities
(Amendment) Bill, 2017, that aims at relaxing norms to open a private Patna Medical College, Patna
university.
Source: Economic Survey of Bihar 2015-16, Medical Council of India, University Grants Commission, Bihar Government Budget 2016-17 IIT - Indian Institute of Technology
28 BIHAR For updated information, please visit www.ibef.orgSOCIAL INFRASTRUCTURE – EDUCATION…(2/2)
The state government is coming up with various initiatives for Manav Vikas Mission (MVM) (2013-17), has set the following targets
increasing employment prospects in the state under the Bihar Skill & time frames for secondary as well as for higher education &
Development Mission. The project aims at upgrading skills of 10 literacy:
million youth in the state by 2017. The scheme has been allotted a
budget of US$ 2.9 million. In addition, 5 private universities are also Indicators Target 2016-17
being set up in the state.
85% for children of
Gross Enrolment Ratio (GER) of Class 9th
Primary, Secondary and Higher Education: all categories
Rahstriya Madhyamik Shiksha Abhiyan (RMSA): This scheme is All Girls - 7,15,000
No. of girls of SC/ST/EBC/minorities passing
sponsored by the central government & aims at improving the quality SC Girls - 92,000
class 10th
& access of secondary education, so that by 2017, the gross ST Girls - 7,000
enrolment ratio & by 2020, the universal retention would be more Gender ratio of candidates appearing in class
52:48
than 90%. In 2014, an amount of US$ 1.37 billion was approved 10th Board Exam
under RMSA.
Pupil Teacher Ratio (PTR) - Secondary/higher
In order to increase the number of residential schools for SC/ST secondary (a teacher for every group of 60 60:1
students in the state, an amount of US$ 2.67 million will be spent by students in each subject)
the government. These schools will have an additional capacity of Gross Enrolment Ratio (GER) in higher
560 students. 30%
education
In the year 2014-15, an amount of US$ 0.04 million was sanctioned
in order to benefit 1,550 students who aimed at acquiring technical
education.
In March 2017, on the occasion of Bihar Diwas, the Bihar
government launched an ambitious programme of facilitating the
colleges and universities of Bihar with free Wi-Fi.
Source: Economic Survey of Bihar 2015-16 Bihar Report Card 2015
29 BIHAR For updated information, please visit www.ibef.orgSOCIAL INFRASTRUCTURE – HEALTH…(1/2)
As of February 2018, the health centres under various categories Health indicators (2017-18, up to September 2017)
had reached 12,814 in the state, of which 2,079 are primary health
centres and 10,490 are sub centres. There were 134 district Average Number of outpatient visits per day^ 339
hospitals, 67 community health centres and 44 sub-district hospitals (1)
Birth rate 26.8
in the state.
(1)
Death rate 6.0
In 2016-17, the total budgeted expenditure for health services in the
(2)
state was US$ 1.17 billion. The total capital outlay for the sector is Infant mortality rate 38
US$ 141.26 million for 2016-17.
Life expectancy at birth (years)
The state government is aiming to increase the number of 1st
Referral Units from 60 to 100 during 2016-17.
Male (2010-14) 67.8
Government initiatives in the health sector Female (2010-14) 68.4
Increase in sanctioned manpower in departments such as medical,
public health and family welfare. Health infrastructure (2016)
Higher level of personnel appointments and training. District hospitals 134
Involving private sector in support services related to cleaning,
Community Health Centres 67
pathology and radiology.
Sub district hospitals 44
Free drug distribution and indoor treatment
Primary health centres 2,079
Sub centres 10,490
Source: Bihar, 2014-15, Sample Registration System (SRS) Bulletin, State Budget 2015-16, (1) Per thousand persons, (2) Per thousand live births, ^ - upto September 2016
30 BIHAR For updated information, please visit www.ibef.orgSOCIAL INFRASTRUCTURE – HEALTH…(2/2)
Till 2021, a total of 23 medical universities, 9 nursing colleges, 38 GNM and 101 ANM schools are planned to be established in the state, under
the government & private sector.
In order to improve the medical knowledge & develop super speciality facilities in the state, the Government of Bihar is working towards
implementation of Bihar Health Service Investment Incentive Policy.
New Interventions in Health Sector (2014)
Introduction of HMS (Hospital Management System) in Indira Gandhi Institute of Medical Science (IGIMS), 6 district hospitals of the state & in 6
Medical Colleges & Hospitals
MCTS (Mother and Child Tracking System) implementation in order to reduce mortality rates of mother and child
HRIS (Human Resource Information System) utilization for providing decisions in issues related to human resources
‘Under the Sanjivani Programme, OPD Registration, Radiology/Pathology & Drug Distribution would be provided on-line. Under the same
program, development of new modules is done for doctors attendance, drug inventory, patient diagnosis information, bed availability & service
availability
The government plans to open a new dental college at Paaithna, Rahui (Nalanda)
Six super-speciality departments to be established for neurology, nephrology, cardiology, neuro surgery, geriatrics & radio therapy. Posts in 6
medical colleges would be created. The colleges include - Patna Medical College Hospital (Patna), Sri Krishna Medical College (Muzaffarpur),
Nalanda Medical College Hospital (Patna), Jawahar Lal Nehru Medical College (Bhagalpur), Darbhanga Medical College Hospital (Darbhanga) &
Anugrah Narayan Magadh Medical College Hospital (Gaya)
Source: Bihar Report Card 2015, State Budget 2016-17
31 BIHAR For updated information, please visit www.ibef.orgCULTURAL INFRASTRUCTURE…(1/2)
According to the ‘Sports Policy, 2007’, the state government is Major museums in Bihar
undertaking various initiatives to promote sports in the state by
Patna Museum, Patna
augmenting sports infrastructure, providing coaching facilities and
supporting promising players. The state government is planning to Chandra Dhari Museum, Darbhanga
develop outdoor stadiums in 534 blocks of the state that come under Gaya Museum, Gaya
Chief Minister Development Scheme. However, the permission for
setting up 239 stadiums has been given, out of which 80 stadiums Nardaha Museum, Nawada
have already been developed in the state. Bhagalpur Museum, Bhagalpur
Moreover, in accordance to international standards, a new science Maharaja Lakshmishwar Sing Museum, Darbhanga
museum is being set up in Patna.
Sitaram Upadhyay Museum, Buxar
As per Economic Survey 2016-17, major initiatives taken by the state
Bihar Sharif Museum, Nalanda
government for the development of cultural infrastructure in the state
are as follows – Chandra Sekhar Singh Museum, Jamui
• Out of the target of 5,045 community hall-cum-worksheds, Ramchandra Shahi Museum, Muzaffarpur
construction has been completed for 2,732 units with an Jananayak Karpoori Thakur Memorial Museum, Deshratna Marg,
expenditure of Rs 243.5 crore (US$ 36.29 million), for promoting Patna
cultural as well as sports development of Mahadalits community
of in the state. Chapra Museum, Chapra
• Implementation of Bihar State Women Empowerment Policy,
The state government is coming up with new initiatives for
2015, which aims at abolishing the discrimination based on
encouraging and safeguarding various forms of folk music and
gender to confiscate the difficulties being faced by women in
dances in the state.
accessing the resources, is being planned.
At an amount of US$ 74.85 million, the work on manufacturing of an
International Convention Centre is under progress.
Source: Economic Survey 2015-16,Youth, Art & Culture Department, Government of Bihar
32 BIHAR For updated information, please visit www.ibef.orgCULTURAL INFRASTRUCTURE…(2/2)
The state government is taking various actions to setup a Youth Welfare Board for the upliftment of youth in the state.
An international conclave on ‘Experience Buddhism - In the land of its origin’ was organised in February 2010 to give a major thrust to cultural
tourism and explore the tourism potential related to the Buddhist circuits in India, especially Bihar.
The directorates under Youth, Art & Culture Department are the Directorate of Museum, Directorate of Archaeology, Directorate of Cultural Affairs
& Directorate of Student & Youth Welfare.
The autonomous bodies under Youth, Art & Culture Department are Bihar State Sports Authority, Bihar Sangeet Natak Academy & Bihar Lalit
Kala Academy.
International Stadiums at block level Play Indoor Stadium and Sports
Year
stadiums (nos.) (nos.) fields (nos.) stadiums (nos.) coaching centres (nos.) academies (nos.)
Target Achievement Target Achievement
2014-15 1 100 79 2206 4 15 15 -
2015-16 - 134 - 2200 3 14 - -
2016-17 - - - 2000 - - - -
Total 1 234 79 6406 7 29 15 -
Source: Youth, Art & Culture Department, Government of Bihar, Bihar Report Card. 2015
33 BIHAR For updated information, please visit www.ibef.orgINDUSTRIAL INFRASTRUCTURE … (1/2)
The central government of India approved the formation of an AKICDC (Amritsar-Kolkata Industrial Corridor Development Corporation),
development work of which started in 2014. The BIADA is responsible for promoting and assisting rapid development of industries in the industrial
areas and estates.
Operations of BIADA are divided into 4 regions – Patna, Muzaffarpur, Darbhanga, Bhagalpur – to facilitate quick services to entrepreneurs. The
total developed land by BIADA is of 5,930.81 acres; of which industrial units have been allotted 3,370.65 acres (56.8%). BIADA of Patna has
attained the maximum share of 3,144.82 acres during 2014-15.
As of November 2015, the Consumer Price Index for industrial workers was recorded to be 287. Further, there has also been an increase in the
number of micro, small & medium enterprises in the state.
In May 2017, Ultra Tech Cement started manufacturing slag cement in its 0.3 mtpa manufacturing capacity at Patliptura, Bihar. After this move,
the cement manufacturing capacity of the company stands at 70.6 mtpa.
Acquired land Land reserved for infrastructure, Allotted land Total vacant land No of running
Region
(acre) administrative block, road etc. (acre) (acre) (acre) units
Patna 3,144.82 252.51 2,127.65 51.42 656
Bhagalpur 1,347.29 101.42 415.84 16.6 248
Darbhanga 411.96 76.67 305.51 29.78 324
Muzaffarpur 1,026.74 183.22 521.65 55.4 274
Source: Economic Survey of Bihar, 2015-16 BIADA - Bihar Industrial Area Development Authority
34 BIHAR For updated information, please visit www.ibef.orgINDUSTRIAL INFRASTRUCTURE … (2/2)
As per budget 2017-18, total capital outlay for the industry & minerals
is estimated to be US$ 145.29 million. Out of this outlay, US$ 24.30
million is for the village & small industries & US$ 3.91 million is for
non-ferrous mining & metallurgical.
Centres Industries
Major agricultural centre of trade, exporting grain,
sugarcane, sesame & medium-grained rice; has also
Patna
emerged as a manufacturing hub in Bihar, with the
highest number of industrial units.
Has the 2nd highest number of industrial units in the
Tirhut state; food/beverage processing & manufacturing units
located here.
Important trade centre for cloth; famous for exporting
Muzaffarpur
fruits, particularly mango & litchi.
Has major industrial units including those of Indian Oil
Corporation; capacity of the existing thermal power
Barauni
station has undergone major renovation &
modernisation.
Famous globally for tussar silk; trading of agricultural
produce & cloth is an important economic activity; other
Bhagalpur
major industries include rice, sugar milling & wool
weaving.
Gaya Major weaving centre; important tourist hub.
Main industries are paper, sugar & handloom;
Darbhanga Darbhanga city is noted for its trade in fish, mango & Source: Maps of India
makhana.
Source: Economic Survey of Bihar, 2015-16 Annual Financial Statement for the Government of Bihar 2016-17
35 BIHAR For updated information, please visit www.ibef.orgSMART CITIES
As of August 2017, 4 cities of Bihar namely, Bhagalpur, Bihar Sharif,
Patna & Muzaffarpur are to be developed as smart cities.
As of June 2015, along with the selected smart cities, 26 cities of
Bihar were selected for infrastructure development under AMRUT
scheme.
As on April 2017, under the AMRUT scheme, US$ 13.84 million were
sanctioned to the state of Bihar as a part of the approved central
share towards the projects.
During FY 2016-17, Biharsharif Nagar Nigam plans to provide water
supply connections to 60% of the population. The Nigam also plans
to achieve 90% coverage of toilets & cover draining network of Muzaffarpur
around 40% in the city.
Smart Cities in Bihar
Cities Population Area (sq km) Literacy rate Biharsharif Bhagalpur
Bhagalpur 412,209 2,569 63.14%
Biharsharif 297,268 23.5 74.80%
Muzaffarpur 396,590 3,172 83.08%
Patna 2,049,156 3202 83.37%
Source: Aranca Research Biharsharif Nagar Nigam
36 BIHAR For updated information, please visit www.ibef.orgKEY INDUSTRIES
Bihar’s natural resources & policy incentives support the agro- Key Industries in Bihar
based sector. Britannia Industries, Ramco Industries & Hindustan
Food and beverages
Petroleum are some of the promoters whose units were granted
approval. Rubber and plastics
Medium and small scale industries & micro & artisan enterprises Transport equipment
play a major role in terms of generating employment. A majority Chemicals
of the industries are located in Patna, Magadh, Tirhut & Munger.
Bhagalpur, Purnea & Darbhanga are the other major industrial Tobacco
centres. Textiles
In order to facilitate VAT reimbursement to different industrial Leather
units in the state, the commercial tax department approved an
Paper, printing & publishing
amount of US$ 111.73 million in 2014-15 and US$ 41.50 million
for 2015-16. Mines & minerals
For electricity tariff/AMG-MMG concessions, the Government of Dairy
Bihar sanctioned US$ 61.89 million in 2014-15 & US$ 22.37 Tea
million in 2015-16 to the Bihar State Power Holding Co. Ltd.
Sugar
As on June 2016, the State Investment Promotion Board (SIPB)
approved 2345 projects, with a capital investment of US$ 33.52 Tourism
billion. Health
Source: Economic Survey of Bihar, 2016-17, Bihar Report Card, 2015 Sugarcane Industries Department, Government of Bihar
37 BIHAR For updated information, please visit www.ibef.orgKEY INDUSTRIES – FOOD PROCESSING AND DAIRY
… (1/3)
Bihar is one of the largest producers of vegetables Food processing units (As of August 2016)
& fruits in the country, making it a suitable place
for setting up units in the food processing sector. Physical Progress Employment
The state is one of the leading producers of fruits Project (nos)
Total number Units in commercial
such as banana, mango, guava, litchi &
of units production
vegetables such as onion, tomato, potato and
eggplant in the country. Rice mills 174 120 6,438
Wheat milling 44 33 1,806
In 2016-17, total fruit production in Bihar was 4.27
million tonnes & total production of major Maize processing 43 32 2,120
vegetables was recorded to be 14.22 million Rural agri business centres
tonnes. 53 37 1,807
(RABCs)
Food processing is a priority sector for the state F&V processing 16 8 122
government.
Milk processing 9 6 586
• Up to 40% of the project cost for setting up
Makhana processing 4 2 70
food processing units is subsidised by the state
government. Honey processing 3 3 41
• A grant of up to 35% of the project cost, subject Biscuits manufacturing 12 8 1,946
to maximum of US$ 1 million, is provided in Edible oil manufacturing 10 9 2,001
case of an individual investor.
Ice Cream 7 4 203
Other projects 27 16 2,087
Food park 2 0 28,597
Total 407 278 48,404
Source: Economic Survey 2015-16, Bihar Report Card 2015
38 BIHAR For updated information, please visit www.ibef.orgKEY INDUSTRIES – FOOD PROCESSING AND DAIRY
… (2/3)
In March 2015, the government announced plans to establish a Milk procurement per functional dairy cooperative society
mega food park in Bihar. The food park was set up by Amarapali (2015-16) in kilo litres per day
Group. Currently, two units operate inside the food park with capacity
Patna 123.58
to process 175 Mt/month of corn flakes and 100 Mt corn grit.
At the end of August 2016, the state recorded an increase in the
Barauni 232.24
number of food processing units from 366 in 2014-15 to 407. Out of
these 407 units, 278 are operational in the state.
Muzaffarpur 100.60
The Food Park scheme has been declared to be the most admired
scheme by the Ministry of Food Processing Industry in the history of Samastipur 192.10
food processing in India.
Paddy, maize, fruits & vegetables, wheat and sugarcane are the Ara 106.20
major crops for which food processing units may come up under
Vision 2022. Bhagalpur 71.02
Various schemes under which the Directorate of Food Processing is
delivering special assistance to the sector are Integrated Gaya 30.19
Development project, food park scheme, cold storage scheme,
modernization scheme for established rice mills, etc. Ranchi Dairy 347.17
Purnea 42.03
Ranchi 347.17
Total 124.18
Source: Economic Survey of Bihar, 2016-17 COMFED, GOB
39 BIHAR For updated information, please visit www.ibef.orgKEY INDUSTRIES – FOOD PROCESSING AND DAIRY
… (3/3)
An increase of 3% was witnessed in the total daily collection of milk in comparison with the previous year.
Key players in Bihar’s food processing and dairy industry
COMPFED is an organised milk processing cooperative which collects milk through district level cooperative
unions, and processes and markets the same.
It supports members with interventions across technology, supply chain, marketing, training, etc.
Bihar State
COMPFED covers five districts directly and 26 districts through six district level cooperative unions.
Cooperative Milk
Producer’s Federation Around 11,000 women have been already trained under its training management program
(COMPFED)
Usher Agro Limited is one of the largest basic food grain (rice and wheat) processing companies in India. The
company established its rice processing mill in Buxar, Bihar in 2003.
The company's product list consists of rice, bran, wheat and husk which are sold under the brand name of ‘Rasoi
Raja’. During Q2 FY18, the company reported revenue of US$ 3.9 million.
Usher Agro Ltd
40 BIHAR For updated information, please visit www.ibef.orgKEY INDUSTRIES – CHEMICAL, OIL AND GAS … (1/2)
The major drivers of chemical, oil and gas industry in Bihar are proximity to sea ports (Kolkata and Haldia), availability of labour & the vast market
of eastern India. Petroleum & allied sectors remain large contributors to Bihar’s industrial value output as it has one of the largest public sector
refineries in the country under IOCL.
ONGC is carrying out exploration activities for petroleum & natural gas in an area of 2,537 sq km in Purnea basin. It also expects oil reservoirs in
Kishanganj & is likely to start drilling operations soon.
As of July 2015, a tender has been raised by GAIL India for establishing the sub-divisions of pipelines of length 236 km. As a part of reviving the
fertiliser units, the state government has proposed the laying of a pipeline of length 2,050 km in Bihar & Uttar Pradesh in the middle of 2015.
In the year 2014-15, a MOU was signed between Government of Bihar and Indian Oil Corporation (IOCL). This was undertaken as a step to
develop infrastructure of natural gas in the state, so as to meet energy requirements in domestic, industrial, commercial and transportation
sectors. In the year 2014-15, the estimated biogas production in Bihar stood at 537.02 lakh cu.m. The project is expected to be completed by early
2018.
The permission for investigating natural gas and petroleum in 2,227 sq km of area in Betiah district has been accorded to the Oil and Natural Gas
Corporation and Petrodine.
In 2015, the central government has promised to invest US$ 4.1 billion in oil and gas related projects of the state. Investments are directed
towards the construction of Jagdishpur-Haldia gas pipeline, whereas the Ministry of Petroleum & Natural Gas has decided to expand the capacity
of Barauni refinery to 9 million metric tonnes per annum (MMTPA) from 6 million metric tonnes per annum (MMTPA).
The Bihar Government in February 2017 passed a US$ 14.42 million ethanol project of Majhaulia Sugar Industries Pvt Ltd. The project aims to
take the advantage of revised ethanol off-take policy of the central government to encourage its blending with petrol.
The Barauni fertiliser unit of Hindustan Fertilizer Corporation (HFCL) in Bihar will start production in 2020-21.
Source: Economic Survey of Bihar 2014-15, News Articles ONGC - Oil and Natural Gas Corporation Limited Bihar Report Card, 2015
41 BIHAR For updated information, please visit www.ibef.orgKEY INDUSTRIES – CHEMICAL, OIL AND GAS … (2/2)
Key players in Bihar’s chemical, oil and gas industry
IOCL, India’s leading petroleum refining company, has a refinery at Barauni, which has an annual refining capacity
of 6 million metric tonnes. Total revenue of the company stood at US$ 20.42 billion in Q3 FY18.
Secondary processing facilities, such as a resid-fluidised catalytic cracker, diesel hydro-treating and a sulfur
recovery unit, have been added to the main refinery.
The 498-km long Haldia-Barauni Crude Oil Pipeline (HBCPL) receives crude oil at the Haldia oil jetty and
Indian Oil Corp Ltd
transports it to the Barauni refinery, and is scheduled to open three additional bottling plants.
(IOCL)
GIL was incorporated in 1963. The company has eight plants located across India and produces graphite
products, coke and power. In Q3 FY18, the company registered revenue of US$ 145.9 million.
The coke division of the company at Barauni manufactures calcined petroleum coke (CPC) and has an installed
capacity of 30,000 tonnes per annum.
Graphite India Ltd (GIL)
KREPL is a flagship company of Krishi Rasayan Group. Having five manufacturing units, the company is
considered as one of the major agro-chemical manufacturers. Total revenue of the Krishi Rasayan Group in 2016-
Krishi Rasayan Exports 17 was US$ 193.77 million.
Pvt Ltd (KREPL)
42 BIHAR For updated information, please visit www.ibef.orgYou can also read