Queensland's Waste Reduction and Recycling Strategy 2010-2020
←
→
Page content transcription
If your browser does not render page correctly, please read the page content below
Queensland’s Waste
                                                           Reduction and Recycling
                                                           Strategy 2010–2020

Tomorrow’s Queensland: strong, green, smart, healthy and fair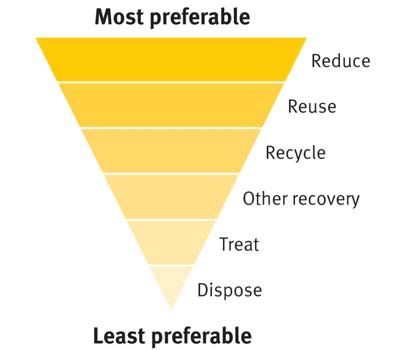
Prepared by:
Waste Reform Division
Department of Environment and Resource Management
© State of Queensland (Department of Environment and Resource Management) 2010

This document has been prepared with all due diligence and care, based on the best available information at the
time of publication. The department holds no responsibility for any errors or omissions within this document. Any
decisions made by other parties based on this document are solely the responsibility of those parties. Information
contained in this document is from a number of sources and, as such, does not necessarily represent government
or departmental policy.
If you need to access this document in a language other than English, please call the Translating and Interpreting
Service (TIS National) on 131 450 and ask them to telephone Library Services on +61 7 3224 8412.

This publication can be made available in alternative formats
(including large print and audiotape) on request for people with a vision
impairment. Contact (07) 322 48412 or email
.

For more information see .
#29558
December 2010
Minister’s foreword
Queensland is one of the largest generators of waste in Australia. We produce more than 32 million tonnes of it
every single year, which is the highest amount of waste per capita of any state. Worse still, Queensland is one of
the worst recyclers in Australia. While much of our waste is generated by heavy industry and is not recoverable, we
only recycle about a third of our recoverable waste. While householders have proven to be prudent kerbside
recyclers, Queensland is still too often choosing landfill over recycling, particularly in the business sector, and this
is a problem that is unsustainable.
If we do not tackle the problem seriously now, we will leave a devastating legacy for our children: more rubbish tips
encroaching on urban areas, increased rates for waste management and sky-rocketing greenhouse gas emissions
from landfill.
We all produce waste in our daily lives, and every year as our population increases, so does our waste generation.
This situation has serious long-term environmental, social and economic implications for the state. We lose industry
investment, job opportunities and regional market growth—while creating greenhouse gases and wasting valuable
and often non-renewable resources.
Considerable work is currently underway nationally to address waste and increase resource recovery. But there is
a lot more Queensland can do at a state level to catch up with the rest. The Queensland Government has set bold
targets for our state in waste management. We want Queensland to go from one of the worst recyclers in the
country to one of the best. We are also committed to tackling waste generation at the source, and aim to reduce
waste generation by 400 kilograms for every Queenslander by 2020. That equates to a total statewide reduction in
the generation of waste of more than two million tonnes.
To put our targets into perspective, Victoria has around 13 000 green jobs associated with waste. Queensland only
has 5000. We can close this gap with the right amount of investment and behavioural change in our business
community.
We will strive for a waste management system where recycling is the first option over landfill and more unwanted
materials are given a new life by someone else. We want more trash to become someone else’s treasure.
This requires action to avoid creating waste in the first place, and then to turn the waste we cannot avoid into
valued resources. It requires overdue reforms. The question we need to ask is simple: what do we need to do to
become a low-waste state?
In achieving this vision, we face some challenges including distance to processing and recycling markets and
economies of scale for regional Queensland. The reforms described in this strategy include new legislation, an
industry waste disposal levy and a comprehensive set of programs designed to discourage unnecessary disposal.
It aims to prevent Queensland from becoming Australia’s dumping ground, and encourage industry investment in
resource recovery infrastructure, market development and green jobs.
The draft strategy presented the case for change and the many challenges that face us in making the necessary
changes. It also proposed goals and targets for Queensland and a suite of program areas to help deliver these
changes. Through consultation on the draft, these proposals have assisted in shaping a strategy that will help us
meet current and future resource and environmental challenges. The reforms represent a new future in waste
management and resource efficiency for Queensland. Through a mix of behavioural changes, economic incentives,
improved infrastructure and programs, partnerships and smarter technologies, the strategy will deliver the vision of
a low-waste state.
In the end, we cannot change the fact that people produce waste. What we can change is how much we produce,
how we value the resource, and how we manage it.
This strategy places reducing waste—and better managing the waste we do produce—at the core of government
policy to protect the environment and achieve a more sustainable future for Queensland.

The Honourable Kate Jones MP
Minister for Climate Change and Sustainability

                                                          -i-
Table of contents
Executive summary................................................................................................................................. iii
The case for change: a low-waste future for Queensland .................................................................... 1
The vision of a low-waste Queensland .....................................................................................................................1
Why is a strategy needed?........................................................................................................................................1
Why waste must be reduced?...................................................................................................................................2
The challenge for Queensland ..................................................................................................................................3
Developing the strategy ............................................................................................................................................4
Strategy principles.....................................................................................................................................................5
Strategy goals ...........................................................................................................................................................5
A five-part strategy................................................................................................................................... 6
1. Targets and priorities .......................................................................................................................... 6
Targets ......................................................................................................................................................................6
Measuring progress ..................................................................................................................................................7
Priority areas .............................................................................................................................................................9
2. Price signal – waste disposal levy ................................................................................................... 11
3. Stronger legislation ........................................................................................................................... 12
4. Programs and actions ....................................................................................................................... 13
5. Partnerships to deliver change ........................................................................................................ 16
Glossary .................................................................................................................................................. 18
Supplementary paper 1: The challenges for waste reduction and resource recovery in
Queensland ............................................................................................................................................. 19
Supplementary paper 2: The waste and resource management hierarchy ...................................... 23
Supplementary paper 3: Identifying priority products........................................................................ 25
- ii -Executive summary
Queensland produces an ever-increasing and unsustainable amount of waste. A new, sustainable approach is
needed to better use the state’s resources and protect the environment into the future.
This strategy is a 10-year plan to achieve the government’s vision of a low-waste Queensland.
The strategy is underpinned by the waste and resource management hierarchy. This internationally recognised
framework for managing waste generation and disposal describes the preferred order for managing wastes and
resources. The hierarchy places waste reduction as the preferred option, followed by reuse, through recycling and
recovery options to disposal as the least preferred approach. Other important guiding principles that inform the
strategy are resource efficiency, sustainability, engagement, and capacity building.
Based on these principles, the strategy’s broad goals are to:
• reduce waste
• optimise recovery and recycling
• develop sustainable waste industries and jobs.
To achieve these goals the strategy adopts a five-part approach:
1. Clear targets and priorities
2. Setting a price signal – the waste disposal levy
3. Stronger regulation
4. New programs and investment strategies
5. Partnering for change
1. The strategy identifies priority products and sectors. Priorities have been identified according to criteria
relating to resource efficiency and the economic and social impacts of disposing of these products at the end of
their life.
A priority product statement will be prepared to help guide decisions about future funding and actions, and the
voluntary and mandatory measures needed to improve resource recovery for priority end-of-life products and waste
materials. Decision-making is transparent in this process, helping Queensland to better support national ‘product
stewardship’ approaches (such as take-back schemes) as well as adopt state-based action.
The strategy sets clear targets for reducing waste, and explains how the targets will be monitored and reported.
Over the next decade Queensland will:
• reduce waste to landfill by 50 per cent
• reduce landfill gas emissions by 50 per cent
• increase the recovery and recycling of resources across all waste streams
• reduce generation of waste
• reduce the total amount of, and the environmental impacts from, litter and illegal dumping.
2. The Queensland Government will introduce a waste disposal levy as a price signal to change disposal
behaviour. A levy is a price charged in addition to the normal gate fee at waste disposal facilities. The levy will
provide:
• a price signal to encourage waste generators to reduce waste generation and disposal
• reduce the disposal of interstate waste in Queensland
• incentive for industry investment in resource recovery infrastructure
• funding for programs to improve waste reduction and resource recovery practices.
A levy of $35 per tonne applies to commercial and industrial, construction and demolition waste and contaminated
and acid sulfate soils. Lower-hazard regulated waste is levied at $50 per tonne and higher-hazard regulated waste
at $150 per tonne. Levy rates are linked to the Consumer Price Index. Municipal solid waste has no levy applied.
- iii -3. Queensland’s outdated legislative framework will be reformed to support the goals of the strategy in
promoting waste reduction and resource recovery and developing sustainable waste and resource recovery
industries. The legislation will reflect modern waste and resource management practices and an awareness of the
need for Queensland to reduce its ecological footprint.
A new Act will provide the head of power necessary to improve waste and resource management in Queensland.
New regulation will support the Act, strengthening and co-ordinating compliance and enforcement. Stronger
regulation of illegal activities will ensure fairness and encourage industry investment.
4. The strategy outlines the priority program areas for the first four years. The actions reflect imperatives
identified by stakeholders and government in the consultation process, and will build on achievements to date by
local government, business and households. Successful existing programs will be enhanced and some programs
from other states adopted to help provide a nationally consistent approach and help meet Queensland’s priorities.
The strategy outlines program areas for households, the waste and resource recovery industry, general business
and industry, local government, and state government. A four-year business plan will be released in 2011 that
describes program details and funding.
5. The strategy outlines the crucial partnerships and the roles and responsibilities of all Queenslanders.
Effective partnerships between state government, industry, local government and the community are critical to
achieving the strategy’s goals and targets.
- iv -The case for change: a low-waste future for Queensland
The vision of a low-waste Queensland
Our current rates of waste generation, resource wastage and disposal are unsustainable.
Moving towards a more resource-efficient society will reduce the environmental, social and economic impact of
waste, and place a higher value on recovering resources previously considered waste. The strategy is designed to
drive a decade of significant improvement in managing Queensland’s waste and recovering resources.
The Queensland Government is committed to a sustainable Queensland. This means a low-waste Queensland
where there is less wasteful generation, where resources are used more efficiently, and where disposal is seen as
a last – not a first – option.
Why is a strategy needed?
The strategy will provide the vision, and the means, to achieve a low-waste Queensland. It sets clear targets,
which, supported by a strong legislative framework and a price signal to discourage disposal, underpin the
behavioural change required to reduce waste generation and disposal. The strategy will drive a decade of
significant improvement in waste and resource management in Queensland, and will make the most of the
economic opportunities arising from optimising resource efficiency.
Implementing this strategy will progressively shift the emphasis from recycling toward a culture where waste
reduction is an accepted lifestyle choice. This will become the usual way of doing business for Queenslanders,
while still recognising the need for flexibility based on local and regional economic, social and environmental
conditions.
In Toward Q2: Tomorrow’s Queensland the Queensland Government addresses current and future challenges for
the state, and sets a target to cut Queenslanders' carbon footprint by a third by 2020. The strategy will help meet
this goal by reducing household waste to landfill.
The strategy will direct the development of the first four-year business plan, which will detail the programs to help to
achieve the strategy’s goals and targets. The diagram below illustrates these savings, compared with the
unwelcome outcomes of continuing with business-as-usual.
Annual waste landfilled - Business-as-usual compared to the strategy Annual waste recovered - Business-as-usual compared to the strategy
Million Million
tonnes tonnes
10 8
8
6
6
4
4
2 2
0
0
2 3 4 5 6 7 8 9 0
-1 -1 -1 -1 -1 -1 -1 -1 -2
11 12 13 14 15 16 17 18 19
2
3
4
5
6
7
8
9
0
-1
-1
-1
-1
-1
-1
-1
-1
-2
20 20 20 20 20 20 20 20 20
11
12
13
14
15
16
17
18
19
20
20
20
20
20
20
20
20
20
Business-as-usual - Landfilled Strategy - Landfilled Business-as-usual - Recovered Strategy - Recovered
Figure 2 – Annual resource recovery and waste to landfill: business-as-usual compared to the strategy.
Implementing this strategy will move Queensland towards:
• cutting waste to landfill
• reducing waste generation, so that it does not exceed population growth
• increased industry investment resulting in an expansion of new green jobs
-1-• reducing the total amount of, and the environmental impacts from, littering and illegal dumping
• boosting recycling rates across all sectors
• cutting green and organic waste to landfill
• reducing greenhouse gas emissions from waste
• increasing the number of businesses participating in waste reduction and recycling
• strong regional collaboration to identify and implement local solutions to local issues
• an effective and responsive land-use planning system for waste management infrastructure and activities
• accurate and timely information to help us make informed waste management and resource recovery decisions
• Queensland Government departments and local governments improving waste , recycling and green
procurement.
Why waste must be reduced?
1. Resources are finite: every year in Queensland, millions of dollars are wasted burying valuable and finite
resources. Waste is an inefficient use of natural resources, water, energy, money and land.
2. Waste production has environmental impacts: producing waste has environmental impacts from extracting
resources right through to disposal in landfill.
3 Disposal has environmental impacts: even disposal of wastes into well-designed and managed landfills can
create environmental impacts, from transporting the waste for disposal, to potential leachate, odour and
greenhouse gas emission impacts.
4. Disposal has social impacts: the more waste that is created and unnecessarily disposed of, the faster landfill
capacity is used. This puts pressure on local councils to find suitable sites for new disposal facilities. For some
local governments, finding suitable sites that won’t impact on nearby land uses, such as residential areas, is
increasingly difficult and expensive, leading to higher costs for ratepayers.
5. Disposal has economic impacts: inefficient management of finite resources also means lost opportunities for
business investment and job creation. Queensland is losing valuable investment and job creation opportunities in
the resource recovery sector to other states where there are clear incentives to reuse and recycle.
6. Waste is increasing: the amount of waste
generated in Queensland is steadily growing and this Millions
10
trend will continue unless action is taken. By 2026,
Queensland’s population is projected to reach close 9
to six million people, a 30 per cent increase from 8
2006. This growth will put increasing pressure on 7
Queensland’s available space and future 6
infrastructure planning. While much of this growth will Disposed
Tonnes 5
occur in south-east Queensland, regional pressures Recovered
Generated
will also be experienced. 4
3
As Queensland’s population grows and standards of
2
living increases, more goods are consumed and
more waste is produced. Rising disposable income, 1
convenience-led lifestyles, unsustainable 0
MSW C&I C&D Regulated TOTAL
consumption, changing attitudes and fashions, and Wastes
design for obsolescence all contribute to this trend.
Queensland produces a large volume of waste Figure 1 – 2008 waste generation, recycling and disposal.
every year. In 2008, an estimated 32.6 million
tonnes was reported being generated from commercial and industrial, construction and demolition, and household
activities. This includes data collected on waste that is classified for indefinite storage—such as fly ash from
electricity generation—which amounts to 22.3 million tonnes. Queensland households and businesses generated
the remaining 10.3 million tonnes.
The trend over the past five years has been for a significant increase in waste generation and disposal. The data
shows that domestic waste generation in 2007–08 was 40 per cent higher than in 2003–04, but the population grew
by only 10 per cent.
-2-In 2007–08, more than 60 per cent of the waste generated by households and businesses was disposed to landfill.
In 2008, each Queenslander generated around 2.4 tonnes of waste from the three main waste streams—
commercial and industrial (C&I), construction and demolition (C&D) waste and municipal solid waste (MSW). This
is an increase of around 20 per cent from 2007 generation estimates.
7. Community demand: there is an increasing
community desire to recycle more, beyond the current Benefits of recycling
recycling services provided by many local
governments. There is growing community and • 95 per cent less energy is needed to make
business interest in being able to recycle end-of-life aluminium from used cans than from the raw
products such as televisions and computers, batteries material, bauxite.
and fluorescent lamps. There is also increasing
• Every aluminium can that is recycled saves enough
community pressure for stronger government
electricity to light a 20-watt energy-efficient bulb for
intervention and leadership to encourage business and
17.5 hours, or a TV for three hours.
industry to take action to reduce unnecessary
packaging, increase recyclability of products and • The energy saved from recycling one glass bottle is
provide opportunities for consumers to recycle. enough to light a 20-watt energy-efficient bulb for 20
hours.
8. National trends: the National Waste Policy,
released in November 2009, and the national • It also reduces air pollution by 20 per cent and water
agreement for Commonwealth product stewardship pollution by 50 per cent.
legislation, provide a foundation for take-back or
producer responsibility schemes to reduce the impacts • Recycling one tonne of glass saves 1.1 tonnes of
of end-of-life products. raw materials (sand, limestone, soda ash), and
reduces energy use by 30 per cent.
Most other states have long-term strategies supported
by waste levies to discourage disposal and encourage • Adding used steel to new steel production reduces
greater recycling. These levies range from around $28 energy use by 25 per cent, air pollution by almost 90
to $70 per tonne for general waste disposed, making per cent, water pollution by 76 per cent, mining
waste disposal in Queensland the cheapest. wastes by 97 per cent and water usage by 40 per
cent.
See Supplementary paper 1: The challenges for waste
reduction and resource recovery in Queensland, for
more about the Queensland context.
The challenge for Queensland
Everyday activities create pressure on the environment.
By creating less waste, impacts on the Earth can be reduced and social and economic benefits gained; in effect,
using resources more efficiently to do more with less.
Waste generation in Queensland is increasing rapidly. Between 2003–04 and 2007–08 waste generation grew by
40 per cent. Over the same period, the population increased by 10 per cent and retail turnover increased by 21 per
cent.
One of the significant challenges to tackle is the perception that nothing is wrong with the way things are done now.
If good management is measured in terms of providing efficient and cost-effective collection and disposal services,
then waste in Queensland is managed relatively well. For most Queenslanders, waste management simply means
putting their waste in a bin that is removed with a minimum of fuss.
Unlike community resources such as water, there is never a lack of waste services and, for the most part, no lack
of infrastructure to treat and dispose of the waste. Because waste is removed efficiently, there is no real
understanding that too much is being generated or that maintaining the level of services and infrastructure required
is difficult and expensive.
For households, waste management charges appear as a fixed amount on rates notices. In most cases, the charge
is the same, regardless of how much or little waste the householder generates. This means there is no immediate
imperative or incentive to take action and avoid generating waste, reduce the amount of waste discarded or even to
recycle more effectively.
There is also a perception that there are plenty of places to put waste in Queensland. Much of Queensland does
not have the high population densities and limited space for landfills that create difficulties for areas such as
Sydney and Melbourne.
-3-However, some south-east Queensland local governments are already grappling with rapidly filling landfills and
finding acceptable solutions to managing the waste that continues to be generated. Landfill capacity varies
between each local government area. Some local governments have significant landfill capacity remaining, while
other local governments only have a couple of years left, and limited opportunities to establish new sites. A
shortage of accessible facilities leads to increased road pressures as business travels further to dump waste.
Queensland is a huge state, and must find viable waste management and resource recovery solutions for its more
regional and remote areas. Island communities, in particular, have difficulty finding sustainable and economically
viable waste management solutions, due to small populations, limited transport options, significant transport and
logistics costs and planning issues, and limited storage space. Some communities, such as those in the Torres
Strait, also have quarantine issues to contend with when transporting waste and recyclables between islands and
the mainland.
A growing number of individuals and businesses are beginning to question current practices. For instance, people
are concerned about the potential environmental impact from disposing of end-of-life products that contain
potentially hazardous chemicals, such as mercury, lead and cadmium.
People are also concerned about the wasted resources when these items are disposed of. Many of these
resources are finite and their extraction has the potential to cause significant environmental damage. There is also
growing community interest in being able to take stronger action to prevent litter and illegal dumping activities.
The community is increasingly concerned about the local impacts of siting landfills and other waste management
and resource recovery facilities dealing in composting, concrete crushing and grinding, packaging materials
recovery facilities and transfer station operations. People are worried about the legacy of landfills and issues such
as landfill gas migrating into houses near landfills. Communities are becoming much less tolerant of waste
management infrastructure close to households and other sensitive land uses.
The challenge in attempting to change behaviour before there is a commonly perceived need is creating the
understanding that while waste may not be a problem today, that doesn’t mean it won’t be a problem tomorrow.
The hazardous legacies of some past waste management and disposal practices are well documented, and
ongoing monitoring and clean-up comes at a high cost to governments and the community. It is important to start
doing something now to change the way people think about waste management so that a similar legacy is not left
for the future.
There has been good progress in some areas of waste management, such as improved landfill design and
operation and introducing kerbside waste and recycling services. However, there is a long way to go and some key
challenges remain.
Business is often frustrated by the limited options for recycling wastes. Up-take of available recycling services by
commercial waste generators is variable and, currently, most voluntary product stewardship is dependent on
motivated industry leaders and ‘early adopters’. The quality of information available about the make-up of waste
streams and trends generally remains poor.
Developing the strategy
Queensland’s previous waste strategy was released in 1996, and no longer reflects the current state of play or the
potential for improved waste reduction and resource recovery. Since 2001, waste industry and local government
stakeholders have been requesting the government to prepare a new strategy with a secure funding source to
provide investment certainty and policy direction.
An international trend towards resource recovery and recycling is leading to unprecedented growth in the industry.
But Queensland’s outdated waste management framework is resulting in investors choosing to invest in other
states, and Queensland is missing the opportunity to benefit from this emerging industry.
The government started the process of developing a modern strategy by releasing a waste discussion paper in
October 2007. Response to the discussion paper overwhelmingly supported developing a state-wide strategy to
provide vision and drive reform.
A draft strategy and waste disposal levy proposal was released for public comment in May 2010, feedback from
which can be viewed at . The feedback was used to finalise the strategy, which
represents the first step in more than a decade to undertake genuine reform across all aspects—strategic,
legislative and economic—of waste management in Queensland.
-4-Strategy principles
The waste and resource management hierarchy
The strategy is a new take on an old theme—the waste and
resource management hierarchy, an internationally accepted
guide for prioritising waste and resource management practices.
Waste reduction is the preferred option, followed by reuse,
recycle, other recovery, treat and, finally, dispose (see
Supplementary paper 2: The waste and resource management
hierarchy, for more detail).
To start changing behaviour and the way people perceive
waste—and begin the journey towards valuing the resource—this
strategy uses the hierarchy to underpin its goals and actions.
The hierarchy and the following guiding principles steer the
delivery of programs and inform this strategy.
Resource efficiency
• Moving from a linear ‘extract-process-use-dispose’ resource use model towards ‘closing the recycling loop’ in a
more cyclical system where resources are recovered and recycled again and again.
• Making better use of finite resources (energy, water, materials) by encouraging waste avoidance and improving
recovery through product stewardship or ‘take-back’ schemes.
Sustainability
• Maximising the net benefits to all Queenslanders: environmental, social and economic.
• Building on existing programs and achievements.
• Facilitating sustainable local solutions for local issues.
Engagement
• Taking the views of all stakeholders into consideration
• Achieving results through partnerships with the community, business and industry and government.
• Facilitating and encouraging shared responsibility.
• Taking into consideration relevant national and international trends in waste technologies, laws and policies.
Capacity building
• Facilitating business and industry development and building sustainable local and export market capability,
while recognising the different approaches needed for metropolitan, regional and remote areas.
Strategy goals
Based on these principles, the strategy will aim to:
1. reduce waste
2. optimise recovery and recycling
3. develop sustainable waste industries and jobs.
The goals highlight the areas where action is necessary to secure real progress in achieving the vision of a low-
waste Queensland. The goals and the vision of a low-waste Queensland will be achieved through a five-part
strategy.
-5-A five-part strategy
1. Targets and priorities
The strategy sets ambitious but achievable targets aimed at tackling waste generation, and optimising opportunities
for recovering, reusing or recycling materials and end-of-life products. The targets will help influence infrastructure
planning processes and the activities of government, business, and households. The strategy also identifies priority
areas for action.
Targets
Over the next decade Queensland will:
• reduce waste to landfill
• reduce landfill gas emissions
• increase the recovery and recycling of resources across all waste streams
• reduce generation of waste
• reduce the total amount of, and the environmental impacts from, litter and illegal dumping.
Key targets and dates
Target 2008 baseline By 2014 By 2017 By 2020
Reduce waste disposal Business-as-usual Reduce landfill Reduce landfill Reduce landfill
to landfill, compared to – no strategy disposal by 25 % disposal by 40 % disposal by 50 %
business-as-usual – 4.6 million – 9.9 – 16.3 million
projections tonnes of avoided million tonnes of tonnes of
landfill disposal additional avoided additional
since 2010 landfill disposal avoided landfill
since 2014 disposal since
2017
Increase recycling of 35 % 50 % 60 % 75 %
construction and
demolition waste
Increase recycling of 18 % 40 % 50 % 60 %
commercial and
industrial waste
Increase recycling of 30 % 35 % 40 % 45 %
regulated waste
Increase recycling of 23 % 50 % 55 % 65 %
municipal solid waste
Target 150: increase
recycling of household 64 kg per person 80 kg per person 100 kg per person 150 kg per
waste to 150 kg per per year per year per year person per year
person per year
Reduce generation of 5 % reduction 10 % reduction 15 % reduction
waste
2.4 tonnes per 2.3 tonnes per 2.2 tonnes per 2 tonnes per
person per year person per year person per year person per year
The targets have been set after analysing the available data and trends, and by working with stakeholders as part
of consultation on the draft strategy.
-6-The targets represent aggregated outcomes across the whole of Queensland, as it is expected that metropolitan
areas will initially out-perform regional and rural areas of the state. The targets are designed to encourage
collaboration and partnerships in regional areas to work together to achieve the strategy’s goals and aim for
continuous improvement and innovative local solutions. A range of programs and initiatives will be available to
regional Queensland to align with the goals and targets of the strategy.
Developing innovative and accessible resource recovery technologies will be vital to meet the targets.
Measuring progress
Feedback on the draft strategy highlighted the relatively poor quality of Queensland’s waste data. Despite
improvements in recent years, there are still issues with the completeness and reliability of the information.
Improving data collection and reporting is a high priority. Without it, it is not possible to measure progress and
achievements, refine priorities, and develop specific targets for waste materials. While it is not necessary to wait for
more accurate data to commence the reforms, as the general trends are obvious, the issue needs to be addressed
as soon as possible.
The following initiatives will help establish improved methodologies and reporting mechanisms:
• Conducting composition audits of commercial and industrial (C&I), construction and demolition (C&D) and
regulated wastes to help measure recovery performance.
• Analysing infrastructure across Queensland to identify current capacity and gaps in management and
processing capacity.
• Developing a standard methodology for measuring and reporting on public place and event recycling.
• Developing a standard methodology for measuring and reporting on waste disposal and resource recovery.
• Conducting composition audits on municipal waste to identify priority products and recoverable materials.
Progress towards achieving the targets will be measured every three years against the 2008 base case. The
government will monitor performance and achievements through three-yearly progress reports. Strategy priorities,
targets, levy pricing, and the effectiveness of programs will all be part of the regular review and public reporting.
Waste reduction target
Under the waste and resource management hierarchy, waste reduction is the preferred option. By avoiding waste
generation in the first place, the entire community’s reliance on resource-depleting waste disposal will be reduced.
The Queensland Government can influence waste avoidance by engaging with national processes and working
with manufacturers, industrial processes and research sectors to help create more efficient and innovative
processes to avoid generating waste. Population and retail growth also needs to be taken into account, as both
influence waste generation.
Measuring how much waste has been avoided is difficult. One way is by calculating the reduction in overall waste
generation (measured as recovered-plus-disposed). The waste avoidance target proposed by the strategy is:
Reduce generation of waste by 15 per cent per capita by 2020.
Recovery targets
Resource recovery means recovering materials for re-use, recycling, or energy recovery. Resources can be
recovered through separating recyclable materials at the source (such as household kerbside recycling) or from a
mixed load of waste at a transfer station, treatment facility or landfill (such as using a ‘dirty’ materials recovery
facility to separate recyclable material from non-recyclable waste prior to landfill disposal).
The environmental benefits of resource recovery generally come from reducing waste disposal and offsetting the
use of virgin, and often finite, resources. The benefits include conserved resources and landfill space, reduced
greenhouse gas emissions, less air pollution and water savings.
Recycling targets have been set for the three main waste streams and for higher-hazard regulated waste. A sub-
target for municipal solid waste—domestic kerbside collection—has also been set, as comparatively good data is
available for this stream. ‘Target 150’ aims to both increase household recycling (from 64 kg per person per year)
and decrease household waste disposal (from 267 kg per person per year) to 150 kg per person per year by 2020.
-7-Recover and recycle by 2020:
• 75 per cent of construction and demolition waste
• 60 per cent of commercial and industrial waste
• 45 per cent of regulated waste
• 65 per cent of municipal solid waste
• Target 150 – recycle 150 kg of household waste per person per year.
Disposal targets
While well-designed and engineered landfills that capture landfill gas for re-use can be operated with reduced
environmental and social impact, many landfills do not meet this standard, and burying resources and useful
materials is not an optimal use of resources. However, there is an opportunity to reduce the environmental impact
of landfilling by optimising the capture and re-use of landfill gas wherever practicable.
Another way to reduce greenhouse gas emissions from waste disposal is by reducing the amount of organic waste
that goes to landfill. To achieve the strategy’s target, organic waste from both domestic and commercial sources
will have to be diverted from landfill.
Litter and illegal dumping are the most obvious evidence of irresponsible and wasteful attitudes. In implementing
the strategy, the Queensland Government will be mindful of the potential impacts of policies, such as introducing a
waste disposal levy, on illegal dumping. The strategy aims to minimise the environmental impact of disposal, and,
in particular, unlawful disposal such as littering and illegal dumping.
The focus has moved away from just cleaning up litter once it has been dumped and towards preventing unlawful
activity in the first place. The strategy does not propose a reduction target at this stage as current baseline data is
not good enough to establish a target to:
• reduce waste to landfill by 50 per cent
• reduce landfill gas emissions by 50 per cent
• reduce the total amount of, and the environmental impacts from, litter and illegal dumping.
Achievability and risks
Construction and demolition waste (recycling target of 75 per cent by 2020)
Achievability of this target is rated as high due to the highly recyclable nature of this waste stream. Information
provided by the sector indicates that the majority of waste produced during construction of a residential dwelling is
clean soil. Concrete, timber and steel are also produced, all of which are readily recyclable.
Applying the levy will also create an incentive for this sector to reduce waste disposed and explore opportunities to
avoid waste generation or increase recycling. Initially, regional areas may have limited opportunities to recycle
construction and demolition wastes. In time, however, investment in regional recycling infrastructure, and
developing markets for recycled products, will bring improvements.
To reduce the risks, the Queensland Government will engage with the construction and demolition sector to
support research and improved site practices to reduce contamination and identify opportunities for recycling, and
encourage purchase of recycled-content products.
Commercial and industrial waste (recycling target of 60 per cent by 2020)
Achievability of this target is rated as medium due to the current comparatively low rate of recycling in this sector
and applying a price signal in the form of a waste disposal levy to encourage behavioural change.
The commercial and industrial sector covers many areas of business and the resulting waste is varied in its
composition. There is also no processing infrastructure dedicated to large-scale mixed commercial and industrial
waste sorting and recovery.
-8-Some businesses may lack the capacity and expertise to undertake the changes required. This may be especially
true for small business, or for multi-tenanted buildings where the business has little control over waste
management systems. However, there is recognition by companies and business associations that business and
industry could do more to recycle their wastes.
To reduce the risks, the Queensland Government will:
• work with this sector, and in particular small-to-medium enterprises, to help with education and awareness
about available recycling technologies and systems suitable for a range of businesses, auditing and developing
waste reduction action plans, and best practice contracting for waste management services
• work with waste contractors to support expanded recycling services for the commercial sector.
Municipal solid waste (recycling target of 65 per cent by 2020)
Achievability of the target is rated as medium at best due to both the limited opportunities to recycle some of this
waste and the lack of a price signal. Municipal solid waste includes wastes arising from local government
maintenance of street bins and street sweeping operations. There may also be limited capacity in regional areas to
improve recycling activities due to economies of scale and transport costs to processing infrastructure.
Achieving this target is also highly dependent on commercial decisions, such as by retailers and manufacturers
who could choose to provide goods in recyclable or minimal packaging. Over 10 years, this target is also likely to
be susceptible to changing commodity prices and the introduction of new materials and products that generate
different wastes.
Perhaps the largest gains in this area can be made by targeting household green waste and organic recovery.
While there are risks with this approach, primarily from a lack of markets for products, organics make up around 40
per cent of the waste from household bins, presenting a significant opportunity.
To reduce the risks, the Queensland Government will:
• encourage and support product stewardship arrangements
• use education and awareness programs and strong community partnerships to ensure appropriate recycling in
households
• work with local government and communities to implement household green waste and organic programs.
Priority areas
This strategy and the proposed legislative reforms challenge old ways of thinking about what has traditionally been
considered as ‘waste’. Priority will be given to sectors and areas with the greatest need and potential to deliver the
greatest gains and cost-effective improvements over the next decade.
Priority wastes and end-of-life products
Each waste stream contains many individual waste materials and end-of-life products. Many occur in more than
one stream. For example, packaging occurs in all waste streams, and ‘e-waste’, such as end-of-life computers and
electronics, occurs in municipal solid waste and commercial and industrial waste.
Feedback on the draft strategy suggested many potential candidates for priority action. Supplementary paper 3:
Identifying priority products, outlines a process to transparently identify and manage priority products and materials
by publishing a priority product statement. Wastes are assessed in terms of disposal impact, resource efficiency,
and the economic and social impacts of waste generation and disposal.
This helps to shape the initial set of priorities for the first term of the strategy, which will include the high priority
red hotspots highlighted below. The lower priority amber spots show areas that can be tackled later, either
because substantial progress is already being made, or because more time is needed to develop recovery
infrastructure or end-markets. This means that, for example, programs to better recover organic wastes should
initially target household garden waste and commercial food processing waste, while the more difficult challenge of
household food waste can be tackled later.
-9-Higher hazard
processing &
Batteries and
fluoro lights
food scraps
Gas bottles
Hot spot table
Computers
televisions
Packaging
Organic –
Organic –
regulated
concrete
green &
Timber,
garden
Mixed
Tyres
and
● Highest priority
● Secondary priority
Municipal solid waste
● ● ● ● ● ● ●
Commercial and
industrial waste
● ● ● ● ● ● ● ●
Construction and
demolition waste
● ● ●
Taking action on priority products
New legislation will help identify priority wastes, enabling Queensland to support national approaches or to adopt
state-based action. A detailed priority product statement will be released in 2011, identifying priority products and
materials, preferred management options and performance measures.
More detailed data on waste streams will be needed to refine these priorities, or to develop targets for particular
materials. Actions to audit and characterise waste streams are a high priority.
Possible actions for particular priority wastes include:
• voluntary or mandatory ‘product stewardship’ or take-back schemes
• disposal bans
• education and awareness campaigns to target reduced generation and enhanced recovery
• support for collection programs or reprocessing infrastructure
• investing in design-for-environment to increase recyclability or reduce toxicity of inputs.
Coordinating with national processes
Some end-of-life products are currently targets for national product stewardship action. These include tyres,
packaging waste, computers and televisions, mercury-containing lamps, and plastic bags. Some industry sectors
already have voluntary recycling schemes, including the telecommunication industry (MobileMuster), agricultural
and veterinary chemicals (DrumMuster and ChemClear) and newsprint (Publishers National Environment Bureau).
The Queensland Government will work with industry sectors to help build on achievements made through existing
schemes and help promote product stewardship activities. The Queensland Government is also interested in
working with other industry sectors to foster new product stewardship arrangements.
- 10 -2. Price signal – waste disposal levy
The Queensland Government will introduce a waste disposal levy as a price signal to change disposal behaviour. A
levy is a price charged in addition to the normal waste disposal gate fee at a waste disposal facility.
How the levy will work
The levy will only apply at the point of disposal and is, therefore, largely an avoidable charge. This is because a
person who disposes of waste to landfill pays the levy, whereas a person who avoids generating waste, or recycles
their waste, does not pay the levy.
The levy will provide:
• a price signal to encourage waste generators to reduce waste generation and disposal
• a deterrence to the unnecessary disposal of interstate waste in Queensland
• an incentive for industry investment in resource recovery infrastructure
• funding for programs to improve waste avoidance and resource recovery practices.
Ultimately, the levy will help achieve the strategy’s targets and reduce Queensland’s carbon footprint by cutting
landfill disposal.
Levy $/tonne
Levies have worked in other states, when accompanied by Waste stream
disposed
targeted and effective programs and investment in resource
recovery infrastructure. In turn, levies provide a source of Commercial and industrial waste $35
funding to deliver waste reduction programs.
An initial rate of $35 per tonne of waste disposed will apply to Construction and demolition waste $35
commercial and industrial waste, construction and demolition
waste, and contaminated and acid sulfate soils. Municipal solid Contaminated and acid sulfate soils $35
waste, which includes household kerbside and self-haul waste,
and wastes from park and street bin maintenance, will not Lower hazard regulated waste $50
attract levy payments.
Higher hazard regulated waste $150
Regulated waste, from non-domestic sources, includes acids,
oil, batteries, tyres, food processing and clinical waste. Higher Municipal solid waste $0
levels of levy will apply depending on whether it is lower hazard
or higher hazard as prescribed by regulation. Certain wastes, such as declared disaster waste or correctly
managed asbestos, will be exempt.
The levy rates have been set to strike a balance between the need to change behaviour—from waste disposal to
reduction and recovery—while not imposing unnecessary costs on business. The levy is also proportionate to that
in other states so that Queensland does not become a cheap dumping ground for interstate waste.
Distribution of levy funds
Over the first four years of its collection, the levy will be distributed as follows:
• $159 million towards targeted programs to help business and industry reduce the amount of waste they
generate, and to encourage industry investment in recycling technologies, particularly in regional areas
• $120 million for local governments to spend on environmental projects, focusing on better waste management
facilities and practices
• Any surplus funds will be dedicated to priority Queensland Government environmental initiatives, including
acquiring land for national parks.
Next steps
The levy will commence from 1 July 2011. The levy collection zone covers 34 local government areas, each with
populations of more than 10 000 people. The strategy will be reviewed every three years.
The Queensland Government has committed to excluding domestic self-haul waste from application of the levy.
The government will continue to monitor the effectiveness of its current policy and any impacts that may arise, in
particular the potential to see misrepresentation of commercial waste as domestic waste. The government will also
scope options to achieve its policy intent through other mechanisms, such as a voucher system.
- 11 -3. Stronger legislation
The need for a new legislative framework
Queensland’s waste management legislation is outdated and mainly deals with managing the impacts of pollution
caused by waste—not trying to stop it being generated in the first place.
While there have been significant developments in waste management and resource recovery since the
introduction of the Environmental Protection Act 1994 and subsequent introduction of the Environmental Protection
(Waste Management) Policy 2000 and Environmental Protection (Waste Management) Regulation 2000, there is
little scope under the current Queensland framework for taking the same action as other states on waste reduction,
product stewardship or resource recovery and efficiency.
New legislation is needed to underpin the strategy, including promoting waste reduction and resource recovery and
diverting potential resources from landfill. The legislation needs to reflect modern waste management practices and
an awareness of the need for Queensland to reduce its ecological footprint.
The government will deliver a new Act and regulations, and amend and strengthen existing laws. This will provide
the necessary head of power to improve waste and resource management in Queensland. The new framework will
clearly define the legislative options for managing end-of-pipe, front-end and whole-of-life impacts. This approach is
consistent with the framework used in other states.
The proposed legislative reforms will:
• help achieve the goals and targets of the strategy
• provide a more flexible approach that can readily keep pace with changes in technology
• help to regulate illegal activities more effectively and provide a level playing field for legitimate and responsible
facility operators
• help manage priority wastes more effectively
• ensure more consistency with other states.
Priority products, product stewardship and landfill bans
The legislation will set out a process for publishing a priority product statement, which will identify priority products
and materials, preferred management options and performance measures. While in some cases the most effective
management option could be education or market development, the legislation will also empower the government
to take strong action where appropriate, such as:
• establishing product stewardship programs under which producers take back end-of-life products
• phased-in disposal bans for certain priority products.
Other legislative measures
Legislation will also be introduced in 2011 that:
• requires the Queensland Government to regularly review and report on this strategy
• introduces a waste disposal levy to change behaviour
• strengthens requirements for implementing state and local government strategic waste plans
• establishes requirements for resource recovery from waste streams prior to disposal
• sets mandatory reporting requirements for the waste and resource recovery sector
• delivers stronger litter and illegal dumping provisions, including third-party public reporting of vehicle-related
litter offences.
- 12 -4. Programs and actions
Waste is everyone’s responsibility and the Queensland Government will work together with local governments,
business and industry, environment groups and the community to deliver a set of actions and effective programs.
In order to achieve improved practices, people must have the ability to recycle, and companies collecting
recyclable materials must have markets for the products. The Queensland Government will work with industry
sectors to foster the strong institutional and infrastructure foundations necessary for increased investment,
employment and innovation in waste and resource management.
Investment will be encouraged for operations and technologies suited to different materials, generation sources
and geographic locations. Priority areas and products will be identified, emphasising areas currently under-
represented, as indicated by the available resource recovery data.
Developing new markets for recycled products is essential to achieving the resource recovery targets in the
strategy. While strong markets do exist for some recovered materials, such as plastic, aluminium, and cardboard,
there is scope to improve the use of these recovered materials. Other wastes, such as construction and demolition
waste and recycled organics, are high priorities for market development. As new and expanded recovery programs
take effect, and new challenges are presented by product take-back initiatives, further opportunities will emerge for
market and research development.
This section outlines the key action areas over the next four years that reflect imperatives identified by stakeholders
and the government. They will be funded by an estimated $279 million raised from the levy over four years.
The actions reflect the current situation and knowledge, but changing circumstances or national priorities may
prompt review and redirection of the focus. These actions will build on the valuable work to date by business and
households, by enhancing successful programs—such as the ‘Do the right thing, use the right bin’ away-from-home
recycling program—and by adopting interstate programs to meet Queensland’s priorities.
A four-year business plan to be released in 2011 will describe the details and funding of the programs. The main
actions are outlined here, aligned with the strategy’s goals and targets. While the targets and most of the actions
belong to the preferred reduce and recycle end of the waste hierarchy which is the main focus of this strategy,
several actions also aim to mitigate the impacts of waste disposal in remote and regional areas of the state.
Goal 1 – Reduce waste
Goal 3 – Sustainable
recovery & recycling
Goal 2 – Optimise
waste industries
Sector
Initial action areas and strategy targets
Reduce waste to landfill and landfill greenhouse gas emissions
Increase recycling of commercial and industrial waste to 40% by 2014
Towards a resource-efficient government
• State government departments will be required to include targets for purchasing recycled- 9 9 9
content products, recycling and waste reduction actions in their mandatory strategic waste
management plans, and to report on progress.
State government
Sector-wide actions
• Implement state-wide action such as product stewardship schemes on priority wastes,
including those that are part of the national waste strategy agenda such as tyres, or
televisions and computers.
9 9
• Regional and state-wide collection programs, including infrastructure for collecting priority 9 9
products, and 25 strategic regional resource recovery programs aimed at creating green jobs
in regional areas.
• Improved compliance and regulation of the waste and resource recovery sector.
9
• State-wide litter prevention strategy, including public reporting for littering from vehicles, a
ban on the mass release of lighter-than-air balloons from government-organised 9
events, reducing litter from plastic bags and advertising material, and support for existing
successful anti-litter programs.
- 13 -You can also read