Sustainability and Dimensions of a Nexus Approach in a Sharing Economy - MDPI
←
→
Page content transcription
If your browser does not render page correctly, please read the page content below
sustainability

Article
Sustainability and Dimensions of a Nexus Approach
in a Sharing Economy
Petra Schneider * , Lukas Folkens, Andreas Meyer and Tino Fauk
 Department Water, Environment, Civil Engineering, and Safety, University of Applied Sciences
 Magdeburg-Stendal, D-39114 Magdeburg, Germany; Lukas.folkens@outlook.com (L.F.);
 andreas.meyer@hs-magdeburg.de (A.M.); Tino.Fauk@student.wk.hs-magdeburg.de (T.F.)
 * Correspondence: petra.schneider@hs-magdeburg.de; Tel.: +49-391-886-4577

 Received: 30 November 2018; Accepted: 1 February 2019; Published: 11 February 2019

 Abstract: Increasing global resource consumption puts the availability of natural mineral resources
 under significant pressure. One strategy to overcome this trend is the decoupling of economic
 growth and resource consumption and the application of circular economy approaches. These
 approaches aim at closing material cycles across sectoral boundaries. Beside these attempts, there
 are further options for action aimed at minimization of resource consumption through resource
 sharing approaches. This study investigates resource-saving potentials on different scales namely on
 a personal scale through sharing goods and services, but also in the frame of industrial symbiosis
 through sharing of secondary resources at a company scale. The environmental effects have been
 quantified using life cycle assessment examples for these two simulated cases. The results show
 for both resource consumption levels, resource savings potentials of up to 2 powers of ten, that can
 particularly be proven regarding the impact category ‘fossil resource depletion’. The emergence
 of industrial symbiosis can be identified by six factors: Resource, government, economy, company,
 technology, and society. The cases simulated in the study are supported by empirical evidence from
 real-life examples, which consider the mentioned factors.

 Keywords: nexus approach; resource consumption and efficiency; sharing economy

1. Introduction
     The relationship between global resource consumption and economic growth has been
controversially discussed in economic terms and reveals itself, for example, in the formulation of
different economic disciplines and positions. In recent decades, the terms “ecological accounting” and
“environmental economics” have emerged as those sub-disciplines in economics that are particularly
dedicated to resource use. In this context, two basic economic-ecological positions over the past
decades can be closely linked to these developments. However, some scientists are of the view that
resource consumption and economic growth cannot be decoupled from one another and systemic
change is therefore required to achieve long-term environmental goals (e.g., [1,2]). This position is
summarized under the term “degrowth” and is based on the work of Gorz and Georgescu-Roegen et al.
in the early 1970s (cited in [3,4]). On the other hand, there is the idea of “green growth”, underlining
that technological progress, efficient production strategies, and the use of environmental economic
instruments such as the internalization of external effects, can succeed in decoupling economic
growth from resource consumption [5–7]. The degrowth position is based on the assumption that
ecological goals can only be achieved if the economic value added within prosperous economies is
reduced [1,2,8]. Overall, the attitude is fundamentally characterized by the assumption that there is a
causal link between economic performance and resource consumption [2]. Consequently, resource
depletion can be reduced decisively if the economic performance of the respective economies decreases

Sustainability 2019, 11, 909; doi:10.3390/su11030909                     www.mdpi.com/journal/sustainability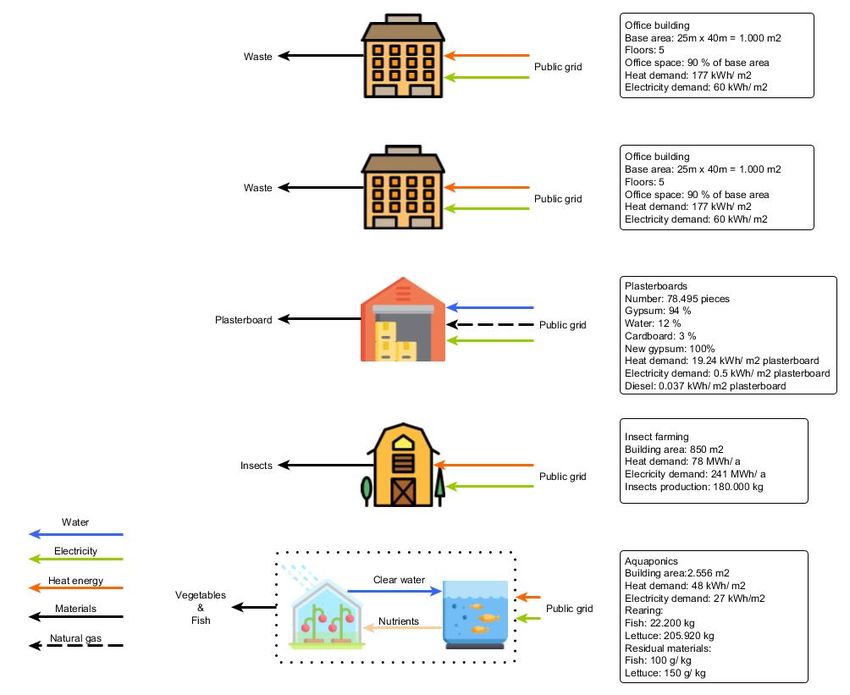
Sustainability 2019, 11, 909                                                                        2 of 19

sufficiently. Georgescu-Roegen [9] justified the impossibility of decoupling economic growth and
resource consumption by stating that the production of goods and services requires the use of
energy. On the other hand, there is the concept of green growth, which negates the inextricably
positive causal relationship between economic performance and resource consumption and even
assumes that green growth can contribute to the realization of a negative correlation between the
two variables [10]. This is justified by the fact that the reduction of resource consumption can be
achieved with technical innovations, which ultimately induce economic growth [10]. These innovations
can spread to other countries as positive external effects and thus increase the decoupling effect.
The decoupling hypothesis is a central element of the green growth movement and can be regarded as
a fundamental distinguishing feature of both positions [5,11]. To this end, the green growth movement
makes use of various environmental economic instruments, of which the internalization of external
effects is the most commonly known [12].
     It is inherent to both positions that there is a demand for a transformation of the industrialized
countries in order to achieve ecological goals (cf. e.g., [6,7,13]). Advocates of green growth adhere to
existing markets in this respect, but want to optimize them to the extent that, for example, negative
external effects are internalized. Representatives of the degrowth perspective, on the other hand,
assume that many of the economic activities currently carried out in traditional markets will in
future be performed outside established markets or in markets with a fundamentally different design.
The specific design of these alternatives can bring manifold benefits. Essential to this understanding is
the concept of the “commons” (a contraction of the “commons-based peer production”), according
to Benkler [14]. For example, the specific design of a new way of transmitting goods continues to
manifest itself in a sharing economy, although this does not necessarily mean that it is part of the
degrowth movement. The sharing economy can follow both, degrowth and green growth ideology,
depending on the intentions of the economic entities involved. Consequently, a distinction can be made
between commercial and non-commercial sharing economies. Within the non-commercial sharing
economy [12], the concept of collaborative consumption is important. In contrast to commons-based
production, this can be explained by the fact that goods are not produced jointly, but are usually
purchased on markets, for joint future use. Both ideas do not focus on ownership but on access
to goods and resources, which is why Rifkin [15] speaks in this context of a transition to an access
society. Furthermore, both concepts combine the fact that dependency on monetary income is reduced.
Sharing approaches can be designed in different ways: Typically, a distinction can be made between
peer-to-peer (P2P), business-to-consumer (B2C) and business-to-business (B2B) models [16]. As a result,
the sharing economy itself is often defined divergently. Definitions include Rifkin [15], Demary [17],
Wosskow [18], Sundararajan [19] and Weber [20]. This present study does not commit itself to any of
the definitions, but regards the basic idea of sharing goods and services as an essential concept for
meeting current and future shortages of raw materials. The Institute for Ecological Economy Research
(IÖW) in Germany, among others, conducts current research on this topic [21]. In the latest publication,
Ludmann [22] examined the ecology of sharing for the first time through a life cycle assessment. Life
cycle assessments were calculated and evaluated in the areas of clothing, everyday mobility, and travel
accommodation. It was shown that sharing does not automatically make sense from an ecological
point of view. This is particularly true when sharing approaches increase overall consumption, which
is why sustainable consumption patterns must be included in the debate. It was also explained that
there is still great potential in sharing [23].
     Berlina et al. [23] considered industrial symbiosis as a driver for green growth. Industrial
symbiosis describes a business collaboration wherein residuals from one enterprise serve as inputs
to another [23]. It was characterized as a core concept for the implementation of circular economy
according to McDonough & Braungart [24] in scientific and institutional literature (for instance [25–27]).
In addition, the Circular Economy Action Plan of the EU urges to promote innovative industrial
processes, including industrial symbiosis. In its revised proposals on waste, the Commission is
proposing to clarify rules on byproducts to facilitate industrial symbiosis [28]. Chertow [29] defined
Sustainability 2019, 11, 909 3 of 19
industrial symbiosis as an engagement of traditionally separate industries and entities in a collaborative
approach to resource
Sustainability sharing that benefits both the environment and the economy. Chertow &3 of Park [30]
Sustainability2019,
2019,11,
11,x xFOR
FORPEER
PEERREVIEW
REVIEW 3 of1919
summarized a cooperative resource sharing of water, energy, and material by-products and wastes
acrossChertow
Chertow &&Park
organizations Park[30]
at
[30] summarized
the aacooperative
heart of industrial
summarized resource
symbiosis,
cooperative resource sharing
for ofofwater,
water,energy,
both environmental
sharing energy, andand
and material
materialby-
economic benefits.
by-
products
productsand
Historically, andwastes
wastesacross
increasing across organizations
organizations
population atatthe
growth theheart
has of
heart ofindustrial
led industrial
to a scarcitysymbiosis,
symbiosis, for
forboth
of resources. bothenvironmental
environmental
Since the second
energyand
and economic
economicbenefits.
transition benefits.1900, the global material and energy consumption increased continuously
around
Historically, increasing population growth has
hasled
ledtotoaascarcity ofofresources.
resources.Since the second
(Figure 1). More thanincreasing
Historically, 68 billion population
tons of raw growth materials were scarcity
used worldwide inSince
2009the[31].secondWith a
energy
energytransition
transitionaround
around1900, 1900,thetheglobal
globalmaterial
materialandandenergy
energyconsumption
consumptionincreasedincreasedcontinuously
continuously
predicted world population of over 9 billion people in 2050 and rapid economic growth in newly
(Figure
(Figure1). 1).More
Morethan than68 68billion
billiontons
tonsofofrawrawmaterials
materialswerewereused usedworldwide
worldwideinin2009 2009[31].
[31].With
Withaa
industrializing
predicted countries, the demand for raw people
materials is further growing, resulting in a per capita
predictedworld worldpopulation
populationofofover over99billion
billion peopleinin2050 2050and andrapid
rapideconomic
economicgrowth growthininnewly newly
consumption of raw
industrializing
industrializing materials
countries,
countries, the that
the is currently
demand
demand for
forraw
raw about fourisis
materials
materials times
further higher
further growing,in industrialized
growing, resulting
resultingininaaper countries
capitathan
percapita
in less-developed
consumption
consumptionof countries
ofraw [31]. On
rawmaterials
materials thata is
that global level,about
iscurrently
currently several
about four types
four times
timesofhigher
mineral
higher resources
ininindustrialized
industrialized likecountries
phosphorous
countries
and sand
than have already become scarce, while the pressure on the resources
than in less-developed countries [31]. On a global level, several types of mineral resourceslike
in less-developed countries [31]. On a global level, several types of is still
mineral increasing.
resources In 2017,
like
phosphorous
the European and
Commission sand have already
published a become scarce,
communication while
on the
its pressure
list
phosphorous and sand have already become scarce, while the pressure on the resources is still of on
Critical the
Raw resources
Materials is still
(CRMs),
which increasing.
featuresIn
increasing. In2017,
27 raw the
2017, theEuropean
European
materials Commission
withCommission published
publishedaand
a high supply-risk acommunication
communication
a high economic ononitsitslist
listofofCritical
CriticalRaw
importance Raw
to which
Materials
Materials
reliable (CRMs),
(CRMs), which
and unhindered which features
access features 27 raw materials
27 raw materials
is a concern with
for European a high
with aindustries supply-risk
high supply-risk
and valueand a high
higheconomic
and achains economic
(the process
importance
importance totowhich
which reliable
reliableand and unhindered
unhindered access isisaaconcern for
forEuropean industries and
andvalue
or activities by which a company adds value toaccess
an article,concern
including European
production, industries
marketing, value
and the
chains (the process or activities by which a company adds value to an
chains (the process or activities by which a company adds value to an article, including production,article, including production,
provision of after-sales service).
marketing,
marketing,and
andthe
theprovision
provisionofofafter-sales
after-salesservice).
service).
Figure 1. Resource
Figure
Figure consumption
1.1.Resource
Resource consumptionand
consumption global
andglobal Gross
globalGross Domestic
GrossDomestic
Domestic Product
Product
Product (GDP)
(GDP)
(GDP)[31].[31].
[31].
General strategies
General
General have
strategies
strategies been
have
havebeendeveloped
beendeveloped
developedtototo
foster
fosterresource
foster resource efficiency
resourceefficiency and
efficiencyand resource
andresource
resource productivity in
productivity
productivity
valueininvalue
valuechains,
chains, whichwhich
chains, whichhave
have havebeen
been beenincreasing
increasing since
since
increasing heightened
heightened
since heightened environmental
environmental awareness
awarenessin
environmentalawareness inthe
in the1980s;
1980s; see
1980s;
see
Figure 2.Figure
see Figure2.2.
Figure
FigureFigure 2.2.Trends
2. TrendsTrends ininmaterial
material
in material productivity
productivity
productivity (MP)
(MP)
(MP) inininrelation
relationto
relation tototrends
trendsin
trends in%%
in %increase
increaseinin
increase GDP,
inGDP,expressed
GDP,expressed
expressed in
inin$per
$ GDP $GDP
tonper
GDP ton
per tonDirect
Direct Material
Direct Material
Material Input
InputInput(DMC)
(DMC)(DMC) [32].
[32]. [32].Sustainability 2019, 11, 909 4 of 19
To practice a circular economy does not only mean an understanding of the life cycle of a
product, but also of the mechanisms of how to transform an end-of-life cycle into a circular life cycle.
Improving resource productivity and ensuring sustainable resource and materials management based
on the 3R principle (reduce, reuse, recycle) is a central element of green growth policies [33,34]. 3R
complementing approaches are integrated resource management strategies, like Integrated Solid
Waste Management [35], Integrated Water Resources Management [36–38], Integrated Natural
Resources Management [39,40] as well as the inter-sectoral resource management strategies, namely
the Water-Energy-Food Nexus [41–45], the Water-Soil-Waste Nexus [46], and the Minerals-Energy
Nexus [47],while integrated resource management strategies focus on better management strategies
inside one sector along a value chain, that is managing resource productivity. Nexus approaches,
on the other hand, have more sectors in focus, which depend on the same type of resources and
sometimes even on the same resource stock, which entails management of resource scarcity. This kind
of dependency requires sharing available resources responsibly in order to avoid resource conflicts.
Responsible resource use means not only the improvement of resource efficiency in the production
process but also sharing of resources in order to increase resource productivity, closing unbalanced
material cycles, and the promotion of responsible consumption.
Taking into account the global development of resource consumption and the existing approaches
to managing resource productivity and scarcity, this study focuses on the investigation of the feasibility
and efficiency of resource-sharing approaches. The potential for resource savings on a personal and
company level were evaluated exemplarily. The investigation assesses resource-saving potentials on
different scales, namely on a personal scale through sharing goods and services, as well as in the frame
of industrial symbiosis through sharing of raw materials and secondary raw materials on a company
scale. The environmental effects have been quantified using life cycle assessment examples for these
two simulated cases. Two case studies were investigated to quantify resource savings through resource
sharing approaches by: (a) common use of goods in a local goods sharing network, and (b) resource
efficiency through the common use of resources and secondary resources through industrial symbiosis
of innovative industries, particularly insect farming for human food production. According to the
results of the literature review, life cycle assessments for industrial symbiosis with insect farming does
not yet exist in the scientific literature. The number of LCAs for an application with insect farming
is limited. Halloran et al. (2017) [48] highlighted that “the few existing studies that aim to evaluate
the environmental performance of insect farming systems are extremely limited in scope”. Already in
2016, Halloran et al. [49] underlined that the first study on LCA applied to insect farming for human
consumption was published in 2012 by Oonincx & de Boer [50], while the first LCAs related to insects
as animal feed were published in 2015 by Roffeis et al. [51] and van Zanten et al. [52]. Insect farming for
protein production has been considered in this study because of its outstanding potential for a future
global food security. The study has been structured in a comprehensive literature review, providing
the basics for the economic understanding of the resource sharing subject, followed by the description
of the materials and methods, the presentation of the results of the assessment of the case studies,
followed by the discussion and conclusions on the applicability of resource-sharing approaches.
2. Materials and Methods
2.1. General Approach
The investigations prepared for this article consist of a comprehensive literature review on
resource-sharing approaches and an assessment of case studies. The theoretical part of this study
follows a classical literature search, whereby an attempt has been made to present the topic as
up-to-date as possible. The scope of the contribution is to quantify through presentation of examples
the resource-saving potentials of sharing economy approaches in different dimensions and on different
scales. Two case studies were investigated to quantify resource savings through resource-sharing
approaches by:Sustainability 2019, 11, 909 5 of 19
(a) Responsible private consumption through the common use of goods in a local goods sharing
network: sharing resources on a household and communal scale.
(b) Resource efficiency through the common use of resources and secondary resources in company
resource-sharing networks (i.e., sharing resources through industrial symbiosis).
The resource consumption of the sharing approaches (a) and (b) was assessed through a Life
Cycle Assessment (LCA) according to ISO 14040 and 14044, comprising the steps Life Cycle Inventory
(LCI) and Life Cycle Impact Assessment (LCIA). LCIA translates emissions and resource extractions
into a limited number of environmental impact scores by means of so-called characterization factors.
The aim of the model is to show, through an intentionally simplified example, how the emissions
change when material flows are optimized through: (a) Industrial symbiosis and (b) when factories are
combined. There are two common approaches to derive characterization factors, i.e., at midpoint level
and at endpoint level. Midpoint indicators focus on single environmental problems, for example global
warming change. Endpoint indicators indicate the environmental impact on higher aggregation levels,
being: (1) The effect on human health, (2) biodiversity and (3) resource scarcity (National Institute for
Public Health and the Environment of The Netherlands, 2018).
The databases that have been used are ProBas+ from the Federal Environment Agency Germany
and ECLD from the Joint Research Center (JRC) of the European Commission. Both databases
are open access (www.probas.umweltbundesamt.de/php/index.php; http://eplca.jrc.ec.europa.eu/
ELCD3/). Both databases are formatted by GreenDelta to be compatible with the OpenLCA software.
The resulting data base for ProBas has over 30,000 data sets, which is suitable for use in LCA studies
and with OpenLCA. The database contains a range of modern, up-to-date impact assessment methods
tailored to the data sets. Most data sets are available as single processes as well as system processes.
The ELCD database contains over 500 different processes from industrial sectors such as energy,
materials production, and transport. The data sets are all available in English and mainly relate
to Europe.
The methods used for impact assessment were ReCiPe Midpont (H) and CED. In general, ReCiPe
calculates 18 mean value indicators and 3 endpoint indicators and CED continues to calculate the
energy demand along the whole process chain. For this LCA, characterization factors climate change,
fossil depletion, marine eutrophication, particulate matter formation, photo chemical oxidation,
terrestrial acidification, water abstraction, cumulative energy demand, and depletion of non-renewable
resources. Details on the input and output data of the LCA can be found in the Supplementary Material
to this study. The results of the LCIA are intended to illustrate the differences in the usage behavior
of everyday objects and the individual use of facilities compared with a merger of production plants.
In the first approach, the emissions of the individual household objects and installations have been
broken down. Subsequently, a comparison has been made of the exchange of the objects and the
merger of production plants.
2.2. Sharing Resources on Household and Communal Scale
The scope of this part of the study was to assess the resource-saving benefits from sharing common
everyday objects (goods) at a household level in sharing communities like one’s neighborhood. To
compare the environmental impacts, six randomly selected everyday objects were selected and their life
cycle impact compared. From the authors’ point of view, these are objects that are needed from time to
time, but which do not necessarily have to exist in each household. The considered objects are a dinghy,
a wok, a ladder, a barbecue grill, a bicycle pump and a set of tools consisting of screwdrivers, a hammer
and a folding rule. The LCA for each of these objects was calculated, assuming that each object shall
be shared 6 ± 2 times a year. Due to the large number of possible combinations, assumptions were
computed using a Monte Carlo simulation.
As usage, duration was considered a period of one year. Any associated effects such as rebound
effect or higher wear were not included. This is due to the fact that it is almost impossible to obtain
information on whether consumers purchase items themselves or not or how the items are used.Sustainability 2019, 11, 909 6 of 19
However, this issue has a considerable impact on the life cycle assessment; therefore, the assumption
is based on one year during which the item does not become obsolete. Furthermore, a local use is
assumed, i.e., distances that can be covered by foot in order to not generate additional emissions. To
find out where items can be borrowed, there is an ever-increasing number of websites and telephone
apps that allow users to quickly and easily get in touch with each other.
2.3. Sharing Resources through Industrial Symbiosis
Industrial symbiosis is a concept within industrial ecology, focusing on enlarging sustainability in
the economy, which became popular in the last decade. There does not yet exist in the literature a clear
definition; however, the most comprehensive characterization was done by Boons et al. [53], based
on the definition of Chertow [29], who summarized industrial symbiosis as “engaging traditionally
separate industries in a collective approach to competitive advantage involving physical exchange
of materials, energy, water, and by-products. The keys to industrial symbiosis are collaboration and
the synergistic possibilities offered by geographic proximity”. Boons et al. [54] went beyond that
definition by including a competitive advantage through the exchange of physical substances as a
complementing aspect as well as the consideration of social and geographical aspects. With this
addition, the characterization of industrial symbiosis considers the common aspects of sustainability.
The origin of the concept was laid by the municipality of Kalundborg in Denmark, where the first Eco
Industrial Park started in the 1970s. Industrial Symbiosis enables companies to develop multilateral
solutions for material and energy flows, thus overall reducing the ecological footprint. Industrial
symbioses is a sharing approach by its nature. Typical industrial symbioses contexts are given in
Boons et al. (2011, 2014) [53,54] and von Hauff (2012) [55], and refer to sharing of residues as secondary
raw materials, sharing excess heat between companies, and infrastructure as well as network sharing.
The linking mechanism inside industrial symbiosis can be a bilateral sharing, a cascade sharing or a
sharing according to the nucleus principle, which refers to a central supplier of secondary raw materials
as a core of an industrial symbiosis [56]. According to [57], the emergence of industrial symbiosis
can be identified by six factors: Resource (resource scarcity and availability of waste), government
(regulations and standards and financial support), economy (economic benefit, financial payback
and new business opportunities), company (short mental distance, trust, security and awareness),
technology (technology innovation) and society (social organization or support system).
An industrial symbiosis for the present investigation was designed using the nucleus
principle [58]; in the present case, a waste incineration plant that produces secondary raw materials and
excess heat. The model is based on data from studies by the Federal Environment Agency, the German
Biomass Research Centre, the German Energy Agency, information from the Bavarian State Office for
the Environment, product information from manufacturers and masters’ theses from the University of
Applied Sciences Magdeburg-Stendal. Scope of the industrial symbiosis investigation was to quantify
the resource-saving effect and to compare it to an individual resource use. In order to compare the
environmental impacts of individual plants with those of a merger of plants, a simple model was
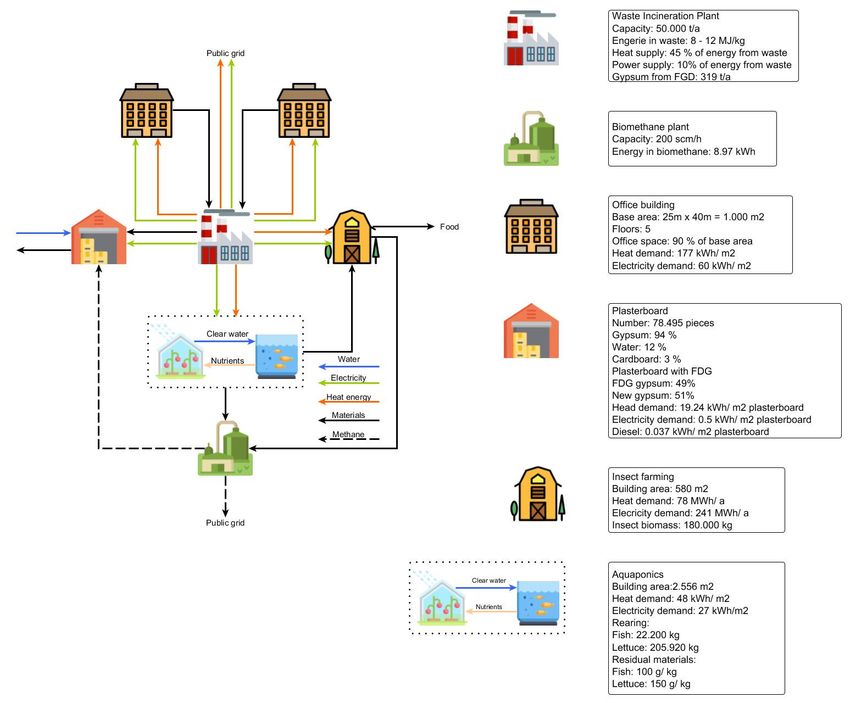
created for illustrative purposes. In the first step, four different commercial/industrial facilities were
created. There relate to two office buildings, a factory for the production of plasterboard, an insect
farming facility, and an aquaponics facility; see Figure 3. The supply of the buildings takes place
through the public grid and depends on the energy mix for Germany. In the second case, the individual
plants were connected to each other and amalgamated with two further plants. In addition, a waste
treatment plant that can recycle the commercial waste and generate energy as well as a bio gas plant to
recycle the organic residues are included. In order to be able to compare these results, comparable
assumptions in terms of dimensions, materials and energy consumption, and production were made
in both models. The environmental effects were quantified as examples through a life-cycle assessment
for these two simulated cases. Furthermore, data from literature was used for the validation of the LCA
of the industrial symbiosis with insect farming, particularly Marchi et al. [58], Smetana et al. [59] and
Halloran et al. [49]. Industrial symbiosis was identified in the scientific and institutional literature as aSustainability 2019, 11, 909 7 of 19
Sustainability 2019, 11, x FOR PEER REVIEW
core concept for the implementation of a circular economy; for instance, by Taranic et al. [25],7Cui
of 19
&
Lui [26], and Baldassarre et al. [27]. The Circular Economy Action Plan of the EU urges the promotion
Circular Economy Action Plan of the EU urges the promotion of innovative industrial processes
of innovative industrial processes including industrial symbiosis. In its revised proposals on waste,
including industrial symbiosis. In its revised proposals on waste, the Commission proposes a
the Commission proposes a clarification of rules on byproducts to facilitate industrial symbiosis (EC,
clarification of rules on byproducts to facilitate industrial symbiosis (EC, Closing the loop—An EU
Closing the loop—An EU Action Plan for the Circular Economy, 2015). The assumed components of
Action Plan for the Circular Economy, 2015). The assumed components of the industrial symbiosis
the industrial symbiosis are described below:
are described below:
Figure 3. Example of individual systems that operate and are supplied separately; source icons:
Figure 3. Example of individual systems that operate and are supplied separately; source icons:
(https://www.flaticon.com/).
(https://www.flaticon.com/).
Office building: The building serves administration or service tasks. The spatial use ranges from
Office
singlebuilding: The building
to multi-room serves administration
office to conference rooms. Based or on
service tasks. The
the available spatial
floor area,use ranges
about 90% from
of the
single to multi-room
area can be used. The office to conference
average rooms. Based
energy consumption on the available
is around 177 kWh/m floor area,
2 for about
heat and 90
60 % of the 2
kWh/m
area can be used.
for electricity perThe
yearaverage
[60]. energy consumption is around 177 kWh/m2 for heat and 60 kWh/m2
for electricity per year [60].
Plasterboard manufacturing: The main materials used in the production of plasterboard are gypsum,
Plasterboard manufacturing:
water, and cardboard. The main materials
The production is mainly used
donein bythe production
mixing of plasterboard
the gypsum with water,areapplication
gypsum,
water,
of theand cardboard.
cardboard, andThe production
drying is mainly
of the boards done
[61]. For by
themixing the gypsum
production with water,
of the gypsum application
board, the main
ofpart
the of
cardboard, and drying of the boards [61]. For the production of the gypsum
gypsum can be either natural gypsum, as in the first case, or FDG (flue gas desulfurization) board, the main
part of gypsum
gypsum, cansecond
as in the be either naturalAgypsum,
example. as in the
total of 78,495 firstare
plates case,
to beor produced
FDG (fluein gas
thedesulfurization)
process.
gypsum, as in the second example. A total of 78,495 plates are to be produced in the process.
Insect farming: In Europe, the production and marketing of insects as food in Europe is governed by
Insect farming:“Novel
the so-called In Europe, the legislation,
Foods” productioni.e.,
andRegulation
marketing (EU)of insects as food in Europe
No 2015/2283. is governed
Being permitted onby
the
the so-called “Novel Foods” legislation, i.e., Regulation (EU) No 2015/2283. Being
market through this legislation, insect farms started to be established particularly in Germany and permitted on the
market through
Switzerland; this
they arelegislation,
feasible forinsect farmssymbiosis
industrial started toduebetoestablished
their energy particularly
consumption, in Germany
as they canand
use
Switzerland; they are feasible for industrial symbiosis due to their energy consumption, as they can
use excess heat for insects farming. For the present case study of industrial symbioses, the chosen
insect species are Gryllus assimilis and Tenebrio molitor. Gryllus assimilis is a cricket whose naturalSustainability 2019, 11, 909 8 of 19
excess heat for insects farming. For the present case study of industrial symbioses, the chosen insect
species are Gryllus assimilis and Tenebrio molitor. Gryllus assimilis is a cricket whose natural habitats
are characterized by sub- or tropical climate. The temperature for the highest rate of reproduction is
around 30 ◦ C. The rearing of Gryllus assimilis is realized with special reactors [62]. A further species
that is considered is Tenebrio molitor (also called mealworm, representing the larval stage of Tenebrio
molitor). These insects have the highest rate of reproduction with an optimal breeding temperature
around 27 ◦ C. Larval rearing is realized in boxes that are stacked in shelves. Both types of insects
do not really need daylight, so the number of lamps in the breeding building are set at a minimum
consistent with work safety. The main electrical energy consumer is process technology. The building
has a light metal roof and walls of concrete blocks including insulation. The floor area for insect
breeding is about 850 m2 . The operating height of the rearing building is approx. 4 m. The produced
insect biomass is around 180,000 kg per year. The heat demand is nearly of 78,000 kWh per year [62].
The electrical energy demand is approx. 241,000 kWh in the same time frame. Fresh air for breeding
is provided six times an hour. A heat exchanger transfers the heat from the exhaust air to the fresh
air. The efficiency of the heat exchanger is valued at 0.4. The special reactors for rearing G. assimilis
have a heat loss. This loss of thermal energy leads to the need to heat up the rearing room around the
reactors. As a result, the electrical energy demand with focus on produced insect biomass in one year
is 1.35 kWh per kg biomass, and with reference to rearing space (this is the only sealed area in the
building. The net rearing area is much larger than the sealed area, as the boxes are placed one above
the other on shelves) is around 284 kWh per m2 and year. The heat demand for produced biomass is
around 0.44 kWh per kg biomass and with reference to the sealed floor is 92 kWh per m2 a year [62].
Aquaponics: From its basic concept, an aquaponics system is already a small industrial symbiosis.
On the one hand, there is plant breeding by hydroponics to grow vegetables, while on the other,
fish farming is aquaculture. The water within the system is circulated, i.e., permanently exchanged
between the plants and fish. The polluted water from the fish breeding, caused by the excretions of the
fish, provides nutrition to the plant system. In this way, the water is purified and then flows back to
the fish. The operation of a system of approximately 2550 m2 can result in 22.200 kg fish and 205.920 kg
vegetables (lettuce) per year. The resulting residues amount to 100 g/kg fish excrements and dead fish,
as well as 150 g/kg plant remains. For this activity, 48 kWh/m2 of heat and 27 kWh/m2 of electricity
is required [63–65].
The single model was expanded to include a waste incineration plant and a bio gas plant for
methane production in order to combine the individual plants to form a complex; see Figure 4. In
this way, the material flows can be optimally distributed and used within the system. Since industrial
symbiosis is the connection of material flows in a small spatial area, the mutual exchange can be
more efficient than with an individual approach. Partially, energy can be generated by the waste
incineration plant from commercial waste of the office buildings. Within the waste incineration plant,
gypsum is generated as a residual material during the cleaning and filtering of the gases; the resulting
FDG gypsum can then be reused for the production of gypsum boards. Organic residues from the
aquaponics, which are produced during the breeding of fish and plants, can be used as food for insects
or for the production of bio methane. The organic residues from insect breeding can also be used for a
bio gas plant. The obtained bio methane can be used to dry the gypsum boards during production.
It is assumed that excess energy is not used in the symbiosis and can be provided to the public grid
for distribution.
Waste incineration plant: The size of the waste incineration plant was dimensioned with a throughput
capacity of 50,000 t/a. Measured in terms of throughput, this corresponds to the smallest waste
incineration plant in Germany (state 2016) [66]. Waste has an average energy content of 8 MJ/t to
12 MJ/t and is assumed to be 10 MJ/t in the model. From the imported energy, 10% can be converted
into electrical energy and 45% into thermal energy by thermal recycling. When the flue gases are
cleaned, about 6.38 kg of gypsum per 1000 kg of waste is produced [67]. A waste incineration plant ofSustainability 2019, 11, 909 9 of 19
50,000
Sustainability t per
2019, 11, year
x FORcould produce
PEER REVIEWfar more electricity and heat and then release them into the 9public
of 19 grid
(see also Supplementary Material). The energy requirement of the other buildings was chosen as the
upper
the upper limitfor
limit forthe
thecalculation.
calculation.Accordingly,
Accordingly, the
the emission results
results are
aremainly
mainlyinfluenced
influencedby
bythethesystem
systemboundary
boundaryatat each
eachLCA.
LCA.
UnlikeUnlike
Bio methane:
Bio methane: bio
bio gas, gas,
bio bio methane
methane can becan
fedbe fedthe
into into the public
public natural
natural gastogrid
gas grid to convert
convert it into it into
electricity
electricity or heat
or heat elsewhere.
elsewhere. The The
size size of the
of the plant
plant is is dimensionedwith
dimensioned withaafeed
feed volume
volume of 200m3 /h,
of 200
which corresponds
m3/h,which corresponds toto aa small
small plant
plant in Germany [68]. The quality requirements for the feed-in feed-in are at
are at least 90%
90 %methane
methanecontent
contentininorder
ordertotofeed
feedthe
thebio
biomethane
methaneinto
intothe
thenatural
naturalgas
gasgrid
grid[69].
[69].This
Thisresults
in an energy content of 8.97 kWh per cubic meter
results in an energy content of 8.97 kWh per cubic meter [70]. [70].
Plasterboard
Plasterboard Manufacturing:
Manufacturing: The FDGThe gypsum
FDG gypsum fromwaste
from the the waste incineration
incineration plant plant is completely
is completely
processed
processed forproduction
for the the production of gypsum
of the the gypsum boards.
boards. TheThe boards
boards then
then consist
consist of of
49%49% FDG
FDG gypsum and
gypsum
51%natural
and 51% naturalgypsum
gypsum[71].
[71].
FigureFigure 4. Example
4. Example of industrial
of industrial symbiosis
symbiosis towardstowards more efficient
more efficient use of material
use of material and energy
and energy flows; flows;
SourceSource icons: (https://www.flaticon.com/).
icons: (https://www.flaticon.com/).
3. Results
3. Results
3.1. Sharing Resources on Household Level
3.1. Sharing Resources on Household Level
First, the environmental effects are shown that result for the life cycle of the respective objects
First, the environmental effects are shown that result for the life cycle of the respective objects
which are individually used, followed by the results for the products’ life cycle under collaborative
which are individually used, followed by the results for the products’ life cycle under collaborative
use. In the second case, there are no further emissions, as these items are already physically present.
use. In the second case, there are no further emissions, as these items are already physically present.
Figure 5 shows the results of the life cycle impact assessment for each everyday household item. The
results indicate that the life cycle of the products bicycle pump, barbecue grill and ladder cause theSustainability 2019, 11, 909 10 of 19
Sustainability
Figure 5 shows
Sustainability 2019, 11,
2019, 11,the
xx FOR
FOR PEER REVIEW
results
PEER REVIEW
of the life
cycle impact assessment for each everyday household 10 of
10 of 19
19
item.
The results indicate that the life cycle of the products bicycle pump, barbecue grill and ladder cause
largest
largest environmental
environmental
the largest impacts,
impacts,
environmental followed
followed
impacts, by the
by
followedthebytool
tool set
theset and
and
tool the
setthe
anddinghy.
dinghy. All of
All
the dinghy.of All
these
these items
of items use non-
these use
itemsnon-
use
renewable
renewable resources,
resources,
non-renewable which lead
whichwhich
resources, to
lead to fossil
fossil
lead fuel depletion.
fuel depletion.
to fossil fuel depletion.
Figure
Figure5.
Figure 5. Results of
5. Results ofthe
of thelife
the life
life cycle
cycle
cycle impact
impact assessment
assessment
impact for each
for each
assessment for each everyday
everyday
everyday household
household item
item (for
household (for the
the (for
item the
barbecue
barbecue
grill are grill
not are not
available available
data for data
the for
impact the impact
assessment assessment
of the fossilof the
fuel fossil fuel
depletion anddepletion
the
barbecue grill are not available data for the impact assessment of the fossil fuel depletion and the and the
consumption
of non-renewable
consumption of resources).
non-renewable resources).
consumption of non-renewable resources).
Figure666shows
Figure
Figure showsthe
shows theresults
the resultsof
results ofthe
of theimpact
the impactassessment
impact assessmentas
assessment assum
as sumfor
sum forall
for alleveryday
all everydayhousehold
everyday householditems,
household items,
items,
when they
when they
when are
they are individually
are individually used.
individually used. Figure
used. Figure 7 shows
Figure 77 shows
shows thethe results
the results of
results of the
of the Monte
the Monte Carlo
Monte Carlo simulation
Carlo simulation for
simulation for the
for the
the
environmentalimpact
environmental
environmental impactresulting
impact resultingfrom
resulting fromthe
from theuse
the useof
use ofshared
of sharedeveryday
shared everydayhousehold
everyday householdobjects.
household objects.
objects.
Figure6.
Figure
Figure Results of
6.6.Results
Results of the
the impact
the impactassessment
impact assessmentasas
assessment sum
as forfor
sum
sum all all
for everyday
all household
everyday
everyday items,
household
household individually
items,
items, used.
individually
individually
used.
used.Sustainability 2019, 11, 909 11 of 19
Sustainability 2019, 11, x FOR PEER REVIEW 11 of 19
(a) (b) (c)
(d) (e) (f)
(g) (h)
Figure 7. Result of the Monte Carlo simulation for the environmental impact resulting from the use
Figure 7. Result of the Monte Carlo simulation for the environmental impact resulting from the use
of shared everyday household objects. (a) Global Warming Potential, (b) Fossil depletion, (c) Marine
of shared everyday household objects. (a) Global Warming Potential, (b) Fossil depletion, (c) Marine
eutrophication, (d) Particulate matter formation, (e) Photochemical oxidant formation, (f) Terrestrial
eutrophication, (d) Particulate matter formation, (e) Photochemical oxidant formation, (f) Terrestrial
acidification, (g) Water depletion, (h) Non-renewable resources—fossil.
acidification, (g) Water depletion, (h) Non-renewable resources—fossil.
The
Theresults
resultsininFigure
Figure66 show
show that
that in
in terms
terms ofof climate
climate change
change impact,
impact, expressed
expressedthrough
throughthe the
greenhouse effect, 115 kg CO 2 eq. are emitted altogether for all the everyday items
greenhouse effect, 115 kg CO2 eq. are emitted altogether for all the everyday items during their life during their life
cycles.
cycles.Furthermore,
Furthermore,approximately
approximately15 15kg
kgofoffossil
fossilenergy
energysources
sourcesare areneeded
neededfor forthe
theproduction
productionand and
the
theuse
useofofall
allthe
theitems.
items.OutOutof
ofthe
thepure
pure mass
mass balance,
balance, COCO22eq.eq.and
andfossil
fossilenergy
energysources
sourcescategories
categories
form
formthe
thelargest
largestquantity
quantityofofthe
thetotal
totalenergy
energydemand
demandfrom fromfossil
fossilenergy
energysources
sourcessuchsuchasashard
hardcoal,
coal,
natural
natural gas and crude oil sums up to 702 MJ along the value chain. The results shown in Figure77are
gas and crude oil sums up to 702 MJ along the value chain. The results shown in Figure are
obtained, assuming that all six household items are shared on average six times per year, plus minus
two times. It can be seen from the individual illustrations of the impact categories that the emissionSustainability 2019, 11, 909 12 of 19
obtained, assuming that all six household items are shared on average six times per year, plus minus
two times. It can be seen from the individual illustrations of the impact categories that the emission
values range widely between the minimum value and the maximum value. This mainly depends on
how often the objects are shared. The sharing ranges from an object that is shared only a few times
to all objects that are shared often. However, it becomes also obvious that the more often objects are
shared, the higher becomes the resource savings potential leading to a decrease of the environmental
impact as no new objects have to be produced.
The results support the assumptions of Georgescu-Roegen [4] regarding the impossibility of
decoupling economic growth and resource consumption as the production of goods and services
requires the use of energy. Therefore, it becomes obvious that the environmental impact is significantly
lower if in the production of the objects uses renewable rather than fossil fuel energy. According to
the energy conservation law, the use of fossil energy resources leads inevitably to greenhouse gas
emissions, while renewable energy use focuses on an energy use free of residues. In the present case,
it can be shown that the shared use of goods leads to a decreased consumption of resources and a
reduced economic growth as less new products are sold. This conclusion on collaborative consumption
complies with the considerations of Georgescu-Roegen [4].
Resource savings increase exponentially with the number of shared usage processes, but there is
a limit to the extent of the shared use in the system. It must be taken into consideration that a very
frequent use of the items leads to faster wear, which may result in the need for an earlier replacement
purchase. This leads to the conclusion that for a sensible multiple use of objects, a better quality of
goods must be ensured, in particular with regard to the longevity of the products as is the scope of
eco-design. Eco-design is a systematic and comprehensive design approach for products to reduce
environmental impact through life cycle design through improved product design. Eco-design’s
goal is to find environmentally sound solutions in an integrated life-cycle analysis in order to reduce
the overall environmental impact of a product. It therefore supplements the classic requirements
for product development, such as functionality, safety, ergonomics and price/performance ratio,
with the requirement of environmental friendliness. Eco-design is thus a comprehensive design task
of sustainable corporate management. With the Eco-design Directive 2009/125/EG, the European
Commission has for the first time created a framework for the definition of product group-specific
minimum requirements. The aim of the directive is to improve the environmental compatibility of
energy-related products, taking into account the entire life cycle by setting eco-design requirements.
Thus, the reference to eco-design need supports the advocates of a green growth position.
3.2. Sharing Resources through Industrial Symbiosis
Figure 8 shows the results of the life cycle impact assessment for each individual component of
the industrial symbiosis. The results indicate that the environmental impact of the insect farming
and the office buildings cause the largest negative environmental impact due to their consumption of
non-renewable resources and energy.Sustainability 2019, 11, 909 13 of 19
Sustainability
Sustainability 2019, 11, 2019,
x FOR11, x FOR
PEER PEER REVIEW
REVIEW 13 of 19 13 of 19
Figure8.
Figure Results
8.Results
Figure ofofthe
thelife
8. Results life cycle
of cycle
the impact
life assessment
cycle assessment
impact impact foreach
eachfor
assessment
for component ofthe
theindustrial
each component
component of industrial symbiosis.
of the industrial symbiosis.
symbiosis.
The results of the impact
The results assessment
of the impact for the industrial
assessment symbiosis in comparison to the sumtoofthethe
The results of the impact assessment for the for the industrial
industrial symbiosis
symbiosis in comparison
in comparison to the sum ofsum of
individual resource use
the individual are shown
resource inare
Figure 9. The principle The
of industrial symbiosis is part of industrial
the individual resource use areuseshown shown
in Figurein Figure
9. The 9.
principleprinciple of industrial
of industrial symbiosis symbiosis
is part is
of part of
ecology and basically
industrial consists in the cooperation of different companies that (financially) benefit from
industrial ecologyecology and basically
and basically consistsconsists in the cooperation
in the cooperation of different
of different companiescompanies that (financially)
that (financially)
each other being
benefit from the motivation
each other beingfor the
the motivation
symbiosis. for Business
the cooperation
symbiosis. in industrial
Business cooperation symbiosis
in industrial
benefit from each other being the motivation for the symbiosis. Business cooperation in industrial
is usually voluntary
symbiosis is and, in
usually most cases,
voluntary and, geographically
in most cases, close and cross-industry
geographically close and or cross-sectoral.
cross-industry or cross-
symbiosis is usually voluntary and, in most cases, geographically close and cross-industry or cross-
Conceptually,
sectoral. it represents
Conceptually, the actual cooperation
it represents of the
the cooperation actors
actual cooperation in a network
of the in
actors of local and
in a network regional
sectoral. Conceptually, it represents the actual of the actors a network of localofand
local and
relations, not only to reduce the environmental impact as much impact
as possible, but also to instigate a
regional relations, not only to reduce the environmental impact as much as possible, but also to also to
regional relations, not only to reduce the environmental as much as possible, but
functioning (industrial)
instigate ecosystem.
a functioning (industrial) ecosystem.
instigate a functioning (industrial) ecosystem.
Figure
Figure9.
Figure 9. Results
Results
9.Results of of the assessment
of the impact impact assessment
assessment for
forthe for the industrial
theindustrial
industrialsymbiosis
symbiosissymbiosis
inin in comparison
comparison to to
comparison thethe
sum toofthe
sum of sum of
the
the
individual individual
resource resource
use.
the individual resource use. use.
4. Discussion
4. Discussion
4. Discussion
An output stream (e.g., (e.g.,
An output residues or waste) fromfrom
oneone
company cancan
serve asasananinput
inputstream
An output stream stream
(e.g., residues residues or waste)
or waste) from one company company
can serve asserve
an input stream stream
(e.g., (e.g.,
(e.g., secondary
secondary raw
raw material)
material) for
for another
another company,
company, or
or the
the excess waste
excess waste heat
heatcan
canbebemade
madeavailable
availableas heat
secondary raw material) for another company, or the excess waste heat can be made available as heat
as heat flowtotoanother
another company. AsAs a result, not only costs but
alsoalso resources
and and energy cansaved
be
flow toflow
another company. company.
As a result, a not
result,
onlynot only
costs costs
but alsobut resources
resources and energy energy can be
can be saved and and
waste andwaste and emissions
emissions reduced. reduced.
Thus, theThus, the formation
formation of industrial
of industrial symbioses
symbioses contributes
contributes to ecological
to ecologicalSustainability 2019, 11, 909 14 of 19
saved and waste and emissions reduced. Thus, the formation of industrial symbioses contributes to
ecological economic activity and improves the environmental performance of participating enterprises.
As can be seen from the results in Figure 5, the results for the industrial symbioses show a decreased
environmental impact in comparison to an individual resource use. The differences resulting in the
resource savings reached up to 2 powers of ten, as can particularly be seen for the impact category
fossil resource depletion. The impact categories climate change, fossil depletion and CED (cumulative
energy demand) for non-renewable resources reached the highest values, as already observed in the
calculations at the household level. This is mainly due to the amount of energy required at all process
levels. Also, for the industrial symbiosis, a basic requirement is the use of renewable energies as energy
source. As mentioned above, the aim of the LCA model is to show through a simplified example how
the emissions change when material flows in the industrial symbiosis are optimized and factories
are combined. The selected factories have intentionally been kept simple for illustration purposes.
Therefore, the focus in the present investigation was on the assessment of the environmental impact
along the life cycle and not on the process-engineering sequence. In the present stage, any effects
or processes that might complicate such an analysis (like for instance rebound effects, the increased
wear, the logistics overhead) have not yet been analyzed in the model. They must be subject to
a later investigation stage as first of all the input data for such an analysis are established in the
scientific community. Although some LCA investigations on industrial symbiosis do exist in scientific
literature, the present investigation is the first one that considers innovative food production through
insect farming.
According to the present investigation results, a sharing approach on the household as well on
the company level leads to material and energy resource savings in terms of weight and volume. In
the present case study of industrial symbiosis, it can be asked how the increased efficiency conditions,
caused by the joint use of secondary raw materials affects price formation. As the use of secondary raw
materials leads to the saving of primary resources, theoretically this could ultimately lead to a lower
price of the products. Practically, this if often not the case as for recycling processes is usually needed
a considerable amount of additional energy. In the case of industrial symbiosis, this disadvantage
does not exist, since waste products without processing and transport become directly secondary raw
materials for the secondary users. At this point, reference is made to a gap in the present analysis,
which could not be sufficiently taken into account in the context of this investigation. Thus, consumer
behavior and consumption patterns are not fully included. Within the framework of the objective of
sustainable development, these play a decisive role. In 2016, Magno et al. [72] conducted a study on
the motivation consumer behavior in a sharing-economy. They asked for the drivers for using online
platforms for sharing-economy. The results showed that the use is above all ecologically motivated.
The users are mainly focused on the reduction of emissions and the avoidance of waste that is finally
the reduction of the personal ecological footprint. Recently, several studies have been carried out
with similar results, e.g., Hamari et al. [73]. It requires the insight and sensitivity of consumers to opt
for sustainable technologies, goods and services, to prefer concepts with low resource consumption
or, for example, to get involved into item sharing. They ultimately generate the business case for
sustainability [74]. They can not only decide what they consume, but whether they consume at all.
Sufficiency is a crucial pillar of degrowth approaches. The time span between two consumption
decisions usually ultimately determines a product’s life time [8].
A third and final dimension to be included in the discussion is the role of policymakers in
preserving scarce resources. In the present context, the reduction of planned obsolescence, which the
authors consider to be practiced to date, needs to be addressed in particular. The results in Section 3.1
focus on the importance of the longevity of produced goods. The longevity determines, how effective
product sharing approaches can operate as a whole. In the European Union, this subject was partially
addressed through the requirements of the Ecodesign Directive (Directive 2009/125/EC). According
to the sharing ideology, the focus is on the use of goods, which is why they wear out faster within
collaborative consumption. If in the future the focus is no longer necessarily on ownership but onYou can also read