2018 State of the EU ETS Report - Andrei Marcu, Emilie Alberola, Jean-Yves Caneill, Matteo Mazzoni, Stefan Schleicher, Wijnand Stoefs, Charlotte ...
←
→
Page content transcription
If your browser does not render page correctly, please read the page content below
2018 State of the EU ETS Report

      Andrei Marcu, Emilie Alberola, Jean-Yves Caneill, Matteo Mazzoni,
Stefan Schleicher, Wijnand Stoefs, Charlotte Vailles and Domien Vangenechten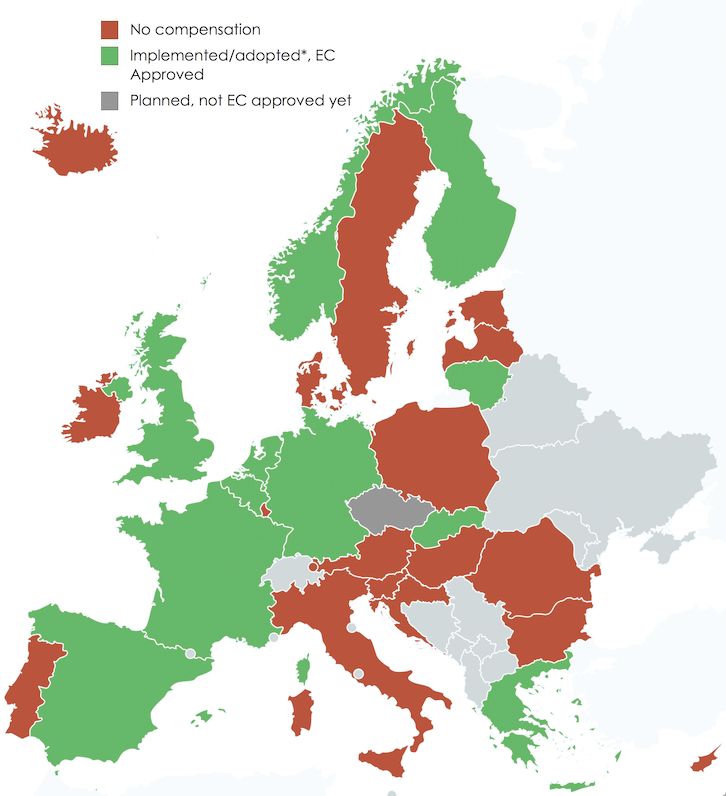
ERCST, Wegener Center, Nomisma Energia, I4CE and Ecoact

Disclaimer
The views expressed in this Paper are attributable only to the authors in a personal capacity, and not to
any institution, which they are associated with, or to the funders or supporters of the Paper.
This Paper has been the subject of stakeholder consultations, including a workshop convened by the
authors with stakeholders including NGOs, think tanks, academia, policy makers, market participants
and representatives of industry.
A grant was provided by the German Federal Ministry for the Environment, Nature Conservation and
Nuclear Safety (BMU) to disseminate this paper through a number of workshops in EU Member State
capitals.

The European Roundtable on Climate Change and Sustainable Transition (ERCST) is a Brussels based initiative
under the umbrella of the International Centre for Trade and Sustainable Development (ICTSD), and is intended to
provide a neutral space where policy-makers and regulators can meet stakeholders, and discuss climate change
policy and a sustainable transition to a low-GHG economy. While focused on European climate policy, this initiative
intends to fully recognize, and incorporate in its activities and thinking, the global dimension of climate change
policy. Established in 1996, ICTSD is a non-partisan, non-profit, Geneva-based international organization,
registered as an association in accordance with article 60 of the Swiss Civil Code.
The Wegener Center for Climate and Global Change is an interdisciplinary, internationally oriented institute of the
University of Graz, which serves as a core research center for pooling the competences of the University in the
areas climate change and the related issues in climate physics, meteorology, and economics. An evidence based
approach to the transformation of energy systems, innovative analytical modeling concepts, and the design of
energy and climate policies are focal points of current research activities.
Nomisma Energia is an independent research company that deals with energy and environmental issues,
committed to understand energy markets and their short and long-term trends. Nomisma Energia covers all issues
concerning energy markets and environmental policies, which extend from fossil fuels markets to renewable
energies, from industrial and market regulation to development of new technologies, from international politics to
local energy planning. Thanks to its independency, Nomisma Energia is able to provide objective and reliable know-
how for an in-depth comprehension of the energy sector.
I4CE is an initiative of Caisse des Dépôts and Agence Française de Développement. The Think Tank
provides independent expertise and analysis when assessing economic issues relating to climate & energy policies
in France and throughout the world. I4CE aims at helping public and private decision-makers to improve the way in
which they understand, anticipate, and encourage the use of economic and financial resources aimed at promoting
the transition to a low-carbon economy. I4CE benefits from a large network of partners.
The EcoAct Group an international advisory consultancy and project developer that works with clients to meet the
demands of the Paris Agreement. We offer solutions to large and complex multinational organizations for their
sustainability challenges We believe that climate change, energy management and sustainability are drivers of
corporate performance and seek to address business or organizational problems and opportunities in an intelligent
way. The EcoAct Group includes Alliantis, Carbon Clear and Climate Pal.

                                                                                                                 II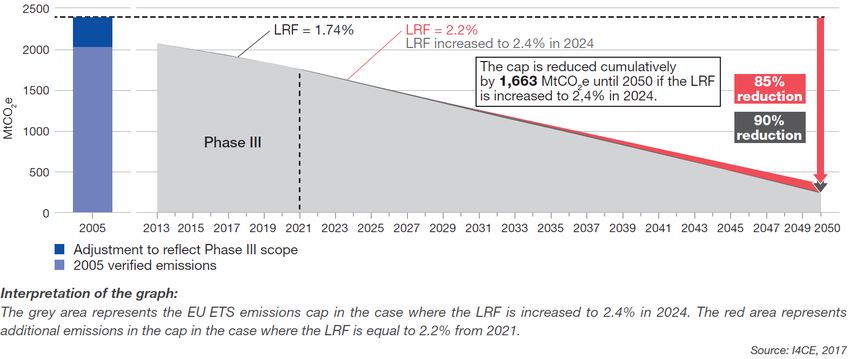
ERCST, Wegener Center, Nomisma Energia, I4CE and Ecoact

Table of Contents
Executive Summary ................................................................................................................ 1
1      Background ..................................................................................................................... 2
2      A EU ETS “fit for purpose” ............................................................................................... 3
3      Relevant policy and governance issues ............................................................................ 4
    3.1   Phase 4 review ...................................................................................................................... 4
      Open issues .......................................................................................................................................... 6
      Expectations after P4 review ................................................................................................................ 7
    3.2   Relevant issues from the Energy Union.................................................................................. 8
    3.3   Relevant issues from the new EU long-term climate strategy .............................................. 10
      Technology neutrality......................................................................................................................... 10
      Long-term targets ............................................................................................................................... 10
4      Environmental delivery ..................................................................................................10
    4.1        Delivery against the trading period target ........................................................................... 11
    4.2        Delivery against EU long-term domestic environmental commitments ................................ 11
    4.3        Delivery against international environmental commitments ............................................... 12
    4.4        Lessons learned and issues to understand better................................................................. 13
5      Economic delivery ..........................................................................................................13
    5.1    Emission and decarbonization trends .................................................................................. 13
    5.2    Is the EU ETS a driver for change? ........................................................................................ 16
      Interactions of the EU ETS with other policies ................................................................................... 16
      Focus on decarbonization in the power sector .................................................................................. 17
      Deployment of new technologies ...................................................................................................... 19
      Use of auction revenues ..................................................................................................................... 20
    5.3    Monetary impacts and carbon leakage ................................................................................ 21
      Carbon leakage: direct costs .............................................................................................................. 22
      Carbon leakage: indirect costs ........................................................................................................... 23
6      Market functioning .........................................................................................................24
7      Making the EU ETS ‘fit for purpose’ ................................................................................28
    7.1   Restoring the short- term scarcity through the MSR ............................................................ 28
    7.2   Dealing with policy interactions and uncertainty ................................................................. 29
    7.3   Making the EU ETS governance operational......................................................................... 30
    7.4   Managing carbon leakage risks ............................................................................................ 31
    7.5   Aligning the EU ETS with the EU long-term ambition consistent with the Paris agreement .. 31
    7.6   Provide financial support for low-carbon competitiveness of EU industry and the transition
    towards a low-carbon economy ...................................................................................................... 31
8      Bibliography ...................................................................................................................33

                                                                                                                                                           III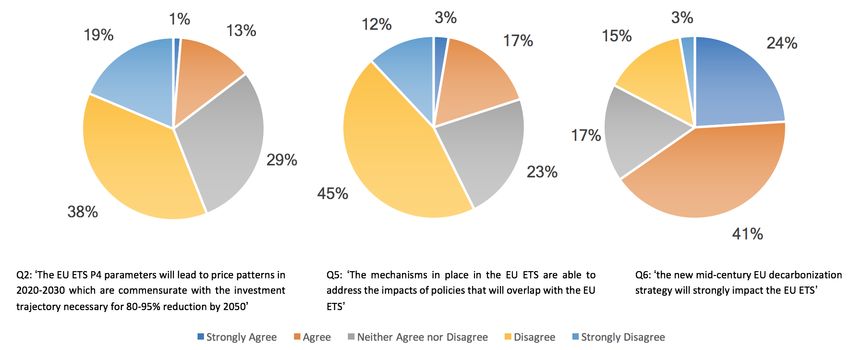
2018 State of the EU ETS Report
                   Andrei Marcu, Emilie Alberola, Jean-Yves Caneill, Matteo Mazzoni,
            Stefan Schleicher, Wijnand Stoefs, Charlotte Vailles, and Domien Vangenechten1

                                           Executive Summary
    The EU Emissions Trading System (EU ETS) is important through its role as the “cornerstone” of EU
    climate change policy as well as a “role mode”, and “pioneer” for carbon markets. It is important that,
    in addition to the regulatory requirements, it be subjected to a thorough and independent review, to
    discover if it delivers on explicit, and what have become “expected” objectives, as well as discover any
    issues that need to be better understood. Availability of public data has been identified as a barrier to
    some parts of this analysis.
    The EU ETS can be seen as being expected to deliver in a number of different areas: environmental
    targets in different timeframes, decarbonization in an economically efficient way, including protection
    against the risk of carbon leakage, and good market functioning and price discovery.
    The recently concluded review for Phase 4 (P4) has attempted to tackle a number of outstanding
    issues, and its new parameters and architecture will strongly influence the EU ETS’ functioning from
    here on. Current price scenarios indicate rising prices during P4, but a lot of issues still remain open,
    up for implementation, or up for review, which could significantly influence these projections.
    Other EU climate legislation in the pipeline, such as the governance of the Energy Union Regulation
    and the new EU long-term climate strategy, will include elements that will leave their mark on the EU
    ETS, its functioning and its ability to deliver, as well possibly require future reviews and revisions. A
    “sentiment survey” conducted as part of this report seems to indicate that stakeholders are unsure of
    the effectiveness of these changes, but recent price trends indicate a willingness to give it the benefit
    of the doubt.
    Despite the fact that emissions increased in 2017 for the first time in 7 years, there is still little doubt
    that the EU ETS is delivering on its short-term environmental targets. However, the post-2020 Linear
    Reduction Factor (LRF) will not be sufficient to put the EU ETS on the pathway outlined in the ‘2050
    Roadmap’, and reaching the goal set out in the Paris Agreement will surely require additional efforts.
    While the sectors under the EU ETS are decarbonizing, especially the power sector, it was only
    marginal in driving this process. A number of reasons, including the inclusion of international credits,
    the economic crisis, as well as policy overlaps, have led the market to be oversupplied, keeping EUA
    prices down.
    The recent increase in CO2 prices might indicate that this will change in the future, and our analysis
1 Andrei Marcu is the Director of the ERCST, Emilie Alberola is Head of Climate policy and market mechanisms at
EcoAct, Jean-Yves Caneill is a Senior Advisor to ERCST, Matteo Mazzoni is a Market Analyst at Nomisma Energia,
Stefan Schleicher is Professor of Economics at the Wegener Center on Climate and Global Change, Wijnand Stoefs
is a Researcher at ERCST, Charlotte Vailles is a Project Manager at I4CE, and Domien Vangenechten is a Junior
Researcher at ERCST.

                                                                                                                   1
The recent increase in CO2 prices might indicate that this will change in the future, and our analysis
shows that prices of €10-30/ton could be sufficient to make low-emission alternatives compete with
coal and gas during 2020-2030.
Monetary impacts have so far mostly been limited to combustion of fuels installations, while free
allocations have covered costs for the industrial sector. However, it must be noted that, contrary to
Phase 2 (P2), free allocation is much more in balance with actual emissions during Phase 3 (P3), halting
the growth or even decreasing the cumulated surplus of allowances in most industrial sectors.
Carbon leakage risks from direct costs have so far seemed to be mitigated, but indirect costs are a
continuous concern in terms of the provisions that apply to it. Since there is no harmonized approach,
not all Member States have compensation schemes in place, meaning a potential distortion exists
across Europe.
Our eight KPIs to evaluate the functioning of the market show the market functioned slightly better
compared to last year: three out of the eight tracked KPIs exhibited an improvement, while only two
KPIs showed a worsening performance. Despite that some critical points remain, we can state that the
market is functioning well, and even showing signs of improvement.
To ensure that the EU ETS is ‘fit for purpose’ and ready to face future challenges, we identified a
number of issues that will need to be monitored in the coming years, including:
    •   Restore short-term scarcity through the Market Stability Reserve;
    •   Make the EU ETS resilient to policy interactions and to policy uncertainty;
    •   Make the EU ETS governance operational;
    •   Manage carbon leakage risk;
    •   Align the EU ETS with the long-term EU climate ambition, compatible with Paris Agreement
        goals;
    •   Provide financial support for low-carbon competitiveness of EU industry and the transition
        towards a low-carbon economy.

1 Background
The EU ETS recently completed its P4 review, which can be seen as an important moment. With this
review, the European institutions feel that they have prepared the EU ETS for life until 2030, in a world
where there are National Determined Contributions (NDCs) under the Paris Agreement, and other ETSs
operating that the EU ETS can be compared to.
As any other undertaking, the EU ETS requires, periodically, an assessment regarding its well-functioning
and the delivery of its objectives. In this respect, the EU ETS is not different, and should not be treated
differently, from any other activity. Article 10(5) of the EU ETS Directive provides for such a yearly
assessment, to be carried out by the European Commission.
The revised EU ETS directive adds the obligation to also report on ‘other relevant climate and energy
policies’, and the proposed Governance of the Energy Union legislation requires this ‘functioning of the
carbon market report’ to feed into the yearly ‘State of the Energy Union Report’. This is very
encouraging.
The “State of the EU ETS” Report is not intended to duplicate or replace existing authoritative work,
especially that undertaken by the European institutions. It aims to be an independent contribution to

                                                                                                           2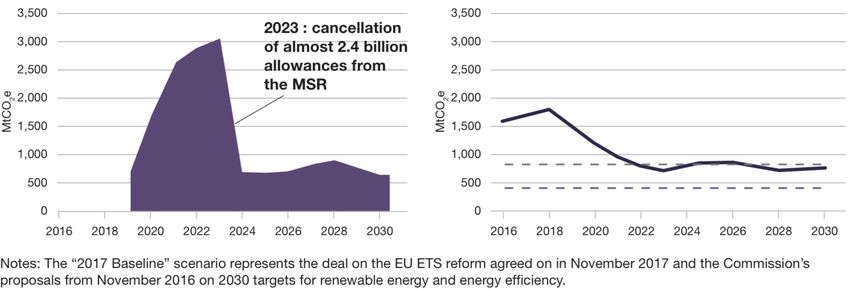
the policy debate to ensure that the EU ETS is “fit for purpose” and to discuss the current state of play in
the EU ETS.
While the temptation will always be there, as a rule, it will try to abstain from providing solutions and
making recommendations. It focuses on identifying issues and making assessments. It is intended as a
“snapshot”.
While the EU ETS is a complex instrument, and for some a world in itself, it does not exist in a vacuum.
For all its faults, the EU ETS should not be compared to an ideal world, but to real options that would be
available to address climate change.
It must also be remembered that the EU ETS operates in a highly interconnected environment and is
affected by climate change and other polices at different levels: global, EU and EU Member State. It has
to live with that reality, and respond to it.
The prolonged economic slump that it was subjected to, together with other factors, has created a
systemic surplus, which is a reality. In addition, the EU ETS was also created lacking the mechanism to
mimic reduced supply as a result of reduced demand. Both these issues are being addressed, but the
solutions, while identified and legislated, will only become operational in the near future.
Meanwhile, the EU ETS has to continue to internalize new developments that are relevant. This includes
Brexit and international efforts to address climate change. COP 21 in Paris has brought the Paris
Agreement and the framework for an ever-increasing level of ambition, especially carbon neutrality by
the second half the century, as well as an upcoming IPCC special report on 1.5°C. This has “changed
everything”, and with it the EU ETS.
Finally, as mentioned, the EU is not the only jurisdiction pricing carbon anymore. It is now part of a
growing movement towards carbon pricing, with some jurisdictions that may even have higher levels of
carbon prices than the EU ETS.

2 A EU ETS “fit for purpose”
In order to assess whether the EU ETS is “fit for purpose”, we first need to identify the parameters which
measure its success. Simply put, “what do we expect the EU ETS to deliver?”
In many cases, there are no clear quantitative indicators for what the EU ETS may be expected to
deliver. Some of the assessments will have a level of subjectivity and political judgement attached to
them. In other cases, objective, quantitative indicators may emerge gradually, as experience is gained
with these mechanisms, both in the EU, but also around the world. Finally, in some cases experience
with other markets may provide benchmarks.
In this context, we need to remind ourselves that Article 1 of the EU ETS Directive outlines its broad
objectives:
    “This Directive establishes a scheme for greenhouse gas emission allowance trading within the
    Community in order to promote reductions of greenhouse gas emissions in a cost-effective and
    economically efficient manner. This Directive also provides for the reductions of greenhouse gas
    emissions to be increased so as to contribute to the levels of reductions that are considered
    scientifically necessary to avoid dangerous climate change.”
Some objectives are clearly enunciated and identified, while some stakeholder may see other objectives
as implicit. As also mentioned in the 2017 State of the EU ETS report (Marcu et al, 2017), the direct
deliverables include:

                                                                                                          3
1. Environmental delivery. Does it deliver against absolute environmental targets as expressed in the
   EU ETS Directive and the EU’s long-term climate change objectives?
2. Economic delivery. The reference in Article 1 of the EU ETS Directive could be interpreted as
   referring to macro-economic efficiency and cost-effectiveness for compliance. Alternatively,
   economic efficiency can be seen as being dynamic, while cost effectiveness as a more snap shot
   view. As part of its economic delivery, the EU ETS should also provide effective, and proportional,
   protection against the risk of carbon leakage.
3. Market functioning. It is worth having a market only if it functions well and leads to good price
   delivery.
Right or wrong, other “deliverables” have come to be “expected”. For example, the good functioning of
the EU ETS has come to be equated, wrongfully in or view, with the delivery of a “right price” which
would incentivize certain technologies or actions.
Another important deliverable which the EU ETS increasingly is expected to deliver, is that of a long-
term (competitive) advantage for Europe. Indeed, stakeholders are of the opinion that EU ETS provisions
should help accelerate the transition to a low-carbon economy by:
    •   Channeling sufficient investments;
    •   Creating the premises for a low-carbon product market;
    •   Helping to address social impacts associated with the transition to a low-GHG economy;
    •   Ensuring the right level of protection for industry, both for direct and indirect costs;
    •   Incentivizing behavioral and systemic change.
One additional delivery is the role that the EU ETS has in being a pioneer and promoting carbon
markets as a tool for addressing climate change, and proving the incentive to work towards an
internationally linked carbon market. There have been many studies, including the Annual ICAP Report
(ICAP, 2018), which shows how carbon pricing has spread over the globe, with carbon markets playing a
prominent role.
With the launch of the Chinese nationwide carbon market at the end of 2017, the coverage of emission
trading has tripled in little more than 10 years (ICAP, 2018). While this is not a domestic EU delivery, it is
nevertheless critical, given the importance of having other operational carbon markets, and the ability
to deliver on EU ETS objectives, without jeopardizing the competitiveness of EU industry.
In examining these areas of delivery, the Report will focus on:
       a) Quantitative and qualitative indicators for the functioning of the EU ETS, put in the broader
           context of the EU and international policies with which it interacts.
       b) Lessons learned, and emerging issues.
       c) Areas that require further examination.

3 Relevant policy and governance issues
3.1 Phase 4 review
In July 2015, the Commission presented a legislative proposal to revise the EU ETS for the post-2020
period. After six Trilogue meetings, making the process longer than many experts had anticipated, a
provisional agreement was reached on November 9, 2017. The Directive was adopted on March 14,
2018 and came into effect on April 8.

                                                                                                            4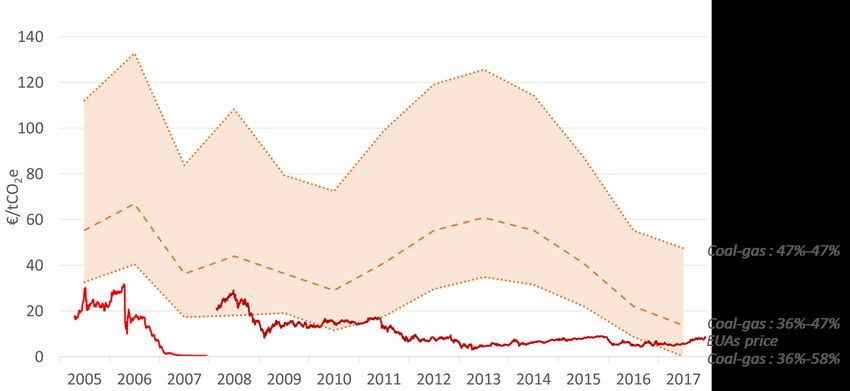
With this review, the European institutions have tried to tackle a number of issues, including addressing
the historical surplus of EUAs, making the EU ETS supply more responsive to changes in demand and
able to deal with future oversupply, increasing the funds available for innovation and modernization,
and making free allocation more reflective of actual production and emission levels.
A number of parameters have remained unchanged, such as the share of auctioning and free allocation
(57%-43%2), the inclusion rules and auctioning level (15%) for domestic aviation, and the fact that
shipping emissions are not yet included, awaiting action to be taken by the IMO. Other parameters will
change in P4 compared to P3, for which a selected overview can be found in Table 1.
                               Table 1. Selected list of changes between Phase 3 and Phase 4
           Parameter                              Phase 3                                 Phase 4
End-year cap                   1834mt in 2020                                  1372mt in 2030

LRF                            1.74%                                           2.2%

Flexibility of Auction Share   /                                               Reduction of up to 3% of the share of allowances to
(In light of CSCF avoidance)                                                   be auctioned

Backloading                    Auction of 900m allowances postponed            900 million allowances backloaded in 2014-2016 will
                               (400m in 2014, 300m in 2015 and 200m in         be transferred to the MSR rather than auctioned in
                               2016)                                           2019-2020, and consequently up for invalidation in
                                                                               2023
MSR                            12% intake rate                                 24% intake rate for the first 5 years

Invalidation of allowances     /                                               From 2023, yearly invalidation of allowances above
in the MSR                                                                     the number of allowances auctioned the year before

Voluntary cancellation of      /                                               Option for Member States to cancel allowances from
allowanced by Member                                                           their auction share to counteract the impact of closing
States                                                                         down electricity generation capacity, up to the
                                                                               average verified emissions over the last five years
                                                                               preceding the closure
Carbon leakage list criteria   Carbon costs ≥ 5% AND Trade intensity ≥ 10%              Trade intensity * emissions intensity
(Qualitative assessment                            //                                                    > 0.2
limit)                         Carbon costs ≥ 30% OR Trade intensity ≥ 30%                             (> 0.15)

Benchmark rates                Ex-ante decided, as calculated by the           Will reflect actual intensity changes in the sector
                               Commission (fixed)                              (annual reduction rates capped at 0.2% minimum, and
                                                                               1.6% maximum) as calculated by the Commission.
                                                                               Benchmark values will be updated twice for P4
Adjustment of free             Only reduced when production levels             Reflect actual changes in production level on the basis
allocation based on change     decrease by a significant amount (50%, 75%      of a rolling average of 2 years. Changes above a 15%
in production levels           and 90%)                                        threshold with respect to the baseline period should
                                                                               be reflected in the amount of free allowances
                                                                               allocated
Free allocation to sectors     80%, linearly decreasing to 30% by 2020, with   30% until 2026, linearly decreasing to 0% by 2030
not deemed at risk             a view to reach 0% in 2027 (30% for district    (30% for district heating)
(including for district        heating)
heating)
Indirect costs                 To be decided by Member States in               To be decided by Member States in accordance with
compensation                   accordance with State Aid guidelines            State Aid guidelines, but a non-binding limit of 25% of
                                                                               auction revenues, including obligation to report
                                                                               reasons to go over this limit + enhanced transparency
                                                                               rules for use of auction revenues
Carbon Market Report           Functioning of the carbon market (including     Explicitly states that the Commission shall report on
                               auctions, liquidity and the volumes traded)     ‘other relevant climate and energy policies’

2The percentage of free allocation can increase up to 3% during Phase 4, at the expense of the auctioning share, to
avoid the application of the cross-sectoral correction factor

                                                                                                                                         5
New Entrants Reserve           5% of total allowances (around 780m              Non-allocated allowances from P3 + 200m allowances
                               allowances, of which 300m went to NER300)        placed in the MSR

Modernization fund             /                                                2% of total allowances. Can be increased by up to
                                                                                0.5% if the full flexibility for avoiding the CSCF is not
                                                                                used
Innovation fund                NER300: 300m allowances (originating from        400m + 50m unallocated allowances from the MSR +
                               the New Entrants Reserve)                        unspent allowances from NER300 + Can be increased
                                                                                by up to 50m if the full flexibility for avoiding the CSCF
                                                                                is not used
                                                                                                                  3
One-off flexibility from the   /                                                A number of Member States are allowed to achieve
                                                                                                                              4
EU ETS, included in the                                                         their ESR targets by using a limited share of their ETS
Effort Sharing Regulation                                                       allowances that would otherwise be auctioned. There
                                                                                is a limit of 100mt CO2 at EU level over the P4 period

Article 10c derogation on      Certain Member States with GDP per capita        The scheme has been extended to 2030, for Member
option for transitional free   below 50% of the EU average could give           States with GDP per capita below 60% of the EU
allocation for the             limited transitional free allowances to power    average. More limitations have been added, such as
                               sector installations in operation before 2009.   that the transitional free allowances cannot be used
modernization of the
                               Set to go to zero by 2020.                       for highly emission-intensive electricity generation
energy sector

Open issues
While the main parameters for P4 have been decided, a number of issues still remain open, or up for
review. These issues might impact the functioning of the EU ETS and its price throughout P4, in ways we
cannot fully predict.
The possible review, which may be triggered as a result of the implementation provisions in the Paris
Agreement, is arguably the most important open issue. At the same time, Article 30 of the Directive
states that the Commission should ‘report’ on each global stocktake (2023 and 2028 in P4), with the
view to propose amendments (e.g. changes to the LRF) or additional policies or measures needed to
reach the ‘necessary greenhouse gas reductions’. Also in light of Article 30, climate policy measures in
other major economies should be kept under review, which might have implications for the carbon
leakage measures.
Besides article 30, which captures a general obligation to review, other reviews in the pipeline for P4
include: the adoption of the new carbon leakage list in 2019; the reviews of the MSR in 2021 and 2026;
and updates of the benchmarks for 2021-2025 and for 2026-2030.
There are other open and unclear issues beyond these ‘known’ reviews:
•    Brexit will happen in 2019, but it is still unclear how it will unfold, and how Great Britain will relate
     to the EU ETS;
•    CORSIA’s pilot phase will start in 2021, but it is unclear whether the scheme will be deemed
     sufficiently ambitious to keep international aviation out of the ETS;
•    A paragraph was added in the preambles of the P4 Directive, stating that either the IMO or the EU
     ‘should start action’ by 2023. What this means, or what the scope of a possible inclusion of maritime
     emissions would entail, still remains unclear.

3Luxemburg,   Sweden, Denmark, Finland, The Netherlands, Austria, Belgium, Ireland and Malta
4Ranging   from 2% to 4% of the country’s 2005 emissions

                                                                                                                                             6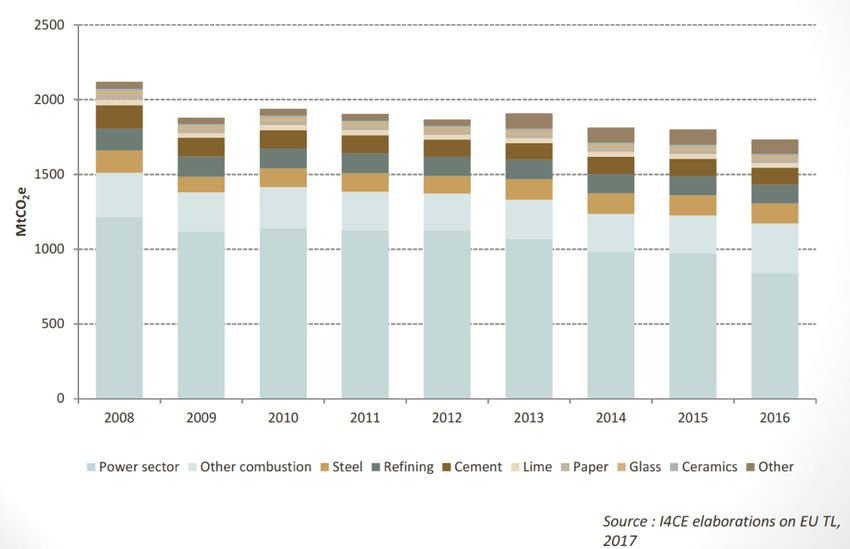
Expectations after P4 review

Price forecast scenarios
While this report is not a market analysis report, it is intended to provide a view on the forecasts that
some of the analysts have put forward at this special time, when there are high hopes that, with the
current P4 reforms, the EU ETS will regain its luster. The one variable that was factored in was the
assumption Brexit/no Brexit. We hope for this forecast to become a benchmark against which future
years can be judged, as well as provide a history, for future reference, of forecasts every year.
Figure 1 indicates that the Brexit scenarios seem to show a lower price in the early period, with the price
then surpassing the no-Brexit scenario post 2020. The crossover point varies, but these forecasts are in
general directional in the story they tell. The price differential also increases towards the end of P4, if
the EU is to maintain the same level of effort and achieve its targets without the UK.
      Figure 1. EUA price scenarios for Brexit/no Brexit, with EU targets of 30% RES and 30% EE by 2030.
                              35.00

                              30.00

                              25.00
               Price (Euro)

                              20.00

                              15.00

                              10.00

                               5.00

                               0.00
                                   2016         2018            2020    2022           2024        2026           2028           2030
                                          Nomisma- Brexit              ICIS - Brexit                      PointCarbon - Brexit

                                          Nomisma - no Brexit          ICIS - no Brexit                   PointCarbon - no Brexit

                                                Source: Nomisma Energia, ICIS and PointCarbon, 2018
                                                                                          Note: PointCarbon price scenario is for 27% RES and 30% EE

Market Sentiment Survey
Stakeholders claim that market sentiment has played an important role, more so than fundamentals, in
the behavior of the EU ETS. As a second part of what we hope will be a yearly update which can be
benchmarked, we have done a Market Sentiment Survey. For this purpose, we sent out a short survey of
6 statements5 to 118 persons6 which we believe are “players & stakeholders” in EU ETS. The sample

5The following statements could be answered with Strongly Agree – Agree – Neither Agree nor Disagree – Disagree – Strongly
Disagree:
    1.   The EU ETS governance will provide a stable and predictable framework for an investment signal.
    2.   The EU ETS Phase 4 parameters will lead to price patterns in 2020-2030 which are commensurate with the investment
         trajectory necessary for 80-95% reduction by 2050
    3.   The EU ETS will provide an advantage for the EU business community.
    4.   The EU ETS will require significant changes to the MSR after the 2021 review
    5.   The mechanisms in place in the EU ETS are able to address the impacts of policies that will overlap with the EU ETS.
    6.   The new mid-century EU decarbonization strategy will strongly impact the EU ETS.

                                                                                                                                                  7
includes policymakers from EU Member States, industrial operators, traders, and civil society. They were
selected based on our judgement, and are not intended as a statistically representative. In total, we
received 75 anonymous responses, representing a response rate of 63,5%.
In examining the outcomes, the following observations captured our attention, which gives an
interesting indication of the general sentiment of stakeholders with respect to the EU ETS. All graphs
can be reviewed in the Power point annexed to the Report.
Figure 2. Results for survey questions 2, 5 and 6.
A first observation is that stakeholders are not convinced that the current EU ETS parameters will be
sufficient to reach the EU’s long-term environmental targets: stakeholders seem divided in their view on
whether or not the EU ETS governance will provide a stable and predictable framework for an
investment signal, and only 14% of respondents agree with the statement that price patterns in P4 will
be commensurate with an investment trajectory necessary to reach the 2050 targets. Moreover, 65%
thinks that the new mid-century decarbonization strategy, which will possibly lead to higher targets for
the ETS sectors, will have a strong impact on the EU ETS.
Secondly, stakeholders expect that the overlap of climate policies will remain a pressing issue during P4,
since only 20% of respondents think that the current EU ETS instruments will be able to address the
impacts of overlapping policies.
Finally, stakeholders are divided on the question whether the EU ETS is beneficial for EU industry and
businesses: while 36% of respondents think the EU ETS will provide an advantage for the EU business
community, 36% disagree with that statement. At this time, it is not a ringing endorsement, but these
are early days for stakeholders to react to the P4 EU ETS reform.
3.2 Relevant issues from the Energy Union
The EU ETS is one of the five core policy areas of the Energy Union, and the reform for its fourth phase
can be seen as part of a broader climate and energy reform package. In November 2016, the
Commission released the “Clean Energy for all Europeans” package, including a review of the Renewable
6
32 representatives of EU Member States, 30 (public) research institutes (Think Tanks, Universities and NGOs), 20
representatives of industrial sectors, 19 representatives of the energy sector, 6 MEPs and 17 ‘others’ (which include banks,
exchanges and private analysts).
8Energy (RES) Directive and Energy Efficiency (EE) Directive. This package also proposed a Regulation on
the Governance of the Energy Union, which aims to ensure that policies and measures at EU and
national level are "coherent, complementary and sufficiently ambitious," ultimately allowing the
delivery of the Energy Union and its goals.
Ensuring the coherence and complementarity of policies should include ensuring that different EU and
national climate policies do not impact each other’s effectiveness. However, there has policy overlap
between the EU ETS and other policies in recent years: the unmanaged effects of overlapping climate
policies, both at the EU (e.g. RES and EE Directives) and national level (e.g. coal phase-out), have been
one of the factors that have hindered the effectiveness of the EU ETS as a driver of decarbonization.
To ensure the efficient functioning of the EU ETS, these overlaps need to be recognized, quantified, and
managed. This should be done at the right policy level – that is, at the level that has authority over ALL
the policies that overlap. In the case of the EU ETS, RES and EE, this would be at the level of the Energy
Union.
The amendments for P4 include a number of provisions that aim to, explicitly or implicitly, address the
effects of these overlaps:
• Voluntary cancellation of allowances by Member States: in the event of closure of electricity-
generation capacity due to national policies, Member States may cancel allowances from their
auction share to counteract the impact,
• Market Stability Reserve: the MSR was introduced to address the historical surplus of
allowances in the market, as well as correct for impact if any overlap that may occur,
• Functioning of the carbon market report: states explicitly that the Commission shall include
‘other relevant climate and energy policies’ in the report.
While the inclusion of such provisions can only be welcomed, one could argue that some of the
interventions are not at the appropriate level. Indeed, the EU ETS is not the place to analyze interactions
between itself and other ‘relevant climate and energy policies’, nor is it the place where the decision
should be made of ‘what to adjust’. The assumption seems to be that it is the EU ETS that will be in some
way “adjusted “, with no consideration being given to adjusting any other policy.
As mentioned earlier, the ‘raison d’être’ of the Governance of the Energy Union Regulation is to ensure
that policies and measures at various levels are coherent, complementary and sufficiently ambitious. As
such, establishing a framework for addressing overlap between different elements of the Energy Union
should ideally be done in the Governance Regulation. At this level, clear provisions should be adopted
that stipulate who should analyze and quantify the overlap, and how the decision should be made, in a
transparent and predictable manner, on which policy instrument should undergo the adjustment.
However, the Commission proposal for the Governance Regulation does not include any provisions to
address this overlap. It does stipulate that Member States should describe and assess overlap and
interactions between national policies, but there is no framework introduced to address interaction with
policies at the EU level. The general approach adopted by the Council also does not include any
amendments to address overlap.
The European Parliament does seem to have recognized the issue, and has adopted some amendments
to address it:
• Article 8 (Analytical basis of the integrated national energy and climate plans): “The
assessment shall include a quantitative or qualitative evaluation of any documented interactions
between national policies and measures, and Union climate and energy policy measures.”
9• Article 25 (Assessment of progress): The Commission shall assess:
o “the overall impact of the policies and measures of integrated national plans on the
operation of the EU ETS.”
o “the accuracy of Member State estimates of the effect of national level overlapping
policies and measures on the supply-demand balance of the EU ETS, or, in absence of
such estimates, conduct its own assessment of the same impact.”
As the Governance Regulation is currently under Trilogue negotiations, it remains to be seen whether
these amendments will be included in the final text.
3.3 Relevant issues from the new EU long-term climate strategy
Published in 2011, the “Roadmap for moving to a competitive low carbon economy in 2050” (2050
Roadmap) provided the EU with a long-term climate strategy. Due to changing circumstances, such as
the Paris Agreement in 2015 and the falling cost of renewables, the European Commission is currently in
the process of preparing a new document, a “Strategy for long-term EU greenhouse gas emissions
reduction”, which the EU Council has requested by the first quarter of 2019 (European Council, 2018).
How this new strategy will settle different aspects of the new EU long-term climate strategy will
inevitably have implications for the future of the EU ETS – most critically on the assumption of
technology neutrality, and (new) long-term targets.
Technology neutrality
The current 2050 Roadmap is built upon an assumption of technology neutrality. As such, it does not
push for any particular technology, but recognizes a market approach to decarbonization: it relies on the
EU ETS to deliver decarbonization in a cost-effective way for the sectors and installations it covers.
However, given the magnitude of the decarbonization challenge, the new document could, in principle,
deviate from technology neutrality (e.g. through public support for a particular type of infrastructure), in
which case one can ask the question whether the EU ETS will still be considered to be the main driver of
decarbonization in the EU.
Long-term targets
One of the most important reasons that a new long-term climate strategy is needed, is the Paris
Agreement, and the increased level of ambition it promotes. To deliver on the 1.5°C and 2°C goal, the EU
will have to go beyond the 80-95% by 2050 decarbonization scenarios it envisaged in 2011. The EU will
have to achieve carbon neutrality by mid-century, and negative emissions shortly after. More ambitious
long-term emission targets could require faster decarbonization of EU ETS sectors, perhaps through a
higher LRF, which would put upward pressure on EUA prices.
The concrete implications of carbon neutrality will depend on how the new climate strategy envisages
the distribution of effort between ETS and non-ETS sectors. ETS sectors could still emit if non-ETS sectors
can compensate adequately, or through the introduction of carbon capture and storage (CCS).
Alternatively, ETS sectors could ultimately have to become net sinks. Of course, the higher the expected
contribution from ETS sectors, the more upwards pressure on EUA prices in the coming decades.
4 Environmental delivery
If the EU ETS is to be considered successful, environmental delivery is key. However, this delivery must
be seen as being multi-faceted, in that it needs to be examined for direct achievement, as well as that it
10achieves the long-term climate change objectives to which the EU has subscribed. This later condition is
not explicitly expressed in the EU ETS Directive, and can be seen as being a political decision in terms of
the timing (milestones) of the effort to reach the long-term EU decarbonization goals.
4.1 Delivery against the trading period target
In this case the issue is straightforward: does the EU ETS deliver against its current trading period target
for 2020 (-21% for ETS sectors when compared to 2005)? A longer-term view, but also a clear target,
brings a second question: is it expected to deliver against the agreed target for the next trading period, a
reduction of 43% by 2030 (vs. 2005)?
The EU ETS target for 2020 is being reached, ahead of time. The European Environment Agency (EEA)
figures show that by the end of 2016, emissions from EU ETS covered installations had already
decreased by 26% compared to 2005 (EEA, 2018). For 2017, EEA official data is not yet available.
Preliminary 2017 data from DG Climate Action shows that EU ETS emissions from stationary installations
were 0.6% higher than in 2016, which constitutes the first increase in seven years (EU TL, 2018).
Verified emissions have been under the target path
since the start of P2. In Figure 3 we consider the Figure 3. Verified emissions, target path and
projected emissions
observed historical relationships between changes in
GDP and changes in emissions and have created a
corridor of potential future emission levels depending
on GDP growth rates between 0 and 2 percent per
year (current GDP growth trends fluctuates around 2
percent, in contrast to a stagnation in P2). This
indicates clearly that only under high GDP growth
rates actual emissions might exceed the target path
towards the end of P4. This proposition is however
sensitive to any policy changes, including renewables
deployment and/or coal phase-outs.
Source: Wegener center elaborations on EEA, 2018 and
How much of this result is due to a decrease in CO2 EU TL, 2018
Note: data for 2017 are based on the EUTL of April 3
intensity, and how much it is due to a decrease in the
missing gaps are estimated by Wegener Center
level of economic activity, is also an important issue.
According to the “2050 Roadmap”, the EU wants all
sectors to decarbonize and contribute, a topic examined in Chapter 5.
4.2 Delivery against EU long-term domestic environmental commitments
To what extent does the trading period target lead the EU to deliver on its longer terms goals and
commitments? This is also relevant to the economic efficiency of the delivery of the EU’s long-term
climate change objective.
As discussed in Marcu et al (2016), EU domestic climate change targets are expressed through a number
of documents. The “2050 Roadmap” mentions a number of intermediate GHG reduction targets for the
EU as a whole (40% by 2030, 60% by 2040, and 80%-95% by 2050 compared to 1990), and proposed a
reduction of 90% compared to 2005 for sectors covered by the EU ETS (European Commission, 2011).
As shown in Figure 4, a LRF of 2.2% from 2021 corresponds to 85% reduction of GHG emissions in 2050
compared to 2005. To be consistent with a 90% reduction in ETS emissions in 2050 compared to 2005
11emissions would require an increase in the LRF to 2.4% in 2024. This would cumulatively reduce the cap
by around 1,660 MtCO2e by 2050.
Figure 4. EU ETS long-term trajectory
Source: I4CE, Enerdata, IFPEN, 2017
4.3 Delivery against international environmental commitments
The possible impact of the Paris Agreement on EU ETS behavior was discussed last year in the “2017
State of the EU ETS Report” (Marcu et al, 2017), and raised the question of the extent to which the
international process could affect the objectives, and market dynamics, of the EU ETS. The Paris
Agreement, and the March 2016 EU Council, did not affect EUA prices. The market had already
internalized a “success”, as the 2030 EU ETS target had already been decided by the EU Council well
ahead of COP 21.
In 2018, the situation is different. On the one hand the EU ETS P4 reform was adopted, while on the
other hand the international process is moving to an important phase, with the expectation that the
‘Rulebook’ for the Paris Agreement will be adopted at COP 24 in Katowice.
In addition, the outcomes of the political phase of the Talanoa Dialogue, which also takes place during
2018, is unclear, and may lead to a push to reinforce the level of ambition through adoption of more
ambitious NDCs.
From a scientific point of view, at COP 21, the COP requested the IPCC to produce a special report on the
impacts of global warming at 1.5°C above pre-industrial levels. This report will address appropriate
mitigation pathways to reach 1.5°C but also their impacts on the natural and human systems. It will also
describe ways to strengthen and implement the global response to the threat of climate change, while
addressing, among others, sustainable development and poverty eradication. There is little doubt that
this report will reinforce the conclusions of the 5th IPCC AR report on the need for ‘negative emissions’.
It is unlikely that the report will have a direct impact on EU ETS prices when it will be published in
October 2018. However, the conclusions of this special report could have a significant impact on COP 24
and on the Talanoa Dialogue, by pressuring the negotiation process, and reinforcing the sense of
urgency to act.
124.4 Lessons learned and issues to understand better
The EU ETS is delivering against its trading period target. Emissions have been under the target path
since 2009, and also under the available supply between 2009 and 2013, in particular due to the
economic recession. The distance between verified emissions and the pathway decreased between 2014
and 2017 (234 million to 178 million tons).
Translating the Paris Agreement into domestic policies is the way to impact the carbon market. After
Paris, there was no adjustment in EU ETS targets, and as such, no concrete market signal to respond to.
Thus, it appears normal that the P4 review has been adopted without any strengthening of the targets.
However, when EU domestic policies do become aligned with international developments through the
adjustment of EU targets, then, together with a new EU long-term climate strategy, they may have a
significant impact on the EU ETS.
In this context, it is also important to note that the EU ETS is no longer the only carbon pricing system.
How its environmental delivery compares with that in other jurisdictions is important, especially as it
will impact the level of effort, and competitiveness and carbon leakage issues. Article 30 of the EU ETS
Directive stipulates that the carbon leakage rules ‘shall be kept under review in the light of climate
policy measures in other major economies’.
The latest ICAP status report (ICAP, 2018) shows that, at present, 15% of global GHG emissions are
covered by emission trading systems, while more are scheduled for implementation. Moreover, the
latest World Bank’s “State and Trends of Carbon Pricing” (WB, 2017) report also shows that, as of the
end of 2017, 55% of global GHG emissions are covered by NDCs that feature references to domestic
and/or international carbon pricing.
5 Economic delivery
5.1 Emission and decarbonization trends
The currently agreed target path for P4 has a
Figure 5. Total supply of allowances and projected
strong bearing for both environmental delivery,
verified emissions
and the stringency of the cap. Until last year, total
emissions declined by about 2.3 percent per year
during P3, with fluctuations caused by activity
levels and weather. This overall trend can be
decomposed into an annual average decline of
industry emissions of around 0.3 percent and of
combustion emissions of around 3 percent.
However, emissions in 2017 might signal that these
trends are changing. For the first time since 2010,
total emission increased again, by 0.6 percent. Source: Wegener center elaborations on EEA, 2018 and EU TL,
Emissions from combustion remained stable, but 2018
industrial emissions expanded by 1.9 percent. This Note: data for 2017 are based on the EUTL of April 3
missing gaps are estimated by Wegener Center
reflects above all a surge in economic activity.
The stringency of allowances is not only determined by the target path and actual emissions, but also by
events (e.g. the economic crisis) and supply-side regulatory interventions (e.g. the backloading
procedure). Figure 5 compares the demand of allowances (actual emissions) with the actual supply.
13The current supply surplus was triggered by a number of causes, including: the drop in demand due to
the decrease in economic activity; the inflow of CERs and ERUs in P2; and the impacts of policy overlap.
A shortage was created though backloading, and can be seen between 2014 and 2016.
In 2017, supply and demand was relatively balanced. That is expected to change significantly in 2019,
when a pronounced shortage can be expected due to the functioning of the MSR.
Figure 6 shows the dominant role of the
combustion installations (mainly in the Figure 6. Sectoral emission trends
power sector) in the EU ETS - they
contribute around two thirds of total
emissions. Emissions from the industrial
sectors originate from four main sectors:
refining, steel, cement and bulk
chemicals, which together account for
three quarters of industrial emissions.
Figure 7, which presents the index of total
emissions in the EU ETS, and the indexes
for industrial production (volumes) and
electricity generation, shows that
emissions for the EU ETS as a whole (‘all
installations’) exhibit a significant
downward trend, which stopped in 2017. This can mainly be attributed to the combustion installations,
since industry does not show a decrease in emissions during the last 5 years.
Figure 7. Index of emission and index of volumes of production
120
115 All installations
(Emissions)
110
Industry (emissions)
Index (2013=100)
105
Industry
100 (Production)
95 Combustion
(emissions)
90
Combustion
(Production)
85
80
2013 2014 2015 2016 2017
Source: Wegener Center elaborations on EEA, 2018, EUTL, 2018 and Eurostat, 2018
Note: Industry production shows the volume index for production, combustion production
shows the index of total gross electricity production (gwh)
From a different perspective, Table 2 looks at emissions in individual industrial sectors. In absolute terms,
the downward trend for emissions during the recession is unambiguous. The big industrial sectors show
a decrease in emissions compared to pre-crisis levels. Out of the bigger sectors, production of bulk
chemicals seems to be the exception, with 2017 emission levels well above pre-crisis levels. The
14remaining sectors, together roughly 20% of industrial emissions, also show higher emissions in 2017
compared to 2008.
Table 2. Verified emissions of stationary installations
Verified emissions [mt CO2] 2008 2009 2010 2011 2012 2013 2014 2015 2016 2017
All stationary installations 2,120 1,880 1,939 1,904 1,867 1,908 1,814 1,803 1,750 1,761
Index 100 89 91 90 88 90 86 85 83 83
All combustion of fuels 1,512 1,385 1,419 1,389 1,378 1,333 1,238 1,226 1,179 1,179
Index 100 92 94 92 91 88 82 81 78 78
All industrial sectors 608 495 520 515 489 575 576 577 571 582
Index 100 81 86 85 81 95 95 95 94 96
All refining of mineral oil 142 132 130 130 124 128 125 128 127 126
Index 100 93 92 91 88 91 88 90 90 89
Steel total 159 110 131 130 123 141 143 142 136 140
Index 100 69 83 82 78 89 90 89 86 88
All production of cement clinker 157 126 124 122 114 111 116 114 115 119
Index 100 80 79 77 73 70 74 73 73 75
Production of bulk chemicals 32 29 30 29 27 39 39 39 39 39
Index 100 91 94 90 85 123 122 123 122 123
Paper or cardboard 27 24 25 24 23 23 22 22 22 22
Index 100 88 95 91 86 85 81 82 81 83
Ceramics 18 13 13 13 12 15 15 16 16 17
Index 100 72 72 73 65 87 86 88 90 94
Other activities 74 62 67 68 66 117 117 116 116 120
Index 100 84 91 93 89 160 159 158 158 163
Source: EEA, 2018 and EUTL, 2018
Note: data for 2017 are based on the EUTL of April 3
missing gaps are estimated by Wegener Center
Data from the different industrial sectors (e.g. cement, pulp and paper, and electricity – as shown in
Figure 8) indicates a decrease in carbon intensity. These conclusions need to be tempered by the
availability of data for independent research. Most of the data regarding carbon intensity comes from
business associations, and is often confidential and difficult to verify. Intensity data, even directionally, is
based on value added, which may show different trends and may be attributed to market fluctuations.
Figure 8. Carbon intensity data for production of Paper and Pulp, Grey clinker and Electricity
1 400
0.9 350
0.8
300
0.7
0.6 250
0.5 200
0.4 150
0.3
100
0.2
0.1 50
0 0
2005 2007 2009 2011 2013 2015
Paper and Pulp Grey clinker Electricity
Source: CEPI, CSI, EEA, 2017
Note: Paper and Pulp & Grey clinker in CO2/ton (left axis)
Electricity in gCO2/kWh (right axis)
Data for other sectors, which was provided on an un-attributable basis, on confidential carbon intensity
data of industrial production, also shows an overall decrease. However, it must be noted that the issue
of data availability is significant and was already raised in the 2017 State of the EU ETS Report (Marcu et
al, 2017). It was also raised during the preparation of the report in meetings with policymakers,
stakeholders and the different sector representatives.
15This is made especially complex for adding combustion emissions to the industrial sector they belong to,
and separating free allocation for Combined Heat and Power plants between their clients.
One of the major benefits that the EU ETS is seen as bringing is that of transparency. This lack of data
may negate some of that benefit, making it difficult not only for researchers, but also for market actors
to have confidence in using the EU ETS as a hedging instrument for carbon compliance obligations.
5.2 Is the EU ETS a driver for change?
GHG emissions from the installations covered by the EU ETS have significantly decreased over the last 11
years. However, it is not clear to which extent these emission reductions were driven by the EU ETS.
Interactions of the EU ETS with other policies
Interaction with EU-level climate and energy policies
There are other policies in the EU, which also lead to reductions in emissions and have an impact on
emissions from EU ETS sectors, even when aiming at achieving other EU objectives – such as deploying
renewable energy sources and increasing energy efficiency. Figure 9 illustrates the EU policies that
impact GHG emissions, and therefore impact the functioning of the EU ETS.
Figure 9. Landscape of EU legislations in the 2030 climate and energy policy framework
Source: I4CE and Enerdata, 2018
Interaction with national policies
Member States policies may also have an impact on GHG emissions in sectors covered by the EU ETS, for
example, coal phase-out schemes. Coal power installations accounted for 39% of all EU ETS emissions in
2016 (see Figure 10), which highlights the possible impact of coal phase-out policies on the EU ETS. In
some countries – Slovenia, Bulgaria, Czech Republic, Poland, Germany and Greece –emissions from coal
power represent more than 50% of EU ETS emissions.
16Figure 10. Split of EU ETS emissions between coal power, other power and industry
Source: Sandbag, 2017
Several Member States announced coal phase-outs in recent years – Ireland announced its phase-out in
March 2018, while Denmark, the Netherlands, Italy and Portugal did so last year, joining Sweden,
Finland, France, Austria and the UK, who committed in previous years (Europe Beyond Coal, 2018). The
debate in Germany, Europe’s largest coal and lignite consumer, is ongoing.
Other examples of national policies impacting the EU ETS include national carbon price floors. After the
UK initiative in 2011, France, Finland, the Netherlands and Germany have indicated support for this type
of initiative during recent months. In March 2018, France called on other EU Member States to adopt a
regional carbon price floor for power generators to promote a shift away from coal to more climate-
friendly fuels, with a price floor between 25 to 30 euros per ton.
Focus on decarbonization in the power sector
To better understand the role of the EU ETS in driving down emissions, an in-depth analysis of the power
sector will provide a good illustration. Between 2005 and 2015, emissions decreased by 300 MtCO2e (or
23%) in the EU power sector. During the same period, the average carbon content of power generation
decreased by 20% (see Figure 11). The carbon content decreased by well above 20% in at least ten
Member States (for some even 40% to 60%) between 2005 and 2014.
Figure 11: GHG emissions from the power sector and carbon content of power generation (2005-2015)
Source: I4CE elaborations on Eurostat, 2017
17You can also read