STATE OF EUROPEAN MARKETS 2017 - Voluntary Carbon - Ecostar
←
→
Page content transcription
If your browser does not render page correctly, please read the page content below
STATE OF EUROPEAN MARKETS 2017
                    Voluntary Carbon

 MAIN PARTNER   PROMOTED BY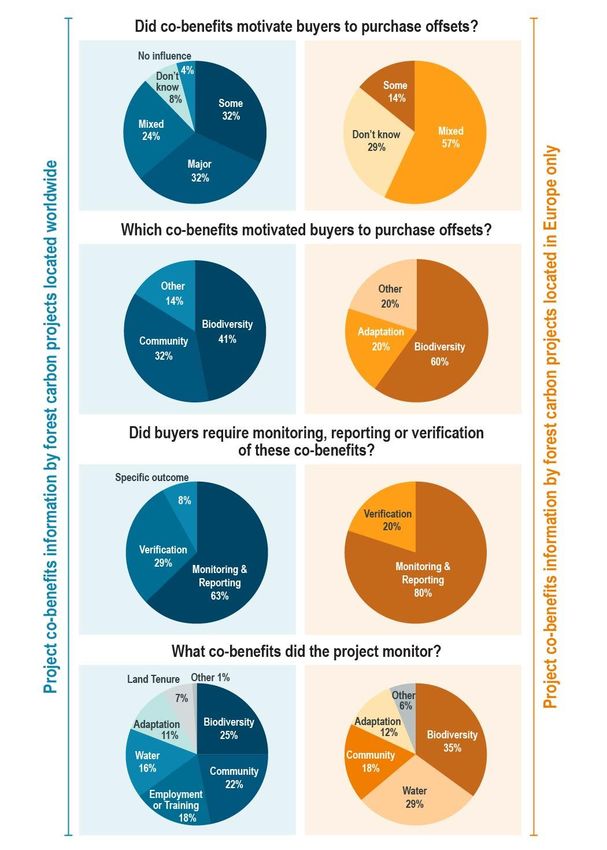
ABOUT FOREST TRENDS’ ECOSYSTEM MARKETPLACE
Ecosystem Marketplace, an initiative of the non-profit organisation Forest Trends, is the leading global source of
information on environmental finance, markets, and payments for ecosystem services. As a web-based service,
Ecosystem Marketplace publishes newsletters, breaking news, original feature articles, and annual reports about
market-based approaches to valuing and financing ecosystem services. We believe that transparency is a hallmark
of robust markets and that by providing accessible and trustworthy information on prices, regulation, science, and
other market-relevant issues, we can contribute to market growth, catalyse new thinking, and spur the development
of new markets, and the policies and infrastructure needed to support them. Ecosystem Marketplace is financially
supported by a diverse set of organisations including multilateral and bilateral government agencies, private
foundations, and corporations involved in banking, investment, and various ecosystem services.
Forest Trends works to conserve forests and other ecosystems through the creation and wide adoption of a broad
range of environmental finance, markets and other payment and incentive mechanisms. Forest Trends does so by
1) providing transparent information on ecosystem values, finance, and markets through knowledge acquisition,
analysis, and dissemination; 2) convening diverse coalitions, partners, and communities of practice to promote
environmental values and advance development of new markets and payment mechanisms; and 3) demonstrating
successful tools, standards, and models of innovative finance for conservation.
For up-to-date information on environmental markets, sign up for our newsletters here: http://www.forest-
trends.org/dir/em_newsletter
Forest Trends’ Ecosystem Marketplace
1203 19th Street, NW, 4th floor
Washington, DC 20036
info@ecosystemmarketplace.com
www.ecosystemmarketplace.com
www.forest-trends.org
ABOUT ECOSTAR | NATURAL TALENTS
The first Impact Hub and Accelerator for nature-based businesses
ECOSTAR is a research-enterprise impact hub and accelerator that promotes entrepreneurship and innovation for
nature-based businesses. The initiative is implemented by a university-enterprise partnership between European
and US-based institutions. ECOSTAR is co-funded by the Erasmus+ Programme of the European Union and private
investors. ECOSTAR pursues its mission through the following activities:
An Impact Hub that promotes the start-up and acceleration of new business initiatives with a positive impact
on environment and society
A Research-Business alliance that links universities and companies, providing networking and market-
oriented training
Knowledge products that highlight profitable business models that market, promote, and enhance
biodiversity and ecosystem services
Find out more at www.ecostarhub.com and subscribe to our newsletter at: http://bit.ly/2rd1JUm.
This project has been funded with support from the European Commission. This publication reflects the views only
of the authors, and the Commission cannot be held responsible for any use which may be made of the information
contained therein.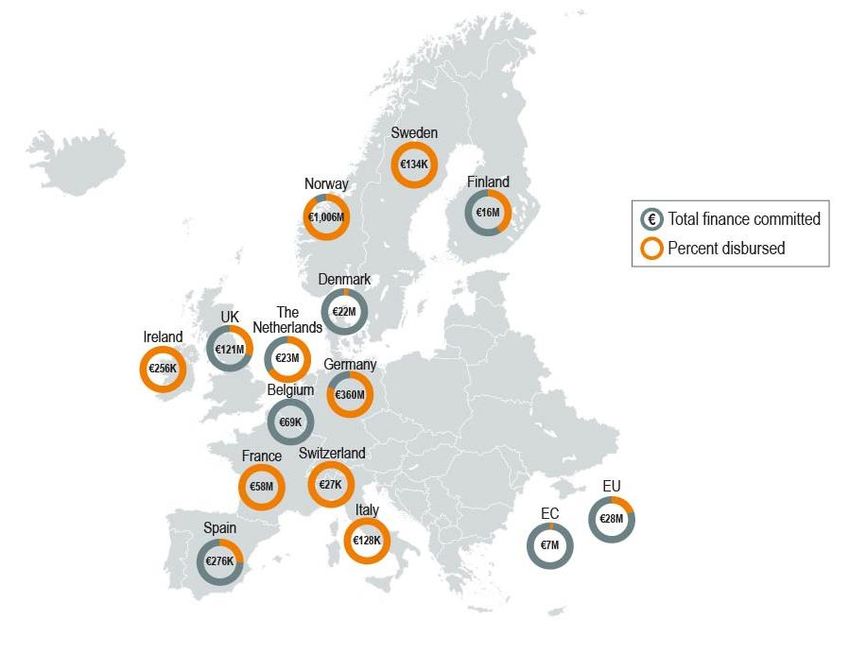
State of European Markets
 Voluntary Carbon

               June 2017

               Authors

               Kelley Hamrick
               Senior Associate
               Forest Trends’ Ecosystem Marketplace

               Lucio Brotto
               Director, Climate Change and Ecosystem
               Services
               ETIFOR

               Contributors
               Julia Grimault
               I4CE
               Stephan Wolters
               adelphi
               Dr. Vicky West
               UK Forestry Commission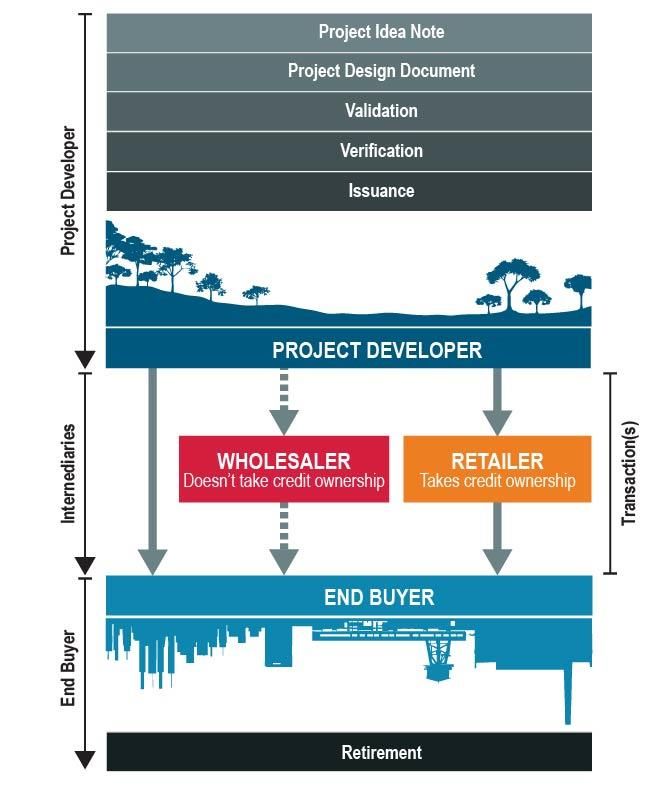
CREDITS

Project title

ECOSTAR

WP reference

WP3 Research and Assessment of Needs

Task reference

Task 3.4

ECOSTAR contacts

info@ecostarhub.com

Authors and affiliation

Kelley Hamrick (Forest Trends’ Ecosystem Marketplace)

Lucio Brotto (University of Padova and ETIFOR)

15/06/2017

Document version/status

Draft v.2.0

This project has been funded with support from the European Commission. This
publication reflects the views only of the author, and the Commission cannot be held
responsible for any use which may be made of the information contained therein.
DISCLAIMER
This document was based upon information supplied by participants in a market survey. Forest Trends’ Ecosystem
Marketplace does not represent or warrant the accuracy, suitability, or content of the survey responses or the results
of that survey as set out herein. It is the sole responsibility and obligation of the reader of this report to satisfy
himself/herself as to the accuracy, suitability, and content of the information contained herein. Forest Trends’
Ecosystem Marketplace (including its respective affiliates, officers, directors, partners, and employees) makes no
warranties and shall have no liability to the reader for any inaccuracy, representation, or misrepresentation set out
herein. The reader further agrees to hold Forest Trends’ Ecosystem Marketplace harmless from and against any
claims, loss, or damage in connection with or arising out of any commercial decisions made on the basis of the
information contained herein. The reader of this report is strongly advised not to use the content of this report in
isolation, but to take the information contained herein together with other market information and to formulate his/her
own views, interpretations, and opinions thereon. The reader is strongly advised to seek appropriate legal and
professional advice before entering into commercial transactions.

ACKNOWLEDGMENTS
This report is a compilation of the insights of a wide range of individuals across several continents. It would not be
possible without the hundreds of individuals who shared critical information about their organisations.

Graphics by Clarise Frechette Design, LLC (www.clarisefrechette.com).
This page intentionally left blank.
i

TABLE OF CONTENTS
1.          Introduction ......................................................................................................................................... 1

2.          Voluntary Markets: The Basics .......................................................................................................... 4

3.          Scope and Methodology .................................................................................................................... 6

4.          Supply: Offset Volume, Price, and Value ........................................................................................... 8

5.          Project Location.................................................................................................................................. 9

6.          Project Types ................................................................................................................................... 10

7.          Project Standards ............................................................................................................................. 11

8.          Project Stage and Vintage ............................................................................................................... 13

9.          Project Details and Co-Benefits ....................................................................................................... 14

10.         European Finance for Reducing Deforestation Abroad ................................................................... 17

11.         Buyers .............................................................................................................................................. 19

12.         Country Profiles ................................................................................................................................ 21

     12.1         France ....................................................................................................................................... 21

     12.2         Germany ................................................................................................................................... 23

     12.3         Italy ............................................................................................................................................ 24

     12.4         United Kingdom......................................................................................................................... 26

     12.5         The Netherlands........................................................................................................................ 27

     12.6         Spain ......................................................................................................................................... 28

     12.7         Switzerland................................................................................................................................ 28

13.         Outlook ............................................................................................................................................. 29

FIGURES, MAPS, TABLES AND BOXES

Figures
Figure 1: The Offset Cycle, from Project Development to Retirement ......................................................... 5
Figure 2: Response Rate by European-Headquartered Organisations Selling Offsets Worldwide and
          from Europe .................................................................................................................................. 7
Figure 3: Volume of Offsets Sold by Project Stage, 2015 .......................................................................... 14
Figure 4: What Motivated Buyer Demand and Monitoring of Co-Benefits Associated with Forest
          Carbon Offsets in 2015? ............................................................................................................. 16
Maps
Map 1: REDD+ Readiness Financing by European Countries, 2009-2014 ................................................ 18
ii
Tables
Table 1: European Organisations Transacting Voluntary Carbon Offsets by Profit Status and
Organisation Type, 2015 .............................................................................................................. 7
Table 2: Market Size and Average Price of Voluntary Carbon Offsets Sold by European
Organizations, 2015 ...................................................................................................................... 8
Table 3: European Organizations that Transacted Voluntary Carbon Offsets Worldwide, by Country
Headquarters ................................................................................................................................ 8
Table 4: All Offsets Sold from Worldwide, by Project Region in 2015 ......................................................... 9
Table 5: All Offsets Sold from Worldwide, Top Countries of Origin in 2015 .............................................. 10
Table 6: Forest Carbon Offsets Sold from Europe, Top Countries of Origin in 2015 ................................ 10
Table 7: Market Volume, Average Price and Value by Offset Project Types Based Worldwide, 2015 ..... 11
Table 8: Market Volume, Average Price and Value by Forest Carbon Offset Project Types Based in
Europe, 2015 .............................................................................................................................. 11
Table 9: Market Volume, Average Price and Value by Offset Standard Based Worldwide, 2015 ............. 12
Table 10: Market Volume, Average Price and Value by Forest Carbon Offset Standard Based in
Europe, 2015 .............................................................................................................................. 13
Table 11: Pledged Results-Based Payments for REDD+ by European Countries, 2008-2015 ................. 19
Table 12: Offset Volume, Average Price, and Value Transacted to European Buyers, 2015 ................... 20
Table 13: Worldwide and European Offset Transactions, by Location and Project Type of Offsets
Sold to European Buyers, by Buyer Experience, Type, and Sector ........................................... 20
Table 14: Offsets Transactions by Organisations Headquartered in France, 2015 ................................... 21
Table 15: Offsets Transactions by Organisations Headquartered in Germany, 2015 ............................... 23
Table 16: Offsets Transactions by Organisations Headquartered in Italy, 2015 ........................................ 24
Table 20: Offsets Transactions by Organisations Headquartered in the United Kingdom, 2015 .............. 26
Table 17: Offsets Transactions by Organisations Headquartered in the Netherlands, 2015 ..................... 27
Table 18: Offsets Transactions by Organisations Headquartered in Spain, 2015 ..................................... 28
Table 19: Offsets Transactions by Organisations Headquartered in Switzerland, 2015 ........................... 28
Boxes
Box 1: Forest Carbon: The Basics ................................................................................................................ 2
Box 2: The VOCAL Programme in France: Preliminary Studies ................................................................ 22iii
ACRONYMS
ACR American Carbon Registry
AFOLU Agriculture, forestry and other land use
A/R Afforestation/Reforestation
CAR Climate Action Reserve
CDM Clean Development Mechanism
CMG Carbon Monitoring Group
CO2 Carbon dioxide
COP Conference of the Parties
EU European Union
EU ETS European Union Emissions Trading Scheme
IFCC Italian Forest Carbon Code
IFM Improved Forest Management
KtCO2e Thousand metric tonnes of carbon dioxide or equivalent reduced
LULUCF Land-use, land use change and forestry
MtCO2e Million metric tonnes of carbon dioxide or equivalent reduced
NGO Non-governmental organisation
PDD Project Design Document
PIN Project Idea Note
REDD+ Reducing Emissions from Deforestation and Forest Degradation (the “+” refers to the role of
conservation, sustainable management of forests, and enhancement of forest carbon stocks
in reducing emissions)
t tonne of carbon dioxide or equivalent reduced
VOCAL Voluntary Carbon Land Certification
VCS Verified Carbon Standard
WCC Woodland Carbon Code
UK United Kingdom
UNI Italian Normative Organisation
GLOSSARY
Afforestation/Reforestation project: Afforestation/reforestation (A/R) projects are a project type involving
establishment of forests on areas without forest cover, in order to capture additional carbon in new treeiv biomass and other carbon pools. Emissions reductions occur primarily through additional carbon sequestration. Broker: Brokers are intermediaries who do not take ownership of offsets, but facilitate transactions for a fee between project developers and end users, between project developers and retailers, and/or between retailers. When given the opportunity, some retailers will also perform this role, but generally not at significant volumes. Buyers: Buyers purchase offsets either for their own internal use (called “end-users”) or for re-sale to another buyer (called “intermediaries”). Intermediaries, such as retailers, purchase offsets with the intention to resell. In contrast, end-users purchase offsets to count against their emissions and typically retire any purchased offsets to signal that those offsets are no longer available for sale. Clean cookstoves project: Clean cookstoves projects are a project type involving the distribution of cleaner and/or more efficient stoves and/or fuels to households, thereby reducing emissions. Select clean cookstoves also reduce the amount of black carbon emitted, a pollutant not currently counted as a greenhouse gas but one that does affect climate change as well as human health. The Gold Standard developed a separate certification to measure black carbon in 2015. Co-benefits: Co-benefits are additional environmental, social, or other benefits arising from a carbon project that are quantified based on metrics or indicators defined by the project developer, a co-benefits certification program, or third-party carbon project standard that accounts for both climate and co-benefits. Some registries and standards enable co-benefits certification to be “tagged” onto issued carbon offsets, if quantification and verification of co-benefits are not already embedded in a carbon project standard. Compliance markets: Compliance markets are the result of government regulation to reduce greenhouse gas emissions, and allow regulated entities to obtain and surrender emissions permits (allowances) or offsets in order to meet predetermined regulatory targets. End-buyers: End-buyers are buyers who purchase offsets with the intention to retire them. Offsets will no longer be sold after transferring to an end-buyer. This is in contrast to retailers, who purchase offsets with the intention to resell them. Also referred to in this report as “end-users.” Energy efficiency project: Energy efficiency projects are a project type involving replacing current energy uses with new or more efficient technologies, processes, or practices. European-headquartered organisation: European-headquartered organisations are based in Europe, but may conduct business both within and/or outside of Europe. European-based projects: European-based projects are carbon projects developed in Europe. To date, all European-based projects tracked by Ecosystem Marketplace have been developed by European- headquartered organisations, though an organisation based outside of Europe could theoretically build a European-based project. Fuel-switching project: Fuel-switching projects are a project type involving switching from traditional fossil fuels to renewable sources of fuel. Forests and land-use: Forests and land-use is a term that refers to the forestry, land use and/or agricultural sectors. Improved forest management (IFM) project: Improved forest management projects are a project type involving managing existing forest areas to increase carbon storage and/or to reduce carbon losses from harvesting or other silvicultural treatments. Emissions reductions may occur through additional sequestration and/or avoided emissions.
v

Issuance: Issuance is the final project stage which occurs after third-party auditors have guaranteed a
project has avoided or sequestered carbon dioxide or its equivalent. Once a project has met all
requirements by its voluntary standard, the developer can apply to a standards body to issue eligible offsets.
Any offsets issued to the project owner come with a unique serial number and are listed in a registry that
monitors any ownership transfers or offset retirement. Issuance takes place once a carbon offset project
has been validated, verified, and undergone other required processes.

Landfill methane project: Landfill methane projects are a project type involving capturing methane emitted
at landfills, while also preventing the release of toxic organic compounds and odours.

Methodology: A methodology lays out requirements for carbon offset projects for calculating emissions
reductions. Project developers can either use pre-existing methodologies or develop new ones. Voluntary
offset standards each have a list of approved methodologies that they accept.

Offset: This term refers to a quantified environmental benefit that is designed to compensate for impacts
to habitat, environmental functions, or ecosystem services. Offsets may be regulatory or voluntary. Within
carbon and greenhouse gas markets, offsets specifically refer to one metric tonne of carbon dioxide
equivalent reduced, avoided or sequestered by an entity to compensate for emitting that tonne elsewhere.

Permanence: Permanence is the principle that carbon offsets must permanently remove the carbon dioxide
or equivalent emission from the atmosphere or oceans. For forest carbon, a reversal of carbon storage can
happen from human activity (e.g., logging) or unforeseen natural events (e.g., forest fires, pest outbreaks).

Projects: A project is a site, or suite of sites, where restoration, sequestration, or other activities are
implemented for the purposes of marketing the resulting ecosystem service assets or outcomes to buyers.
Carbon offset projects quantify their avoided or reduced emissions to produce tradable climate reduction
certificates, called offsets.

Project developer: A project developer is a catch-all phrase to describe organisations that create carbon
offset projects, beginning with the initial Project Design Document all the way to offset issuance. Project
developers include organisations that are the project owner, partner organisations involved in project
implementation, project financiers/investors, or others.

Project Idea Note (PIN): The Project Idea Note is the first stage in project development. The Project Idea
Note is a preparatory step before creating a carbon offset project that is often required by project
methodologies. A Project Idea Note may include project plans; project feasibility, impact, and risk
assessments; findings from stakeholder input sessions; and other early-stage preparations.

Project Design Document (PDD): The Project Design Document is the project stage that follows the
Project Idea Note, once a methodology is selected. A Project Design Document details project design,
anticipated emissions reductions, plans for quantifying and monitoring the delivery of climate and other
social and environmental benefits, demonstrates that that the project activity exceeds “business-as-usual”
reductions and avoids emissions leakage, and addresses other technical issues.

Reduced Emissions from Deforestation and forest Degradation (REDD+): REDD+ projects are project
types developed where existing forests are at risk of land-use change or reduced carbon storage. The
projects focus on conserving these forests before they are degraded or deforested, resulting in the
avoidance of a business-as-usual scenario that would have produced higher emissions. Emissions
reductions occur primarily through avoided emissions.

        Avoided Planned REDD+: Avoided planned REDD+ projects protect forests that have been legally
        authorised to convert to non-forest land.
vi
Avoided Unplanned REDD+: Avoided unplanned REDD+ projects protect forests from unclear or
multiple threats, such as subsistence agriculture, livestock grazing, collection of fuelwood charcoal,
illegal logging, and small-scale extractive activities.
Registry: A registry issues, holds, and transfers carbon offsets, which are given unique serial numbers to
track them throughout their lifetime. Registries can also retire offsets. In compliance markets, each market
has its own designated registry. In the voluntary market, independent registries exist.
Reseller or Retailer: Resellers or retailers do not traditionally manage project development and
documentation. Instead, they contract with project developers to take ownership of a portfolio of offsets that
they then offer to end-buyers. Resellers or retailers typically offer other corporate carbon management
services to end-buyers, such as advising on internal emissions reductions strategies.
Retirement: The final project development stage, retirement is the point at which an organisation
permanently sets aside a carbon offset in a designated registry, effectively taking the carbon offset’s unique
serial number out of circulation. Retiring offsets through a registry ensures that they cannot be resold. This
is of particular importance if the buyer’s intent is to claim the offset’s emissions reductions against a carbon
reduction or neutrality target.
Run-of-river hydropower project: Run-of-river hydropower projects are a project type using the natural
flow of waterways to produce renewable energy.
Standard: A standard is a set of project design, monitoring, and reporting criteria against which carbon
offsetting activities and/or projects’ environmental and social co-benefits can be certified or verified. In the
voluntary markets, a number of competing standard organisations have emerged with the intent to increase
credibility in the marketplace. More recently, national and sub-national regulated markets have also
designed standards specific to regional needs for voluntary use.
Supplier: A supplier is any organisation that sells carbon offsets, such as a project developer, retailer, or
broker.
Transaction: A transaction occurs at the point that offsets are contracted by a buyer, regardless of whether
suppliers agree to deliver offsets immediately or in the future.
Validation: The project development stage that follows the Project Design Document. Validation is the
approval of carbon offset projects during planning stages. To achieve validation, projects must submit
information on project design for third-party approval. Project design information generally includes baseline
scenarios, monitoring plans, and methodologies for calculating emissions reductions.
Verification: The project development stage that follows validation. Verification may take place up to
several years after validation. It refers to the process of verifying emissions reductions generated by an
offset project to a particular standard, which quantifies actual emissions reductions to ensure that the
appropriate number of offsets are issued to the project.
Voluntary markets: Voluntary markets refer to the collective voluntary transactions tracked worldwide.
There is no centralised single marketplace for voluntary transactions but rather many discrete transactions
and, in some cases, country or program-related markets (such as the United Kingdom’s Woodland Carbon
Code).
Wetland restoration project: Wetland restoration projects are a project type using a variety of techniques,
such as planting and hydrologic restoration, to restore wetlands.
Wind project: Wind projects are a project type involving the development of wind turbines to increase the
use of sustainable energy and reduce reliance on energy from fossil fuels.vii
1.         INTRODUCTION

In December 2015, as the 21st Conference of the Parties on climate change (COP) concluded, negotiators agreed
on a historic climate deal to limit temperature rise from global emissions to below 2 degrees Celsius. The resulting
Paris Agreement and its mandate for action marked a turning point after decades of political debate around climate
change.

Yet before the first COP convened in 1995, a handful of conservationists had already recognised the problem of
climate change and begun responding to it. The non-profit CARE’s Mi Cuenca project, established in Guatemala in
1974, was one of the first carbon offset projects,1 i.e., projects that measured their avoided or reduced emissions
to produce tradable emissions reductions certificates. Mi Cuenca helped Guatemalan farmers save topsoil by
planting trees.2 The non-profit had initially struggled to keep the project operational, so they looked for a new source
of funding.

At the time, power generation and distribution company AES had been exploring how to reduce its emissions. There
was only so much AES could do to switch to cleaner energy, so the company came up with a novel concept: after
trying to reduce internal emissions, it would pay to reduce emissions elsewhere. In 1988, the company decided to
pay €2.2 million (M) for two million metric tonnes of carbon dioxide equivalent (MtCO2e) of emissions reductions
achieved by Mi Cuenca, which became one of the first-ever carbon offset sales.

Since then, many more companies have voluntarily purchased carbon offsets over the years, with Ecosystem
Marketplace tracking a total of nearly one billion offsets transacted during 2005-2015. Others have purchased
offsets in order to comply with country- or state-level regulations (called “compliance markets”).

Voluntary carbon markets in Europe

European buyers have actively purchased both compliance and voluntary carbon offsets since the early days of
the carbon markets. Compliance buyers are regulated under the European Union’s emission trading scheme (EU
ETS), which requires companies within targeted industries to reduce their emissions. Voluntary buyers come from
a number of (typically unregulated) industries, including the energy, finance and food and beverage sectors.

Carbon offsets can be created by a broad array of project types, including energy efficiency, landfill methane,
run-of-river hydropower, clean cookstoves, wind, fuel-switching, transportation projects, and forestry-based
projects. The EU ETS, a compliance market, does not currently accept forestry-based carbon offsets, so these are
only transacted by European buyers on the voluntary market.3

In 2015, Ecosystem Marketplace tracked European 4 voluntary buyers purchasing 16.1 MtCO2e, typically from
renewable energy and forestry projects.5 Nearly all of the voluntary carbon offsets bought by European buyers
originated from projects outside of Europe. Projects located in Europe produced relatively few carbon offsets for the
voluntary market.

1   All terms in bold blue text are defined in the Glossary section of this report.
2Zwick, Steve. 2015. “REDD Dawn: The Birth of Forest Carbon,” Ecosystem Marketplace, June 5.
http://www.ecosystemmarketplace.com/articles/redd-dawn.
3Some compliance markets outside of Europe’s EU ETS do recognize forestry-based carbon offsets, including California’s
and New Zealand’s cap-and-trade programs.
4Hamrick, Kelley and Allie Goldstein. 2015. Ahead of the Curve: State of the Voluntary Carbon Markets 2015. Washington,
DC: Forest Trends. In this report, “Europe” included all European countries (EU and non-EU), Turkey, and Russia.
5Hamrick, Kelley and Allie Goldstein. 2016. Raising Ambition: State of the Voluntary Carbon Markets 2016. Washington, DC:
Forest Trends.
The purpose of this report is to examine the sale and purchase of voluntary carbon offsets in Europe. The report
covers four areas:

       1. First, the bulk of this report describes the sale of voluntary offsets by European-headquartered
          organisations6. This includes market data (volume, value, and price) that is further broken down in terms
          of offset location, project type and other attributes. Where available, we also provided this data for a smaller
          market segment regarding forestry offsets from projects located in Europe (Box 1).

       2. Second, by drawing on Ecosystem Marketplace’s larger, global dataset of offset sales, the report also
          shines a light on the purchase of offsets by European-headquartered organizations.

       3. Third, to add additional context, the report includes information about the important role of European
          countries in providing results-based payments, outside of markets, to countries working to conserve their
          tropical forests.

       4. Finally, country-level chapters provide additional detail on market activity and key policy developments in
          countries that are most active in the global voluntary carbon markets, including France, Germany, Italy, the
          Netherlands, Spain, Switzerland and the United Kingdom (UK).

                                               Box 1: Forest Carbon: The Basics

    Responsibly managed forests are critically important in slowing climate change while improving the quality of peoples’ lives.
    Not only are forests home to more than 80% of all species living on land,7 they are also crucial sources of food, medicine,
    drinking water, and immense recreational, aesthetic, and spiritual benefits for millions of people.
    The forests and land-use sector is unique in that it can act as either a source or a sink for carbon. Deforestation is the second-
    largest source of annual carbon dioxide (CO2) emissions after fossil fuel combustion,8 yet when left standing, forests have the
    potential to sequester carbon through tree growth and thus reduce net carbon emissions.
    Though forestry projects produced some of the first carbon offsets for voluntary buyers, these projects have historically been
    unable to sell offsets in compliance markets. The EU ETS–the first and still largest cap-and-trade program–does not allow
    regulated corporations to purchase forestry-based carbon offsets to meet their obligations, because trees that sequester carbon
    don’t do so permanently.
    Both compliance and voluntary standards have taken steps to address this permanence issue. The Clean Development
    Mechanism (CDM) for example allocates temporary Certified Emissions Reductions offsets to forest carbon offset projects,
    and these offsets are only valid for a given period. Voluntary standards devised a different approach, requiring a proportion of
    the credits to be held in a central buffer reserve. The reserve varies depending on the potential for future carbon loss and can
    be used in unplanned events like forest fires.9 In such a case, offsets from these back-up forests, which are owned by the
    carbon offset seller, can replace carbon offsets “lost” from the destroyed forest.

6 For the purposes of this report, “Europe” includes all EU member states plus Norway and Switzerland. This differs from our
definition of “Europe” in State of the Voluntary Carbon Markets 2015 (Hamrick and Goldstein 2015), where Europe also
included non-EU member countries Turkey and Russia.
7United Nations. 2017. “Goal 15 – Why It Matters,” United Nations. Accessed March 10 2017.
http://www.un.org/sustainabledevelopment/biodiversity/.
8 Blanco G, Gerlagh R, Suh S, Barrett J, de Coninck HC, Morejon CFD, Mathur R, Nakicenovic N, et al. 2014. “Chapter 5 -
Drivers, trends and mitigation.” In: Climate Change 2014: Mitigation of Climate Change. IPCC Working Group III Contribution
to AR5. Cambridge University Press.
9   Ebeling, Johannes and Álvaro Vallejo. 2011. AR Guidance: Technical Project Design. Washington, DC: Forest Trends.
While voluntary markets have been instrumental in addressing such accounting concerns, voluntary offsets today comprise only a small subset of worldwide emissions reduction activity. According to a 2016 World Bank report on carbon pricing, compliance markets mitigated 12% of global emissions (about 7 gigatonnes of greenhouse gas emissions) in 201510–over two orders of magnitude larger than offsetting activity in voluntary markets, which typically remains less than 0.01 gigatonnes per year. But voluntary markets have had an outsized impact in the creation of offset project blueprints, called methodologies. This is especially true for forest carbon methodologies; voluntary standards have created methodologies covering a range of activities, from offsets from small-scale agroforestry projects to accounting for forestry offsets at jurisdictional or state scales. Recently, new compliance markets have worked with voluntary standards in transitioning select voluntary methodologies (both forestry and other) into new compliance regulations. Both California’s and South Africa’s compliance programs have partnered with leading voluntary standards. Most recently, California’s cap-and-trade system began accepting offsets from rice-based projects, based on a rice protocol that was first developed by the American Carbon Registry (ACR). In the future, forest carbon may play a bigger role in compliance markets around the world. In anticipation of the 2015 COP21, countries submitted their Intended Nationally Determined Contribution plans detailing how they will tackle emissions reductions in the future. Within this group, 97 countries mentioned specific plans to reduce emissions from deforestation or increase forest cover,11 and 90 countries12 (many overlapping with those above) expressed interest in meeting their reductions through the creation of domestic or global carbon markets. As of yet, countries’ plans are too early stage to tell if there will be any overlap between the two plans: such as if any future carbon markets (country-specific or global) will allow regulated entities to trade forest carbon offsets. Whether or not these potential markets will include forestry remains to be seen in upcoming climate change negotiations. In the meantime, countries have already taken action towards financing tropical forest emissions reductions through funding for Reducing Emissions from forest Degradation and Deforestation (REDD+). Most funding thus far has focused on giving tropical countries the resources to account for forest emissions (called “REDD+ Readiness”), but payments for achieved forest carbon emissions reductions have started to increase in recent years. How (and if) REDD+ fits into any potential global carbon market (or markets) also remains to be seen in the negotiations–but individual countries will meanwhile continue to pledge and disburse financing towards making REDD+ operational. 10 World Bank. 2016. State and Trends of Carbon Pricing 2016. Washington, DC: World Bank, 2016. 11 C2ES. 2015. “Comparison Table of Submitted INDCs”. C2ES. March 12 2017. http://www.c2es.org/indc-comparison. 12Environmental Defense Fund and International Emissions Trading Association. 2016. Carbon Pricing: The Paris Agreement’s Key Ingredient. Environmental Defense Fund and International Emissions Trading Association.
2.         VOLUNTARY MARKETS: THE BASICS

Carbon offset projects reduce or avoid emissions by carrying out certain activities, such as installing more efficient
light bulbs or planting trees, that result in quantifiable emissions reductions. These emissions reductions are called
carbon offsets and are measured in (metric) tonnes of carbon dioxide emissions or equivalent reduced (tCO2e).

Voluntary buyers purchase offsets to meet their own carbon neutrality or other environmental goals. They are not
motivated by regulation and don’t face any particular set of rules when purchasing offsets, though some develop
internal criteria or guidelines.

Voluntary suppliers historically developed projects in an unregulated context. But today, most projects adhere to
one of several voluntary standards that have designed credible methodologies. These standards require projects
to submit to independent, third-party verification to ensure voluntary projects have achieved their stated emissions
reductions.

Producing a voluntary offset

In order to verify that real emissions reductions have been achieved, project developers typically certify their
offsets under a third-party standard–an often long, rigorous, and expensive process. Standards have a list of
approved methodologies that detail the rules project developers must follow. Additionally, project developers must
prove that they have made the emissions reductions they claim, by submitting their projects for review by third-party
auditors that have been approved by the standards.

Standards differ by which project types they certify and the process for achieving certification. Some standards also
include requirements that the project not only reduces emissions, but also includes employment or training for local
populations, protects biodiversity, or addresses other non-carbon impacts. In this report, these non-carbon benefits
are referred to as co-benefits.

Projects choose a standard based on a variety of factors, including which project methodologies a standard
recognizes, the cost of using the standard, and the size of the project. The majority of projects around the world
currently report using the Verified Carbon Standard (VCS), the Gold Standard, the ACR, or the Climate Action
Reserve (CAR).13

Moving a project from conception to final issuance of offsets can take years, with forest carbon project developers
reporting an average timeframe of two and a half years.14 Figure 1 illustrates a typical project cycle from idea to
implementation, followed by the offset generation cycle from issuance to retirement.

Selling a voluntary offset
Once a project developer is ready to market offsets, they must find a buyer. This can be a complicated process
since there is no single marketplace for voluntary offsets. Some project developers develop their own marketing
and advertising teams to identify and promote their project directly to end buyers. However, many project
developers prefer to sell their offsets to a broker or a reseller, who takes responsibility for marketing those offsets
to end buyers.

When an offset is sold, the transaction marks a transfer of ownership. Until an offset is retired it can be resold
(which happens in the case of retailers who purchase offsets from project developers and resell them to end users).

13   Hamrick and Goldstein, 2015.
14
 Goldstein, Allie and Gloria Gonzalez. 2014. Turning over a New Leaf: State of the Forest Carbon Markets 2014.
Washington, DC: Forest Trends.
An offset that has been permanently sold must be listed as retired on a registry that keeps track of offsets’ issuance
and retirement, in order to ensure that retired offsets are not sold again.

                    Figure 1: The Offset Cycle, from Project Development to Retirement
3. SCOPE AND METHODOLOGY
This report focuses on data collected as part of Ecosystem Marketplace’s annual State of the Voluntary Carbon
Markets and State of the Forest Carbon Finance reports. These reports are based on an annual survey of
organizations that sell voluntary carbon offsets, for which Ecosystem Marketplace contacts over a thousand carbon
market participants worldwide to gain an in-depth understanding of current market trends.
This report uses data collected about market activity in 2015. Respondents provided data on their annual sales,
lending insights into the value, volume, and price of offset sales along with information on project type, project
location, and standards. To ensure confidentiality of responses, we only present data if at least three organisations
have reported on any single data point.
An important point to note is that we collect and track data on offset sales, called transactions in this report. We
recognize a transaction at the point of contract between a buyer and a seller. That means a transaction between a
project developer and a retailer is counted, and so is a transaction between the same retailer and an end buyer. In
some cases, sales could represent the same offsets sold. Thus, the figures below relate to the market value impact
of offset sales, not the accounted environmental impact of emissions reductions.
Additional forest carbon project data was gathered from our online Forest Carbon Portal and additional desk
research.
For the purposes of this report, Europe includes all European Union (EU) member states, Norway, and Switzerland,
unless otherwise noted.15
In addition to describing market activity by European-based organizations in the voluntary carbon markets, we also
provide more specific information about transactions of forestry-based carbon offsets. Our results will be broken out
into two sub-groups:
data reported from European-based organisations that sold carbon offsets from any project type from
projects located worldwide; and
data reported from European-based organisations that sold carbon offsets from forestry-based projects
located in Europe.
Because European forestry-based carbon projects are currently few and far between, it is important to understand
the greater European voluntary carbon market activity.
Respondents Profile
A total of 59 European organisations reported transacting voluntary offsets in 2015 (Figure 2). Most of these
organisations were for-profit (44) rather than not-for profit (15) (Table 1). The largest numbers of respondents were
from the UK (16), Germany (12), and the Netherlands (6). Five organisations each responded from Italy, France
and Switzerland, while three or fewer organisations each responded from Spain, Sweden, Hungary, Romania,
Greece and Norway.
Out of the 59 organisations, eight organizations reported making sales of European forestry-based carbon offsets.
Most of these organisations were based in Italy (3) and the UK (3). The remaining two were from Germany. These
respondents consisted of four non-profit organisations and four for-profit organisations.
15There is one exception to this scope, found in the “Projects Details and Co-Benefits” chapter on page 14, which discusses
known forest carbon projects from non-EU eastern European countries.Figure 2: Response Rate by European-Headquartered Organisations Selling Offsets Worldwide and
from Europe
59 organisations
headquartered in Europe reported selling offsets from voluntary carbon projects
located throughout the world
8 organisations headquartered in
Europe reported selling offsets from
voluntary forest carbon projects
located in Europe
Table 1: European Organisations Transacting Voluntary Carbon Offsets by Profit Status and
Organisation Type, 2015
Projects Based Worldwide Forestry Projects Based in Europe
Profit Status 44 For profit 4 For profit
15 Not-for-profit 4 Not-for-profit
Organisation Type (by Volume 58% Retailer 100% Project developer
Transacted)
25% Broker
13% Project developer
4% Investor4. SUPPLY: OFFSET VOLUME, PRICE, AND VALUE
European-headquartered organisations reported transacting 39.2 MtCO2e of voluntary carbon offsets in 2015 at an
average price of €3.2/tCO2e (t) (Table 2). Brokers, organisations that typically sell at the lowest possible prices,
transacted offsets at an average price of €0.8/t. Excluding brokers, that average rises to €3.9/t for retailers and
€4.1/t for project developers.
European-based forest carbon offsets comprised a much smaller subset of total transactions reported, with eight
organisations reporting 285 KtCO2e offsets sold. The average price, €15.6/t, should be viewed with caution: While
six organisations provided prices, the corresponding volume accounts for only 13% of the volume tracked. Thus the
average price could be considered as reflecting only a subset of overall market transactions.
Table 2: Market Size and Average Price of Voluntary Carbon Offsets Sold by European
Organizations, 2015
Offsets from Offsets from
Projects Based Worldwide Forestry Projects Based in Europe
Volume 39.2 MtCO2e 285 KtCO2e
Value €129.0M €4.4M
Average Price €3.2/t €15.6/t
Notes: All prices and market values are volume-weighted to determine their significance.
Organizations based in the UK were the most active in transacting offsets from worldwide projects, transacting 19.8
MtCO2e with a market value of €48.8M (Table 3).
Table 3: European Organizations that Transacted Voluntary Carbon Offsets Worldwide, by Country
Headquarters
Regions Volume Price Value
United Kingdom 19.8 MtCO2e €2.5/t €48.8M
Germany 5.9 MtCO2e €2.1/t €12.2M
Switzerland 5.5 MtCO2e €7.0/t €39.9M
Netherlands 4.4 MtCO2e €1.8/t €7.9M
France 3.1 MtCO2e €4.1/t €12.7M
Italy 170 KtCO2e €2.5/t €0.5M
Spain 61 KtCO2e €16.0/t €1.0M5. PROJECT LOCATION
The bulk of offsets sold by European organisations in 2015 came from projects located in non-EU countries
(Table 4). This is unsurprising, since offsets from countries without compliance carbon markets typically come from
a broader range of project types. Many projects were located in developing countries in Asia, Latin America, or
Africa, and offered multiple environmental or development benefits beyond carbon emissions reductions.
At a regional level, the majority (7.5 MtCO2e) of offsets transacted by European organisations in 2015 originated in
Asia (Table 4). India and China have historically been a source for offsets, and Indonesia has become a significant
supplier as well in recent years. European organisations also transacted many offsets from Latin America and
Africa, with Brazil and Kenya leading the way as individual country sources. However, at a country level, most
offsets transacted by European organisations in 2015 came from Turkey and Indonesia (Table 5).
European forestry-based offsets mainly originated in the UK and Italy (Table 6). The UK has emerged as the main
supplier of European forestry-based carbon offsets, thanks to its state-sanctioned Woodland Carbon Code (WCC),
which provides national guidance and standards to develop domestic forest carbon projects. UK project developers
transacted 259 KtCO2e of forest carbon offsets in 2015. In contrast, several Italian provinces and project developers
have initiated projects in the absence of national guidance. Two projects in Germany and the Netherlands also
reported transacting small volumes in 2015.
Table 4: All Offsets Sold from Worldwide, by Project Region in 2015
Regions Volume Average Price Value
Asia 7.5 MtCO2e €2.6/t €19.6M
Africa 3.5 MtCO2e €5.5/t €18.9M
Europe* 2.1 MtCO2e €15.5/t*** €32.5M***
Latin America & Caribbean 3.1 MtCO2e €4.2/t €13.0M
Non-EU Europe** 2.7 MtCO2e €1.2/t €3.1M
Notes:
* In this report, Europe includes all EU countries, Switzerland, and Norway.
** Non-EU Europe includes Russia, Turkey, and Georgia.
*** Of the 12 organisations reporting transactions of carbon offsets produced in Europe, nine provided price data. However, among the three
organisations that did not provide price data was the organisation that reported the largest volume of European offset transactions. Consequently, the
reported €15.5/tonne price reflects the average price of only 5% of the total volume. Thus market value, which is extrapolated from the average price
and total volume, is likely an over-estimate.Table 5: All Offsets Sold from Worldwide, Top Countries of Origin in 2015
Top Countries, Worldwide Volume
Indonesia 2.6 MtCO2e
Turkey 2.6 MtCO2e
India 2.4 MtCO2e
Brazil 1.8 MtCO2e
Table 6: Forest Carbon Offsets Sold from Europe, Top Countries of Origin in 2015
Top Countries, Europe Volume
United Kingdom 259.0 KtCO2e
Italy 20.1 KtCO2e
Germany -
The Netherlands -
Notes: Ecosystem Marketplace only reports a data point if three or more organisations provide data, in order to protect confidentiality of our
respondents.
6. PROJECT TYPES
European organisations reported transacting carbon offsets of a variety of project types in 2015.
Afforestation/reforestation (A/R) offsets commanded the largest share of market value, transacting €14.0M in
2015, driven by relatively high prices (Table 7).
Other project types actually transacted higher volumes than A/R projects. REDD+ and wind offsets sold 5.8 MtCO2e
and 5.4 MtCO2e respectively in 2015, compared to 1.9MtCO2e of A/R offsets transacted, but commanded lower
prices. These two project types have historically been the top-selling offset types globally, due to a large supply of
available offsets and competitive pricing.16
Yet even within these project types, average price varied depending on project details: for example, REDD+ offsets
differed by the specific type of REDD+ project. Avoided unplanned REDD+ offsets–whose projects try to address
a variety of uncertain threats to forests–sold in lower quantities (1.5 MtCO2e) but at higher prices (€4.2/t) than
avoided planned REDD+ offsets, with the former posting an overall market value of €6.2M. Avoided planned
REDD+ offsets are generated by projects that protect forests that have been legally authorised to convert to non-
forest land. These offsets sold in greater quantity (4.3 MtCO2e) but at lower prices (€1.1/t) for an overall market
value of €4.5M.
16 Hamrick and Goldstein, 2015.Table 7: Market Volume, Average Price and Value by Offset Project Types Based Worldwide, 2015
Project Types Volume Average Price Value
Afforestation/Reforestation 1.9 MtCO2e €7.4/t €14.0M
Wind 5.4 MtCO2e €1.5/t €8.3M
Clean cookstoves 1.8 MtCO2e €4.3/t €7.8M
REDD+: Avoided unplanned 1.5 MtCO2e €4.2/t €6.2M
REDD+: Avoided planned 4.3 MtCO2e €1.1/t €4.5M
Energy efficiency 283 KtCO2e €11.0/t €3.1M
Fuel switching 233 KtCO2e €11.9/t €2.8M
Landfill methane 371 KtCO2e €2.6/t €1.0M
Run-of-river hydro 790 KtCO2e €1.3/t €1.0M
Notes: Definitions of all project types can be found in the Glossary.
A/R projects also made up the bulk of offsets transacted from projects based in Europe (Table 8). Respondents
sold 285 KtCO2e last year from these projects at an average of €14.7/t. Besides A/R projects, respondents reported
transactions from one wetland restoration project and from one improved forest management (IFM) project
based in Europe. However, volumes and prices cannot be disclosed due to confidentiality restrictions.
Table 8: Market Volume, Average Price and Value by Forest Carbon Offset Project Types Based in
Europe, 2015
Project Types Volume Average Price Value
Afforestation/Reforestation 285 KtCO2e €14.7/t €4.2M
Notes: Definitions of all project types can be found in the Glossary.
7. PROJECT STANDARDS
European project developers and retailers overwhelmingly sold offsets developed under either VCS or the Gold
Standard (Table 9). Offsets verified under VCS commanded the largest market share in 2015 (€31.1M) mainly
because of the large volumes sold. This can be explained, in part, by the nature of offsets transacted: VCS was the
first standards body to issue a REDD+ methodology in 2010; and most large-scale REDD+ projects use VCS
methodologies.
European buyers also favoured offsets verified under the Gold Standard, purchasing €20.5M worth of offsets in
2015. Both Gold Standard and VCS have methodologies for verifying offsets from wind energy generation; the high
demand for wind offsets (5.4 MtCO2e) by buyers last year was reflected in the high volumes of offsets certified
under both standards. The Gold Standard’s higher average price of €3.9/t was partly because most cleancookstoves projects are verified under the Gold Standard and these offsets attracted higher average prices (€4.3/t)
from European buyers in 2015.
The Plan Vivo standard commanded a smaller market value, €3.0M, in part because the standard only verifies
community forestry and land-use projects. These projects are limited to smaller-scale projects, so transaction values
remain small though these offsets typically earned higher average prices (€7.5/t).
Table 9: Market Volume, Average Price and Value by Offset Standard Based Worldwide, 2015
Standards Volume Average Price Value
Verified Carbon Standard (VCS) 12.2 MtCO2e €2.5/t €31.1M
Gold Standard 5.4 MtCO2e €3.9/t €20.5M
Plan Vivo 391 KtCO2e €7.5/t €3.0M
Clean Development Mechanism (CDM) 383 KtCO2e €3.6/t €1.3M
Other 114 KtCO2e €11.9/t €1.3M
Did not use third-party standard 61 KtCO2e €17.8/t €1.1M
Woodland Carbon Code (WCC) 259 KtCO2e - -
Notes: Ecosystem Marketplace only reports a data point if three or more organisations provide data, in order to protect confidentiality of our
respondents.
Despite their global prominence, none of these standards were used to verify transacted forest carbon offsets
produced within Europe (Table 10). Instead, the WCC, the UK’s domestic standard, comprised the bulk of
transacted offsets with 259 KtCO2e in 2015. Non-UK European project developers reported that offsets used an
internal/proprietary standard (displayed here as “Other”). Projects in Europe typically look to international offset
standards for inspiration but use internal protocols. In a few cases, a certification body also verifies the projects.
The lack of third-party independent certification is likely due to uncertainty over double counting 17 and the high
transaction costs of carbon offset standards (as many European projects are smaller in scale and can’t justify the
financial expense).
17In the absence of national policies supporting local forest carbon projects, any forestry emissions reductions are likely
included within country-level accounting. That means that any offsets sold from those forest carbon projects outside of the host
country would represent double counting of emissions reductions. Voluntary carbon standards are loath to verify projects
where there is a risk of double counting, contributing to the relatively low rate of independent third-party certification among
European projects.Table 10: Market Volume, Average Price and Value by Forest Carbon Offset Standard Based in
Europe, 2015
Project Types Volume Average Price Value
Other 14 KtCO2e €18.8/t €215.9K
Woodland Carbon Code (WCC) 259 KtCO2e - -
Notes: Ecosystem Marketplace only reports a data point if three or more organisations provide data, in order to protect confidentiality of our
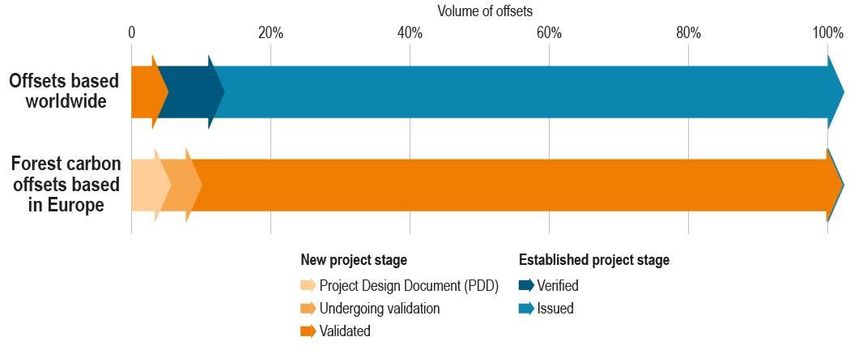
respondents.
8. PROJECT STAGE AND VINTAGE
Most European respondents reported selling issued offsets (89%) or verified offsets (8%) in 2015 (Figure 3). In
other words, they sold offsets that have already made emissions reductions (see the “Voluntary Markets: The
Basics” chapter on page 4 for more information about an offset lifecycle). Indeed, one of the key limitations of
voluntary carbon markets is that demand has historically not kept up with supply. Project developers and retailers
often report having excess offsets at the end of each year, because they could not find a buyer or could not sell at
their preferred price.
For example, in Ecosystem Marketplace’s 2016 State of Forest Carbon Finance report, project developers
worldwide reported an unsold 39.7 MtCO2e–more than 1.6 times the amount they reported successfully transacting
last year.18 For nearly half of their unsold offsets (18.1 MtCO2e), developers reported that they were waiting for
market conditions, namely price, to improve. This is unsurprising, as project developers reported an ideal carbon
price at €9/t–more than double the global average voluntary forest carbon price last year.
In contrast, none of the offsets sold from European forestry projects had been verified or issued yet at the point of
sale. The bulk (92%) had achieved validation–meaning that a third-party auditor has examined the project’s
planning documents and proposed framework and approved its expected outcomes. An additional 4% of reported
offsets were still undergoing validation at the time of their sale and a further 3% remained in the project design
document (PDD) phase, wherein project developers describe anticipated emissions reductions and plans for
achieving them.
There are a few reasons for this low rate of verification. Many projects developed under the UK’s WCC are relatively
young, since the standard only launched in 2011. Additionally, projects under an internal or other small regional
standard may forego costs associated with verification and issuance, if they have already identified nearby buyers,
or if the costs of verification are too high.
While the bulk (91%) of worldwide offsets sold by European-based organisations last year was issued before 2015,
there were some buyers willing to pay higher prices to support early-stage projects. Across voluntary forest carbon
offset sales tracked in 2015 worldwide, early-vintage buyers paid an average of €7.1/t compared to buyers
purchasing older vintages at an average of €3.4/t.
18
Goldstein, Allie and Franziska Ruef. 2016. View from the Understory: State of Forest Carbon Finance 2016. Washington,
DC: Forest Trends.You can also read