Gazprom in Europe - two "Anni Mirabiles", but can it continue? - Oxford Institute for Energy
←
→
Page content transcription
If your browser does not render page correctly, please read the page content below
March 2018

             Gazprom in Europe – two “Anni Mirabiles”,
                                   but can it continue?

       Introduction
       Gazprom has enjoyed two stunning years of gas export sales to Europe, delivering record volumes in
       2016 and 2017. This outcome was largely unexpected as, previously, Gazprom’s sales to Europe had
       been under some pressure 1 and many commentators expected competitive and political forces to
       restrict its opportunities. However, a number of external factors have catalysed a rebound, including
       delays in new LNG start-ups, higher coal prices, restrictions on gas production at the Groningen field
       in Holland, a recovery in overall European gas demand, and the company’s marketing strategy which
       has been adjusted to ensure that its gas remains competitive while it also, increasingly, complies with
       European gas market regulations.
       Nevertheless, although the past two years would appear to justify Gazprom’s assertion that it is not only
       the largest but also the most competitive source of supply for Europe, its success has also inspired a
       debate that could potentially undermine its future prospects. Not least, the increasing share of Russian
       gas in the European supply mix has underlined security of supply concerns that had already been
       prompted by the continuing conflict in Ukraine. The reaction of some European countries and politicians
       has been to push for restrictions on Russian gas export infrastructure, in particular focused on Nord
       Stream 2, while US sanctions policy has also been focused on limiting any further growth in Russian
       exports. To compound this, the February 2018 decision of the Stockholm arbitration court has provoked
       a furious response from Gazprom,2 which appears to have put the gas transit contract with Ukraine,
       which governs almost half of Russia’s gas exports to Europe, at risk. In addition to these political and
       legal problems, the long-anticipated “LNG supply surge” is likely to occur over the next two to three
       years and could cause increased competition just as oil prices rise and push Russian contract gas
       prices, some of which retain an oil-linked component, higher.
       This Oxford Energy Insight assesses the sources of Gazprom’s success over the past two years,
       addresses the key issues that the company faces over the next two years, and outlines the key
       challenges faced by both the company and by European customers and politicians as they address the
       dilemma of Russian gas. In particular, the main quandary is how to balance the obvious demand for a
       large and low-cost source of gas for Europe with the concern that Russia’s share of the European gas
       market could approach 40 per cent in the foreseeable future. Even ignoring the political risk, this raises
       an obvious question of over-dependence which needs an answer by the end of 2019 as the future of

   1
       Reuters, 19 Feb 2015, ‘Russia’s Gazprom faces falling gas sales to Europe’.
   2
       Platts, 2 March 2018, ‘Gazprom begins procedure to ’terminate’ Naftogaz supply, transit contract’.

Oxford Energy Insight: 29                                                                James Henderson & Jack Sharples
gas transit through Ukraine and the construction and use of the Nord Stream 2 3 and TurkStream 4
    pipelines is decided.

    Gas exports to Europe in 2016 and 2017 – golden years for Gazprom
    The position of gas in Europe has been improving for the past three years, as can be seen in Figure 1.
    After a decline in demand of approximately 100 Bcm between 2010 and 2014, the rebound started in
    2015 and then accelerated in 2016 and 2017, with year-on-year demand growth of six per cent and
    seven per cent respectively. This has been driven by a number of factors, including economic recovery
    across Europe, cold winter temperatures, and increased coal to gas switching. This latter trend has
    been particularly pronounced in the UK, where the impact of the carbon floor price has, on occasion,
    removed coal from the power generation mix altogether.5 Furthermore, in a number of other European
    countries the rising influence of the Industrial Emissions Directive and the policy commitments of some
    governments have seen the closure of coal-fired power plants, which have been replaced, primarily, by
    renewables but which has also boosted gas demand.
    Figure 1: European gas balances 2010-2017

    Source: Data from Platts LNG Service, IEA

    In addition to this accelerating policy shift away from coal, the economics of coal-to-gas switching have
    also been improving thanks to a rising coal price. This has mainly been driven by a change in Chinese
    energy policy, with environmental pressures encouraging the government to reduce coal production
    from its least efficient mines and thus causing an increase in imports. 6 The impact on global coal
    markets has caused a sharp increase in prices, which have risen from a low of below $40/tonne in
    February 2016 to a high of $89/tonne in November 2017.7 Combined with an equally significant rise in
    the carbon price in Europe, from a low of below €5 per tonne in March 2016 to a high of €7.60 per tonne
    in December 2017, then the impact on the economics of coal to gas switching has been transformed in
    continental Europe, as well as the UK.8 Figure 2 shows the range of coal prices (in $/MMBtu) at which

3
  Nord Stream 2 is the expansion of the Nord Stream pipeline that runs from NW Russia to the German coast via the Baltic Sea.
   Details about the project can be found at https://www.nord-stream2.com/.
4
  Gazprom refers to the latest gas export pipeline project from Russia to Turkey as ‘TurkStream’ and details about the project
   can be found at http://www.gazprom.com/about/production/projects/pipelines/built/turk-stream/.
5
  Financial Times, 22 April 2017, ‘UK generates a day’s electricity without coal’.
6
  Financial Times, 22 Sept 2016, ‘Surging price of coking coal reflects China’s muscle’.
7
  Data from Argus Media for Coal Price in the Baltic Ports, quoted in London.
8
  Reuters, 11 Oct 2017, ‘Analysts raise EU carbon price forecasts on expectations of market reform: survey’.

    The contents of this paper are the authors’ sole responsibility. They do not necessarily represent the views of          2
    the Oxford Institute for Energy Studies or any of its Members.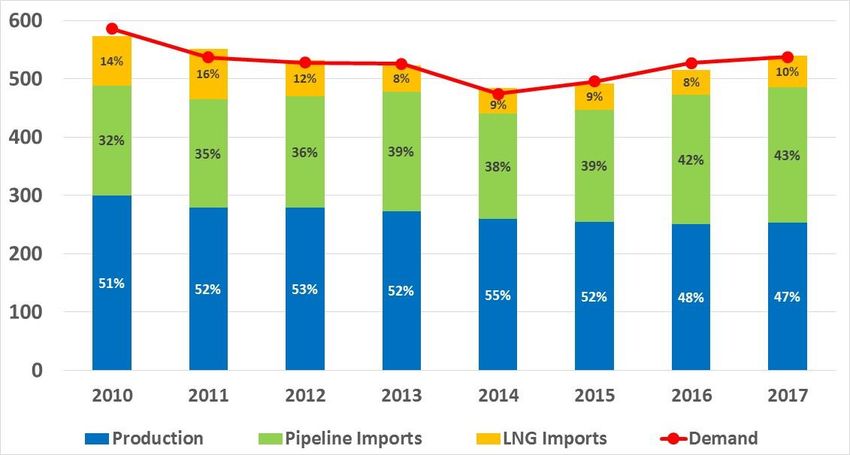
it is economic for existing power utilities to switch to gas, depending on the efficiency of their coal and
    gas plants, and it also shows the Russian gas price in Germany in comparison. As is abundantly clear,
    despite the recent rise in the gas price, it has moved from being much more expensive than coal in
    power generation to being very competitive, meaning that there has been a commercial as well as a
    policy incentive to increase gas demand at the expense of coal.
    Figure 2: European gas price versus coal-switching range
                                 14.00

                                 12.00

                                 10.00
                     US$/mmbtu

                                  8.00

                                  6.00

                                  4.00

                                  2.00

                                  0.00

                                              Gas 52           Gas 48           Russian Gas Price

    Source: Authors’ analysis from Argus and Energy Intelligence data

    Gazprom has also been adjusting its pricing strategy in response to demands from customers, as well
    as increasing pressure from the European Commission. Over the past few years, many of Gazprom’s
    customers have demanded renegotiations of pricing terms and methodology, as the historic oil-linked
    formula preferred by the Russians has been overtaken by the market-based pricing that is now
    prevalent in Europe, especially in the north-west of the continent. Companies such as Uniper, RWE,
    DONG and Engie have all used arbitration to renegotiate with Gazprom, and although many of the
    cases were settled in advance of legal proceedings, all effectively resulted in a more market-based
    pricing structure.9 Indeed, at its recent Investor Day in London, Gazprom revealed that although one
    third of its contracts are still oil-linked, one third are now hub-price linked and another third are hybrid
    contracts which effectively offer the lower of oil or hub-linked prices. 10 As a result, Gazprom has
    essentially accepted that, in order to thrive in Europe, it must offer its gas at a competitive price, and as
    can be seen from Figure 3, the Russian gas price to Germany and the European spot price (TTF) 11 are
    now almost indistinguishable.
    Indeed, Gazprom has been encouraged to use more competitive pricing by the European Commission,
    not only through implementation of the Third Energy Package but also as a result of the DG COMP 12
    investigation into the company’s business activities in Central and Eastern Europe. 13 The preliminary

9
  For example, see Stern, J. & Rogers, H. 2014. ‘The Dynamics of a Liberalised European Gas Market: Key determinants of hub
   prices, and roles and risks of major players’, NG94, OIES, https://www.oxfordenergy.org/wpcms/wp-
   content/uploads/2014/12/NG-94.pdf.
10
   Figures quoted in Reuters, 6 Feb 2018, ‘Russia’s Gazprom calls Nord Stream 2 pipeline risks’.
11
   TTF is the natural gas hub (full name - Title Transfer Facility) in the Netherlands, and the gas price there is generally regarded
   as a benchmark for Europe
12
   DG COMP – the Directorate General for Competition at the European Commission
13
   For details see Stern, J. & Yafimava, K. 2017. ‘The EU Competition Investigation into Gazprom’s Sales to Central and Eastern
   Europe: a detailed analysis of the commitments and the way forward’, NG121, OIES,

    The contents of this paper are the authors’ sole responsibility. They do not necessarily represent the views of                3
    the Oxford Institute for Energy Studies or any of its Members.
results of the investigation, in terms of the commitments proposed by Gazprom in response to the
European Commission’s concerns, appear to herald an end to the use of destination clauses and the
linking of gas price negotiations to questions of infrastructure, but more importantly appear to have
forced Gazprom to reconsider its pricing strategy and to reduce the share of oil-linked pricing in its
contracts in order to reduce any ‘unfair’ differentiation between markets. While Gazprom has not offered
to remove oil-price indexation entirely, it has offered to “introduce competitive benchmarks, including
Western European hub prices, into its price review clauses” and to make those price reviews more
frequent for its customers in Estonia, Latvia, Lithuania, Poland, and Bulgaria. 14 Although a final
resolution has been delayed by on-going negotiations over the finer details, 15 it would appear that
Gazprom has been prepared to accede to many of the Commission’s demands and, by doing so, has
made its gas more attractive to consumers in many European countries. 16
Figure 3: Russian gas price versus European spot price
12
10
8
US$/mmbtu
6
4
2
0
Jan 14 Jul 14 Jan 15 Jul 15 Jan 16 Jul 16 Jan 17 Jul 17
Europe Spot Russia to Germany
Source: Data from Argus Media
As a result of this increased competitiveness, and the fact that demand has been rising in Europe,
Russian gas has found itself in a very beneficial position, which has been further enhanced by events
on the supply side of the equation. European indigenous production has been in decline for some years,
falling from 300 Bcm in 2010 to 250 Bcm in 2016, as the key source of production – the North Sea –
becomes more mature.17 Furthermore, the serious problems at the Groningen field in Holland, 18 where
production is being limited and reduced due to related seismic activity, has caused an unexpected
additional reduction in supply that has increased the need for imports. Although there was a small
rebound in European gas production in 2017, mainly thanks to improved performance by the UK, the
https://www.oxfordenergy.org/wpcms/wp-content/uploads/2017/07/The-EU-Competition-investigation-of-Gazproms-sales-in-
central-and-eastern-Europe-a-detailed-analysis-of-the-commitments-and-the-way-forward-NG-121.pdf.
14
European Commission, 2017. Antitrust: Commission invites comments on Gazprom commitments concerning Central and
Eastern European gas markets. Press Release, 13 March.
15
CNBC, 28 Feb 2017, ‘It’s tricky to foresee when EU will end probe into Gazprom, says EU’s Vestager’.
16
Financial Times, 13 March 2017, ‘Gazprom reaches draft antitrust deal with EU’.
17
Financial Times, 3 Aug 2017, ‘US and Russia step up fight to supply Europe’s gas’.
18
See Honoré, A. 2017. ‘The Dutch Gas Market: Trials, tribulations and crisis’, NG118, OIES,
https://www.oxfordenergy.org/wpcms/wp-content/uploads/2017/05/The-Dutch-Gas-Market-trials-tribulations-and-trends-NG-
118.pdf.
The contents of this paper are the authors’ sole responsibility. They do not necessarily represent the views of 4
the Oxford Institute for Energy Studies or any of its Members.long-term trend remains one of decline, especially as pressure is increasing in the Netherlands to take firmer action at Groningen following new earthquakes in early 2018 and the recommendation of further production cuts by the Dutch regulator.19 LNG has failed to materialise in the expected volumes This trend in indigenous production has widened the window for gas imports to Europe, with obvious implications for exporters of gas via pipelines and LNG. At the beginning of 2016, as the wave of new LNG projects from the US and Australia appeared imminent, there had been some speculation that ship-borne gas would be the key source of expanded European imports, causing significant competition with pipeline gas (especially from Russia) and the potential for a price war. 20 However, the past two years have actually resulted in something of a phoney war, as the share of imported pipeline gas in Europe’s supply has risen faster than the share of LNG. Gazprom’s competitive pricing has certainly played a role, but delays in key LNG projects and higher gas demand in Asia, which is the natural primary market for LNG, have also been important factors. As detailed by Rogers (2017), LNG imports to Europe were in fact down by 3.3 per cent in 2016 due to a number of issues at new LNG projects, including commissioning problems, feed gas supply issues and construction slippage linked to escalating costs, with the result that overall LNG supply has not increased as fast as expected. 21 These problems started to be resolved in 2017, with the result that global LNG supply jumped by nine per cent in 2017 to reach 382 Bcm, meaning that the supply available to Europe rose by 10 Bcm to reach almost 60 Bcm. Although this increased availability of LNG for Europe may mark the start of a new trend as more projects come online, it is important to note that the most significant demand growth for LNG has come from Asia, where a 10 Bcm decline in demand in 2015 has been followed by a 15 Bcm increase in 2016 and a 25 Bcm increase in 2017. This has largely been driven by China, where a campaign to improve air quality in many cities has led demand for LNG imports to almost double in only two years to reach 50 Bcm in 2017, while demand in India and Pakistan has also shown noteworthy growth. 22 As a result, competition between LNG and pipeline gas in Europe has not been as intense as expected, with volumes of pipeline imports growing by 40 Bcm since 2015 and with their share of overall European consumption rising from 39 per cent to 43 per cent. As if this were not good enough news for Russia, an additional boost has been provided by the fact that other suppliers of pipeline gas have been struggling to maintain their export momentum. Algeria surprised many commentators in 2016 with a dramatic jump in exports, which was believed to be a result of diverting gas that would normally have been reinjected into the country’s main oilfields to the export market,23 but 2017 saw a 14 per cent decline in pipeline exports which perhaps reflected the unsustainable nature of this scheme if the country wishes to maintain its oil output. Figure 4 shows the other main non-Russian sources of pipeline gas into Europe, and it is clear that all of them remained largely flat or slightly declined. In contrast, supplies from Russia increased by 10 per cent in 2017 following a similar increase in 2016. 19 Reuters, 1 Feb 2018, ‘Dutch aim for major cut in gas production at earthquake-prone Groningen field’. 20 Bloomberg, 21 April 2016, ‘Shale War’s Collateral Damage: Europe’s Gas Prices’. 21 Rogers, H. 2017. ‘The Forthcoming LNG Supply Wave: A case of ‘Crying Wolf’’ Oxford Energy Insight No.4, OIES, https://www.oxfordenergy.org/wpcms/wp-content/uploads/2017/02/The-Forthcoming-LNG-Supply-Wave-OIES-Energy- Insight.pdf. 22 Financial Times, 7 Nov 2017, ‘China and India drive Asian LNG price to 10-month high’. 23 See Aissaoui, A. 2016. ‘Algerian Gas: Troubling Trends, Troubled Policies’, NG108, OIES, https://www.oxfordenergy.org/wpcms/wp-content/uploads/2016/05/Algerian-Gas-Troubling-Trends-Troubled-Policies-NG- 108.pdf. The contents of this paper are the authors’ sole responsibility. They do not necessarily represent the views of 5 the Oxford Institute for Energy Studies or any of its Members.
Figure 4: Source of gas imports via pipeline to Europe (Bcm)
                        250.0

                        200.0

                        150.0
                  bcm

                        100.0

                         50.0

                          0.0
                                2010       2011       2012      2013       2014      2015       2016      2017

                                         Russia     Algeria     Libya     Iran    Azerbaijan

 Source: Data from IEA

 Calculating Russian Gas Export Volumes
 At this point it is worth noting some statistical issues concerning the accounting for Russian gas exports
 to Europe. The figures provided by Gazprom (for example 179.3 Bcm in 2016 and 194.4 Bcm in 2017) 24
 are quoted in standard Russian Bcm, which are measured at a different pressure and temperature to
 gas volumes in Europe. As a result, a cubic metre of standard Russian gas provides less heat intensity
 than a cubic metre of gas consumed in Europe, meaning that Russian volumes should be adjusted
 downwards to make them comparable. Stern (2014) suggests that the conversion to European units
 should be calculated by reducing the Russian figures by 7.97 per cent. 25 However, a further
 complication is that Gazprom does not include the Baltic States as part of Europe, whereas they are,
 of course, members of the EU. 26 As a result, the figures for Latvia, Lithuania and Estonia should be
 added to Russian gas exports to Europe. Although the figures for 2017 have not yet been released, in
 2016 the total volumes to these three countries were 2.6 Bcm. Assuming the 2017 figure is similar, the
 figure for total Russian exports to Europe in 2017, adjusted to European measurements, was (194.4 +
 2.6) x (1 - 0.0797), which equals 181.3 Bcm. One final complication is that some of these Russian
 volumes are assumed to have been sold to Ukraine via reverse flow. Direct sales from Russia to Ukraine
 ceased in November 2015, but it is likely that some of the extra Russian gas deliveries to Europe in
 2016 and 2017 have been sent there via European third parties. It is impossible to say exactly how
 much of Ukrainian reverse flow is Russian gas, of course, but making an assumption that total Ukrainian
 gas imports in 2017 of 14.05 Bcm were effectively re-directed Russian gas from Europe, then the actual
 figure for consumption of Russian gas in Europe in European units could be as low as 181.3 Bcm –
 14.05 Bcm which equals 167.25 Bcm.
 As a result of this combination of factors, Gazprom has had two anni mirabiles for European gas export
 sales, with its own more competitive marketing strategy complementing the lack of competition from
 other suppliers and the rebound in European gas demand. Indeed, the relative tightness of the market

24
   Gazprom Investor Day Presentation 2018, slide 29, http://www.gazprom.com/f/posts/41/295497/investor-day-2018-en.pdf.
25
   Stern, J. 2014. ‘Reducing European Dependence on Russian Gas: distinguishing natural gas security from geopolitics’, NG92,
   p3, OIES, https://www.oxfordenergy.org/wpcms/wp-content/uploads/2014/10/NG-92.pdf.
26
   Gazprom still accounts for the Baltic States as part of the Former Soviet Union (FSU), as shown in its Databook for 2012-
   2016, “The Power Within”, page 75, http://www.gazprom.com/f/posts/44/307258/gazprom-in-figures-2012-2016-en.pdf.

 The contents of this paper are the authors’ sole responsibility. They do not necessarily represent the views of           6
 the Oxford Institute for Energy Studies or any of its Members.
has even seen this overall supply-demand picture resulting in a gradual recovery of gas prices, meaning
that Gazprom’s revenues from export sales have been boosted even further. Figure 5 shows the impact
in US dollars and Russian roubles, and underlines that having reached a low point in early 2016, when
the impact in rouble terms was largely offset by the weakening of the currency, the overall trend has
been in an upward direction, with a significant boost towards the end of 2017. Contract prices are
generally affected by oil prices, to the extent that they are still linked, with a six to nine-month lag, and
so the upward trend is set to continue into the first half of 2018.
Figure 5: Gazprom’s export revenues from gas sales to Europe
3,000 180
160
2,500
140
2,000 120
US$mm
100
RRbn
1,500
80
1,000 60
40
500
20
- -
Jan Mar May Jul Sep Nov Jan Mar May Jul Sep Nov Jan Mar May Jul Sep Nov
15 15 15 15 15 15 16 16 16 16 16 16 17 17 17 17 17 17
Revenues (Net, US$mm) Revenues RRbn
Source: Data from Argus Media
One final point can be made about Russian gas in Europe in 2016 and 2017, which is that Gazprom’s
share of supply has inevitably increased. Gazprom has calculated that its share of the European market
has increased from 27 per cent in 2011 to 30 per cent in 2014, 31 per cent in 2015, 33 per cent in 2016
and 35 per cent in 2017.27 As a result, it has already met the target that it outlined in its 2017 Investor
Day presentation of ‘up to 35 per cent by 2025,’28 and although it presented the same forecast in 2018,
company representatives talked about a share exceeding 40 per cent beyond 2030. Adjusting the
figures for Gazprom exports, as outlined in the Box above, it can be argued that Gazprom’s current
share of the European gas market (including Turkey) is around 34 per cent, but in reality this is mere
detail. The fact remains that Gazprom’s success over the past two years has underlined how important
Russian gas is to Europe, and Gazprom’s claim that it ‘will keep further strengthening its market position
in Europe’29 seems hard to deny, at least over the medium to long-term.
Can the good times continue? Commercial and political challenges ahead
Significant production capacity is available
As Gazprom has responded to growing demand for its gas, another positive feature of the company’s
performance has been its ability to reinvigorate its upstream production on a relatively rapid short-term
basis. When production hit its post-Soviet low of 419 Bcm in 2015, Gazprom’s CEO Alexei Miller
27
Gazprom Investor Day Presentation 2018, slide 28
28
Gazprom Investor Day Presentation 2017, slide 10.
29
Gazprom Investor Day Presentation 2018, slide 12
The contents of this paper are the authors’ sole responsibility. They do not necessarily represent the views of 7
the Oxford Institute for Energy Studies or any of its Members.claimed that the company’s production capacity remained high thanks to the significant investment it had made in new fields on the Yamal peninsula and the continuing potential of its core West Siberia assets. Indeed, he stated that Gazprom could produce as much as 600 Bcm per annum if required to do so,30 implying a ‘gas bubble’ in Russia of 180 Bcm from its own fields alone. This level has always seemed rather high and likely to be based on the ‘annualisation’ of a peak daily figure. Indeed, Miller himself appeared to downgrade the potential at his annual meeting with Vladimir Putin in November 2017, when a capacity of 550 Bcm was mentioned. 31 This figure was also confirmed by the head of Gazprom’s upstream business, Vsevolod Cherepanov, at the Gazprom Investor Day in February 2018, when he saw this level as achievable on a short-term basis at comparatively modest cost. As such, having proved that its production is flexible enough to increase by 50 Bcm in one year (from 420 Bcm to 470 Bcm in 2017), it would appear that Gazprom has a further 80 Bcm of production capacity available at short-run marginal cost if required. In the longer term, of course, Gazprom has vast reserves available across its geographic portfolio that could see output rise much further than this, albeit at a higher long-run marginal cost. This is relevant because it is fairly safe to assert that, for the foreseeable future, any constraint on Russian gas exports to Europe will not be caused by a lack of available gas. Overall, Russia has the second largest proved gas reserves in the world, behind Iran, 32 and arguably the largest source of accessible gas for export, given the limits on Iranian gas export potential at present. Therefore, the determining factors for the future role of Russian gas in Europe will largely be external and will involve the level of future demand for gas in Europe, the trends in indigenous production, the availability of alternative sources of imports and, perhaps most importantly, the reaction of politicians to the perceived security of supply threat caused by Russia’s share of the region’s gas supply. Gazprom’s marketing strategy and rhetoric will, of course, also play a role, but the key question is whether recent market- related trends will continue and whether European politicians will seek to interfere in commercial outcomes. The outlook for European gas import requirements Looking to the future of Russian gas in Europe, the first question is the overall context of the European gas market itself. After two years of robust growth, the demand picture would appear to be surprisingly rosy, but in both the medium and long-term there are various forces at play which, as analysed by Honoré (2014, updated),33 suggest a relatively mixed outcome for gas. On the positive side, the shift away from coal in the power sector appears to be accelerating, driven by the EU’s Industrial Emissions Directive (IED) and by more specific government policy on air quality and CO2 emissions. 34 With as much as 80GW of coal-fired capacity not yet compliant with the IED rules, OIES foresees as much as 50GW of coal-fired plant closures in the next five years (equivalent to approximately one third of the available coal-fired capacity in the EU as of February 2018), 35 opening a gap for alternative fuels including gas. Furthermore, the phase out of nuclear plants in countries such as Germany and Sweden for either political or commercial reasons, plus delays in new nuclear plants elsewhere (for example, in the UK), means that the opportunity could be even larger, although the role of gas as a replacement fuel will depend on the specific circumstances of individual countries. In many of them renewables will be the preferred source of power generation and there may be as much as 146GW of new capacity by 30 Speech by Alexei Miller at Valdai International Discussion Club in Berlin, 13 April 2015, http://www.gazprom.com/press/miller- journal/029076/. 31 Quote from Alexei Miller cited on the Gazprom Export, http://www.gazpromexport.ru/en/presscenter/information/2073/. Sourced on 12 Feb 2018 32 BP Statistical Review of World Energy 2017, https://www.bp.com/content/dam/bp/en/corporate/pdf/energy- economics/statistical-review-2017/bp-statistical-review-of-world-energy-2017-full-report.pdf. 33 Forecasts are based on analysis by Honoré, A. and are updates from her 2014 paper ‘The Outlook for Natural Gas Demand in Europe’, NG87, OIES, https://www.oxfordenergy.org/wpcms/wp-content/uploads/2014/06/NG-87.pdf. 34 Reuters, 28 April 2017, ‘EU states approve plans for stricter limits on pollutants from power plants’. 35 European Beyond Coal, 2018. European Coal Plant Database (15/02/2018). https://beyond-coal.eu/data/. Sourced on 1 Mar 2018. The contents of this paper are the authors’ sole responsibility. They do not necessarily represent the views of 8 the Oxford Institute for Energy Studies or any of its Members.
2030, and in this context the real opportunity for gas is not in new power plants but in the greater
 utilisation of existing capacity. Indeed, we see no net increase in gas capacity by 2030, although we do
 foresee an increase in gas demand for power generation of around 30 Bcm by then. With demand in
 the industrial and residential sectors remaining largely flat, and with transport growing, but from a very
 low base, we can envisage an overall increase in demand of 30-35 Bcm by the end of the next decade
 from the 2016 figure of 502 Bcm. This is hardly a controversial view, as it is consistent with the IEA
 forecast from the 2017 World Energy Outlook, which sees a marginal increase in EU gas demand by
 2030,36 and also corresponds with the consensus shown by Gazprom itself, which expects a demand
 increase of 10-36 Bcm by 2035.37
 With the demand outlook appearing to be one of only modest growth, the key driver for any increase in
 imports will, therefore, be the decline in indigenous supply, and the consensus of most experts is that
 this will continue for the foreseeable future. 38 Looking at the three key players for European supply,
 forecasts by the UK’s Oil and Gas Authority predict that the recent recovery in UK production can be
 maintained until 2019, after which decline will commence once again, 39 while the trends in Dutch
 production are also negative for the reasons already discussed. The Dutch government has recently
 set a reduced cap of 21.6 Bcm on Groningen production in an attempt to reduce the risk of further
 earthquakes, and it is certainly possible that this cap could be lowered further given the increasing
 frequency of tremors at and around the field.40 With other Dutch fields also in decline, it is even possible
 that the Netherlands could be a net gas importer by 2030, 41 and perhaps even earlier given the latest
 seismic events in January 2018.
 This leaves Norway as the most stable source of European indigenous gas supply, and a forthcoming
 study by Hall (2018) highlights the fact that Norwegian output is likely to remain stable, at the record
 levels seen in 2017, until 2022, before declining gradually to the end of the decade, by which time output
 could have fallen by around 30 Bcm from current levels.42 There is some risk to this forecast, given that
 one third of 2030 production will come from reserves that have yet to be discovered, but nevertheless
 Norway will certainly remain the largest European gas producer over the next two decades. Having said
 that, the decline in output forecast in all three countries will cause Europe’s import requirement to rise,
 with OIES seeing an increase of over 100 Bcm by 2030 compared to the 2016 level of approximately
 250 Bcm. This compares with a rather more modest increase of 93 Bcm by 2035 seen by Gazprom,
 assuming a flat demand forecast,43 but overall the trend is clear – Europe will need significantly more
 imported gas over the next decade and a half.
 The obvious, and vital, question is, therefore, what the sources of this level of imports will be. In a 2014
 working paper Stern et al carried out a detailed analysis of Europe’s gas import options and concluded
 that the potential is limited.44 Modest extra imports will come from Azerbaijan thanks to the development
 of Phase 2 of the Shah Deniz project, combined with the TANAP and TAP pipelines but, beyond that,
 upside from the Caspian region is limited. Longer term projections suggest that Iran and Iraq could also
 offer new gas, but both sources have specific combinations of geo-political and geological risk which

36
   IEA World Energy Outlook 2017, page 339.
37
   Gazprom Investor Day Presentation 2018, page 5, http://www.gazprom.com/f/posts/41/295497/investor-day-2018-en.pdf.
38
   For example AT Kearney, ‘The Future of European Gas Supply’, http://www.atkearney.co.uk/en/oil-gas/featured-article/-
   /asset_publisher/7Cikk7IPfJp2/content/the-future-of-the-european-gas-supply/10192. Sourced on 12 Feb 2018.
39
   UK Oil and Gas Authority, Feb 2017, ‘UKCS Oil and Gas Production Projections’,
   https://www.ogauthority.co.uk/media/3391/oga-production-projections-february-2017.pdf. Sourced on 15 Feb 2018.
40
   Reuters, 16 Jan 2018, ‘Dutch to lower Groningen gas production as much as possible – govt.’.
41
   Honoré, A. 2017. ‘The Dutch Gas Market: Trials, tribulations and crisis’, p 59, NG118, OIES,
   https://www.oxfordenergy.org/wpcms/wp-content/uploads/2017/05/The-Dutch-Gas-Market-trials-tribulations-and-trends-NG-
   118.pdf.
42
   Hall, M. 2018. ‘The Future of Norwegian Gas Supply’, Forthcoming Working Paper, Oxford Institute for Energy Studies.
43
   Gazprom Investor Day Presentation 2018, page 5.
44
   Stern et al, 2014. ‘Reducing European Dependence on Russian Gas: distinguishing natural gas security from geopolitics’,
   NG92, OIES, https://www.oxfordenergy.org/wpcms/wp-content/uploads/2014/10/NG-92.pdf.

 The contents of this paper are the authors’ sole responsibility. They do not necessarily represent the views of             9
 the Oxford Institute for Energy Studies or any of its Members.
mean that the outcomes are speculative at best. Meanwhile, gas from the East Mediterranean appears
 equally uncertain as a source of supply to Europe, while North African exports are likely to decline due
 to lack of production capacity, rapidly rising domestic consumption, and political instability. 45 As a result,
 the overall conclusion is that only two sources of supply are likely to be able to meet Europe’s growing
 import needs, Russia and the global LNG market.

 Russia and LNG – a recurring theme
 As Rogers first pointed out in his 2015 paper, the European gas market is essentially balanced by the
 flexibility offered by Gazprom’s take-or-pay contracts and the availability of competitively priced LNG
 on the global market.46 Within this context it is clear that, if the price of Gazprom’s gas is relatively high
 compared to the hub-based market price in Europe at which LNG would be sold, then buyers will
 minimise their offtake of Russian gas down towards take-or-pay levels and purchase LNG instead.
 Conversely, if Gazprom shows flexibility and offers a very competitive price, then customers will
 increase their purchases of Russian gas and reduce imports of LNG. There is probably a minimum level
 of LNG supply to Europe of around 50 Bcm which takes into account the location of customers relative
 to Russia and LNG terminals, but nevertheless the generic nature of the competition between Russia
 and global LNG holds, as both can be suppliers at the margin.
 Importantly, though, the real competition only occurs when there is a surplus in the market, as Europe
 tends to act as the market of last resort for LNG suppliers. 47 The continent’s excess of LNG receiving
 capacity48 and its market-based pricing system means that there is always a potential market for spare
 LNG that has not been sold into the Asian market, where prices tend to be at a premium compared to
 Europe because of the greater reliance on LNG due to the relative lack of pipeline gas options in many
 countries. However, over the past two years Europe has not really acted as much of a spill-over market
 for LNG, as upstream projects have been delayed and demand elsewhere has scooped up any
 increases in supply. As Russia has been only too keen to point out, even the fabled flood of US LNG
 has failed to materialise, with Gazprom recently comparing its impact on Europe to a couple of drops
 of water compared to the full cup of tea that Russia has been able to provide (see Figure 6 below).

45
   Interfax, 7 Feb 2017, ‘North African gas exports to Europe fall via all routes’.
46
   Rogers, H. 2015. ‘The Impact of Lower Gas and Oil Prices on Global Gas and LNG Markets’, NG99, OIES,
   https://www.oxfordenergy.org/wpcms/wp-content/uploads/2015/07/NG-99.pdf.
47
   Global Gas Partners presentation at European Gas Summit, 27 Sept 2016, slide 7.
48
   European Gas Hub, 6 Dec 2017, ‘A glimpse at the landscape of European LNG regasification’,
   http://www.europeangashub.com/reports-presentations/a-glimpse-at-the-landscape-of-european-lng-regasification-
   infrastructure.html. Sourced on 15 Feb 2018.

 The contents of this paper are the authors’ sole responsibility. They do not necessarily represent the views of    10
 the Oxford Institute for Energy Studies or any of its Members.
Figure 6: Gazprom analysis of the impact of US LNG in Europe

Source: Gazprom Investor Day Presentation 2018, slide 13

Having said this, it is clear in 2017 that the situation began to change, and the expectation must be that,
over the next two to three years, the surge of new LNG projects will occur, and could even be more
exaggerated over a short period as delayed projects now coincide with projects that were always
scheduled for a later date. The signs that 2017 may have been a year that marks a shift can be seen
in Figure 1, with the rebound in market share for LNG, and in numerical terms it was the first year since
2012 that LNG imports have not been at the notional minimum level of 50 Bcm. After four years in which
LNG supply to Europe totalled between 48 to 52 Bcm, 2017 saw a jump to 60 Bcm and, as Figure 7
below shows, the build-up of global LNG supply is now expected to occur largely between 2018 and
2022, with the majority of the growth coming from the US and Australia as originally expected. As a
result, Gazprom can expect more competition in Europe, depending on how other markets for LNG
develop.
Figure 7: LNG export capacity by region (2016-2022)

Source: IEA Medium Term Gas Report 2017, page 108

As mentioned before, the key markets for LNG are in Asia and the potential for growth can be captured
in a brief description of a few countries or groups, based on initial research by Rogers (2016) and

The contents of this paper are the authors’ sole responsibility. They do not necessarily represent the views of   11
the Oxford Institute for Energy Studies or any of its Members.
subsequently updated by the author. 49 Perhaps the most important is China, where the trajectory of
 economic growth and the impact of policies to displace coal with gas in industry, residential, and
 perhaps even the power sector, could have a huge impact on gas demand.50 Furthermore, the country’s
 import requirement will also depend on the results of its domestic gas production strategy which relies
 heavily on a successful development of shale gas resources. Given the uncertainties surrounding the
 outcomes of all three variables, the outcome for LNG imports is a wide range of 75-105 Bcm by 2030.
 Meanwhile in Japan, LNG demand will largely depend on the pace of nuclear restarts, while in South
 Korea the outcome will rely both on the country’s future attitude towards nuclear power and the success
 of the current switch in policy away from coal towards gas.
 Elsewhere in Asia, India remains a country with huge potential demand for gas and imported LNG, but
 government policies concerning pricing, subsidies, infrastructure, and a preference for domestically
 produced coal make any forecast highly subjective with a wide range of outcomes. 51 Meanwhile, a
 number of smaller gas consumers, such as Pakistan, Bangladesh and Vietnam are growing strongly,
 while countries such as Thailand, Indonesia and Malaysia, that have historically been important
 exporters of gas, are now becoming importers as domestic demand increases and supplies start to
 decline.52 As a result, the potential outcomes are highly variable and any forecasts must be treated with
 extreme caution. Nevertheless, two main scenarios have been created, high and low Asian LNG
 demand, and their implications for the availability of LNG to Europe have been assessed. The essential
 conclusion is that in the low Asian demand scenario there will be a large amount of LNG available for
 supply to Europe creating a potentially significant surplus between the years 2019 and 2022, shown in
 Figure 8, while in a high Asian demand scenario there would be a much smaller surplus due to the
 larger amount of LNG being consumed in the East, with the oversupply limited to 2019 and 2020.
 A key assumption in both cases, though, is the minimum level of exports that Gazprom is satisfied to
 sell in Europe, and the analysis in Figure 8 assumes that it would be prepared to reduce its volume to
 165 Bcm of gas sales for consumption in Europe. That is just below the 2017 level in European units
 excluding gas sent to Ukraine via reverse flow. In both scenarios, though, the key question is how would
 economic and political forces work to clear any surplus gas?

49
   Rogers, H. 2016. ‘Asian LNG Demand: Key Drivers and Outlook’, NG106, OIES, https://www.oxfordenergy.org/wpcms/wp-
   content/uploads/2016/04/Asian-LNG-Demand-NG-106.pdf.
50
   EIA, 25 Oct 2017, ‘China leads the growth in projected global natural gas consumption’,
   https://www.eia.gov/todayinenergy/detail.php?id=33472. Sourced on 15 Feb 2018.
51
   Sen, A. 2017. ‘India’s Gas Market post COP21’, NG120, OIES, https://www.eia.gov/todayinenergy/detail.php?id=33472.
52
   LNG World Shipping, 8 Jan 2018, ‘Cheap gas creates new LNG-import markets in Asia’.

 The contents of this paper are the authors’ sole responsibility. They do not necessarily represent the views of        12
 the Oxford Institute for Energy Studies or any of its Members.
Figure 8: LNG surplus in Europe in low and high Asian demand cases
                        160.0                                                                              70
                        140.0                                                                              60
                        120.0
                                                                                                           50
                        100.0
                                                                                                           40
                  bcm

                                                                                                                bcm
                         80.0
                                                                                                           30
                         60.0
                                                                                                           20
                         40.0
                         20.0                                                                              10

                          0.0                                                                              0
                                2015    2016    2017    2018    2019     2020    2021    2022     2023

                                    LNG Available (Low Asia)            LNG Available (High Asia)
                                    LNG Surplus (Low Asia) RHS          LNG Surplus (High Asia) RHS

 Source: Rogers, H.

 Russian gas versus US LNG – a proxy for a more general competition
 Given the global nature of the LNG market, which is becoming increasingly liquid as portfolio players
 and traders start to optimise supply options for various markets, it is clearly difficult to specifically
 characterise the nature of the potential competition between Russian gas and LNG in Europe. However,
 it is perhaps possible to make a few salient remarks and to relate the potential commercial competition
 to a political dynamic. In terms of LNG suppliers, Qatar is widely regarded as having the lowest cost
 source of LNG on a short and long run marginal cost basis, largely thanks to the significant amount of
 liquids that it produces with its gas.53 In addition, it is ideally located between the Asian and European
 markets and can therefore optimise its sales options. As such, it can be assumed that it will be able to
 compete in any market that it chooses and would displace pipeline gas if forced to compete on a cost
 basis. It is, therefore, never likely to be the marginal supplier, especially to Europe. Equally, the world’s
 other main LNG producer, Australia, is too distant to be a major supplier to Europe, and Asia is always
 likely to be its market of choice on a contractual and a spot basis.
 This leaves US LNG as the likely major source of competition with Russian gas in Europe.54 Of course,
 LNG from other sources will also arrive on the continent, but given its cost base and the option that it
 also has to sell into the Asian market, US LNG can act as a reasonable proxy for the marginal cost LNG
 supplier to the Atlantic Basin markets. As such, Gazprom’s pricing strategy is likely to have to respond
 to the availability and cost of US LNG, if the global gas market is oversupplied. In addition, there is a
 clear political dynamic involved as well, with the US keen to find new markets for its gas exports and
 with a number of European politicians and policy makers keen to support a potential alternative to
 Russian gas. Indeed, President Trump’s recent visit to Poland encapsulated the mood on both sides,
 with the US President keen to promote US LNG as a potential saviour for Europe, albeit at a cost, and
 the Poles being only too eager to find any solution other than further reliance on Russia. 55

53
   Rogers, H. 2017. ‘Qatar lifts its LNG Moratorium’, Oxford Energy Comment, OIES, https://www.oxfordenergy.org/wpcms/wp-
   content/uploads/2017/04/Qatar-Lifts-its-LNG-Moratorium.pdf.
54
   Financial Times, 3 Aug 2017, ‘US and Russia step up fight to supply Europe’s gas’.
55
   Financial Times, 22 June 2017, ‘Trump looks to lift LNG exports in US trade shift’.

 The contents of this paper are the authors’ sole responsibility. They do not necessarily represent the views of        13
 the Oxford Institute for Energy Studies or any of its Members.
Figure 9: Comparison of cost of Russian gas and US LNG
12
10
LRMC
US$/mmbtu
8
Comparison
6 SRMC
4 Comparison
2
0
Source: Authors’ analysis based on Argus, EIG and Platts data
Returning to an analysis of the cost of Russian gas supply versus the cost of US LNG landed in Europe,
the comparison is shown in Figure 9. Here, it is worth noting a number of the key assumptions that will
drive the short and long-run marginal costs of both sources of gas. As far as US LNG is concerned, on
a short-run marginal basis the key parameter will clearly be a combination of the gas price and short-
term transport costs, which have been rather volatile recently. At a Henry Hub price of around
$2.60/MMBtu (February 2018) and with transport costs to Europe currently calculated at around
$1.00/MMBtu based on a charter rate of $60,000 per day, 56 the short-run marginal cost of US LNG into
Europe would be approximately $4.30/MMBtu, once a $0.30/MMBtu regasification charge has also
been added. As can be seen from Figure 9 below, this makes US LNG very competitive with Russian
gas on a cash (Short Run Marginal Cost - SRMC) basis, and it is also relatively competitive on a long-
run basis, as discussed in the analysis which follows.
The strength or weakness of the rouble tends to be related to the oil price, as the two have historically
moved in tandem, with the rouble weakening as the oil price falls, and vice versa, as is very clear from
Figure 11. However, the Russian government has recently adopted a new fiscal rule which will see any
extra government revenues from oil and gas taxes reinvested in the currency market to deliberately
keep the rouble weaker than it might otherwise have been. 57 Again, Figure 11 shows how the mirror
image of oil price and rouble exchange rate has broken towards the end of 2017, as the Russian
currency has remained weak even as the oil price has risen above $60 per barrel.
56
Rogers, H. 2018. ‘The LNG Shipping Forecast: Costs rebounding, outlook uncertain’, Energy Insight 27 OIES,
https://www.oxfordenergy.org/wpcms/wp-content/uploads/2018/02/The-LNG-Shipping-Forecast-costs-rebounding-outlook-
uncertain-Insight-27.pdf.
57
Financial Times, 3 Feb 2017, ‘Russia plans to weaken rouble with forex sales’.
The contents of this paper are the authors’ sole responsibility. They do not necessarily represent the views of 14
the Oxford Institute for Energy Studies or any of its Members.Figure 10: Cost stack for Gazprom’s export sales to Europe (US$/MMBtu)
8.00
7.00
6.00 0.46
5.00 0.38 1.75
0.33 1.46
4.00
1.24 1.63
3.00 0.94
0.68
2.00
1.31 1.57 1.57
1.00
0.40 0.40 0.40
0.00 0.50 0.50 0.50
Via Nord Via Ukraine Via Ukraine Dec 17 Russia Dec 17 TTF Dec 17 Oil-
Stream (2009 Contract) (2016 proposal) Price linked
Lifting Cost MET Domestic Transport Export Transport
Export Tax CV Adjustment Total
Source: Author’s analysis based on data from Gazprom, Reuters and Argus
This strategy is intended to provide a boost to all exporting sectors in the Russian economy and to
remove one of the underlying causes of ‘Dutch disease’, but it is also of vital importance to Gazprom
as a stronger oil price can create a double risk for the company. Not only can it cause an increase in
the company’s domestic cost base in US dollar terms if the rouble strengthens, but it can also push its
gas sales contract prices up in as much as they are still linked to the oil price. As discussed earlier, this
link is weakening, but if Gazprom is to be believed then one third of its contract prices are set to rise in
2018 as they react, with a six to nine-month lag, to the increase in oil prices in 2017. As a result,
Gazprom could face increasing pressure from an oversupply of LNG just as some of its contract prices
are being encouraged to become less competitive by a rising oil price, with the potential for further
pressure on its cost base if the government fails to maintain its exchange rate policy. Of course,
Gazprom can react and show the flexibility it has already demonstrated in shifting its marketing strategy
towards more market-based and hybrid pricing, but it may well have to do this once more in the next
two years as competitive pressures in Europe increase.
Figure 11: The rouble exchange rate compared to the oil price
120 90
Oil price rises but
80
100 rouble remains weak
70
Oil Price (US$/bbl)
80 60
RR=US$1
50
60
40
40 30
20
20
10
0 0
Mar-14
Jun-14
Jun-15
Jun-16
Jun-17
Sep-14
Dec-13
Dec-14
Mar-15
Sep-15
Dec-15
Mar-16
Sep-16
Dec-16
Mar-17
Sep-17
Dec-17
Oil Price (US$) RR=US$1
Source: Central Bank of Russia, Argus Data
The contents of this paper are the authors’ sole responsibility. They do not necessarily represent the views of 15
the Oxford Institute for Energy Studies or any of its Members.It would appear, then, that after a miraculous couple of years Gazprom may face some more challenging commercial pressures in the period to 2022, depending upon a number of external variables. Beyond then, however, the picture looks more promising, as the global gas market is expected to tighten as shown in Figure 8, with the LNG surplus running out in 2023 even on the low Asian demand scenario. An important question, then, is if and when new investment decisions will be taken to meet gas demand beyond that date, and this is an issue over which Gazprom, and now also Novatek, can have some significant influence. From a Gazprom perspective, competition in the short-term will be with LNG from projects that are already committed and where the project partners will be prepared to sell their output down to short-run marginal cost if absolutely necessary. On this basis, Russian pipeline gas and US LNG, as a proxy for surplus LNG arriving in Europe, are competitive at just over $4/MMBtu. However, once any surplus is cleared, new projects will be needed, and project developers will want to know that these can provide a return on a full, long-run marginal, cost basis before committing to a Final Investment Decision (FID). However, as can again be seen from Figure 9, the full long-run marginal cost of US LNG at a Henry Hub price of $2.60/MMBtu is over $7/MMBtu, and many commentators would argue that a more realistic assumption for new LNG projects overall would be a range of $7-10/MMBtu.58 Given that Gazprom’s fully costed gas from the Yamal peninsula, at the current rouble exchange rate, is approximately $6.50/MMBtu it would seem that the company is in a strong position to market its gas at somewhere between the short and long-run marginal cost of competing LNG in the medium term in order to disincentivise higher cost projects and optimize its own position in the European market. Indeed, given its resource base it could arguably choose to export significantly higher volumes of gas to Europe if it decided to compete very aggressively on price with LNG over the longer term. From a Russian perspective, one additional point should be made concerning the country’s LNG strategy, which is now largely in the hands of Novatek. The Yamal LNG project is now online and will be producing 16.5 million tonnes of LNG per year by 2020, and plans for a second project, Arctic LNG- 2, are now being actively discussed, with a final investment decision scheduled for 2019.59 This project could add a further 19.8 million tonnes to the global gas market, with at least some part of it likely to arrive in Europe. The cost of supply from both projects to Europe is estimated in the range $5-7/MMBtu on a long run marginal cost basis,60 and so the potential exists for competitive Russian gas to arrive in Europe from two sources, although Novatek’s preference is clearly for Asia, in common with the ambitions of all LNG producers who are looking to exploit the potential for premium prices in this growth market. Infrastructure is the limiting factor, and has become a major political issue Given the cost position of Russian gas, it seems clear that Gazprom’s current and potential sources of gas for export to Europe can compete with almost any alternative source of supply. It has also been clear over the past two years that consumers are prepared to buy Russian gas if it is priced at a competitive level. As such, any European politicians concerned about the over-dependence on gas from Russia, either for political reasons or because they believe that a market share of 34 per cent, potentially rising to over 40 per cent, presents a non-negligible risk to the continent’s energy security, are facing something of a dilemma. It is difficult to impose restrictions on a competitive source of energy when the European Commission and national governments have spent 20 years creating a liberalised market to encourage lower prices for consumers. One solution is to control Russia’s ability to construct and use export infrastructure, which has become increasingly relevant as the existing pipeline system moves close to capacity. As Figure 12 58 Stern, J. 2017. ‘Challenges to the Future of Gas: unburnable or unaffordable?’, NG125, OIES, https://www.oxfordenergy.org/publications/challenges-future-gas-unburnable-unaffordable/. 59 Financial Times, 27 Dec 2017, ‘Russia’s LNG ambitions no longer a pipe dream’. 60 Sberbank Research, May 2017, “Russian Oil and Gas: Marking Territory”, page 29. The contents of this paper are the authors’ sole responsibility. They do not necessarily represent the views of 16 the Oxford Institute for Energy Studies or any of its Members.
demonstrates, at the current level of sales to Europe the average annual utilisation of Russia’s export
capacity, estimated at 230-240 Bcm, has risen from 63 per cent in 2014 to 87 per cent in 2017, although
in key peak demand winter months this means that the system is practically full. Indeed, even on an
average basis, the Yamal-Europe, Blue Stream, and Nord Stream pipelines are at over 90 per cent
capacity utilisation, leaving the politically sensitive Ukrainian route as the only available option for
expansion.61 Furthermore, the capacity of the Ukrainian system must be in some doubt. Although the
nameplate figure is 151 Bcm according to Naftogaz Ukrainy,62 in reality it has not transported more than
120 Bcm in the post-Soviet era and lack of maintenance may mean that a realistic current capacity is
closer to 100 Bcm. In this case the average annual utilisation of Russian export pipelines could currently
be as high as 95 per cent overall, or in other words, close to full.
Figure 12: Russian gas exports to Europe compared to pipeline capacity
350
300
250
200
bcm
150
100
50
0
2014 2015 2016 2017 2020 2025 2030
Yamal Europe Blue Stream Nord Stream 1 Ukraine (realistic)
Nord Stream 2 Turkish Stream Russian Exports
Source: Gazprom, Author’s analysis (NB: Realistic Ukraine capacity assumed to be 120 Bcm. Nameplate capacity
is theoretically 151 Bcm according to Naftogaz Ukrainy)
It is clear, therefore, that a physical constraint could limit Europe’s access to one of its largest and
cheapest sources of gas supply in the 2020s if the question of pipeline capacity is not resolved. There
is no doubt that a security of supply question exists, as Europe seeks to maximise its diversity of
physical supply options while also ensuring that price risk is kept to a minimum. Therefore, discussions
over the future of pipeline options in the Black Sea (TurkStream), the Baltic Sea (Nord Stream 1 and 2)
and through Ukraine will be vital to the future of European gas supply, and it would appear that 2019
will be the year in which the debate reaches its zenith. Indeed, the debate would now appear to have
started in earnest, following Gazprom’s threat to “terminate” the supply and transit contracts it has with
Ukraine in response to the Stockholm arbitration tribunal’s award of $4.63bn to Naftogaz Ukrainy
resulting from a judgement that Gazprom had not fulfilled its transit obligations.63
61
Gazprom Investor Day Presentation 2018, slide 30.
62
Pirani, S. & Yafimava, K. 2016. ‘Russia Gas Transit through Ukraine post-2019’, NG105, p4, OIES,
https://www.oxfordenergy.org/wpcms/wp-content/uploads/2016/02/Russian-Gas-Transit-Across-Ukraine-Post-2019-NG-
105.pdf.
63
Reuters, 2 March 2018, ‘Russia’s Gazprom says starts Ukraine’s gas contract termination in court’
The contents of this paper are the authors’ sole responsibility. They do not necessarily represent the views of 17
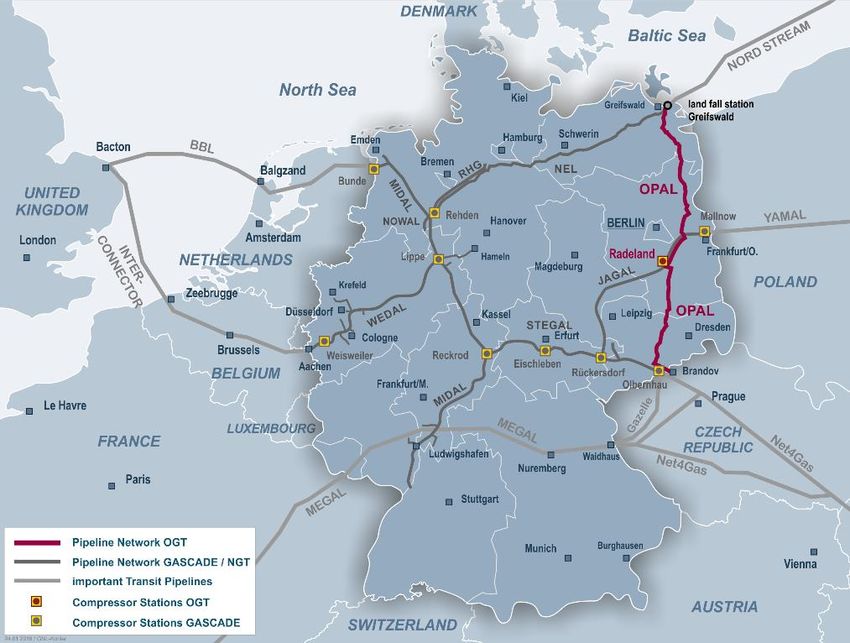
the Oxford Institute for Energy Studies or any of its Members.Political and regulatory issues around pipelines and transit, and potential near-term developments During the Soviet period, Russian gas was delivered to the European market, including Turkey, almost entirely via Ukraine. In the early 1990s, Gazprom recognised this dependence on a single country, and began a long-term strategy of transit diversification. The Yamal-Europe pipeline from Russia to Germany, via Belarus and Poland, was completed in 1999 and reached its full, 33 Bcm capacity in 2005.64 Meanwhile, the 16 Bcm capacity Blue Stream pipeline to Turkey, under the Black Sea, was launched in 2003, and finally the 55 Bcm capacity Nord Stream 1 pipeline was completed in 2012. Since then, Gazprom has begun work on the Nord Stream 2 pipeline, with a potential capacity of 55 Bcm, and the Turkish Stream pipeline, 31.5 Bcm. If the latter two pipelines are completed, and subsequently utilised at their full design capacity, gas transit via Ukraine (93.5 Bcm in 2017) 65 could be substantially reduced. However, Gazprom’s usage of Nord Stream 1, and its construction of Nord Stream 2 and Turkish Stream, have generated significant debate over the company’s dominant role on the European gas market and the geopolitical implications of these pipeline projects. These debates are further contextualised by Gazprom’s growing share of European gas consumption, the European Commission investigation into Gazprom’s commercial activities on the European gas market amid concerns over potentially anti-competitive behaviour, and the decision of the Stockholm arbitral tribunal that Gazprom must pay compensation for failing to supply sufficient transit volumes through Ukraine. 66 Nord Stream 1 and 2 Although the two lines of the Nord Stream pipeline were launched in November 2011 and October 2012, Gazprom has since faced limitations regarding their utilisation. These constraints relate to the OPAL and NEL pipelines, which were designed to receive gas from Nord Stream 1 and deliver it to the German-Czech border (OPAL) and north-west Germany (NEL). Unlike the offshore Nord Stream 1 pipeline, these onshore pipelines on EU territory are subject to EU gas market regulatory requirements, including that of third party access. In 2009, the Gazprom-Wintershall joint venture, OPAL Gas Transport, 67 68 applied for an exemption from such regulatory requirements for their 80 per cent shareholding in the OPAL pipeline, but ultimately the European Commission limited Gazprom’s use of OPAL to 50 per cent of its total capacity. 69 This remained the situation until October 2016, when the European Commission approved an agreement reached between OPAL Gas Transport and the German regulator, BNetzA, which effectively allowed Gazprom to bid in an auction for a further 30 per cent of OPAL’s capacity. 70 71 However, the agreement and Commission approval were subsequently challenged by PGNiG, its Germany subsidiary (PGNiG Supply & Trading), and the Polish government. The BNetzA-OPAL Gas Transport agreement 64 See Gazprom web-site at http://www.gazprom.com/about/production/projects/pipelines/active/yamal-evropa/. Sourced on 15 Feb 2018 65 Naftogaz Europe, 2018. 2017 results: Ukraine’s gas consumption decreased by 1.3 Bcm (-4%). Press release, 06 February, http://www.naftogaz.com/www/3/nakweben.nsf/0/9C51660E41BAB696C225822C00262C70?OpenDocument&year=2018&m onth=02&nt=News&. Sourced on 11 Feb 2018. 66 TASS, 2 March 2018, ‘Gazprom to cancel contracts with Ukraine’s Naftogaz” 67 WIGA, 2018. http://www.wiga-transport.de/home.html. Sourced on 07 Feb 2018. 68 OPAL Gas Transport, 2018. Company portrait, https://www.opal-gastransport.de/en/company/portrait/. Sourced on 10 Feb 2018. 69 European Commission 2016a. See pages 2-3. https://ec.europa.eu/transparency/regdoc/rep/1/2016/EN/1-2016-356-EN-F1- 1.PDF. Sourced on 11 Feb 2018. 70 European Commission 2016b. ‘Commission Decision of 28.10.2016 on review of the exemption of the Ostseepipeline- Anbindungsleitung from the requirements on third party access and tariff regulation granted under Directive 2003/55/EC’, p4, https://ec.europa.eu/energy/sites/ener/files/documents/2016_opal_revision_decision_en.pdf. Sourced on 11 Feb 2018. 71 For a detailed analysis of the OPAL exemption decision see Yafimava, K. 2017. ‘The OPAL Exemption Decision: past, present and future’, NG117, OIES, https://www.oxfordenergy.org/publications/opal-exemption-decision-past-present-future/. The contents of this paper are the authors’ sole responsibility. They do not necessarily represent the views of 18 the Oxford Institute for Energy Studies or any of its Members.
You can also read