Enel Today & Tomorrow - Hidden Costs of the Path of Coal and Carbon versus Possibilities for a Cleaner and Brighter Future - QualEnergia
←
→
Page content transcription
If your browser does not render page correctly, please read the page content below
Enel Today & Tomorrow
  Hidden Costs of the Path of Coal and Carbon versus
  Possibilities for a Cleaner and Brighter Future

                                           SOMO

May 2012
Enel Today & Tomorrow
          Hidden Costs of the Path of Coal and Carbon versus
             Possibilities for a Cleaner and Brighter Future

                                             SOMO

                                    Amsterdam, May 2012

SOMO is an independent research organisation. In 1973, SOMO was founded to provide civil
society organizations with knowledge on the structure and organisation of multinationals by
conducting independent research. SOMO has built up considerable expertise in among others
the following areas: corporate accountability, financial and trade regulation and the position of
developing countries regarding the financial industry and trade agreements. Furthermore,
SOMO has built up knowledge of many different business fields by conducting sector studies.

                                                                                                2
Enel Today & Tomorrow
Colophon
Enel Today & Tomorrow
Hidden Costs of the Path of Coal and Carbon versus
Possibilities for a Cleaner and Brighter Future
May 2012
Authors: Joseph Wilde-Ramsing, Kristóf Rácz, Fleur Scheele,
and Peter Saaman
ISBN: 978-94-6207-004-2
This publication was commissioned by Greenpeace Italy.
Acknowledgements
The authors wish to express their deep thanks to Lauri Myllyvirta
(Greenpeace International), who has contributed significantly to
the description of the methodology in section 2.2. Heartfelt
thanks also goes to Andrea Boraschi and Giussepe Onufrio
(Greenpeace Italy) for their constructive comments and
suggestions on various drafts of the report. Thanks also to Dr.
Mike Holland (EMRC) for reviewing parts of the report (primarily
the methodology) and providing suggestions for improvement.
Parts of this report are based on and appear in: Saaman, P.
(forthcoming). Human health effects caused by emissions from
coal-fired power plants in the EU. Unpublished Bachelor's Thesis,
Open Universiteit, Heerlen, NL.
Enel’s response to this report
SOMO provided Enel with an opportunity to provide comments
on and corrections to a draft version of the corporate profile. Enel
accepted this opportunity and provided comments but insisted
that it strongly disagrees with SOMO’s assumption that Enel’s
usage of coal is dangerous and contributes to premature deaths.
Enel further disagrees with the methods used in the report and
the way in which all the methods were employed. Some of Enel’s
comments have nevertheless been incorporated into the present
version. The fact that Enel reviewed the draft and provided
comments does not imply that the company approves of or
endorses any part of the present report. Enel reserves all rights.
Published by
Stichting Onderzoek Multinationale Ondernemingen (SOMO)
Centre for Research on Multinational Corporations
Sarphatistraat 30
1018 GL Amsterdam
The Netherlands
Tel: + 31 (20) 6391291
Fax: + 31 (20) 6391321
E-mail: info@somo.nl
Website: www.somo.nl
This document is licensed under the Creative Commons
Attribution-NonCommercial-NoDerivateWorks 3.0 License.
3Contents
1. Introduction ....................................................................................................................... 7
1.1. Context and point of departure ........................................................................................... 7
1.2. Aims and objectives ............................................................................................................ 7
1.3. Research questions ............................................................................................................ 8
1.4. Target groups ..................................................................................................................... 9
1.5. Process and methods ......................................................................................................... 9
1.6. Structure of the report ......................................................................................................... 9
2. Methodology ..................................................................................................................... 10
2.1. Methods used for quantifying impacts on public health ...................................................... 10
2.1.1. Health effects and associated risk factors .......................................................................... 13
2.1.2. Sample calculations ............................................................................................................ 14
2.1.3. Limitations of the EEA methodology and potential impact on results ................................ 15
2.2. Methods for calculating investments in new generation capacity: current construction
works vs. future plans ......................................................................................................... 16
2.3. Methods used to calculate future employment generation ................................................. 17
2.4. Methods used in the hypothetical scenario in Chapter 5.................................................... 17
3. What is Enel today?.......................................................................................................... 18
3.1. Basic company information ................................................................................................ 18
3.1.1. Divisions.............................................................................................................................. 18
3.1.2. Financial results .................................................................................................................. 19
3.1.3. Market share ....................................................................................................................... 19
3.1.4. Countries ............................................................................................................................ 20
3.2. Public financial support for coal-based electricity generation............................................. 21
3.3. Use of the Clean Development Mechanism ....................................................................... 21
3.4. Installed capacity and electricity production ....................................................................... 22
3.4.1. Global.................................................................................................................................. 22
3.4.2. Europe ................................................................................................................................ 24
3.4.3. Italy ..................................................................................................................................... 26
3.5. Employment ........................................................................................................................ 27
3.6. Emissions, waste, and the impact on public health of Enel’s current fossil fuel and nuclear
power production ................................................................................................................ 28
3.6.1. Enel’s environmental policy ................................................................................................ 28
3.6.2. Carbon and climate............................................................................................................. 29
3.6.3. Impact on public health and costs of emissions to air ........................................................ 30
3.6.4. Nuclear waste ..................................................................................................................... 34
4. What will Enel be tomorrow? .......................................................................................... 35
4.1. Enel’s investments in new electricity generation capacity worldwide ................................. 35
4.1.1. Overview of all Enel investments (current construction & future plans) ............................. 35
4.1.2. Enel’s investments currently under construction in Europe & Italy .................................... 37
4.1.3. New generation capacity: future plans ............................................................................... 43
4.1.4. Investment plans outside of Europe ................................................................................... 49
4.2. Employment ........................................................................................................................ 50
4.3. Emissions, waste, and the impact on public health of Enel’s future fossil fuel and nuclear
power production ................................................................................................................ 51
4Enel Today & Tomorrow
4.3.1. Carbon and climate ............................................................................................................ 51
4.3.2. Impact on public health and costs of emissions to air ........................................................ 51
4.3.3. Nuclear waste ..................................................................................................................... 54
5. How could Enel provide a brighter, cleaner Italian tomorrow? ................................... 55
5.1. Investments ........................................................................................................................ 55
5.2. Employment ........................................................................................................................ 58
5.3. Emissions, waste, and the impact on public health of Enel’s hypothetical future fossil fuel
and nuclear power production ............................................................................................ 59
5.3.1. Carbon and climate ............................................................................................................ 59
5.3.2. Impact on public health and costs of emissions to air ........................................................ 59
6. Conclusions and Implications......................................................................................... 60
Appendix 1: Source-receptor relationships ............................................................................... 62
List of Tables
Table 1: PM2.5 health effects quantified and risk factors used ....................................................... 13
Table 2: Ozone health effects quantified and risk factors used ....................................................... 14
Table 3: Sample calculation of premature deaths and economic losses from PM2.5 associated with
Enel’s Federico II coal-fired power plant in Italy ................................................................ 14
Table 4: Sample calculation of premature deaths and economic losses from ozone associated with
Enel’s Federico II coal-fired power plant in Italy ............................................................... 15
Table 5: Source notes for numbers .................................................................................................. 15
Table 6: Enel's divisions and areas of activity .................................................................................. 18
Table 7: Key results of the Enel Group 2009-2010, in EUR millions ............................................... 19
Table 8: Countries/regions where Enel has production activities, 2010 .......................................... 20
Table 9: Fuel mix of Enel's installed capacity and electricity generated globally, 2010 ................... 24
Table 10: Fuel mix of Enel's installed capacity and electricity generated in Europe, 2010 ............. 26
Table 11: Fuel mix of Enel's installed capacity and electricity generated in Italy, 2010 .................. 27
Table 12: Employment at Enel, 2010 ............................................................................................... 28
Table 13: Emissions to air from Enel’s fossil fuel-based power plants in Italy and the associated
health and financial impacts, 2009 .................................................................................. 31
Table 14: Emissions to air from Enel’s coal-fired power plants in Europe (ex-Italy) and the
associated health and financial impacts, 2009 ................................................................ 33
Table 15: Enel's global installed capacity when current construction & future plans are complete,
per fuel type, in MW ......................................................................................................... 36
Table 16: Enel's investments in new production capacity in Europe, in EUR million....................... 37
Table 17: Enel’s investments in new production capacity in Europe - under construction, per fuel
type .................................................................................................................................. 38
Table 18: Enel’s investments in new production capacity in Europe - under construction,
per project ........................................................................................................................ 38
Table 19: Enel's installed capacity in Europe - when constructions are ready, in MW .................... 42
Table 20: Enel’s investments in new production capacity in Italy currently under construction, per
fuel type............................................................................................................................ 43
Table 21: Enel's installed capacity in Italy when current construction projects are completed, in MW
and % ............................................................................................................................... 43
Table 22: Enel’s future plans for investments in new production capacity in Europe, per fuel type 44
Table 23: Enel’s investments in new production capacity in Europe - plans, per project ................ 44
5Table 24: Enel's installed capacity in Europe - when current construction projects & future plans are
ready, in MW .................................................................................................................... 47
Table 25: Enel’s future plans for investments in new production capacity in Italy, per fuel type ..... 48
Table 26: Enel's installed capacity in Italy - when current construction projects & future plans are
complete, in MW .............................................................................................................. 48
Table 27: Enel's investments outside of Europe, in MW, 2010 ........................................................ 49
Table 28: Employment factors for new installed electricity generation capacity, by fuel type ......... 50
Table 29: Projected emissions to air from Enel’s planned coal-fired power plants in Europe and the
associated health and financial impacts .......................................................................... 53
Table 30: Required shift in Enel's coal-fired capacity and electricity production in order to be in line
with Greenpeace Italy’s vision ......................................................................................... 56
Table 31: Required shift in Enel's capacity and electricity production from renewables in order to be
in line with Greenpeace Italy’s vision ............................................................................... 56
Table 32: Additional renewables capacity in 2020 and 2030 in % and MW, as proposed by
Greenpeace Italy .............................................................................................................. 57
Table 33: Cost of constructing new capacity for electricity generation based on renewable sources
of energy in 2011-2020 and 2021-2030 ........................................................................... 57
Table 34: Job created by Enel as a consequence of the additional renewables capacity envisioned
by Greenpeace Italy for the periods 2011-2020 and 2021-2030 ..................................... 58
Table 36: Effect of emission of 1 t of each pollutant from each country on population weighted
concentration of PM2.5 across Europe ............................................................................ 62
Table 37: Effect of emission of 1 t of each pollutant from each country on population weighted
SOMO 35 concentration across Europe .......................................................................... 63
List of Figures
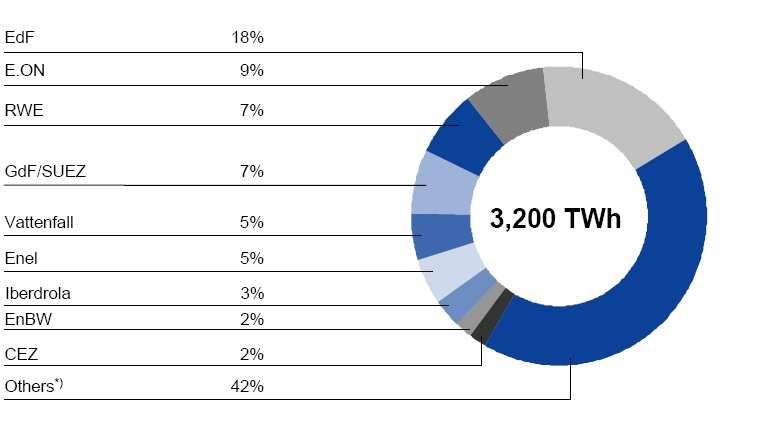
Figure 1: Largest companies in electricity generation in Europe, 2010 ........................................... 20
Figure 2: Fuel mix of Enel's installed capacity globally, 2010, in percentages ................................ 23
Figure 3: Fuel mix of Enel's electricity generated globally, 2010, in percentages ........................... 23
Figure 4: Fuel mix of Enel's installed capacity in Europe, 2010, in percentages ............................. 25
Figure 5: Fuel mix of Enel's electricity generated in Europe, 2010, in percentages ........................ 25
Figure 6: Fuel mix of Enel's installed capacity in Italy, 2010, in percentages .................................. 26
Figure 7: Fuel mix of Enel's electricity generated in Italy, 2010, in percentages ............................. 27
Figure 8: Fuel mix of Enel's global installed capacity in 2010 vs. when current construction & future
plans are complete, in percentages .................................................................................. 36
Figure 9: Fuel mix of Enel's European installed capacity in 2010 vs. when constructions are ready,
in percentages ................................................................................................................... 42
Figure 10: Fuel mix of Enel's European installed capacity in 2010 vs. when current construction
projects & future plans are complete, in percentages..................................................... 47
Figure 11: Fuel mix of Enel's Italian installed capacity in 2010 vs. when current construction
projects & future plans are complete, in percentages..................................................... 49
6Enel Today & Tomorrow
1. Introduction
1.1. Context and point of departure
The electricity provided by power companies and the employment that electricity provision creates
are economic goods that benefit society and drive economic and social development. Electricity
companies are adept at publicizing these socio-economic goods in corporate communications, and
indeed, they receive significant financial compensation – in the form of revenues – for providing
these goods. However, in addition to paying electricity companies for the kilowatts used, society
also pays a hidden price for these goods that often goes unreported and is not included on
corporate financial balance sheets. These hidden, or ‘externalized’, costs take the form of negative
effects on public health and agriculture, and the economic losses associated with these impacts.
Electricity companies are understandably less interested in publicizing these significant negative
impacts and costs to society than they are in promoting their positive impacts. However, in order to
have an informed public debate about the advantages and disadvantages of various strategies for
supplying society’s demand for energy, all direct and indirect costs, benefits, and impacts
associated with the different possible energy systems, these externalities must be brought to light
and discussed in an open manner.
This report examines the activities, operations, and impacts of Italy-based multinational power
company Enel. Headquartered in Rome, Enel is an energy giant. It is the largest power company in
Italy, Spain, Slovakia, and a number of major emerging economies in Latin American. In these
markets, Enel is a major player in several sub-sectors of the energy industry. Enel is Europe's
overall second-largest electric utility by installed capacity. Although Enel provides both electricity
and gas to its customers, this report focuses solely on Enel’s electricity production. Gas that is sold
directly to customers (i.e. not used for electricity production) is not taken into account in any of the
1
calculations in this report.
1.2. Aims and objectives
This report, commissioned by Greenpeace Italy, aims to raise public awareness about some of the
hidden costs and benefits of Enel’s electricity generation activities in order to contribute to an
informed and open public debate about national and international energy strategies.
The present report presents a fact-based profile and analysis of Enel’s current activities and
operations. Based on these activities and operations, the present report employs methods found in
the scientific and academic literature to estimate the company’s impacts on employment, the
climate, and public health. This provides a comprehensive picture of what Enel ‘is today’. The
report also provides a projection of what Enel’s activities and impacts will comprise in the future
based on the company’s current construction of new power plants and its stated plans for
additional new capacity. This provides an indication of what Enel ‘will be tomorrow’ if it follows its
‘business-as-usual’ strategic business plan. Finally, the present report conducts a type of ‘thought
experiment’ by envisioning a hypothetical future scenario for Enel. Based on a proposal from
Greenpeace Italy involving an expedited shift from coal-fired power to renewable energy
production, the present report calculates what Enel ‘could be tomorrow’ if it were to abandon its
1
Enel company profile, 30 September 2011,
http://www.enel.com/en-GB/doc/group/profile/Enel_Company_profile_30_09_2011.pdf.
7own strategic scenario and undertake to invest in heavily renewable energy rather than coal in
Italy.
1.3. Research questions
In order to achieve these specific objectives and the overall aim, this report seeks to answer the
following research questions:
1. What is Enel today?
a) What basic company information can be gathered about Enel’s current corporate
structure and ownership, turnover and profits, geographical markets, market shares of
electricity generation and supply, and number of employees?
b) What characteristics does Enel’s current electricity production park exhibit in terms of
fuel mix of installed capacity (MW) and fuel mix of actual electricity production (GWh)?
c) How many people does Enel currently employ?
d) What is Enel’s current contribution to climate change in terms of:
o Aggregate CO2 emissions and emission intensity?
o Policy on climate change?
o Public (financial) support Enel has received for its activities related to climate
change?
o Climate change initiatives and instruments Enel uses or is involved in?
e) What other emissions to air from fossil fuel-based (in particular coal-fired) electricity
generation can be attributed to Enel?
f) Using the methods from the scientific literature identified in research question 2, what
quantified impacts on public health and associated economic losses resulting from
emissions to air of Enel’s fossil-fuel based power plants can be determined?
g) How much radioactive waste, total and per kWh of electricity generated, is currently
attributable to Enel’s nuclear power generation?
2. What will Enel be tomorrow?
a) What is the fuel mix of the new electricity generation capacity currently being
constructed by Enel?
b) What is the fuel mix of future electricity generation capacity that Enel is currently
planning or considering?
c) Based on these investments and plans, what characteristics will Enel’s future
electricity production park exhibit in terms of fuel mix of installed capacity (MW)?
d) Using methods found in the literature for calculating how much employment is
generated by investment in electricity generation capacity based on various fuels and
technologies, how much employment is Enel projected to generate in the future?
e) Using methods found in the scientific literature for calculating the impact on public
health and associated economic losses resulting from emissions to air of fossil-fuel
based power plants, what quantified impacts on public health and associated
economic losses will result from emissions to air of Enel’s planned fossil-fuel based
power plants?
f) Based on these investments and plans, how much radioactive waste will be produced
by Enel’s planned expansion of nuclear power capacity?
3. How could Enel provide a brighter, cleaner Italian tomorrow?
a) If Enel were to adopt a proposal from Greenpeace Italy involving an expedited shift
from coal-fired power to renewable energy production, what would the result be in
terms of the company’s impacts of fuel mix of its production park, employment
generation, emissions to air, and impact on public health?
8Enel Today & Tomorrow
1.4. Target groups
This report was commissioned by Greenpeace Italy to support their campaign for a more
sustainable energy system in Italy and more broadly in Europe. The primary intended beneficiaries
of the present research report are the societies and economies that pay the hidden costs of
electricity provision. The report’s target groups are policy makers, electricity companies, civil
society organizations and any other individuals or groups interested in participating in an open and
informed debate about energy systems.
1.5. Process and methods
Given the importance and complexity of the methods used for the present report, particularly
regarding Enel’s impact on public health and the associated costs, several specific elements of the
research methods employed in the researching of this report are described in detail in Chapter 2 of
the present report. This subsection contains a description of the more general methods and
process followed in researching, reviewing and drafting the present report.
The researching of this report involved solely desk research methods. The primary sources of
information relied upon in the research comprised scientific and academic literature; official Enel
publications and information such as its sustainability reports, annual reports, and website;
pollutant emissions data provided by Enel to the European Pollutant Release and Transfer Register
(E-PRTR); corporate information databases such as Bloomberg and LexisNexis; and a scan of
newspapers and websites.
SOMO provided Enel with an opportunity to provide comments on and corrections to a draft version
of the corporate profile. Enel accepted this opportunity and provided comments but insisted that it
strongly disagrees with SOMO’s assumption that Enel’s usage of coal is dangerous and contributes
to premature deaths. Enel further disagrees with the methods used in the report and the way in
which all the methods were employed. Some of Enel’s comments have nevertheless been
incorporated into the present version. The fact that Enel reviewed the draft and provided comments
does not imply that the company approves of or endorses any part of the present report. Enel
reserves all rights.
The interpretation and implementation of the methodology has also been reviewed by Dr. Mike
Holland, author of a 2011 European Environmental Agency report on the costs of air pollution from
2
industrial facilities , as well as experts at the Open University of the Netherlands and Greenpeace
International. SOMO is grateful to these reviewers for their helpful comments and suggestions for
improvement, but the contents of the present report remain the sole responsibility of SOMO.
1.6. Structure of the report
After a detailed description of the research methods in Chapter 2, the report proceeds to answer
the research questions outline above, with Chapter 3 concentrating on answering research
question 3 and the associated sub-questions, Chapter 4 focusing on research question 4 and sub-
questions, and Chapter 5 answering research question 5 and sub-questions. The report concludes
with some general implications and lessons.
2
EEA, Revealing the costs of air pollution from industrial facilities in Europe: EEA Technical Report No 15/2011
(Copenhagen: European Environment Agency, 2011).
9Enel Today & Tomorrow
2. Methodology
2.1. Methods used for quantifying impacts on public health
The methodology used by SOMO to quantify the public health impacts of air pollution from Enel’s
fossil fuel power plants in sections 3.6.3 and 4.3.2 has been developed for the European
Environment Agency (EEA) by a consortium led by the UK consultancy firm AEA Technology plc.
The report, entitled “Revealing the costs of air pollution from industrial facilities in Europe: EEA
Technical Report No 15/2011” (hereinafter “the EEA report”), has been used by the EEA to
estimate the economic impacts caused by air pollution from industrial facilities. The approach has
3 4
been fully documented by Holland et al. and the EEA.
The EEA report quantifies the damage costs to public health and the environment caused by
emissions of pollutants by European industrial facilities. These damage costs are generated by, for
example, medical costs of asthma patients whose illness has been aggravated by air pollution from
5
industrial facilities , or the costs of damage to food crops caused by air pollution from ozone. The
EEA uses pollutant emissions data from the European Pollutant Release and Transfer Register (E-
PRTR), and bases its approach on policy tools and methods that had already been developed prior
6
to the report. The European Union’s “Clean Air For Europe” (CAFE) programme is used as the
source of figures related to damages per tonne of emissions of the main air pollutants. In addition
to the EEA report, numerous reports and studies used by scientific agencies and policy makers
around the world have employed methods based on the CAFÉ programme. It must be mentioned
that the EEA methodology, like any methodology attempting to trace the complex relationship
between pollution, public health, and economic costs to society, has limitations. These limitation
are clearly presented in section 2.1.3 below. It also merits reiterating here that the present report
relies entirely on the EEA’s methodology. The present report merely applies the EEA methodology
specifically to Enel’s power plants in Italy. The only discretionary choice that SOMO has made is to
report the costs of premature mortality due to emissions of pollutants from power plants in terms of
value of a human life (Value of a Statistical Life, VSL), instead of reporting these costs in terms of
value of a life year (Value of a Life Year, VOLY). Both the EEA and the United States
Environmental Protection Agency use VSL (as is done here), but some experts prefer VOLY. Using
the VOLY instead of the VSL would lead to a lower determination of overall costs.
The economic costs of air pollution from industrial facilities are largely derived from the costs of air
pollution on human health. Key factors include the loss of human productivity due to illness,
hospitalisation costs, and the costs of premature deaths of some of these patients. All of these
factors are components of the overall economic impact of air pollution from industrial facilities,
though the costs of premature deaths represent by far the largest share of the costs. Thus, the
economic impact of air pollution cannot be calculated without also calculating and quantifying the
3
Holland, M., Pye S., Watkiss P., Droste-Franke B. & Bickel P, Damages per tonne emission of PM2.5, NH3, SO2, NOx
and VOCs from each EU25 Member State (excluding Cyprus) and surrounding seas(Didcot, UK: AEA Technology
Environment, 2005).
4
EEA, Revealing the costs of air pollution from industrial facilities in Europe: EEA Technical Report No 15/2011
(Copenhagen: European Environment Agency, 2011).
5
Some sources in the literature suggest that asthma may also be caused by ambient air pollution, though this view is far
from definitive. It should also be noted that industrial sources are not the only source of air pollution of concern– the
transport, agriculture and domestic sectors all provide major contributions to the European air pollution climate.
6
EEA, Revealing the costs of air pollution from industrial facilities in Europe: EEA Technical Report No 15/2011
(Copenhagen: European Environment Agency, 2011).
10Enel Today & Tomorrow
costs of illness, disease, and premature deaths due to air pollution. The calculation of the cost of
premature deaths depends on two factors: 1) the economic value that is given to the social
preference to reduce risk to human health, which can be expressed in ‘value of a statistical life’
(VSL) or value of a life year (VOLY), and 2) the actual number of premature deaths.
The estimates of health impacts include five separate pathways. Emissions of particulate matter
(PM) contribute to primary particulate matter concentrations. Emissions of sulphur dioxide (SO2)
and nitrogen oxides (NOx) affect concentrations of secondary PM and ozone. The increased
7
concentrations of PM and ozone cause a range of health impacts (see the box below). Only the
health impacts related to the three abovementioned emissions, PM, SO2 and NOx, are included in
the SOMO estimates. Heavy metals and organic toxins are not included in the present study, but
doing so would increase the calculated health impacts.
Common high-impact air pollutants
NOX
Nitrogen oxides, such as nitrogen dioxide (NO2), are a product of combustion processes and have adverse
respiratory effects. NOx can cause bronchitis and in high concentrations, the oxides are toxic and cause
inflammation. NOx can react or connect with other small particles to form small particulate matter that
8
damages the lungs.
SOX
Sulphur oxides, like nitrogen oxides, can cause or aggravate respiratory problems and cardiac disease.
Sulphur occurs naturally in most fossil fuels and sulphur dioxide (SO2) are produced on a large scale in
industrial processes, the most important of which is fossil fuel combustion.
PMX
Particulate matter (PM) is a mixture of various small airborne particles. The components vary and include
materials such as nitrogen and sulphur oxides, dust, metals, and soil. Upon inhalation, the small particles
easily enter lung and heart cells, and damage the organs. This effect becomes stronger with decreasing
particle size. Usually, PMX is noted as PM10 or PM2.5, whereby the number does not indicate the number of
atoms but the maximum diameter of the particles in micrometers (µm). PM is emitted from fires and from
reactions between emittants near roads and industrial facilities.
O3
Ozone is a naturally occurring gas that can be found in the stratosphere as well as the atmosphere. Ozone at
ground level is mostly formed through photochemical reactions between products that are created by human
activities. Volatile organic compounds react with nitrogen oxides (NOx) under the influence of sunlight.
Hereby, ozone is formed. When inhaled regularly, ozone can damage the respiratory system, which can even
9
lead to premature death.
Human health effects caused by exposure to ozone
“The relationship between the severity of the effect and the proportion of the population experiencing the
effect can be presented as a pyramid. Many individuals experience the least serious, most common effects
shown at the bottom of the pyramid. Fewer individuals experience the more severe effects such as
hospitalization or death.”10
7
World Health Organization, http://www.who.int/mediacentre/factsheets/fs313/en/index.html (23 February 2012).
8
U.S. Environmental Protection Agency, http://www.epa.gov/air/nitrogenoxides/health.html (23 February 2012).
9
U.S. Environmental Protection Agency, http://www.epa.gov/o3healthtraining/population.html (24 April 2012).
10
U.S. Environmental Protection Agency, “Health effects of ozone in the general population”,
http://www.epa.gov/o3healthtraining/population.html (24 April 2012).
11The U.S. Environmental Protection Agency illustrates the effects of exposure to ozone
The first step in implementing the methodology is obtaining data on air pollution emissions from
Enel’s power plants. For large operational industrial facilities in Europe, this data is available in the
11
European Pollutant Release and Transfer Register (E-PRTR) database maintained by the EEA.
In order to calculate the projected emissions (in Chapter 4) of the four power plants that Enel is
constructing or planning but which are not yet optional, several assumptions must be made. The
basis of the projections in all cases are the environmental impact assessments (EIAs) for the plants
12
and other publicly available information. In addition, the following assumptions are made. All four
plants are assumed to operate at 7,500 full load hours. Since Rossano Calabro values are given
3
both as mg/Nm and t/h, these were used to convert the others. The reported efficiencies for
Rossano Calabro and Porto Tolle are the same, thus values were scaled up by higher output
based on larger capacity. Nameplate capacity for Porto Tolle is assumed to be 1,980 MW.
Nameplate capacity for Porto Romano includes two units of 800 MW, but given that some
ambiguity exists about the two units, only one 800MW unit is used for the calculations in order to
err on the side of a more conservative estimate of emissions. The emissions-to-concentration
factors are adjusted for Italy, Romania, and Albania as appropriate.
The second step is estimating how the emissions affect the ambient concentrations of particulate
matter and ozone that the population is exposed to. This is done with atmospheric modelling
carried out by the Co-operative Programme for Monitoring and Evaluation of the Long-range
Transmission of Air Pollutants in Europe (EMEP programme). The models include data on
population density and weather patterns on a given year. The output from the modelling is in the
form of source-receptor matrices, which give the increase in exposure to ambient PM2.5 and ozone
3
(as µg/m /person) as a result of the emission of one tonne of SO2, NOx or PM2.5. These matrices
are calculated separately for each European country. EMEP describes the matrices as follows:
“Source-receptor (SR) matrices give the change in various pollution levels in each receptor country
11
EC DG ENV, European Pollutant Release and Transfer Register (E-PRTR) : Summary tables. (Brussels: European
Commission Directorate-General for Environment, 2011). Available at http://www.eea.europa.eu/data-and-
maps/data/member-states-reporting-art-7-under-the-european-pollutant-release-and-transfer-register-e-prtr-regulation-4.
12
Base information for each plant found here: Rossano Calabro (http://www.autistici.org/difendiamolacalabria/wp-
content/uploads/2010/05/SIA_ROSSANO-SNT_aprile2010.pdf), Porto Tolle
(http://www.cslforum.org/publications/documents/Edmonton2011/Barbucci-TG-ZEPTProject-Edmonton0511.pdf), Porto
Romano (http://www.scribd.com/doc/72026971/131/Ndikimet), Galati
(http://www.mediu.gov.md/file/Evenimente/Memoriu%20de%20prezentare.pdf), all accessed 3 April 2012.
12Enel Today & Tomorrow
(or grid square) resulting from a change in anthropogenic emissions from each individual emitter.
Such matrices are generated by reducing emissions for each emitter of one or more precursors by
a given percentage (15% in this case), running the EMEP model with these reduced emissions,
and comparing the resulting output fields with the base simulation, i.e. a simulation without any
emission reduction. The reason for this procedure is to keep the chemical conditions as close to
the original conditions as possible.” SOMO uses new matrices that were prepared for the EEA
13
report. These matrices were not published but they were obtained from the authors of the report
and are included in Appendix 1. As the dispersion of emissions from different industrial sources
depends on factors such as stack height and flue gas velocity and temperature, sectoral
adjustment factors are used to adjust the source-receptor matrices to reflect impacts from the
power sector. The last step is using risk factors based on epidemiological studies to estimate
health impacts resulting from the increases in ambient PM2.5 and ozone concentrations. For
3
example, it is estimated that if the ambient concentration of PM2.5 increases by 10 µg/m for a year,
there will be approximately six premature deaths per 100,000 people.
2.1.1. Health effects and associated risk factors
14
Table 1: PM2.5 health effects quantified and risk factors used
Health end-point Cases per
3
µg/m /person/year
exposure
Chronic mortality (premature deaths) 6.07E-05
Chronic mortality (life years lost) 6.51E-04
Infant mortality (1 – 11 months) 1.05E-07
Chronic bronchitis, population aged over 27 years 2.85E-05
Respiratory hospital admissions, all ages 1.08E-05
Cardiac hospital admissions, all ages 6.68E-06
Restricted activity days (RADs) working age population 6.06E-02
Respiratory medication use by adults 5.14E-03
Respiratory medication use by children 6.21E-04
Lower respiratory syndromes (LRS), including cough, among adults with chronic 4.91E-02
symptoms
LRS (including cough) among children 3.19E-02
Consultations for asthma, ages 0-14 3.08E-05
Consultations for asthma, ages 15-64 5.29E-05
Consultations for asthma, ages over 65 2.31E-05
Consultations for upper respiratory symptoms (excluding allergic rhinitis) 1.05E-04
ages 0-14
Consultations for upper respiratory symptoms (excluding allergic rhinitis) 3.35E-04
ages 15-64
Consultations for upper respiratory symptoms (excluding allergic rhinitis) 1.13E-04
ages over 65
Restricted activity days, non-working age population 2.96E-02
13
EEA, Revealing the costs of air pollution from industrial facilities in Europe: EEA Technical Report No 15/2011
(Copenhagen: European Environment Agency, 2011).
14
Holland, M., Pye S., Watkiss P., Droste-Franke B. & Bickel P, Damages per tonne emission of PM2.5, NH3, SO2, NOx
and VOCs from each EU25 Member State (excluding Cyprus) and surrounding seas(Didcot, UK: AEA Technology
Environment, 2005), p.9.
1315
Table 2: Ozone health effects quantified and risk factors used
3
Health end-point Cases per 10 µg/m /person/year
increase in 8-hour daily
16
average ozone
17 1.80E-08
Acute mortality (life years lost)
Respiratory hospital admissions, ages over 65 1.02E-08
Minor restricted activity days, ages 18-64 4.06E-05
Respiratory medication use by adults 1.48E-05
Minor restricted activity days, ages over 65 1.00E-05
Respiratory symptoms among adults 1.89E-04
2.1.2. Sample calculations
This section provides some sample calculations using the example of the Enel’s Federico II coal-
fired power plant in Italy. The source notes for all data and factors employed in these calculations
are given below.
Table 3: Sample calculation of premature deaths and economic losses from PM2.5
associated with Enel’s Federico II coal-fired power plant in Italy
PM10 NOx SO2
Emissions, tonnes per year 473 7,300 6,540
TIMES
PM10 to PM2.5 conversion factor 0.649 1 1
TIMES
Emissions-to-concentration factors for Italy 703.69 156.66 153.84
TIMES
Power sector adjustment factors 0.5 0.78 0.87
EQUALS
Increase in population-weighted 1,875,407
3
concentrations, µg/m /person
TIMES
-5
Risk factor for chronic premature deaths 6.0665 x 10
EQUALS
Amount of premature deaths caused per year 113.77
TIMES
Value of statistical life, M€ 2.00
EQUALS
Economic losses due to premature deaths, M€ 227.54
15
Holland, M., Pye S., Watkiss P., Droste-Franke B. & Bickel P, Damages per tonne emission of PM2.5, NH3, SO2, NOx
and VOCs from each EU25 Member State (excluding Cyprus) and surrounding seas(Didcot, UK: AEA Technology
Environment, 2005), p.10.
16
As health impacts of ozone at concentrations below 35 parts per billion are not directly proven by epidemiological
studies, the ozone concentrations used by EEA are SOMO35 (sum of mean ozone over 35 ppb).
17
An average loss of life expectancy amongst those affected of 1 year is estimated.
14Enel Today & Tomorrow
Table 4: Sample calculation of premature deaths and economic losses from ozone
associated with Enel’s Federico II coal-fired power plant in Italy
PM10 NOx SO2
Emissions, tonnes per year 473 7,300 6,540
TIMES
Emissions-to-concentration factors 0 54,142 -9,496
for Italy
TIMES
Power sector adjustment factors 0.5 0.78 0.87
EQUALS
Increase in population-weighted 6,630,231
3
concentrations, µg/m /person
TIMES
-8
Risk factor for chronic premature 1.7985 x 10
deaths
EQUALS
Amount of premature deaths 4.57
caused per year
TIMES
18
VOLY (€ million) €0.12
EQUALS
Economic losses due to premature 0.549
deaths (€ million)
The same calculation is repeated for each health effect quantified. The valuation for CO2 emissions
was derived from EEA report, which assumes €33.6/tonne CO2 and is based on methodology
19
created by the UK government.
Table 5: Source notes for numbers
Data Reference
20
Emissions, tonnes per year EC DG ENV
21
PM10 to PM2.5 conversion factor EEA
22
Power sector adjustment factors EEA
23
Emissions-to-concentration factors for Italy Holland et al
24
Risk factor for chronic premature deaths Holland et al
25
VSL/VOLY, € million Holland et al
2.1.3. Limitations of the EEA methodology and potential impact on results
18
The EEA analysis did not apply the VSL to ozone deaths because they were all linked to short term exposure to ozone
(the PM analysis looked at response functions dealing with long term exposure).
19
EEA, Revealing the costs of air pollution from industrial facilities in Europe: EEA Technical Report No 15/2011
(Copenhagen: European Environment Agency, 2011), p.21.
20
EC DG ENV, European Pollutant Release and Transfer Register (E-PRTR) : Summary tables. (Brussels: European
Commission Directorate-General for Environment, 2011). Available at http://www.eea.europa.eu/data-and-
maps/data/member-states-reporting-art-7-under-the-european-pollutant-release-and-transfer-register-e-prtr-regulation-4.
21
EEA, Revealing the costs of air pollution from industrial facilities in Europe: EEA Technical Report No 15/2011
(Copenhagen: European Environment Agency, 2011), p.19.
22
Ibid, p.68-9.
23
Holland, M., Pye S., Watkiss P., Droste-Franke B. & Bickel P, Damages per tonne emission of PM2.5, NH3, SO2, NOx
and VOCs from each EU25 Member State (excluding Cyprus) and surrounding seas(Didcot, UK: AEA Technology
Environment, 2005), p.23-24.
24
Ibid, p.9-10.
25
Ibid, p.9.
15The EEA report upon which the calculations are based mentions that impact assessment and
valuation methodologies are imperfect and are continuously being improved and refined. This
implies that the methods employed to calculate damage costs are expected to be adjusted in future
calculations. However, while the specific values of the quantified health impacts and economic
costs may shift upward or downward as a result of fine-tuning the methodology, the overall
direction and magnitude of the impacts are not likely to change. The EEA does not anticipate any
26
major changes in results for importance of individual sectors and pollutants.
The E-PRTR database from which the emission numbers for the calculations are taken is not an
ideal database. Emissions are reported by industrial facilities themselves, and are not checked
carefully by authorities. As it is assumed that no operator has interest in overstating its own
emissions, the E-PRTR emissions data will more probably be underestimations than
overestimations. Also, there is a threshold for reporting emissions under which emissions do not
have to be reported. Another drawback of the E-PRTR database is that fuel consumption is not
reported. Doing so would provide users with a more complete picture of the relative performance of
a plant.
Damage cost calculations always contain uncertainties. They depend on the choice of exposure
methods, dispersion models, and estimations of the impact of pollutants. These choices always
involve a trade-off. The EEA has carefully chosen to work with methods and numbers that should
not overestimate costs. For example, it is still unclear what the costs of greenhouse gas (GHG)
emissions will eventually be for society, and estimates vary heavily. In the present report, we have
chosen to always use the most conservative estimations from the EEA report. Thus, for GHG
27
emissions, it was chosen to use the value of €33.6 per metric tonne assumed by the EEA . While
the current quotation for CO2 on pointcarbon.com is around €7/t, many economists and
environmental agencies expect that this value should and will be much higher. For example, the
International Energy Agency projects in its World Energy Outlook 2010 that the CO2 price may rise
28
to US$120 per tonne by 2035.
Finally, it should be noted that the EEA methodology does not, nor was it intended to, include the
socio-economic benefits of electricity production from power plants.
Despite these limitations, SOMO believes that the EEA report provides a sound methodological
basis for estimating the public health impacts and associated costs of Enel’s power plants.
2.2. Methods for calculating investments in new generation
capacity: current construction works vs. future plans
In section 4.1 on Enel’s investments in new electricity generation capacity, a distinction is made
between current construction works and the company’s future plans for investment. Current
construction works are projects that are already under construction for which the Euros are already
flowing, meaning that investment amounts are relatively certain (realizing, of course, that
construction projects sometimes run over budget). On the other hand, future plans refer to
investment projects for which construction has not yet started and thus for which there remains a
26
EEA report Revealing the costs of air pollution from industrial facilities in Europe, p.12.
27
It can also be argued that using marginal abatement cost is appropriate to valuate costs of CO2 emissions, which would
be $70/ton for a 2 degree global warming scenario minimally.
28
International Energy Agency, World Energy Outlook 2010, table 1.5: CO2 Price assumptions in selected regions by
scenario ($ per tonne).
16Enel Today & Tomorrow
very real possibility that the company may still modify or cancel the project. Projects and
investment figures for the latter category are far less certain and should thus be viewed with a
higher degree of reservation.
It should be noted that construction works that were completed in 2011 are still included as ongoing
construction works in this report. This is due to the fact that at time of writing this report (first
quarter of 2012), the most recent information on Enel’s investments and plans were its 2010
Annual, Sustainability and Environmental reports (see section 3.4), which include 2011 projects as
on-going projects. On 8 March 2012, Enel published its “2011 Results & 2012-2016 Plans”
29
presentation , but this does not contain comprehensive information on specific investments in
electricity generation projects.
Finally, it should be noted that future investment plans are often announced, and an amount of
money is mentioned without specifying the projects for which this money is reserved. In such
cases, there is a high risk of ‘double counting’, as some of the projects for which this money is
reserved have been announced, while others have not. It is often not specifically mentioned
whether these projects are part of the overall announced investment budget or not. For this reason,
overall investment figures that are not assigned to particular investment projects are not taken up in
the tables for investment plans. However, they are mentioned in the text where relevant.
2.3. Methods used to calculate future employment generation
In section 4.2, SOMO estimates the employment that will be generated by the new capacity that
Enel is currently constructing and planning. Future employment generation calculations are based
on the methodology developed by Greenpeace International and the European Renewable Energy
30
Council. The method distinguishes between the number of ‘person years’ per MW installed
capacity that will be created during the construction/manufacturing/installation period of a power
plants and the jobs per MW installed capacity that are created and will continue to be required
during the entire operational life time of a power plant. The calculations are based on the total
nameplate capacity planned for each electricity generation technology (i.e. coal, hydro, wind, etc).
2.4. Methods used in the hypothetical scenario in Chapter 5
The scenario in chapter 5 is based on proposals by the European Renewable Energy Council and
31
Greenpeace International related to developing an electricity supply system based on renewable
energy sources. Greenpeace’s investment cost assumptions and predicted employment figures for
various energy sources in 2020 and 2030 have been used as a basis for the calculations. The
renewable energy breakdown was proposed by Greenpeace, and also took into consideration
which options seem most appropriate for the Italian situation given technical potentials.
29
Enel presentation “2011 Results 2012-2016 Plans”, 8 March 2012, Enel website, Investor, Presentations, 2012
(03/03/2012).
30
Greenpeace International and European Renewable Energy Council, “Energy [R ]evolution – A sustainable world energy
outlook”, June 2010, p. 138,
http://www.greenpeace.org/international/Global/international/publications/climate/2010/fullreport.pdf.
31
Greenpeace International and European Renewable Energy Council, “Energy [R ]evolution – A sustainable world energy
outlook”, June 2010, p. 138,
http://www.greenpeace.org/international/Global/international/publications/climate/2010/fullreport.pdf.
173. What is Enel today?
3.1. Basic company information
32
Enel SpA is an Italian multinational energy company, headquartered in Rome and listed on the
Milan stock exchange. It is the largest power company in Italy, Spain, Slovakia and a number of
33
major Latin American countries and is Europe's second-largest utility by installed capacity. It is an
integrated player which produces, distributes and sells electricity and gas. After the acquisition of
the Spanish utility Endesa, Enel is now present in 40 countries with around 97,000 MW installed
34
capacity and it serves 61 million power and gas customers. Enel operates power plants for
hydroelectric, thermoelectric, nuclear, geothermal, wind and photovoltaic power generation in 23
35
countries worldwide. Enel’s shares are divided among 1.4 million shareholders, the largest of
36
which is the Italian Ministry for the Economy and Finance with 31.24% of shares. Other
shareholders include investment funds, pension funds and insurance companies.
3.1.1. Divisions
Four of Enel’s divisions are involved in the generation of electricity. The Generation and Energy
Management Division is responsible for the generation and sale of electricity in Italy and the trading
on domestic and international markets. The Iberia and Latin America Division focuses on
developing Enel’s presence and coordinating its operations in the electricity and gas markets of
Spain, Portugal and Latin America. The mission of the International Division is to support Enel’s
strategies for international growth, as well as to manage and integrate the foreign businesses not
included in the Iberia and Latin America Division. The Renewable Energy Division develops and
manages renewable energy operations worldwide. Table 6 gives an overview of where these
divisions are active. In December 2008 Enel established Enel Green Power, the Group’s company
dedicated to developing and managing worldwide energy generation from renewable sources,
operating around 6,500 MW in plants relying on hydro, wind, geothermal, solar and biomass
37
sources in 16 countries in Europe and the Americas. This subsidiary falls under the Renewable
Energy Division.
Table 6: Enel's divisions and areas of activity
Division Area
Generation and Energy Management Italy
Iberia and Latin America Spain, Portugal, Latin America, Ireland
International Division France, Belgium, Central and South-Eastern Europe,
Russia
Renewable Energy Division (incl. Enel Green Power) Italy, Europe, Americas
32
SpA stands for Società per Azioni and can be translated as joint stock company; a limited liability corporation.
33
Enel company profile, 30 September 2011, http://www.enel.com/en-
GB/doc/group/profile/Enel_Company_profile_30_09_2011.pdf.
34
Enel company profile, 30 September 2011, http://www.enel.com/en-
GB/doc/group/profile/Enel_Company_profile_30_09_2011.pdf.
35
Enel website, Group, About us, Business, Production, http://www.enel.com/en-
GB/group/about_us/business/production/index.aspx (01/02/2012).
36
Enel company profile, 30 September 2011, http://www.enel.com/en-
GB/doc/group/profile/Enel_Company_profile_30_09_2011.pdf.
37
Enel Green Power website, About us, Where we operate, http://www.enelgreenpower.com/en-GB/company/worldwide/
(01/02/2012).
18You can also read