Stranded Assets and Subcritical Coal - The Risk to Companies and Investors March 2015 - Smith School of ...
←
→
Page content transcription
If your browser does not render page correctly, please read the page content below

Stranded Assets and
Subcritical Coal
The Risk to Companies and Investors

March 2015
Authors Ben Caldecott | Gerard Dericks | James Mitchell
About the Stranded Asset Programme

Stranded assets are assets that have suffered from unanticipated or premature write-downs, devaluations,
or conversion to liabilities and they can be caused by a variety of risks. Increasingly risk factors related to the
environment are stranding assets and this trend is accelerating, potentially representing a discontinuity able
to profoundly alter asset values across a wide range of sectors.

The Stranded Assets Programme at the University of Oxford’s Smith School of Enterprise and the Environment
was established in 2012 to understand environment-related risks driving asset stranding in different sectors and
systemically. We research the materiality of environment-related risks over time, how different risks might be
interrelated, and the potential impacts of stranded assets on investors, businesses, regulators, and policymakers.
We also work with partners to develop strategies to manage the consequences of environment-related risks
and stranded assets.

The programme is based in a world leading university with a global reach and reputation. We are the only
academic institution conducting work in a significant and coordinated way on stranded assets. We work with
leading practitioners from across the investment chain (e.g. actuaries, asset owners, asset managers, accountants,
investment consultants, lawyers), with firms and their management, and with experts from a wide range of
related subject areas (e.g. finance, economics, management, geography, anthropology, climate science, law,
area studies) within the University of Oxford and beyond.

We have created the Stranded Assets Research Network, which brings together researchers, research institutions,
and practitioners working on these and related issues internationally to share expertise. We have also created
the Stranded Assets Forums, which are a series of private workshops to explore the issues involved. The
Global Stranded Assets Advisory Council that guides the programme contains many of the key individuals
and organisations involved in developing the emergent stranded assets agenda. The council also has a role in
helping to informally co-ordinate and share information on stranded assets work internationally.

ISBN 978-0-9927618-1-3

Stranded Assets and Subcritical Coal: The Risk to Companies and Investors                                             2

The Programme is led by Ben Caldecott and its work is guided by the Global Stranded Assets Advisory Council chaired
by Professor Gordon Clark, Director of the Smith School. The Council is also a high-level forum for work on stranded
assets to be co-ordinated internationally. Members currently include:

Jane Ambachtsheer	Partner and Global Head of Responsible Investment, Mercer Investment and Adjunct
                   Professor, University of Toronto
Rob Bailey                          Research Director, Energy, Environment and Resources, Chatham House
Vicki Bakhshi                       Director, Head of Governance & Sustainable Investment, F&C Asset Management
Philippe Benoit                     Head, Energy Efficiency and Environment Division, International Energy Agency
Robin Bidwell                       Group President, ERM
David Blood                         Co-Founder and Senior Partner, Generation IM
Yvo de Boer                         Director General, Global Green Growth Institute
Susan Burns                         Founder and CEO, Global Footprint Network
James Cameron                       Chairman, Climate Change Capital and Overseas Development Institute
Mike Clark                          Institute and Faculty of Actuaries, also Director, Responsible Investment, Russell Investments
Professor Robert Eccles             Professor of Management Practice, Harvard Business School
Jessica Fries                       Executive Chairman, The Prince’s Accounting for Sustainability Project (A4S)
Professor Charles Godfray           Director, Oxford Martin Programme on the Future of Food
Ben Goldsmith                       Founding Partner, WHEB
Thomas Heller                       Executive Director, Climate Policy Initiative
Anthony Hobley                      CEO, Carbon Tracker Initiative
Catherine Howarth                   CEO, ShareAction
Michael Jacobs                      Senior Advisor, IDDRI
Zoe Knight                          Climate Change Centre of Excellence, HSBC
Roland Kupers                       Visiting Fellow, Smith School of Enterprise and the Environment, University of Oxford
Bernice Lee                         Director, Climate Change and Resource Initiatives, World Economic Forum
Michael Liebreich                   Chairman, Advisory Board, Bloomberg New Energy Finance
Mindy Lubber                        President, Ceres
Nick Mabey                          CEO, E3G
Richard Mattison                    CEO, Trucost
David Nussbaum                      CEO, WWF-UK
Stephanie Pfeifer                   CEO, Institutional Investors Group on Climate Change
Julian Poulter                      Executive Director, Asset Owners Disclosure Project
Nick Robins                         Co-Director, UNEP Inquiry into a Sustainable Financial System
Paul Simpson                        CEO, Carbon Disclosure Project
James Stacey                        Partner, Earth Capital Partners LLP
James Thornton                      CEO, ClientEarth
Simon Upton                         Director, Environment Directorate, OECD
Steve Waygood                       Chief Responsible Investment Officer, Aviva Investors
Michael Wilkins                     Managing Director, Infrastructure Finance Ratings, Standard & Poor’s
Simon Zadek                         Tsinghua School of Economics and Management
Dimitri Zenghelis                   Principal Research Fellow, Grantham Institute, London School of Economics

Stranded Assets and Subcritical Coal: The Risk to Companies and Investors                                                            3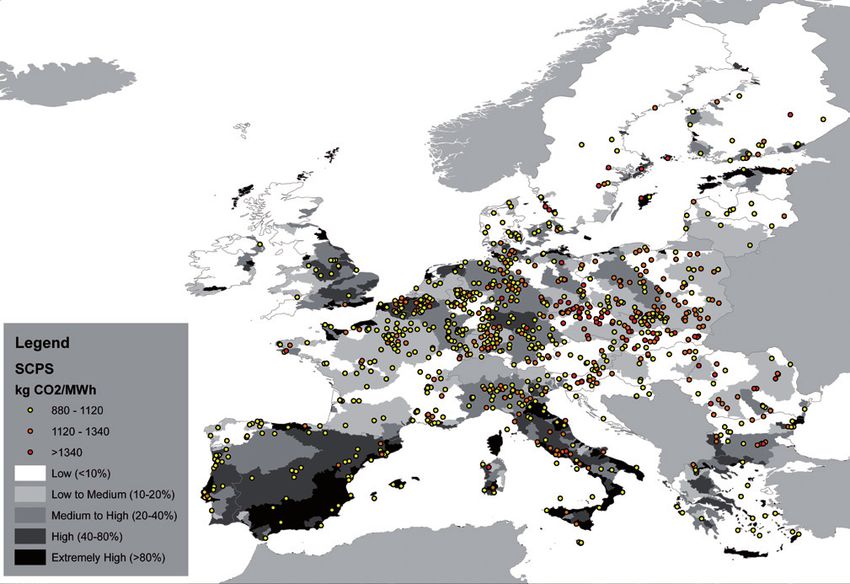
About the Authors

Ben Caldecott is Director of the Stranded Assets Programme at the University of Oxford’s Smith School of
Enterprise and the Environment. He is concurrently an Adviser to The Prince of Wales’ International Sustainability
Unit, an Academic Visitor at the Bank of England, and a Visiting Fellow at the University of Sydney.

Gerard Dericks is a Postdoctoral Research Fellow in the Stranded Assets Programme at the University of Oxford’s
Smith School of Enterprise and the Environment. Prior to joining the Smith School he was an analyst at Property
Market Analysis LLP and research consultant for Policy Exchange in London. He holds a PhD and MSc from the
London School of Economics and a BA from Ritsumeikan University.

James Mitchell is a Research Assistant in the Stranded Assets Programme at the University of Oxford’s Smith
School of Enterprise and the Environment. He holds a Master’s in Nature, Society & Environmental Policy from
the University of Oxford and is also an Associate at the Carbon War Room.

Stranded Assets and Subcritical Coal: The Risk to Companies and Investors                                            4
Acknowledgements

This report would not have been possible without support from the Generation Foundation and the HSBC Climate
Change Centre of Excellence. The HSBC Centre, headed by Zoe Knight, analyses the strategic implications of
climate change for HSBC and its clients, and supports independent research into new areas of inquiry in the
transition to a low-carbon, climate resilient economy.

The authors would like to gratefully acknowledge the experts we interviewed throughout the research process
and the reviewers who provided invaluable advice and feedback. The authors would particularly like to thank
Simon Abele for his expert research assistance, Christine-Marie Louw for her South African legal expertise and
advice, and Ted Nace for his kind assistance with the CoalSwarm Global Coal Plant Tracker data.

Disclaimer

The Chancellor, Masters, and Scholars of the University of Oxford make no representations and provide no warranties in relation to any
aspect of this publication, including regarding the advisability of investing in any particular company or investment fund or other vehicle.
While we have obtained information believed to be reliable, neither the University, nor any of its employees, students, or appointees, shall
be liable for any claims or losses of any nature in connection with information contained in this document, including but not limited to,
lost profits or punitive or consequential damages.

Stranded Assets and Subcritical Coal: The Risk to Companies and Investors                                                                      5
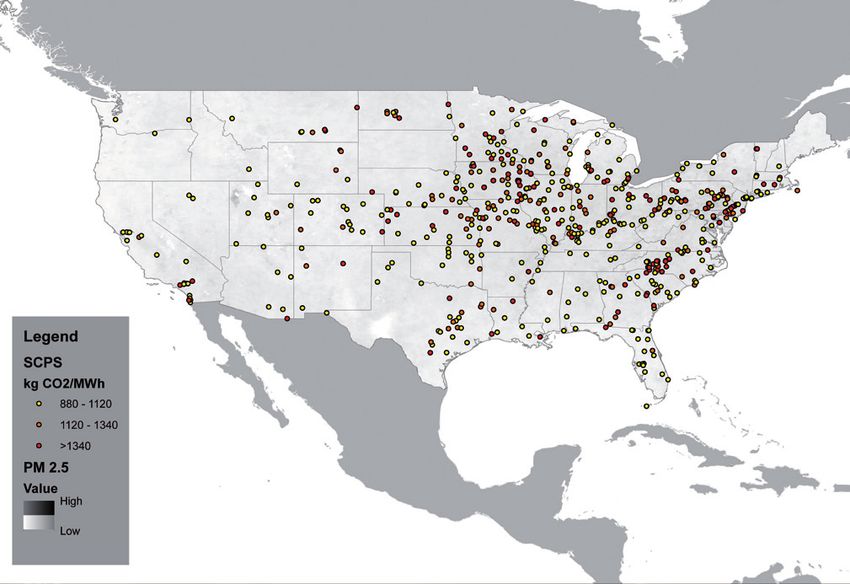
Table of Contents
02		  About the Stranded Assets Programme
04		 About the Authors
05 		 Acknowledgements
05 		 University of Oxford Disclaimer

08 		 Executive Summary
09		  Determining carbon, air pollution, and water stress exposure
09		 Company Portfolios
10		 China: SCPS Fleet on the Wrong Side of the Kuznets Curve
10		 US and EU: Existing and Impending Regulations Close Ageing Generators
11		 India: Water Already a Serious Risk Factor
11		 Implications for Investors, Companies, and NGOs
12		 Research Extensions

13		   1. Introduction

14		 2. Subcritical Coal-Fired Technology
14		 Technologically Vulnerable
15		 Vulnerability: GHG Policies
16		 Vulnerability: Non-GHG Policies
17		 Vulnerability: Water Policies

18		 3. Subcritical Coal-Fired Technology
18		 Global SCPS Overview
19		 SCPS Carbon Intensity
20		 SCPSs and PM 2.5 Air Pollution
22		 SCPSs and Water Stress

24		   4. Analysis of National SCPS Fleets
24		 China
24		 Overview of Subcritical Stock and Trends
25		 Station Efficiency and Forthcoming GHG Policies
27		 PM 2.5 Pollution and Forthcoming Non-GHG Emission Policies
28		 Water Stress and Forthcoming Water Policies

29		 United States
29		 Overview of Subcritical Stock and Trends
30		 Station Efficiency and Forthcoming GHG Policies
31		 PM 2.5 Pollution and Forthcoming Non-GHG Emission Policies
32		 Water Stress and Forthcoming Water Policies

33		 European Union
33		 Overview of Subcritical Stock and Trends
35		 Station Efficiency and Forthcoming GHG Policies
36		 PM 2.5 Pollution and Forthcoming Non-GHG Emission Policies
37		 Water Stress and Forthcoming Water Policies

Stranded Assets and Subcritical Coal: The Risk to Companies and Investors    6
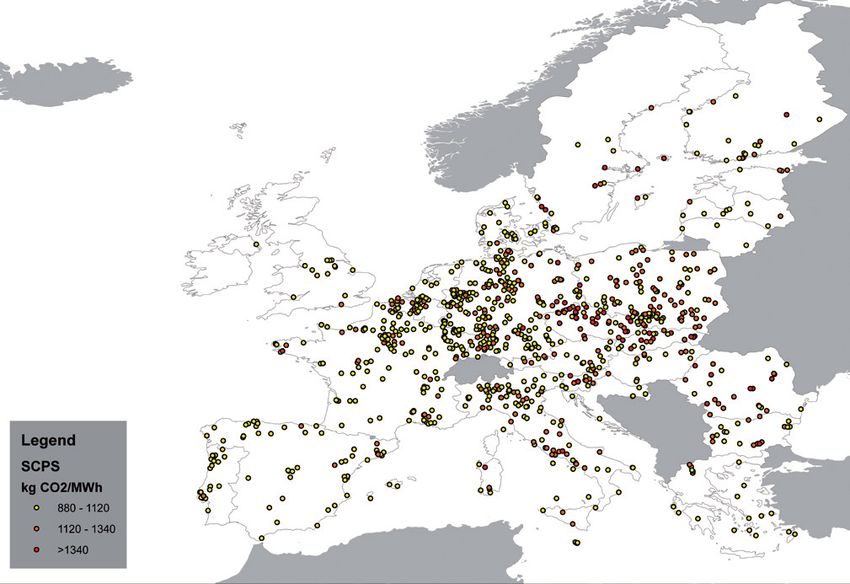
Table of Contents Continued...
38		   India
38		   Overview of Subcritical Stock and Trends
39		   Station Efficiency and Forthcoming GHG Policies
40		   PM 2.5 Pollution and Forthcoming Non-GHG Emission Policies
41		   Water Stress and Forthcoming Water Policies
43		 Australia
43		 Overview of Subcritical Stock and Trends
44		 Station Efficiency and Forthcoming GHG Policies
45		 PM 2.5 Pollution and Forthcoming Non-GHG Emission Policies
46		 Water Stress and Forthcoming Water Policies

47		   South Africa
47		   Overview of Subcritical Stock and Trends
48		   Station Efficiency and Forthcoming GHG Policies
49		   PM 2.5 Pollution and Forthcoming Non-GHG Emission Policies
51		   Water Stress and Forthcoming Water Policies
52		   Indonesia
52		   Overview of Subcritical Stock and Trends
53		   Station Efficiency and Forthcoming GHG Policies
54		   PM 2.5 Pollution and Forthcoming Non-GHG Emission Policies
55		   Water Stress and Forthcoming Water Policies
56		   Summary Tables of Selected National Coal-Fired Power Plant Portfolios

58		   5. Analysis of SCPS Exposure
58		   Largest Company SCPS Portfolios
68		   SCPS Portfolio Carbon Intensity
69		   SCPS Portfolio Ambient PM2.5 Air Pollution
70		   Company SCPS Portfolios Water Stress

71		   6. Conclusion
71		   China: SCPS Fleet on the Wrong Side of the Kuznets Curve
71		   US and EU: Existing and Impending Regulations Close Ageing Generators
72		   India: Water Already a Serious Risk Factor
72		   Implications for Investors, Companies, and NGOs
73		   Research Extensions

74		 Appendix
74		 Power Plant Data Notes
74		 Particulate Matter (PM) 2.5 Data Notes
74		 Water Stress Data Notes

75		   Bibliography

Stranded Assets and Subcritical Coal: The Risk to Companies and Investors      7
Executive Summary
Coal provides 40% of the world’s electricity, with 1,617 GW of global capacity. Of this capacity, 75% is subcritical,
22% supercritical, and 3% ultra-supercritical. Subcritical is the least efficient and most polluting form of coal-
fired generation - it requires more fuel and water to generate the same amount of power, and creates more
pollution as a result. The average subcritical coal-fired power station (SCPS) emits 75% more carbon pollution
than an average advanced ultra-supercritical - the most up-to-date form of coal-fired power station - and uses
67% more water. While the average age of all coal-fired power stations globally is 21 years, ultra-supercritical
power stations are considerably younger, with an average age of just 5 years.

To limit global emissions to a level consistent with a 2°C future, the IEA estimates that it will be necessary
to close 290 GW of subcritical generation worldwide by 2020. Subcritical coal accounted for 8.6 GtCO2 of
emissions globally in 2009. For context, in 2010 annual gross greenhouse gas emissions globally totalled ~50
GtCO2-equivalent, with ocean and land sinks absorbing just over 50% of these emissions, resulting in net
atmospheric emissions of around 22 GtCO2 per annum.

Since SCPSs are the least efficient and most greenhouse gas (GHG) intensive centralised generation
technology, they are both vulnerable to regulation and a logical first step in any climate mitigation strategy.
Furthermore, because subcritical plants are typically the oldest part of nations’ power generation fleet, they
may also represent a practical policy choice for closure by budget-constrained policymakers looking for cost-
effective emissions reductions.

Coal-fired Environmental Effects by Generation Efficiency, Base-level = 100

 Generation Efficiency                       Carbon Intensity               Air Pollution        Water Stress

 Old Inefficient Subcritical                        100                         100                  100

 Old Efficient Subcritical                           84                          84                   85

 New Subcritical                                     68                          68                   70

 Supercritical                                       57                          57                   60

 Ultra-Supercritical                                 52                          52                   55

 Advanced Ultra-Supercritical                        48                          48                   51

In addition to climate change policies targeting GHG emissions, due to their greater average fuel-burn, SCPSs
are also more vulnerable to non-GHG policies, such as policies regulating the emission of PM, NOx, SOx,
and mercury. SCPSs are also highly vulnerable to water policies. Given these three potential drivers of asset
stranding - carbon intensity, air pollution, and water stress - we have examined the exposure of SCPSs to these
risk factors. We have also examined which country and company SCPS portfolios are most exposed to these
risks. As part of this process we have ranked company exposure to SCPSs affected by these three different
environment-related risk factors. The full rankings of company exposure can be found in Section 5.

The objective of this research is to provide investors with the information required for screening, engagement,
or divestment actions on the basis of exposure to the SCPS assets at most risk. SCPS assets are not identical,
and investors (and companies) need the tools to identify which portfolios have assets with more (or less)
exposure to environment-related risks.

Stranded Assets and Subcritical Coal: The Risk to Companies and Investors                                               8
Determining carbon, air pollution, and water stress exposure
We use the IEA’s definition of SCPSs, which are power plants with carbon-intensity of ≥880kg CO2/MWh,
with cutoffs of 880-1,120kg CO2/MWh defined for ‘new subcritical’, 1,120-1,340kg CO2/MWh for ‘old efficient
subcritical’, and >1,340kg CO2/MWh for ‘old inefficient subcritical’. To complete our analysis we have effectively
defined the locations of all the world’s power plants, the ownership of these plants, the annual megawatt hours
of electricity produced at each plant, and the carbon intensity of each plant’s electricity production.

To determine the potential vulnerability of SCPSs to air quality-related regulations, we took the 100km radius
around each SCPS in the world and calculated the average satellite-based PM 2.5 observations within that
area. Although we cannot directly attribute PM 2.5 levels measured to the corresponding SCPS, there is almost
certainly a significant degree of causality, which may place plants in high PM 2.5 areas under greater risk from
regulatory responses to air quality concerns.

Similarly, to determine the potential vulnerability of SCPSs to water-related regulations, we looked at the
Baseline Water Stress (BWS) that SCPSs faced in their water catchment areas. SCPSs in extremely high water
stress catchments, defined as watersheds with >80% withdrawal to available flow ratios, may be at more risk
from water-related regulations or a shortage of water availability, than plants in areas with more water availability.

Company Portfolios
We analysed the world’s 100 largest SCPS portfolios by total generation capacity - together these account for
66.0% of global subcritical generation. Globally, Chinese and US companies dominate in terms of size, with
7 out of the 10 largest SCPS portfolios being Chinese, and 6 of the largest 20 American. Government-owned
companies1 account for 60 of the world’s 100 largest company SCPS portfolios, and over two-thirds of their
generation. Among the remaining 40 non-government owned company portfolios, the United States (25), EU
(5), and India (3) have the greatest number, whereas China2, Indonesia, and South Africa have none. Where
governments have a significant stake in SCPS portfolios, it is generally thought that they would be less likely
to introduce policies that would directly strand their own assets. However, this view is being contradicted by
recent policy tightening in both China and India.

We have identified the 20 most vulnerable large company portfolios according to carbon intensity, PM 2.5
pollution, and water stress. We find that Indian companies (5) dominate the tables for poor carbon efficiency,
with former Soviet (6) and Chinese portfolios (5) also notable for their poor carbon performance. Chinese and
Indian company portfolios monopolise the ranking for being located in areas with the worst PM 2.5 air pollution,
with respectively, 15 and 5 firms in this largest 20. And China (6) and India (5) also have the greatest number of
company portfolios that are under the most acute water stress.

Footnotes:
1
    Government-owned companies are defined as those for which a controlling interest in the company (>50%) is held by the state.
2
    With the exception of CLP from Hong Kong.

Stranded Assets and Subcritical Coal: The Risk to Companies and Investors                                                          9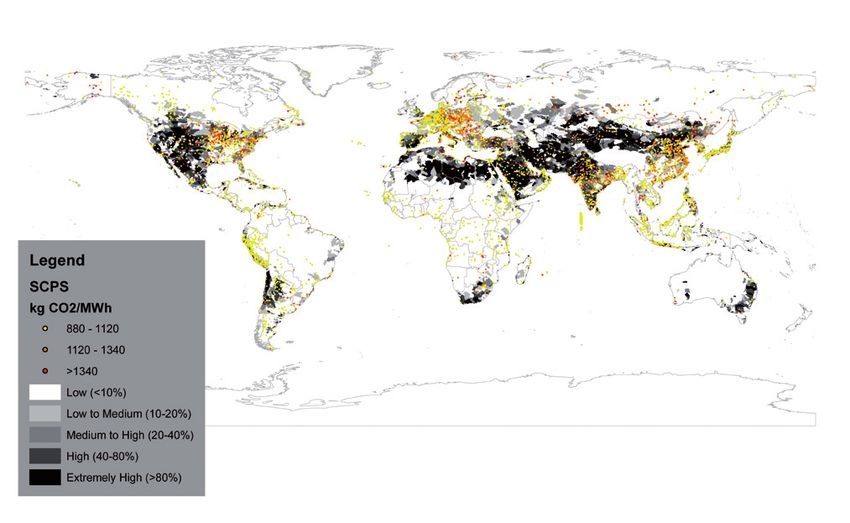
National Breakdown of the World’s Company SCPS Portfolios

                                                Total number of                   Number of companies in the   Percentage of companies
                                                companies with SCPS               largest 100 company SCPS     in the largest 100 company
                                                assets                            portfolios†                  SCPS portfolios that are
                                                                                                               government-owned

    World                                                    4,128                              100                       60%

    China                                                     368                                19                      95%‡

    United States                                             391                                28                       11%

    EU                                                        899                                12                       58%

    India                                                     391                                15                       87%

    Australia                                                 19                                 4                        50%

    South Africa                                               9                                 1                       100%

    Indonesia                                                 223                                2                       100%

†
    Largest 100 SCPS portfolios defined in terms of total MWh.
‡
    The non-government owned company is CLP based in Hong Kong.

China: SCPS Fleet on the Wrong Side of the Kuznets Curve
The outlook for the Chinese SCPS fleet is poor. The GHG, non-GHG, and water regulatory regimes around coal-
fired power generation in China are tightening. While it is likely that the impact on generation will be nationwide,
SCPSs in the heavily polluted and water-scarce northeastern region will be most heavily impacted. Given the
young age of Chinese SCPSs and enormous size of the SCPS stock in northeastern China, this may well create
a significant number of stranded SCPS assets through forced closure and impairment of profitability.

In addition to regulatory risk, physical water scarcity is a serious risk to a significant portion of the SCPS fleet,
with nearly 37% of the fleet located in watersheds with high water stress and 33% of the fleet in watersheds
with both high water stress and mean 100km Radius PM 2.5 pollution above WHO levels. Because of the
severity of this pollution, both water availability and air quality should be considered a significant direct risk to
the profitability of plants and indirectly via reputation. Potential reputational risks will increase over the short
term in northwestern provinces as a result of tightening regulatory regimes that will push coal-fired generation
westward, away from population centres and water resources. Previous analysis suggests that this shift will cause
severe supply capacity problems beginning in 2015.3

US and EU: Existing and Impending Regulations Close Ageing Generators
The US and EU SCPS fleets face similar and seemingly final challenges. Both fleets are ageing, significant
amounts of subcritical generation capacity have recently been closed by regulation, and future regulations
promise further closures.

Footnotes:
3
    Greenpeace (August 2012). Thirsty Coal: A Water Crisis Exacerbated by China’s New Mega Coal Power Bases.

Stranded Assets and Subcritical Coal: The Risk to Companies and Investors                                                                   10
In the US, non-GHG policies will force the closure of at least 16% of SCPS capacity in 2015. Proposed regulations on maximum allowable GHG emissions will essentially preclude the construction of coal-fired power plants without carbon capture and storage. Furthermore, proposed state-based GHG emission reductions promise to put further pressure on existing SCPSs. Early analysis of this proposed regulation suggests that $28 billion in industry value will eventually be stranded, though immediate plant closures are expected to be minimal. In the EU, little regulatory pressure is expected from the EU ETS. However, Europe’s non-GHG emission policies have and will continue to close significant amounts of coal-fired generation. 35GW of capacity have been closed by the Large Combustion Plant Directive, an amount that may still increase by the end of 2015. This scheme will transition to the Industrial Emissions Directive, which has the potential to close up to 40GW of Europe’s remaining 150GW of coal-fired capacity by 2023. India: Water Already a Serious Risk Factor The Indian SCPS fleet faces serious water-related risks that are threatened to worsen, with currently 33% of generators located in areas of extremely high water stress. Since 2010, water scarcity has forced significant plant suspensions, which greatly impact plant profitability and lead to rolling blackouts. While companies such as India’s NTPC, state that they secure water guarantees from state governments for the lifetime of plants before construction, this can create direct competition with irrigation for agriculture. This competition has already resulted in political tensions and social unrest, and should be considered a serious reputational risk. Nearly one in three Indian SCPSs are located in areas of water stress and also have mean 100km Radius PM 2.5 levels which exceed the WHO limit. Although no forthcoming direct regulatory policies that would require the installation of emission scrubbers, electrostatic precipitators, or FGD units were identified, the possibility of market-based mechanisms to control NOx and SO2 pollution should be considered a serious future risk to the Indian SCPS fleet. Beyond this risk, there are two additional regulatory risks to the Indian SCPS fleet. The first is the Perform, Achieve, Trade (PAT) mechanism, an energy efficiency trading scheme that is designed to financially disadvantage less efficient plants. Because this mechanism affects subcritical plants more severely than newer supercritical plants, this policy decreases the profitability of the least efficient and oldest portions of India’s SCPS fleet. The second regulatory risk is India’s 2012 National Water Policy; however, the Government of India has not specified mechanisms, tools, or charges related to this policy. Thus, there exists great uncertainty for SCPSs in water- stressed areas in terms of profitability and licenses to operate. Implications for Investors, Companies, and NGOs There is a strong case for financial institutions to utilise the information contained in this report to evaluate the risk of companies that hold subcritical assets and, where appropriate to then screen, engage, or divest. As part of further analysis and engagement with companies exposed to at risk subcritical assets, investors and civil society could encourage companies to: i) publicly confirm their exposure and the proportion of their total generation portfolio that is subcritical, ii) disclose what proportion of this is most at risk, for example, the bottom quartile in terms of carbon intensity, air pollution, and water stress, iii) disclose how much of their capex pipeline is subcritical and how this might change portfolio risk exposure, and iv) describe the strategies employed at an asset-level and across a portfolio to minimise carbon intensity and manage deleterious contributions to local air pollution and water stress. Stranded Assets and Subcritical Coal: The Risk to Companies and Investors 11
Summary of Possible Responses

 Relevant SCPS Stakeholders             Possible Responses

 Fixed-Income Investors                 Reassess required yields
                                        Divest if necessary

 Ratings Agencies                       Reassess company ratings

 Equity Investors                       Reassess required returns
                                        Demand that management reduce environmental and regulatory risks
                                        Divest if necessary

 Bank Loan Assessment                   Reassess lending rates
                                        Resell risky loans

 Environmental Groups                   Target environmentally irresponsible nations and companies for improvement

Research Extensions
This report has analysed the global stock of the world’s most carbon inefficient and heavily polluting power
stations. Refinement of this data, such as by developing a timeline for projected global SCPS capacity, or
incorporating additional individual plant-level information on plant age, boiler type, installed pollution abatement
technologies, coal-fuel specifications, cooling methods, and the percentages of total generation which consists
of SCPS would allow for more fine-grained analyses of national fleets and company portfolios. Future research
might also cast a critical eye on the relationship between SCPS and other coal pollutants, such as NOx, SOx
and mercury. Another possible extension would be to assess the upstream constraints of further coal generation
expansion by overlaying SCPSs against proximate coal mines and coal delivery infrastructure capacity.

Stranded Assets and Subcritical Coal: The Risk to Companies and Investors                                              12
1. Introduction
The international community needs options for addressing the most significant contributors to anthropogenic
climate change. One option, presented publicly by Christiana Figueres, executive secretary of the United
Nations Framework Convention on Climate Change (UNFCCC), is the closure of subcritical coal-fired power
stations (SCPSs).4 To limit global emissions to a level consistent with a 2°C future, it is necessary to close a
quarter or 290 gigawatts (GW) of subcritical generation worldwide by 2020.5
Since SCPSs are the least efficient and most greenhouse gas (GHG) intensive centralised generation technology,
they are both vulnerable to regulation and a logical first step in any climate mitigation strategy. Furthermore,
because subcritical plants typically represent the oldest part of nations’ power generation portfolios, they
may also represent a practical policy choice for closure by budget-constrained policymakers looking for cost-
effective emissions reductions.
This paper was written to provide analysis to support financial and company decision-making in relation
to SCPSs. It will help investors to identify and screen specific companies with exposure to SCPS assets at
particular risk from climate policy, air pollution, and water stress – which are the three environment-related
risks that we concentrate on here. The paper is structured in the following way: in the next section we present
an overview of SCPS technology and compare it with other forms of coal-fired generation technology. Section
3 outlines the most pressing environment-related risks to SCPSs, particularly CO2 intensity, Particulate Matter
(PM) 2.5 pollution, and physical water scarcity. After assessing these issues at a global scale and seeing how
they could affect SCPSs, Section 4 drills down to see how SCPSs could be affected in its largest markets,
namely China, US, EU, India, Australia, South Africa, and Indonesia, which together account for 93% of global
SCPS generation. Section 5 extends the analysis of SCPS to the world’s 100 largest SCPS portfolios. Section 6
concludes.
Footnotes:
4
HSBC (17 January 2014). “Coal and carbon revisited.”
5
IEA (2013). Redrawing the Energy Climate Map. Paris, France.
Stranded Assets and Subcritical Coal: The Risk to Companies and Investors 132. Subcritical Coal-Fired Technology
Technologically Vulnerable
Subcritical Coal-fired Power Stations (SCPSs) are generators that use subcritical boilers. These boilers operate
at relatively lower pressures and temperatures, which leads to an inefficient steam cycle in generation because
water is present both as liquid and gas.6
Figure 1: Average CO2 Intensity and Efficiency by Coal-fired Generation Boiler Type
Source: IEA (2013)
Table 1: Coal-fired Environmental Effects by Generation Efficiency, Base-level = 100
Generation Efficiency Carbon Emissions Air Pollution Water Use
Old Inefficient Subcritical 100 100 100
Old Efficient Subcritical 84 84 85
New Subcritical 68 68 70
Supercritical 57 57 60
Ultra-Supercritical 52 52 55
Advanced Ultra-Supercritical 48 48 51
Note: Indicated levels of environmental effects based off of ceteris paribus generating conditions for a closed-cycle wet-cooled plant.
Water stress levels based off of EPRI (2008).
Footnotes:
6
Susta, M. and K. B. Seong (2004). Supercritical and Ultra-Supercritical Power Plants - SEA’s Vision or Reality?, PowerGen Asia.
Stranded Assets and Subcritical Coal: The Risk to Companies and Investors 14Figure 2: Age of Coal-Fired Generation Stock
Source: Caldecott and Mitchell (Forthcoming 2015)
In addition to efficiency, the age of generators also plays a role in their regulatory vulnerability. Because of
the age of subcritical boiler technology, SCPSs represent the oldest part of national generation stocks. This is
significant for two reasons.
• First, ageing stations are significantly less likely to have non-GHG emission abatement technologies installed
or to use the most water-efficient or dry cooling systems, when compared with newer generation capacity.
This increases their vulnerability to non-GHG and water-related regulations.7
• Second, it is financially (and potentially politically) simpler to regulate the closure of older power stations
This is because capital costs have typically been recovered after 35 years8 and when generators are near or
past their technical lives, the financial need to compensate is greatly reduced or eliminated.9
Vulnerability: GHG Policies
Because coal is the most emissions-intensive form of generation,10 subcritical coal-fired power stations are
the most carbon-intensive form of centralised electricity generation. Consequently, carbon regulations more
heavily impact SCPSs than any other form of generation.11 Although the efficiency of these power stations has
improved over time, even the newest and most efficient subcritical generators are significantly more carbon-
intensive than existing supercritical, ultra-supercritical, and forthcoming advanced ultra-supercritical technology.
Footnotes:
7
These assertions are based on analysis of recent station closures in the US and EU using non-GHG direct regulation.
8
IEA (2014). Energy, Climate Change and Environment.
9
aldecott, B. and J. Mitchell (Forthcoming 2015). “Generating Implications for Climate Policy: The Premature Retirement of Subcritical Coal-Fired
C
Generation and the Potential Role of Compensation.” Stranded Assets Programme, Smith School for Enterprise and Environment, University of Oxford.
10
oomaw, W., G. Burgherr, M. Heath, M. Lenzen, J. Nyboer and A. Verbruggen (2011). 2011: Annex II: Methodology. In IPCC Special Report on Renewable
M
Energy Sources and Climate Change Mitigation. O. Edenhofer, R. Pichs-Madruga, Y. Sokona et al. Cambridge, United Kingdom and New York USA,
Cambridge University Press.
11
Susta, M. and K. B. Seong (2004). Supercritical and Ultra-Supercritical Power Plants - SEA’s Vision or Reality?, PowerGen Asia.
Stranded Assets and Subcritical Coal: The Risk to Companies and Investors 15The limited work on subcritical coal-fired power generation thus far focuses on the role of SCPS closures in
climate change mitigation scenarios.12 Because they are the least efficient, in these scenarios SCPS are closed
quickly and at large scales. For instance, IEA modelling of a power sector transition compatible with 2°C global
warming suggests that it would rely on the closure of 25% of SCPS capacity (290GW) by 2020.13
Vulnerability: Non-GHG Policies
Because of their greater average age and fuel-burn requirements, SCPSs are typically also more vulnerable to
non-GHG policies, such as policies regulating the emission of PM, NOx, SOx, and mercury. But the relationship
between boiler efficiency and non-GHG emissions is not as straightforward as the relationship with CO2
emissions. The largest factor in determining station PM, NOx, and SOx emissions is whether emission abatement
technologies have been installed.14
Figure 3: Effectiveness of Non-GHG Emission Abatement Technologies
Source: IEA (2012)
Technically the impact of station efficiency on pollutant emissions is small when compared with the installation
of abatement technologies. However, experience provides strong evidence that because subcritical stations
are older, they are less likely to have emission abatement technologies installed, and are therefore most likely
to be closed by non-GHG emission policies.15
Two highly relevant examples of this are the planned closure of 16% of US subcritical capacity by the Mercury
and Air Toxics Standard (MATS)16 and the closure or planned closure of 8% of European coal-fired capacity (all
of which is subcritical capacity) by the Large Combustion Plant Directive.17
Footnotes:
12
IEA (2014). Energy, Climate Change and Environment.
13
IEA (2013). Redrawing the Energy Climate Map. Paris, France.
14
IEA (2012). Technology Roadmap: High Efficiency, Low-Emissions Coal-Fired Power Generation. Paris, France, OECD/IEA.
15
MIT (2009). Retrofitting of Coal-Fired Power Plants for CO2 Emissions Reductions, MIT Energy Initiative Symposium.
16
ATS was the main factor in station closures, however competition from gas was also a factor Johnson, E. (2014). Planned coal-fired power plant
M
retirements continue to increase, U.S. Energy Information Administration.
17
Sandbag (July 2014). “Europe’s failure to tackle coal: Risks for the EU low-carbon transition.”
Stranded Assets and Subcritical Coal: The Risk to Companies and Investors 16Vulnerability: Water Policies
Coal-fired Rankine-cycle (steam) power stations are second only to nuclear power stations in water use. Cooling
is by far the largest use of water in these power stations. The largest factor in determining the water-efficiency
of stations is the type of cooling system installed. Secondary factors are the ambient temperature and station
efficiency.
Table 2: Water Withdrawals (Litres/MWh)
Cooling Technology
Fuel-Type Once-Through Closed-Cycle (Wet) Hybrid (Wet/Dry) Dry Cooling
Coal 95,000-171,000 2,090-3,040 1,045-2,755 ~0
Gas 76,000-133,000 1,900-2,660 950-2,470 ~0
Oil 76,000-133,000 1,900-2,660 950-2,470 ~0
Nuclear 133,000-190,000 2,850-3,420 Applicability1 Applicability1
Use of hybrid and dry cooling only recently considered for nuclear plants.
1
Source: EPRI (2008)
Within fossil-based power generation, SCPSs are highly vulnerable to water policies because of two factors.
First, because subcritical stocks are older, they are less likely to have water-efficient or dry cooling technologies
installed. Second, regardless of installation of water-efficient technologies, such as closed cycle or hybrid
cooling systems, the higher heat rate (low-efficiency) of the boilers requires significantly more cooling water
for a given unit of output.
Stranded Assets and Subcritical Coal: The Risk to Companies and Investors 173. Analysis of Global SCPS Capacity
Global SCPS Overview
Coal currently provides 40% of the world’s electricity with 1,617GW of global capacity. It is also the world’s
fastest growing source of power, with an additional 1,112GW expected by 2035.18,19 Coal-fired power plants
that are both carbon-intensive and old are at the highest risk of compulsory closure because of their greater
environmental impact and because less financial compensation would be required to induce closure.
Figure 4: Global Coal-fired Power Station Fleet Performance and Age
Source: IEA (2012)
Of total global coal-fired capacity, currently 75% is subcritical, 22% supercritical, and 3% ultra-supercritical.
While the average age of the global coal-fired power plant fleet is 21 years, supercritical and ultra-supercritical
power plants are considerably younger. While the average age of the global coal-fired power plant fleet is 21
years, supercritical and ultra-supercritical power plants are considerably younger.
Footnotes:
18
IEA (2012). CCS Retrofit: Analysis of the Globally Installed Coal-Fired Power Station Fleet. Paris, France, OECD/IEA.
19
World Coal Association (2014). Coal Facts 2014.
Stranded Assets and Subcritical Coal: The Risk to Companies and Investors 18Table 3: World Coal-fired Power Station Fleet Age
Total capacity Average age Subcritical average age Supercritical average age Ultra-supercritical
(GW) (years) (years) (years) average age (years)
World 1,617 21 23 18 5
Source: IEA (2012)
Table 4: World Coal-fired Power Station Fleet Performance
Share of Total Coal Power Stations that are...
Subcritical Supercritical Ultra-supercritical Older than 35 years Older than 35 years AND
Subcritical
World 75% 22% 3% 23% 18%
Source: IEA (2012)
SCPS Carbon Intensity
Following the IEA, this report defines SCPS as power plants with carbon-intensity of ≥880kg CO2/MWh, with
cutoffs of 880-1,120kg CO2/MWh defined for ‘new subcritical’ (coloured in yellow), 1,120-1,340kg CO2/MWh
for ‘old efficient subcritical’(orange), and >1,340kg CO2/MWh (red) for ‘old inefficient subcritical’.20
Nationally, China and the United States have the largest SCPS fleets by total generation, but due to rapid growth
India’s fleet is scheduled to become a close second to China. Australia has by far the most carbon-intensive
SCPS fleet, followed by India and Indonesia.
Table 5: National SCPS Fleet Generation and Carbon Intensity
Number of Total SCPS TWh Percentage of world Mean SCPS carbon intensity (kg CO2/
SCPS SCPS TWh MWh)†
World 7,446 7,349 100.00% 1,042
China 930 2,718 36.98% 1,048
United States 665 1,539 20.94% 1,040
EU 1,280 ‡
729 9.92% 1,051
India 608 783 10.65% 1,058
Australia 22 162 2.20% 1,132
South Africa 25 194 2.64% 1,034
Indonesia 337 87 1.18% 1,058
†
SCPS mean carbon intensity is weighted by MWh of generation. The unweighted global SCPS mean carbon intensity is not materially
different at 1,047 kg CO2/MWh.
‡
The EU has a particularly large number of micro power plants with poor carbon efficiency.
Footnotes:
20
IEA (2012). Technology Roadmap: High Efficiency, Low-Emissions Coal-Fired Power Generation. Paris, France, OECD/IEA.
Stranded Assets and Subcritical Coal: The Risk to Companies and Investors 19Figure 5: Existing SCPS by Carbon Intensity
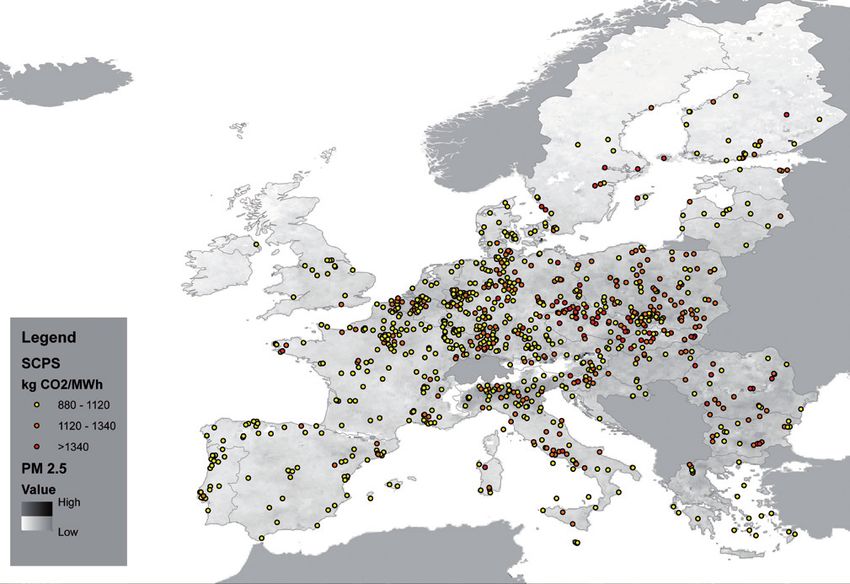
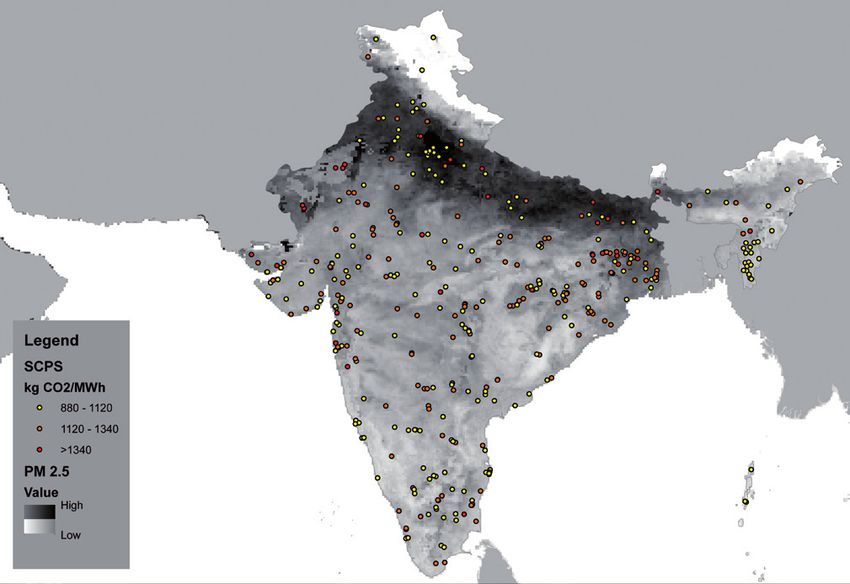
SCPSs and PM 2.5 Air Pollution
As is discussed in Section 2, SCPSs are highly vulnerable to policies that mandate; (i) efficiency improvements,
(ii) the installation of emission abatement technologies, or (iii) plant closure. In addition, SCPSs in locations with
poor air quality are even more likely to come under regulatory pressure because, ceteris paribus, they must burn
more coal for a given unit of output, and therefore contribute disproportionately to reducing local air quality.
Of the pollutants associated with coal combustion, particulate matter (PM) is considered to be the most hazardous
to human health. PM consists of the fly ash and dust particles generated during coal combustion,21 and is
commonly classified into groups of either below 10 (PM 10) or below 2.5 (PM 2.5) microns in diameter,22 with
PM 2.5 considered to be the more dangerous of the two. These fine particles consist of a mixture of all the air
pollutants associated with coal combustion,23 and due to their small size can penetrate deep into the lungs
and enter the bloodstream directly.
To determine the potential vulnerability of SCPSs to air quality-related regulations, we took the 100km radius
around each SCPS in the world and calculated the average of the PM 2.5 observations from Boys, Martin et
al. (2014) measured within that radius24. Although we cannot directly attribute PM 2.5 levels measured within
each 100km radius to emissions from the corresponding SCPS, there is almost certainly a significant degree of
causality relevant for policy makers.
Footnotes:
21
hese particles can contain noxious compounds such as: acid droplets, arsenic, beryllium, cadmium, chromium, lead, manganese, nickel, radium,
T
selenium, and other metals.
22
Micron = One millionth of a meter: about 1/20th the width of a human hair.
23
M particles can consist of noxious compounds such as: acid droplets, arsenic, beryllium, cadmium, chromium, lead, manganese, nickel, radium,
P
selenium, and other metals.
24
On average there were 270 PM 2.5 observations within each 100km radius. See appendix for PM 2.5 air pollution data sources and methods.
Stranded Assets and Subcritical Coal: The Risk to Companies and Investors 20National analyses showed that almost 90% of SCPSs in India and China have average PM 2.5 pollution levels
within a 100km radius of their plants which exceed the WHO sanctioned annual average limit (20 µg/m3). In
the case of China, nearly two-thirds of all SCPSs are in locations which also exceed their own national PM 2.5
limit (35 µg/m3), while in India only about one-fifth of SCPSs violate the Indian national standard (40 µg/m3).
Table 6: National SCPS Fleet Ambient Air Pollution
SCPS mean Number of Percentage of National PM Number of SCPSs Percentage of
100km SCPSs located SCPSs located 2.5 Limit (µg/ located in areas SCPSs located
Radius PM in areas with in areas with m3) with air pollution in areas with
2.5 Levels air pollution air pollution exceeding their air pollution
(µg/m3) exceeding the exceeding the national PM 2.5 exceeding their
WHO PM 2.5 WHO PM 2.5 limits national PM 2.5
limit limit limits
World 15 2,092 28.10% 20 n/a n/a
China 50 825 88.71% 35 618 66.45%
United States 7 0 0.00% 12 0 0.00%
EU 12 38 2.97% 25 0 0.00%
India 32 539 88.65 40 115 18.91%
Australia 2 0 0.00% 8 0 0.00%
South Africa 8 0 0.00% 25 0 0.00%
Indonesia 8 0 0.00% none n/a n/a
Note: The WHO Annual Average PM 2.5 limit is 20 µg/m3. Indonesia lacks a PM 2.5 limit. The South African PM 2.5 limit is scheduled to
be tightened from 25 to 20 µg/m3 beginning January 2016. ‘SCPSs located in areas with air pollution exceeding [specified] PM 2.5 limits’
consist of SCPSs which have average observed PM 2.5 levels within 100km which exceed the specified limits.
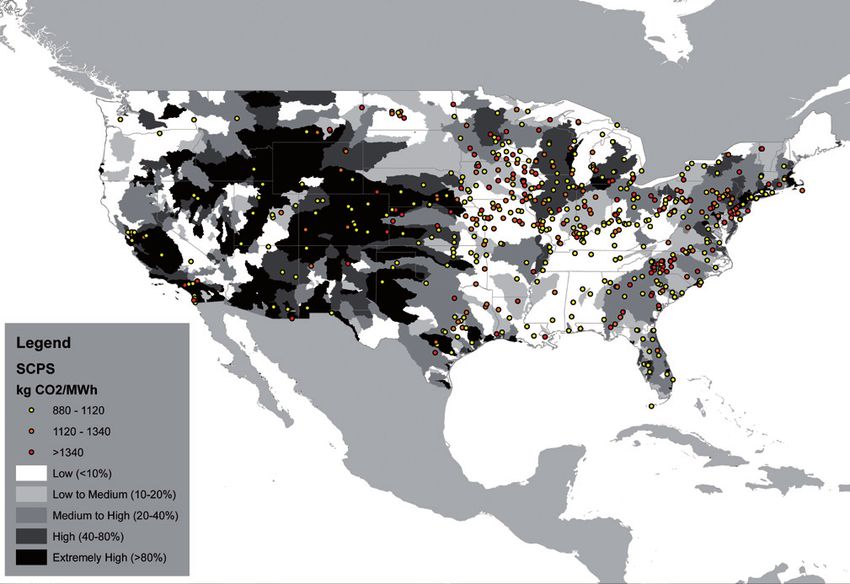
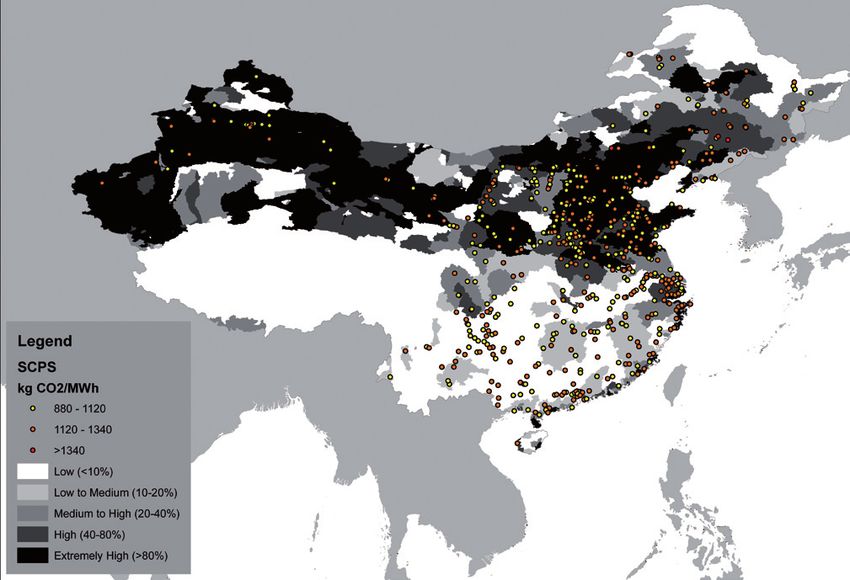
Stranded Assets and Subcritical Coal: The Risk to Companies and Investors 21Figure 6: Existing SCPS by Carbon Intensity and PM 2.5 Air Pollution Desert conditions produce natural PM 2.5 that is also recorded by satellites as pollution. This effect is responsible for the high levels of PM 2.5 measured across the Sahara, Arabian, and Taklamakan deserts. Natural PM 2.5 is not as deleterious to human health as by- products of coal combustion. SCPSs and Water Stress Because SCPSs require greater water inputs for a given amount of generation, local water stress is also a factor that may affect the vulnerability of SCPSs to regulation. The measure for water stress used in this report is Baseline Water Stress (BWS) from Aqueduct created by the World Resources Institute (WRI). BWS is defined as total annual water withdrawals (municipal, industrial, and agricultural) expressed as a percent of the total annual available flow within the given catchment area. Higher values indicate greater competition for water among users. Extremely high water stress areas are defined by WRI as watersheds with >80% withdrawal to available flow ratios, 80-40% as high water stress, 40-20% as high to medium, 20-10% as medium to low, and
Table 7: National SCPS Portfolios Water Stress and Combined Air Pollution

                Mean            Percentage     Number of SCPSs        Percentage            Number of SCPSs        Percentage
                SCPSs           of SCPSs in    in extremely           of SCPSs in           in extremely           of SCPSs in
                catchment       extremely      high water stress      extremely high        high water stress      extremely high
                area water      high water     catchments AND         water stress          catchments AND         water stress
                stress          stress         located in areas       catchments AND        located in areas       catchments
                                catchments     with air pollution     located in areas      with air pollution     AND located
                                               exceeding WHO          with air pollution    exceeding their        in areas with
                                               PM 2.5 limits          exceeding the         national PM 2.5        air pollution
                                                                      WHO PM 2.5 limit      limits                 exceeding their
                                                                                                                   national PM 2.5
                                                                                                                   limits

 World           28.59%         20.64%          837                    11.24%                n/a                   n/a

 China           54.44%         37.10%          311                    33.44%                259                   27.85%

 US              32.33%         14.74%          0                      0.00%                 0                     0.00%

 EU              31.64%         7.58%           0                      0.00%                 0                     0.00%

 India           51.31%         33.06%          195                    32.07%                65                    10.69%

 Australia       40.69%         13.64%          0                      0.00%                 0                     0.00%

 South Africa    36.43%         24.00%          0                      0.00%                 0                     0.00%

 Indonesia       36.54%         31.16%          0                      0.00%                 n/a                   n/a

Note: Extremely High Water Stress is defined as BWS>80%. ‘SCPSs located in areas with air pollution exceeding [specified] PM 2.5
limits’ consist of SCPSs which have average observed PM 2.5 levels within 100km which exceed the specified limits.

Figure 7: Existing SCPSs by Carbon Intensity and Baseline Water Stress

Stranded Assets and Subcritical Coal: The Risk to Companies and Investors                                                            23
4. Analysis of National SCPS Fleets Here we analyse some of the largest national SCPS portfolios in countries that together account for 83% of global SCPS capacity. These are: China (34% of global capacity), United States (26%), EU (9%), India (7%), Australia (3%), South Africa (3%), and Indonesia (1%). For each country we; (i) provide an overview of the makeup of national coal-fired power generation, (ii) examine the efficiency of SCPSs and identify and discuss the implications of forthcoming GHG policies, (iii) overlay PM 2.5 pollution and discuss forthcoming non-GHG emission regulations, and (iv) gauge water stress and forthcoming water policies that might impact SCPSs. China Overview of Subcritical Stock and Trends Figure 8: Chinese Coal-Fired Generation by Age and Boiler Technology Source: IEA (2012) China’s operational coal-fired capacity is 669 GW, with around 25% of that capacity utilising supercritical and ultra-supercritical boilers. Its coal fleet is also very young compared with other large nations. Stranded Assets and Subcritical Coal: The Risk to Companies and Investors 24
Coal-fired power companies in China have suffered significant financial losses in recent years – a reality that
receives little attention outside of China. According to a State Electricity Regulatory Commission report,
the largest five Chinese power companies lost a total of RMB 15 billion (USD2.4 billion) in their coal-power
generation businesses in 2011. This was due to two factors. Coal prices were relatively high due to domestic
production and transport constraints and electricity prices were capped in 2007 by the Chinese government
to ease the effects of 6.5% inflation. Though coal prices have since dropped, the economic slowdown, a suite
of new regulations to control air pollution, and a large increase in clean energy sources now puts pressure on
the Chinese coal-fired power generation sector.25

Station Efficiency and Forthcoming GHG Policies
Figure 9: SCPS in China by Carbon Intensity

While SCPSs are concentrated in the more heavily industrialised east, carbon intensity is generally uniform
across the country and China has notably few plants with emissions greater than 1,340kg CO2/MWh. This is
likely due to the success of the Large Substitutes Small program, which required generating companies to
close smaller, inefficient generators in order to build new generators.

Footnotes:
25
      ornot-Gandolphe, S. (2014). Generating Implications for Cimate Policy: China’s Coal Market: Can Beijing Tame King Coal? University of Oxford, The
     C
     Oxford Institute for Energy Studies.

Stranded Assets and Subcritical Coal: The Risk to Companies and Investors                                                                                  25
China is trialling policies to reduce the carbon-intensity of its economy and control GHG emissions. Existing
and forthcoming policies suggest that China has both the will and capacity to regulate carbon. These policies
will impact the Chinese SCPS fleet heavily.
• First, in 2013, China began piloting an Emissions Trading Scheme (ETS) in seven provinces. This is a core
strategy for achieving the stated goal of a 40-45% reduction of 2005 carbon intensity of GDP by 2020.26
• Second, these pilot ETSs are intended to provide experience for the implementation of a national ETS in
201626 and potentially a nationwide carbon taxation scheme in 2018.28 Although it remains unclear how a
carbon taxation scheme might interact with the ETS, it will provide much broader coverage than the local
ETSs, which currently cover 7% of Chinese GHG emissions.29
• Third, China has pledged to cap total emissions by 2030 in an agreement with the US. Although certain media
outlets have stated that the implementation of this emission cap could occur as early as the 13th FYP (2016-
2020), these reports could not be verified.30
• Fourth, China has capped domestic coal production at 3.9 Mt as well as established an import levy on coal.
The short-term purpose of these policies is to stabilise falling coal prices, which will in turn affect the profits
of generators.
Footnotes:
26
Carbon Tracker (2014). The Great Coal Gap: China’s energy policies and the financial implications for thermal coal, ibid.
27
ornot-Gandolphe, S. (2014). Generating Implications for Cimate Policy: China’s Coal Market: Can Beijing Tame King Coal? University of Oxford, The
C
Oxford Institute for Energy Studies.
28
ICAP (January 2014). Emissions Trading Worldwide: International Carbon Action Partnership (ICAP) Status Report 2014.
29
Carbon Tracker (2014). The Great Coal Gap: China’s energy policies and the financial implications for thermal coal, ibid.
30
aylor, L. and T. Branigan (12 Nov, 2014). US and China strike deal on carbon cuts in push for global climate change pact. The Guardian. London. http://
T
www.theguardian.com/environment/2014/nov/12/china-and-us-make-carbon-pledge.
Stranded Assets and Subcritical Coal: The Risk to Companies and Investors 26Figure 10: SCPS by Carbon Intensity with PM 2.5 Pollution in China
PM 2.5 Pollution and Forthcoming Non-GHG Emission Policies
In an effort to reduce air pollution, China has introduced air quality targets for PM 2.5 and PM 10 for all provinces
through the 2013 Action Plan for Air Pollution Prevention and Control. The targets, which are meant to be met
by 2017, are generally most stringent in areas with large amounts of coal-fired generation. For example, in
the heavily industrialised northeast, Beijing, Tianjin, Hebei are expected to improve PM 10 levels by 10% and
PM 2.5 by 25%; whereas Sichuan, Guizhou, and Yunnan are expected to improve PM 10 levels by only 0-5%.
In reaction to air pollution measures, 12 provinces, which account for 44% of Chinese coal consumption, have
pledged to measure and reduce coal consumption.
• Provinces with absolute coal consumption reduction targets include Beijing, Tianjin, Hebei, Shandong,
Shanxi, and Chongqing. These targets range from 5-50%.
• Other areas that have pledged ‘negative growth’ are the Yangtze River Delta and the Pearl River Delta.
• Jilin and Liaoning have pledged no more than 2% growth in coal consumption per year.31
Footnotes:
31
TShuo, L. and L. Myllyvirta (April 2014). The End of China’s Coal Boom - 6 Facts You Should Know, Greenpeace.
Stranded Assets and Subcritical Coal: The Risk to Companies and Investors 27These measures are expected to decrease coal consumption by an average of around 10% in these provinces,32 likely negatively impacting SCPSs. China’s Ministry of Finance and Environmental Protection has also submitted draft regulations to operate NOx and SO2 trading schemes, though it is not known when these would come into effect.33 Water Stress and Forthcoming Water Policies Figure 11: SCPS by Carbon Intensity with Water Stress in China Due to the geographical mismatch between water resources and industrialised centres, much of China’s existing and planned future coal-fired capacity is in areas experiencing water stress (1,000-1,700 m3 per capita p.a.), scarcity (500-1,000 m3 per capita p.a.), or extreme scarcity (
Further water risks include the joint release of the Water Resources Fee by the Ministry of Finance and the
Ministry of Water Resources. This scheme aims to balance local economic development with available water
resources through a pricing scheme, strict controls on groundwater exploitation, and punitive measures for
excess consumption.36

United States
Overview of Subcritical Stock and Trends
Figure 12: United States Coal-Fired Generation by Age and Boiler Technology

Source: IEA (2012).
Note: US coal-fired stations older than 55 years are not shown.

The US coal-fired capacity is 336GW, the second largest national fleet. Of this coal-fired capacity, 73% is
subcritical. The US also has the oldest stock of SCPSs with an average age of 40 years, and the largest share
of plants older than 35 years of the countries/regions studied. The advanced age of US plants increases the
regulatory vulnerability of its existing SCPS stock. There is currently only one coal-fired plant without CCS
either planned for or currently under construction.

Footnotes:
36
     Ibid.

Stranded Assets and Subcritical Coal: The Risk to Companies and Investors                                       29
Station Efficiency and Forthcoming GHG Policies
Figure 13: SCPS in the United States by Carbon Intensity
The US does not have a legislated nationwide climate policy or a legislative branch at the federal level that
might approve one in the foreseeable future. Yet, two proposed regulations are likely to ban the construction
of new coal-fired generation and strand some subcritical assets.
Using the Clean Air Act, the Environmental Protection Agency has proposed the following regulations:
• Standards of Performance for Greenhouse Gas Emissions From New Stationary Sources: Electric Utility
Generating Units
• Carbon Pollution Emission Guidelines for Existing Stationary Sources: Electric Utility Generating Units
Currently in draft form, a final version of the Standards of Performance for Greenhouse Gas Emissions from
New Stationary Sources: Electric Utility Generating Units is expected in June 2015. It currently requires that all
new coal-fired power stations emit no more than an average of 1,100 lbs CO2/MWh (500kg/MWh) per calendar
year. This effectively bars the construction of new coal-fired stations without carbon capture and storage.37
Footnotes:
37
C2ES (November 2013). EPA Regulation of Greenhouse Gas Emissions from New Power Plants. U.S. Policy. Arlington, VA.
Stranded Assets and Subcritical Coal: The Risk to Companies and Investors 30The proposed Carbon Pollution Emission Guidelines for Existing Stationary Sources: Electric Utility Generating
Unit seeks to reduce U.S. power sector emissions by setting state-specific emission reduction goals based
on current generation mixes and renewable energy resources. CPI (2014) reported that if implemented this
regulation would lead to USD28bn in lost value within the coal sector.38
PM 2.5 Pollution and Forthcoming Non-GHG Emission Policies
Figure 14: SCPS by Carbon Intensity with PM 2.5 Pollution in the United States
The Mercury Air Toxics Standard (MATS) limit emissions of mercury, toxic metals, and acidic gases from power
stations. US power stations must meet these standards by 2016 if they wish to continue operation.
As of 2014, 70% of coal-fired generators have installed necessary abatement technologies and another 6% have
plans to install abatement technologies necessary to operate past 2015. 16% of U.S. CSCPSs have announced
plans for retirement by 2015. A further 16% of all coal-fired generators have yet to announce whether they plan
to install abatement technologies or close prior to 2016.39 The EIA attributes these closures to competition
from gas-fired production as well as the MATS.40
Footnotes:
38
Climate Policy Initiative (2014) “Moving to a Low-Carbon Economy: The Financial Impact of the Low-Carbon Transition.”.
39
itchell, J. (2014). Premature retirement of sub-critical coal assets: the potential role of compensation and the implications for climate policy, University of
M
Oxford.
40
IEA (2010). World Energy Outlook 2010. R. Priddle. Paris, France, OECD/IEA.
Stranded Assets and Subcritical Coal: The Risk to Companies and Investors 31You can also read