Grand River Watershed Water - Environmental Flow Requirements in the Grand River Watershed
←
→
Page content transcription
If your browser does not render page correctly, please read the page content below
[E-Flows]                                                          September 2014

            Grand River Watershed Water
                 Management Plan
 Environmental Flow Requirements in the Grand
               River Watershed
                           Report from the E-flows Working Group
                                      September 2014

Grand River Watershed Water Management Plan 2014 Update
E-Flows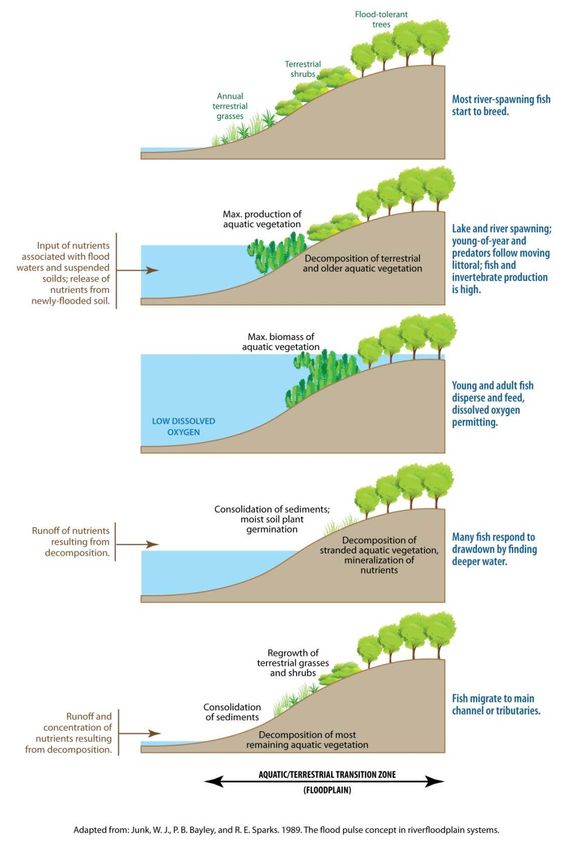
[E-Flows]                                                                            September 2014

Suggested Citation
Environmental Flow Requirements in the Grand River Watershed. Grand River Water Management Plan.
Prepared by Amanda W. Wong and Dwight Boyd. Grand River Conservation Authority. Cambridge, ON.
2014.

Members of the Environmental Flows Working Group
Amanda Wong           Chair, Grand River Conservation Authority
Dwight Boyd           Grand River Conservation Authority
Andrea Bradford       School of Engineering, University of Guelph
Jack Imhof            Trout Unlimited Canada
John Parish           Parish Geomorphic, Ltd.
Crystal Allan         Grand River Conservation Authority

Acknowledgements
A. Wong would like to thank the members of the E-flows Working Group for the expertise, guidance and
input to this report and the development of e-flows for the Grand River watershed in general. Their
collective knowledge and dedication to understanding e-flows was pivotal in accomplishing this report.

Acronyms and Abbreviations
7Q20           Seven day flow with a 20 year return period
AMP            Adaptive Management Plan
CO             Conservation Ontario
D50            Median grain size
D90            Grain size of 90th percentile, (90% of grain sizes are smaller)
e-flows        Environmental flow (needs)
EFR            Environmental flow requirements
GRCA           Grand River Conservation Authority
HEC-RAS        Hydrologic Engineering Centers River Analysis System (hydraulic modeling software)
LPRCA          Long Point Region Conservation Authority
m3/s           Cubic metres per second (a flow rate)
MOECC          Ministry of the Environment and Climate Change
OLWRP          Ontario Low Water Response Program
OWDC           Ontario Water Director’s Committee
PTTW           Permit to Take Water
QMA            Mean Annual Flow
QMM            Mean monthly flow
SPP            Source Protection Planning
WMP            Water Management Plan
WQSA           Water Quantity Stress Assessment
WSC            Water Survey of Canada

E-Flows                                                                                              i
[E-Flows]                                                                                 September 2014

Executive Summary
Environmental flows, or e-flows, describe the quantity, quality and timing of flows required to sustain
healthy river ecosystems, as well as the human livelihoods that rely on these ecosystems (Brisbane
Declaration, 2007). The Grand River Water Management Plan Update strives to maintain healthy
aquatic ecosystems as one of its objectives and the establishment of e-flows thresholds for an
environmental flow regime to support this objective was the goal of this report.
The river we have today reflects past choices. More water for environmental conditions means there
may be less water for people and this can create conflict. The intent over time is to find an acceptable
balance. This is one of the challenges with establishing e-flows. It will always be a negotiation, which
requires a cooperative effort to address these conflicts so that water management decisions can
connect people to the actual decisions.
The GRCA owns and operates 29 dams in the watershed, including seven that manage river flows and 22
smaller run-of-the-river dams which together, help incorporate flood reduction and low flow
augmentation into regular GRCA operations. Knowledge of e-flow needs helps inform operational
decisions and where possible operational decisions are refined to compliment e-flow needs or
preferences.

This report summarizes the findings of previous work to identify e-flow requirements in the Grand River
watershed and the lessons learned from these studies. An Environmental Flows Working Group
combined their efforts to establish a variety of high and low flow thresholds for a suite or flow regimes
for maintaining healthy aquatic ecosystems in the Grand and Speed Rivers. The e-flows regime includes
eight e-flows thresholds in three categories: channel maintenance and formation; nutrient management
or biological functions; and low flow considerations. Once the criteria for these flow thresholds were
established, flow values were established for each of them in four reaches in the Grand and Speed
Rivers. This report details these flow thresholds, their historic occurrences and whether these
occurrences have been sufficient to perform their e-flow functions. The tools and techniques highlighted
can be applied in water management decisions by agencies and larger water users.

In addition, low flow thresholds on two important tributaries of the Grand – Whitemans Creek and the
Eramosa River – were determined for the protection of longitudinal connectivity flows for coldwater
fisheries. These case studies highlight areas where dam control is unavailable to help augment e-flows
and water managers rely on the landscape and people to manage land use and water takings to meet e-
flow thresholds. In general, the environmental low flow needs are less than the reservoir operational
flow targets. There is challenge only during dry periods.
The higher environmental maintenance flow needs (e.g., flushing flows) are poorly to moderately met.
Further investigation and field verification of the e-flows thresholds are recommended. There is a need
for more monitoring of the biological aspects of the river system to help us determine whether we can
achieve feasible ecosystem goals and targets. Research is needed to develop practical cost effective
approaches to biological monitoring for a range of water courses from headwaters to larger rivers. This
is an area where University researchers could assist by sourcing funding and completing research to
develop cost effective practical approaches.

. In addition, the feasibility of operating the reservoirs to satisfy e-flow needs more consistently without
sacrificing their reliability to meet low flow requirements or endangering recreational users or structures
and inhabitants in the floodplain should be explored.

E-Flows                                                                                                   ii
[E-Flows]                                                                            September 2014

Information, knowledge and approaches in this report has been considered and where appropriate
included in other technical reports related to the water management plan. Specific reports include the
watershed management plan report, the Drought Contingency Plan and report analyzing flow reliability
for regulated reaches in the Grand River watershed.

In some river reaches the river cross section has adjusted to the changed hydrology. In these reaches
some elements of environment flows are not met and are not expected to be met in the future. For
these types of reaches information contains in this and other documents can be used to design
restoration projects aimed at improving ecological function. An example of an effective restoration
project is Schneider Flats in the Kitchener area.

E-Flows                                                                                             iii
[E-Flows]                                                                                                                            September 2014

Table of Contents
    Suggested Citation ..................................................................................................................................... i
    Members of the Environmental Flows Working Group ............................................................................. i
    Acknowledgements.................................................................................................................................... i
    Acronyms and Abbreviations ..................................................................................................................... i
    Executive Summary................................................................................................................................... ii
1     Introduction ....................................................................................................................................... 1-1
    1.1    Historic Events Leading to Altered Hydrology ........................................................................... 1-2
    1.2    The Water Management Plan .................................................................................................... 1-3
2     Background on E-flows Research in the Grand River Watershed...................................................... 2-1
    2.1    Previous Technical Studies ......................................................................................................... 2-1
    2.2    Assessment of Ecological Flow Requirements Techniques: 2005 Study ................................... 2-1
      2.2.1     Introduction ....................................................................................................................... 2-1
      2.2.2     Geomorphic Field Investigation and Analysis .................................................................... 2-2
      2.2.3     Geomorphic Thresholds ..................................................................................................... 2-3
      2.2.4     Flow Analysis ...................................................................................................................... 2-5
      2.2.5     Empirical Thresholds .......................................................................................................... 2-5
      2.2.6     Ontario Low Water Response Thresholds ......................................................................... 2-7
      2.2.7     Hydraulic Modeling ............................................................................................................ 2-7
      2.2.8     Ecological Considerations .................................................................................................. 2-8
      2.2.9     Summary of 2005 EFR Study ............................................................................................ 2-11
    2.3    Speed River Study for Water Quality and Waste Assimilation ................................................ 2-11
    2.4    E-Flows for Low Water Response, 2007, 2012 ........................................................................ 2-13
    2.5    E-Flows for Source Water Protection Planning, 2009-11 ........................................................ 2-14
    2.6    Literature Review on E-flows Frameworks, 2012 .................................................................... 2-15
3     Summary of Lessons Learned from Previous Studies ........................................................................ 3-1
    3.1    2005 Study ................................................................................................................................. 3-1
    3.2    Other Studies 2007-2012 ........................................................................................................... 3-2
4     WMP E-Flows Working Group: Key Regulated River Flow Functions and Processes ........................ 4-1
    4.1    Introduction ............................................................................................................................... 4-1
    4.2    Channel Maintenance and Formation ....................................................................................... 4-2
      4.2.1     Valley Forming Flows ......................................................................................................... 4-2
      4.2.2     Bed Mobilizing Flows ......................................................................................................... 4-3
      4.2.3     Scour/Deposition Flows ..................................................................................................... 4-4
    4.3    Healthy Floodplain Functions .................................................................................................... 4-4
      4.3.1     Floodplain Inundation for Spawning Flows........................................................................ 4-5
      4.3.2     Nutrient Cycling Floodplain Flows ..................................................................................... 4-8
      4.3.3     Macrophyte Flushing Flows ............................................................................................... 4-9
    4.4    Low Flows ................................................................................................................................. 4-10
      4.4.1     Littoral Zone Maintenance Flows..................................................................................... 4-10
      4.4.2     Longitudinal Connectivity Flows ...................................................................................... 4-11
5     Thresholds for Regulated Reaches..................................................................................................... 5-1
    5.1    Central Grand River near Doon .................................................................................................. 5-1
      5.1.1     Historic Occurrences .......................................................................................................... 5-2
    5.2    Grand River near Brantford ....................................................................................................... 5-4
      5.2.1     Historic Occurrences .......................................................................................................... 5-5
    5.3    Speed River at Guelph................................................................................................................ 5-5
E-Flows                                                                                                                                                    iv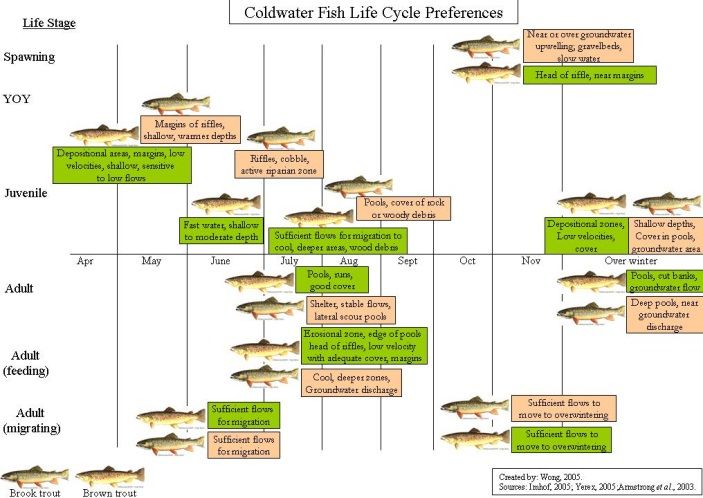
[E-Flows] September 2014
5.3.1 Historic Occurrences .......................................................................................................... 5-6
5.4 Speed River in Cambridge (Hespeler) ........................................................................................ 5-7
5.4.1 Historic Occurrences .......................................................................................................... 5-8
5.5 Charts of Daily Mean Flows and E-flow Thresholds ................................................................... 5-9
6 Low Flow Thresholds for Unregulated Tributaries ............................................................................ 6-1
6.1 Whitemans Creek....................................................................................................................... 6-1
6.1.1 Low Flow History ................................................................................................................ 6-1
6.1.2 Geomorphic Field Investigation and Analysis .................................................................... 6-2
6.1.3 Environmental Low Flows for Whitemans Creek ............................................................... 6-2
6.1.4 Key E-Flow Threshold: Longitudinal Connectivity .............................................................. 6-3
6.1.5 Field Observations to Support E-Flows .............................................................................. 6-3
6.1.6 Comparison with Reserve Flows used in the Tier 2 Water Quantity Stress Assessment .. 6-4
6.1.7 Whitemans Low Flow Threshold: Conclusions and Recommendations ............................ 6-5
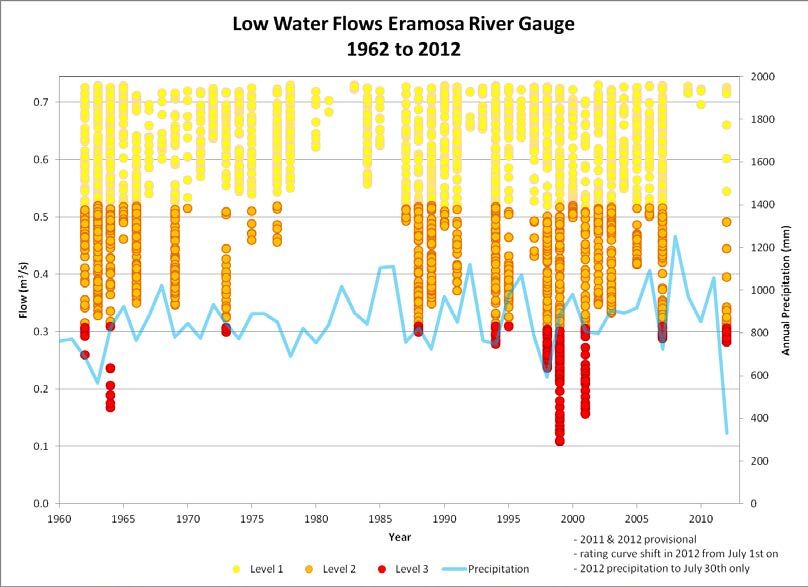
6.2 Eramosa River ............................................................................................................................ 6-5
6.2.1 Low Flow History ................................................................................................................ 6-6
6.2.2 Geomorphic Field Investigation and Analysis .................................................................... 6-6
6.2.3 Environmental Low Flows for Eramosa River .................................................................... 6-7
6.2.4 Key E-Flow Threshold: Longitudinal Connectivity .............................................................. 6-7
6.2.5 Comparison with Reserve Flows used in the Tier 2 Water Quantity Stress Assessment .. 6-7
6.2.6 Eramosa River Low Flow Threshold: Conclusions and Recommendations ........................ 6-8
7 Conclusions ........................................................................................................................................ 7-1
8 E-Flows Regime Recommendations ................................................................................................... 8-1
9 References ......................................................................................................................................... 9-1
9.1 Members of the Environmental Flows Working Group ............................................................. 9-2
10 Appendix A: Historic Flow Occurrences Tables and Charts ............................................................. 10-1
10.1 Central Grand River near Doon ................................................................................................ 10-1
10.2 Grand River near Brantford ..................................................................................................... 10-5
10.3 Speed River at Guelph............................................................................................................ 10-11
10.4 Speed River in Cambridge ...................................................................................................... 10-15
11 Appendix B. Thresholds Calculated for Unregulated Reaches....................................................... 11-19
11.1 Whitemans Creek................................................................................................................... 11-19
11.2 Eramosa River ........................................................................................................................ 11-21
List of Figures
Figure 1. Chronology of Factors Affecting River Flows ..................................................................................................2
Figure 2. Location of pilot reaches for the 2005 EFR study ........................................................................................ 2-2
Figure 3. Example cross section showing bankfull and thalweg stage ...................................................................... 2-4
Figure 4. Life cycle preferences of (a) coldwater and (b) warmwater fish species .................................................. 2-10
Figure 5. Speed River Profile Road 32from the Grand River to Edinburgh Road ..................................................... 2-12
Figure 6. Speed River profile from Niska Road down to Wellington Road 32 .......................................................... 2-13
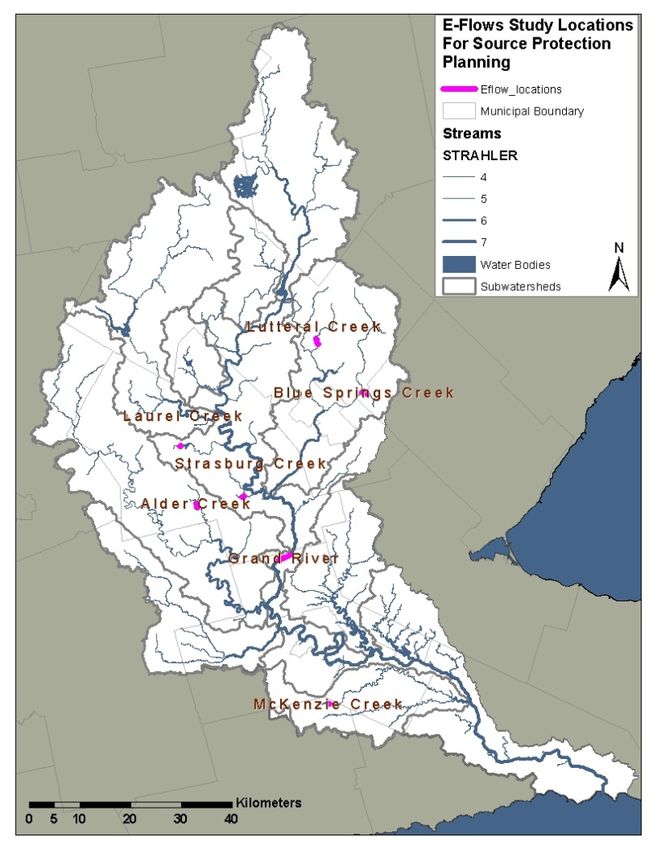
Figure 7. Location of e-flows studies completed for Source Protection Planning Tier 3 Water Budgets ................. 2-15
Figure 8. Schematic showing needs for floodplain spawning flows........................................................................... 4-7
Figure 9. Cross section diagram showing stream littoral zone areas above a thalweg........................................... 4-10
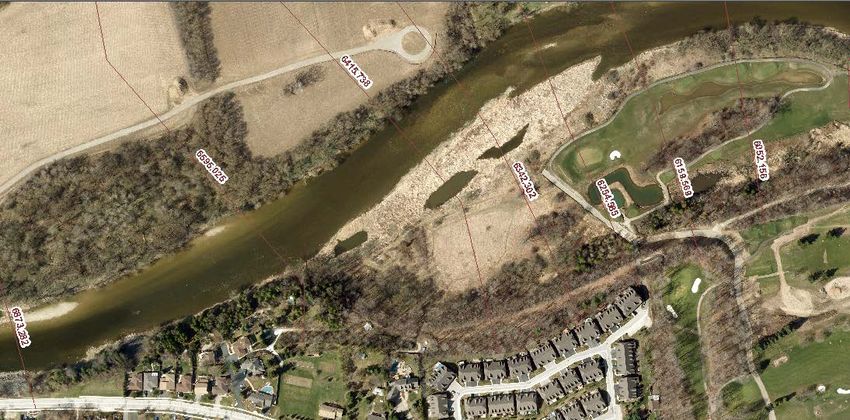
Figure 10. Aerial imagery of a potentially ideal floodplain spawning site in the Grand River near Doon reach ....... 5-3
E-Flows v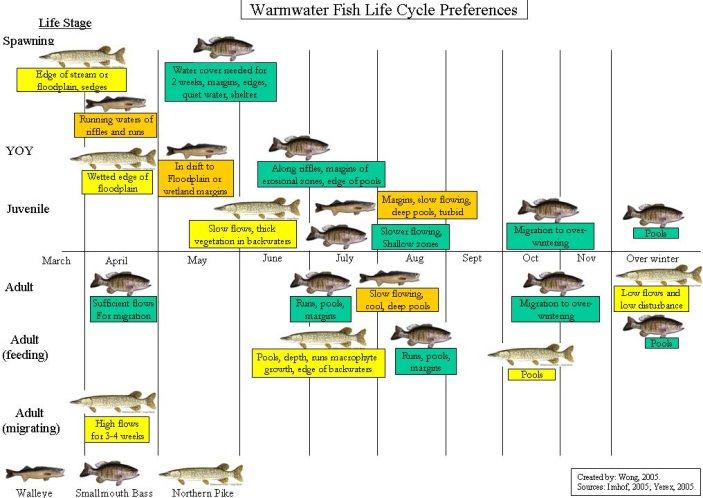
[E-Flows]                                                                                                                           September 2014

Figure 11. Chart of daily flows and e-flow thresholds for the central Grand River near Doon ....................................10
Figure 12. Chart of daily flows and e-flow thresholds for the central Grand River near Brantford .............................11
Figure 13. Chart of daily flows and e-flow thresholds for the Speed River at Guelph..................................................12
Figure 14. Chart of daily flows and e-flow thresholds for the Speed River at Cambridge ...........................................13
Figure 15. Whitemans Creek subwatershed .............................................................................................................. 6-1
Figure 16. Whitemans Creek near Mount Vernon low water occurrences ................................................................ 6-2
Figure 17. Picture of stress behavior in trout populations of Whitemans Creek. The largest trout in this picture is
about 35 cm. (Photo taken July 18, 2012 by L. Halyk) ............................................................................................... 6-3
Figure 18. Eramosa and Speed River subwatersheds ................................................................................................ 6-5
Figure 19. Eramosa River low water history .............................................................................................................. 6-6

List of Tables
Table 1. Flow analysis completed in the 2005 e-flows study ..................................................................................... 2-5
Table 2. Habitat conditions for the Tennant instream flow method ......................................................................... 2-6
Table 3.Tessmann instream flow method conditions ................................................................................................ 2-6
Table 4. Summary of OLWRP levels and thresholds................................................................................................... 2-7
Table 5. Hydraulic analysis completed for the 2005 e-flows study ............................................................................ 2-7
Table 6. Key thresholds for healthy flow regime functions and processes in regulated reaches ............................... 4-1
Table 7. Summary of E-Flow Thresholds needed for a healthy flow regime for regulated reaches......................... 4-12
Table 8. Suite of e-flows thresholds and historic occurrences analysis for the central Grand near Doon ................. 5-2
Table 9. Suite of e-flows thresholds and historic occurrences analysis for the Grand River near Brantford ............. 5-4
Table 10. Suite of e-flows thresholds and historic occurrences analysis for the Speed River at Guelph .................... 5-6
Table 11. Suite of e-flows thresholds and historic occurrences analysis for the Speed River in Cambridge .............. 5-8
Table 12. Low flow thresholds for Whitemans Creek near Mount Vernon gauge ..................................................... 6-3
Table 13. Whitemans Creek Tier 2 WQSA existing scenario supply and reserve estimates (ARI, 2009) .................... 6-4
Table 14. Whitemans Creek refined surface water supply flows for longitudinal connectivity threshold ................. 6-4
Table 15. Whitemans Creek refined surface water supply flows for significant loss threshold ................................. 6-5
Table 16. Low flow thresholds for the Eramosa River at Watson Road gauge .......................................................... 6-7
Table 17. Eramosa River Tier 2 WQSA existing scenario supply and reserve estimates (ARI, 2009) ......................... 6-7
Table 18. Eramosa River refined surface water supply flows .................................................................................... 6-8

E-Flows                                                                                                                                                   vi
[E-Flows]                                            September 2014

            This page was intentionally left blank

E-Flows                                                          vii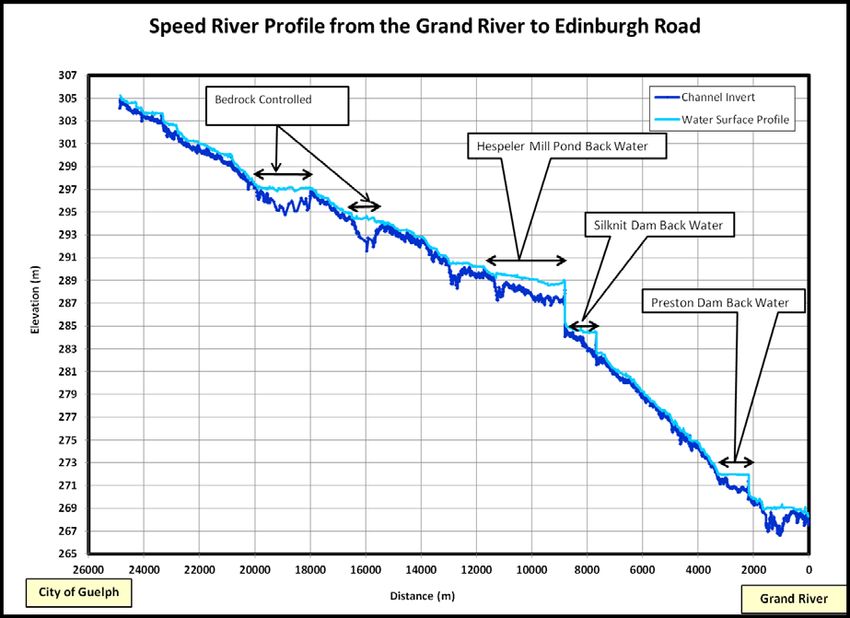
[E-Flows]                                                                                 September 2014

1 Introduction
Environmental flows or ‘e-flows’, has developed into a field of research to describe “the quantity, quality
and timing of water flows required to sustain freshwater ecosystems and the human livelihoods and
well-being that depend on these ecosystems” (Brisbane Declaration, 2007).

The river we have today reflects past choices and environmental conditions. E-flow regimes should
incorporate both high and low flows to mimic the natural variability of rivers, with the timing, duration
and frequency taken into consideration for the flow to be effective. Having flow variability similar to the
natural flow regime increases biodiversity and resilience in the system (King, 2002; Poff et al., 1997).
More water for environmental conditions means there may be mean less water for people and this can
create conflict. The intent over time is to find an acceptable balance. This is one of the challenges with
establishing e-flows. It will always be a negotiation, which requires a cooperative effort to address these
conflicts so that water management decisions can connect people to the actual decisions.

In some river reaches the river cross section has adjusted to the changed hydrology. In these reaches
some elements of environment flows are not met and are not expected to be met in the future. For
these types of reaches information contains in this and other documents can be used to design
restoration projects aimed at improving ecological function. This report discusses historic events that
have led to altered hydrology in the Grand River system, describes the e-flows work that has been
completed for the Grand River system, and characterizes some tributaries that experience seasonal low
flows, and the e-flows needed during those times to maintain a healthy aquatic ecosystem. This report
was completed for the update to the Grand River Water Management Plan and represents the collective
knowledge of the E-Flows Working Group. The tools and techniques highlighted can also be applied in
water management decisions, not just agencies but also larger water users. As such, it provides
recommendations to Water Management Plan partners for further investigation and implementation.

1.1 Historic Events Leading to Altered Hydrology
The Grand River watershed, with a drainage area of 6800 square kilometres, is the largest in southern
Ontario. Land use conversion to agricultural and urban uses during European settlement in the 1800’s,
resulted in extensive deforestation and the loss of over 65 % of the wetlands (Grand River Conservation
Authority, 2003). As the land was altered, the ability for the landscape to naturally hold and release
water diminished. The resultant higher, more intent flows caused more scour, erosion and slumping of
natural channel shape. River flows became uncontrolled, flashy and caused widespread flooding during
the spring, yet severe droughts occurred during the summer. The hydrology of the streams showed a
greater variability than the natural regime – larger floods, longer droughts – as the landscape produced
more runoff and less infiltration. The sediment regime was also altered by the changing land use. More
sediment was delivered to streams and rivers, resulting in over-widening of the channel, sedimentation
and entrenchment, with many river channels disconnected from their associated floodplains.

Run-of-the river dams, constructed for generating water power throughout the river system, obstructed
fish migration, decreased flow rates, and increased water depths upstream, causing increases in water
temperature, sediment loads and contaminant deposits. Furthermore, human and livestock waste were
dumped into the river without treatment. By the 1930s, river conditions were so severe that floods,
drought and pollution affected public health and economic development in watershed communities.
Public concerns resulted in the formation of the Grand River Conservation Commission (GRCC) in 1932
to address water management issues in the watershed.
E-Flows                                                                                                 1-1
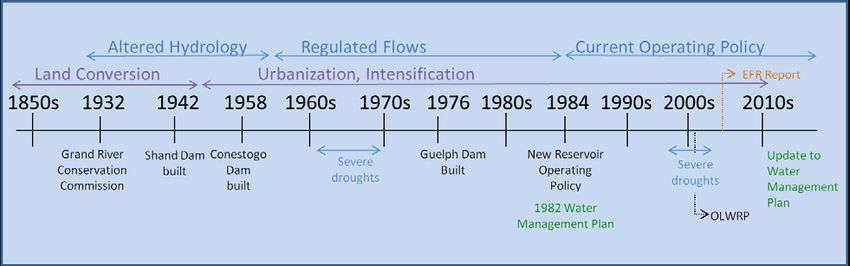
[E-Flows]                                                                               September 2014

A report entitled Report on Grand River Drainage (Finlayson Report) (Finlayson, 1932) recommended
the construction of the Shand Dam on the Grand River near Fergus. The Shand Dam, completed by the
GRCC in 1942, was the first dam built in Canada for conservation purposes, incorporating flood
reduction and low flow augmentation into its operations. It was the first attempt to partly simulate pre-
settlement flows and mimic the natural flow regime by capturing spring floods and slowly releasing
stored water over the summer period. The GRCC went on to build several large multi-purpose dams and
reservoirs - adaptive measures to restore some of the lost storage on the landscape and to modify the
flow regime back to a less altered, more natural state. Today GRCA owns and operates 29 dams in the
watershed, including seven that manage river flows and 22 smaller run-of-the-river dams which
together, help incorporate flood reduction and low flow augmentation into regular GRCA operations.
A timeline of the important occurrences for the consideration of the e-flow needs of the Grand River
and tributaries, changes in land use, flow regulation and operating policies are provided in Figure 1.

Figure 1. Chronology of Factors Affecting River Flows

Prior to construction of the large multi-purpose dams, the altered hydrology and sediment regime
caused by land use conversion resulted in entrenchment and over widening of the river through some
reaches, such as the Grand River near Blair reach. After construction of the dams and reservoirs, the
downstream river channels readjusted to a more managed flow and sediment regime. Other reaches in
the watershed have been considerably impacted by water takings. For instance, the flows in Whitemans
Creek have been affected for decades by agricultural surface water takings to irrigate cash crops on the
well-drained soils of that subwatershed. A challenge exists because of the finite amount of water
available for irrigation, which is largely consumptive and has been increasing in the watershed. In
contrast to agricultural water use, the consumptive portion of municipal water takings have been
reduced through water efficiency and conservation efforts.

1.2 The Water Management Plan
The Grand River watershed has a tradition of collaborative, watershed-based, integrated water
management spanning more than 75 years. The Grand River Conservation Authority (GRCA) and its
predecessors, the GRCC and the Grand Valley Conservation Authority, in partnership with municipalities,
federal and provincial agencies, First Nations, and non-government organizations (NGOs), have
undertaken several major water management planning initiatives. The latest comprehensive water
management plan, the Grand River Basin Water Management Study (Basin Study), was completed in
1982 and is now out-of-date. While many of the plan’s 22 recommendations have been implemented
over the past 30 years, mounting demographic and land use pressures and climate change effects
demand new integrated management approaches and tools to address existing and emerging water

E-Flows                                                                                              1-2
[E-Flows]                                                                                 September 2014

issues in the Grand River system. These issues relate to water quality and the health of aquatic
ecosystems, water supply and demand, and fluctuating river flows (e.g., flooding and droughts). This
situation prompted the GRCA to reach out to federal, provincial and municipal agencies and First
Nations to renew a collaborative process for water management in the Grand River watershed.

In 2009, a voluntary, multi-stakeholder, collaborative initiative to update the Grand River Watershed
Water Management Plan (WMP) was launched. Plan partners signed a Project Charter, which outlined:
1) the purpose and goals, benefits, scope and deliverables, and timelines for the project, 2) described
the governance structure and roles of the partners, and 3) emphasized that the resolution of water
issues. They agreed that addressing water issues requires a collaborative approach that recognizes the
complexity and inter-relatedness of hydrological and ecological processes and acknowledges that
solutions to address the impacts of multiple inputs throughout the river system must be watershed
based. Four main goals of the WMP were stated in the Project Charter, including:
1.        Ensure sustainable water supplies for communities, economies and ecosystems;
2.        Improve water quality to improve river health and reduce the river’s impact on Lake Erie;
3.        Reduce flood damage potential; and
4.        Increase resiliency to deal with climate change.

The Water Management Plan (WMP) for the Grand River has twenty-three broad water objectives that
reflect the human uses, ecological needs and societal values associated with water. One objective is “a
flow regime that supports healthy river processes” in rivers where flows are regulated.

The GRCA currently maintains a watershed-wide monitoring system and operates seven multi-purpose
water control structures to reduce flood damage and risk potential and to maintain summer flows for
water supply and water quality. In addition to these primary-operating objectives, e-flow needs are
considered and, where practical and where information is available, operations of these reservoirs are
adapted to include consideration of e-flows. While dam and reservoir operations have helped to offset
the impacts of land use conversion on the hydrology of the river system where flows are regulated, it is
unlikely that channel form can ever return to a natural state. For example, floodplain inundation may
not be achievable given the now-entrenched nature of the channel. However, improvements to the
existing river conditions to improve ecological health are possible. Additional hydraulic analyses and
scientific research about how management decisions affect flow patterns, species composition, and
habitat is needed for identifying and designing effective measures to restore river habitats and flow
regimes, as well as supporting a wider array of life cycle requirements for aquatic species. For instance,
slight modifications to the operating procedures for the dams may improve e-flows in downstream
reaches. This approach may be the most effective means of recapturing some of the lost channel and
floodplain functions in the river system. However, until further data is acquired, the nature and extent
of opportunities to restore river reaches and to what level is indefinite.

Run-of-the-river dams and remnants and other human-made structures built in the channel continue to
affect sediment transport, nutrient cycling, thermal regimes and block fish passage (King, 2002). The
Grand River Fisheries Management Plan provides guidance regarding existing run-of-the-river dams
from a fishery management perspective (Ontario Ministry of Natural Resources and Forestry and the
Grand River Conservation Authority 1998/2005). Some existing run-of-the-river dams are a benefit for
fisheries management by limiting the movement of introduced species that may be detrimental to
native species. Other run-of-the-river dams are a barrier to sediment movement and impede the river’s
ability to process nutrients; improvement to downstream aquatic health can be gained through
decommissioning of these structures. An inventory of run-of-the-river in the Grand River watershed is

E-Flows                                                                                               1-3
[E-Flows]                                                                               September 2014

needed to: 1) summarize the functions of existing dams, along with a qualitative assessment of their
impacts from a sediment transport, nutrient processing and fisheries perspective, and 2) provide context
and identify opportunities to improve or enhance the resiliency of the river to pass sediment, process
nutrients and allow fish migration in the Grand River watershed.

Altering flow regimes and sedimentation processes to improve aquatic ecosystem health is not a
straightforward endeavour. Water quality is also a significant factor affecting ecological health.
Understanding the impact of water quality on aquatic health, where river ecology is constrained by
water quality rather than by flows, and the interplay between flows and waters quality, is another
important aspect of research, which is needed to improve e-flows.

The e-flows framework should be grounded in day-to-day decision-making. From a management
perspective, other water management concerns must be considered and choices made when water
management objectives diverge or when priorities are set. For instance, the use of water for agricultural
irrigation may interfere with the flows required to support a healthy aquatic ecosystem. The Water
Management Plan provides an opportunity for water managers to consider options, solutions and next
steps in the context of the range of water uses, needs and values as articulated in the broad water
objectives.

E-Flows                                                                                              1-4
[E-Flows] September 2014
2 Background on E-flows Research in the Grand River Watershed
2.1 Previous Technical Studies
A list of the previous technical studies directly related to environmental flows is outlined below:
• Evaluation of Ecological Flow Requirements Assessment Techniques in Selected Reach of the Grand
River (Grand River Conservation Authority, 2005)
• E-Flows for Blue Springs Creek: report for the City of Guelph Adaptive Management Plan (AMP) for
the Arkell Spring Grounds
• Reports on environmental flows for Source Protection Planning (SPP) Tier 3 Water Budgets for the
Region of Waterloo
• Reports on environmental flows for Source Protection Planning Tier 3 Water Budgets for the City of
Guelph
• Whitemans Creek Level 3 Ontario Low Water Response Program (OLWRP) Pilot 2007
• Level 3 recommendations reports for Ontario Water Director’s Committee 2012 for Whitemans
Creek and Eramosa River subwatersheds
These studies are summarized below and sources are provided as reference for more detailed
information.
2.2 Assessment of Ecological Flow Requirements Techniques: 2005 Study
2.2.1 Introduction
The Grand River Conservation Authority (GRCA) participated in a study commissioned by Conservation
Ontario (CO) for the Ontario Ministry of the Environment and Climate Change (MOECC) on ecological
flow requirements (EFR), completed in 2005. The study assessed currently available EFR techniques on
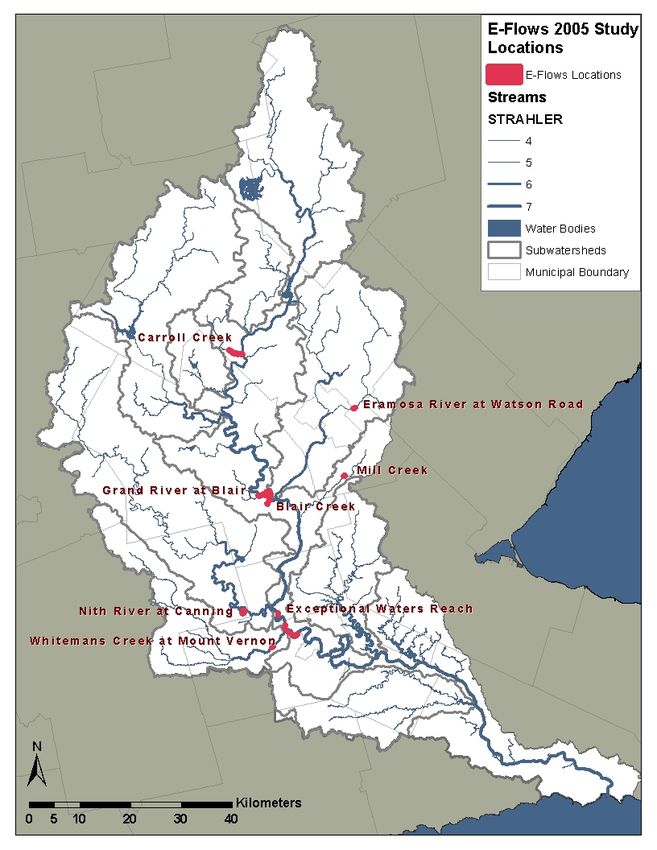
eight reaches in the Grand River watershed (Figure 2). This was the first e-flows study in the watershed
to cover a wide variety of techniques for assessment. It generated a wealth of hydrological, geomorphic,
hydraulic and biological information. This report created a framework, illustrating how flow, hydraulic,
geomorphic and biotic life cycle requirements could be arranged to analyze characteristics of a river
reach and quantify specific e-flow thresholds for consideration.
The project was a collaborative effort among Trout Unlimited Canada, Parish Geomorphic Ltd,
academics, and the GRCA. A synthesis report with the other studies (in Long Point Region and Cataraqui
Region Conservation Authorities) was also completed by a consultant on behalf of Conservation Ontario
(CO), to give a summary of the recommendations and key findings (Conservation Ontario, 2006).
The following sections provide a summary of the investigations completed for the GRCA report.
E-Flows 2-1[E-Flows] September 2014 Figure 2. Location of pilot reaches for the 2005 EFR study 2.2.2 Geomorphic Field Investigation and Analysis Geomorphic field investigations were completed based on protocols outlined in a report by Parish Geomorphic Ltd. (Parish Geomorphic Ltd., 2005a). The geomorphic investigations estimated geomorphic thresholds needed to support stream processes. These thresholds were related to stream flow for further flow and hydraulic analysis and for comparative purposes. These thresholds were developed to E-Flows 2-2
[E-Flows]                                                                                   September 2014

help understand what flows are required to maintain geomorphic and sediment transport processes
that would help support healthy ecological processes.

The eight study sites selected were located along a stretch of reach near flow gauge stations. These sites
included: large river sites on the Grand River at Blair, the Exceptional Waters reach, and the Nith River at
Canning, an intermediate sized site on the Eramosa River at Watson Road, and small study sites on Blair
Creek, Whitemans Creek, Mill Creek and Carroll Creek (Figure 2). Reach lengths were at least 20 bankfull
channel widths to capture dominant channel characteristics. The field survey included 10 hydraulic cross
sections spaced along the study reach, selected to capture hydraulic controlling features along the reach
such as riffles and runs, as well as the diversity of the bed configurations at the site. Riffle crests, when
not perpendicular to the channel banks, were surveyed along the top of the crest to better capture the
hydraulic control.

A longitudinal profile was measured along the reach - along the thalweg of the channel - to capture the
channel invert using an automatic level and stadia rod, capturing both the channel planform (channel
gradient) and water surface profile. Points were surveyed to capture main breaks in the slope and the
deepest point in the pools, with a focus on the hydraulic controls. This longitudinal profile was later used
to verify the hydraulic modeling and to estimate connectivity flow thresholds from a geomorphic
perspective. The long profile is very insightful to illustrate how a study reach is functioning hydraulically.

Substrate information collected included pebble counts, degree of embeddedness, hydraulic roughness
and subpavement composition. Pebble counts were completed, and field observations were taken of
substrate material, using a modified Wolman sampling technique at each cross section. This information
was later used in the analysis that generated selected geomorphic thresholds such as flushing and bed
mobilizing flows.

Width-to-depth ratios for each cross section were calculated, as the calculation allows for confirmation
or refinement of field estimates. In addition, analysis of the minimum ratio gives an indication of
bankfull or channel forming stage, and plotting the ratio to find inflection points in the curve can identify
the thalweg, or low flow channel, if present.

The geomorphic information was further analyzed when incorporated into a hydraulic model. Hydraulic
modeling of reaches allows a more thorough analysis of hydraulic inflection points and thresholds such
as bankfull flows (detailed in further sections).

Geomorphic analysis was completed using the hydraulic and pebble count information to develop
thresholds including bankfull flow, bed mobilizing flow, flushing flows and residual pool flows.

2.2.3     Geomorphic Thresholds

One of the primary geomorphic thresholds initially calculated was bankfull stage, which was used to
determine when out-of-channel flooding begins to occur. Bankfull flow stage can be defined as the point
at which the flow resistance reaches a minimum, which in turn allows the channel to operate at highest
efficiency for transporting flow and sediment (see Figure 3). Bankfull stage can be calculated by
determining the minimum width-to-depth ratio, or through other field indications such as change in
slope, bank vegetation and other bankfull characteristics. Hydraulic modelling provides the best
estimate of bankfull flow thresholds.

E-Flows                                                                                                   2-3
[E-Flows]                                                                               September 2014

                                                                        Thalweg stage

Figure 3. Example cross section showing bankfull and thalweg stage

The bed mobilizing flow is the flow threshold that moves the median grain size (D50) bed material. This
flow was analyzed to determine flow requirements for promoting the resorting and redistribution of bed
material, which becomes a surrogate for estimating turnover and refreshing of aquatic habitat. The bed
mobilizing flow also helps to restore assimilative capacity of the reach to improve water quality for the
next low flow season.

The flushing flow is the flow threshold that allows for re-entrainment of finer sediments, which become
embedded in the coarser sediment matrix of riffles. This flow requires sufficient energy to re-entrain
these sediments. The removal of fine sediments reduces embeddedness, which can cause impairment
to aquatic habitat and spawning areas.

The residual pool flow threshold was estimated to determine the low flow at which pools become
disconnected from one another as flow drops below the riffle crests. Low flow values for residual pool
flows were determined based on the geomorphology of the river and subsequent hydraulic inflection
point analysis, as described in a 1999 report(Prairie Provinces Water Board, 1999). By plotting width-to-
depth ratios versus flow, hydraulic inflection points (changes in slope or curvature of the line) show
abrupt changes in the width-to-depth ratio as the flow decreases, meaning much less hydraulic habitat
is available with a small change in flow.

Geomorphic fieldwork was completed by Parish Geomorphic Ltd, who provided reports on field
collection and analysis for each study site. A supporting report was also provided to the GRCA regarding
protocols for geomorphic field evaluations of these four ecological flow thresholds (Parish Geomorphic
Ltd., 2004; Parish Geomorphic Ltd., 2005a; Parish Geomorphic Ltd., 2005b; Parish Geomorphic Ltd.,
2005c).

E-Flows                                                                                              2-4
[E-Flows] September 2014
2.2.4 Flow Analysis
Data from the Water Survey of Canada daily stream flow archive were used to complete a flow analysis.
Study sites were selected to correspond to locations where long term gauge records existed. The flow
analysis produced several tables and charts to analyze and characterize the historic flow regime. A list of
information was compiled to support interpretation of flow information, along with hydraulic,
geomorphic and empirical environmental flow approaches. In all, 15 figures and tables were compiled to
present flow information (Table 1).
Table 1. Flow analysis completed in the 2005 e-flows study
Table or Figure Description
1. Mean Monthly Flow Table Provides supporting information for empirical methods and summarizes
low flow events
2. 7-Day low flows summary table Summarizes 7-day flows monthly, annually and seasonally, along with
(also 15-day and 30-day) occurrence of annual minimum by season
3. Annual 7-Day low flows For the 2, 5, 10, 20, 50 and 100 year return periods for comparison with
typical designs, such as 7Q20 for assimilative capacity purposes
4. 7, 15, 30, 60, 90, 120, 150, 180, Used to assess the persistence of low flows
210, 240, 270, 300, 330 and 360 Used to identify short duration and longer duration droughts and
day running low flows (charts and wetter periods in the gauge history
tables)
5. Ranked running low flow Used to assess duration or persistence of running flows to characterize
the flow regime
6. Chart of daily flow percentiles by Used to illustrate variability of flows over the year, used to characterize
day of year for the period of record the flow regime, from a timing and duration of flow perspective
7. Flow duration curve for period of Used to characterize the persistence of flow by month, used for later
record by month and composite for comparison with other information and methods
the period of record
8. Annual instantaneous flows Used to assess the frequency and magnitude of out of bank flow
threshold
9. Annual maximum annual daily Used to assess the frequency and magnitude of out of bank flow
mean flows threshold
10. Daily flows compared with out of Used to assess the frequency and magnitude of the out of bank flow
bank flow threshold threshold
11. Flood frequency flow statistics for Used to assess the frequency of flood and frequency of out of bank
the 2,5,10,20,50,100,200 and 500 flows
return period flows
12. Baseflows (June through Calculated using a program called BFLOW, a baseflow separation
September) and annual technique. Separates out baseflow from streamflow using a 3-phase
filter over streamflow records. A description of the baseflow separation
technique is described (Bellamy, 2003).
2.2.5 Empirical Thresholds
The 2005 study looked at several simple empirical thresholds that had been developed and were
available at that time. These included the Tennant Method, the Tessmann method, and the modified
E-Flows 2-5[E-Flows] September 2014
Tennant Method. These empirical thresholds were simple existing techniques available at the time, and
were typically used to complete desktop historical flow-based analysis. However, these methods are not
suitable for use in the Grand River watershed, as the thresholds were developed in Montana for
mountain stream ecology and not transferable to the Grand River watershed. Statistics from these
methods were calculated for comparative purposes.
The Tennant method (Tennant, 1976) is a streamflow-based, desktop method used to estimate
environmental flow requirements. It assumes aquatic habitat conditions are similar for streams carrying
the same proportion of mean annual flow. Environmental flow estimates from the Tennant method are
based on a percentage of the annual streamflow at a given location. Tennant (1976) related percentage
mean annual streamflow to aquatic habitat conditions. Table 2 presents this relationship, and as can
been seen from this table, the Tennant method uses a two season approach based on mean annual flow
(QMA).
Table 2. Habitat conditions for the Tennant instream flow method
*Aquatic-Habitat Percentage of QMA, Apr – Sep Percentage of QMA, Oct – Mar
Condition for Small Streams % %
Flushing Flow 200 200
Optimum Range 60 – 100 60-100
Outstanding 60 40
Excellent 50 30
Good 40 20
Fair 30 10
Poor 10 10
Severe Degradation 40% QMA USE: 40% QMM
Tessmann specified a 14-day period of 200% QMA during the month of highest runoff for flushing
purposes. QMA: mean annual flow, QMM: mean monthly flow
[Source: Prairie Provinces Water Board 1999, from Tessmann, 1980]
E-Flows 2-6[E-Flows] September 2014
The Tessmann method described above assumes a Tennant April to September good condition and an
October to March outstanding condition. For the 2005 study, the Tessmann method was further
modified by using the Tennant criteria for other conditions to produce optimum, outstanding, excellent,
good, fair, poor and degraded conditions.
2.2.6 Ontario Low Water Response Thresholds
The OLWRP flow levels are a 3-tiered indicator of low flows, characterized by a percentage of both long-
term average precipitation and streamflow. Higher tier levels indicate a more severe negative departure
from the long-term precipitation and streamflow normals. The reason for calculating the low water
response thresholds (Table 4) was to assess how the low water response criteria compared against the
environmental flow needs calculated by various other methods.
Table 4. Summary of OLWRP levels and thresholds
Indicator
Condition Precipitation Streamflows
(3- or 18-month)
Level 1[E-Flows] September 2014
Analysis Description
the cross section water surface inferring changes in habitat.
5. Flow vs. Hydraulic Radius (not The hydraulic radius is a measure of a channel flow efficiency.
available for all reaches) Inflections in hydraulic radius help identify transition to
floodplain or thalweg flow conditions.
6. Flow vs. Froude Number Describes open channel flow condition turbulent or non-
turbulent flow.
Used to define when the stream flow condition changed from
non-turbulent conditions to a faster flowing turbulent condition.
7. Flow vs. Channel Velocity Used to confirm geomorphic thresholds and to assess fish
Average cross sectional velocity passage from a velocity perspective.
8. Flow vs. Width-to-Depth Ratio Used to infer when large changes in cross width and depth were
Channel width by maximum occurring. The combination of these parameters was useful to
depth infer large changes in hydraulic condition and habitat.
A range of flows were simulated with hydraulic modeling to produce flow relationships for each
parameter, and charts were created to illustrate these relationships. The charts were interpreted and
inspected for inflection points in the flow versus hydraulic parameter relationship. Inflection points were
interpreted to identify key flow thresholds that resulted in changes to hydraulic parameters. For
example, a large change in wetted perimeter versus top width inferred a flow where the water flow
became more confined to the low flow portion (thalweg) of the stream cross section. This could infer
the flow at which the shallow fringes of the stream start to dry up. Loss of this habitat can affect the
ecology of the stream.
Inflection points for the various hydraulic parameters in each reach were noted for comparison against
other thresholds. This hydraulic information was also used by biologists and geomorphologists to better
relate flow to biological and geomorphic thresholds. Further details on the hydraulic modeling results
are given in GRCA (2005, Appendix D).
The Indicators of Hydrologic Alteration (IHA) software (Richter et al., 1996) was applied in the 2005
study. This software is a useful diagnostic tool that analyzes daily flow time series data. In all, 33
hydrologic parameters were analyzed to provide insights into changes in magnitude, duration,
frequency, timing and rate of change of flow parameters. The software also allows users to assess the
flow regime using the Range of Variability Approach (RVA) - software that is capable of analyzing both
altered (regulated) and unaltered (natural) time series to summarize changes in the flow regime. RVA
software is very effective at illustrating the influence of flow regulation in the regulated reaches of the
river. Examples of the range of flow statistics, hydraulic thresholds and empirical indices can be found in
Appendix B for unregulated streams.
2.2.8 Ecological Considerations
Biological monitoring data is limited within the Grand River watershed, thus surrogate methods were
used to estimate the impacts to the aquatic ecology. One approach was to estimate the ability for fish to
migrate up and down the channel, using water depth as the variable. When flow depths drop, riffle
crests (high points in the bed of the river) are the first to be exposed. When the flow depth starts to
E-Flows 2-8[E-Flows] September 2014
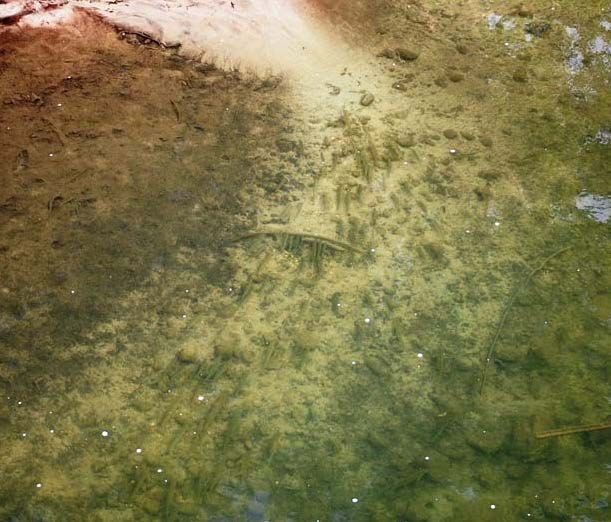
restrict fish migration, the longitudinal connectivity is lost. The critical flow depth to limit longitudinal
connectivity and start to isolate adult trout fish, is 0.20m (Imhof, 2004). Limited mobility increases
stress to the fish as they cannot cross riffle crests to migrate up and down the Creek, or find refuge and
food. Stress also induces crowding, which is not normal behaviour for these territorial species (Halyk,
2012). Crowding increases predation of larger fish on smaller fish, as habitat and thermal refuge areas
become scarce.
The estimate of longitudinal connectivity converts a flow depth of 20cm over riffle crests into a flow
rate. Water depth was collected during hydraulic surveys of riffle crests, which were used to calibrate
the hydraulic model (HEC-RAS). Then flow rates were tested to compute a water surface elevation of
20cm depth from hydraulic modeling. In some areas, these were verified in-situ.
2.2.8.1 Life Cycle Requirements for Warm and Cold water Fishery
Another approach was to infer the hydrological needs of certain fish species based on their life cycle
preferences. These preferences are based on the age of the fish (life stage) and their known habits
during that particular life stage (e.g. migration and spawning). This was a qualitative assessment as
detailed data is not available. The following excerpt describes the rationale and the preference charts
produced.
Excerpt from GRCA (2005):
On an annual basis, the characteristics of the flow regime will act as a qualifier of habitat
availability and suitability within the channel. An analysis of both hydrological event
characteristics and flow regime characteristics is important to understand the ability of the
channel/valley system to provide all requirements of various life stages. Life stage
requirements are not only dependent on the order of the stream within the watershed, but
also on the type of stream channel within the watershed.
General and standard life history stages are used, similar to those used in Habitat Suitability
Index models (e.g. Raleigh et al., 1984): reproduction; nursery; juvenile; and adult. Life state
variables are also used: overwinter refuge; feeding; and migration. When considering the
connections between habitat and biotic use, four factors are important to consider:
Life stage/state: Normative activity (e.g. reproduction) of a species. This includes a
specific stage of a species' life cycle plus activities common through
the entire life cycle (e.g. feeding).
Dynamic Conditions: Those conditions that change rapidly to affect life stage/state
activities.
Physical Environment: Those conditions that must exist over long periods of time to support
habitat (e.g. hydrologic, geomorphic, hydraulic).
Habitat: Those spaces which have appropriate forms and conditions to support
life stages/states.
Physical habitat requirements at certain life stages of fish can be linked to the timing of
occurrence during the year. Life stages and streamflows were the basis for two figures that
show the relationship between life stages of fish throughout the year and the hydrological
requirements at that life stage. The species were separated into coldwater fish species (Figure
4a), including brook trout and brown trout; and warmwater fish species (Figure 4b), including
E-Flows 2-9[E-Flows] September 2014
smallmouth bass, walleye and northern pike. These figures can be used as qualitative
assessments of life cycle requirements to assess the importance of maintaining flows at certain
times of the year, and the implications of low flows at certain life stages for several fish
species.
A
B
Figure 4. Life cycle preferences of (a) coldwater and (b) warmwater fish species
E-Flows 2-10You can also read