Improved slant column density retrieval of nitrogen dioxide and formaldehyde for OMI and GOME-2A from QA4ECV: intercomparison, uncertainty ...
←
→
Page content transcription
If your browser does not render page correctly, please read the page content below
Atmos. Meas. Tech., 11, 4033–4058, 2018
https://doi.org/10.5194/amt-11-4033-2018
© Author(s) 2018. This work is distributed under
the Creative Commons Attribution 4.0 License.

Improved slant column density retrieval of nitrogen dioxide and
formaldehyde for OMI and GOME-2A from QA4ECV:
intercomparison, uncertainty characterisation, and trends
Marina Zara1 , K. Folkert Boersma1,2 , Isabelle De Smedt3 , Andreas Richter4 , Enno Peters4 , Jos H. G. M. van Geffen1 ,
Steffen Beirle5 , Thomas Wagner5 , Michel Van Roozendael3 , Sergey Marchenko6 , Lok N. Lamsal6 , and Henk J. Eskes1
1 Royal  Netherlands Meteorological Institute, KNMI, De Bilt, the Netherlands
2 Wageningen    University, WUR, Meteorology and Air Quality Group, Wageningen, the Netherlands
3 Institut royal d’Aéronomie Spatiale de Belgique, BIRA-IASB, Brussels, Belgium
4 Institut für Umweltphysik, IUP, Bremen, Germany
5 Max-Planck-Institut für Chemie, MPI, Mainz, Germany
6 Goddard Space Flight Center, NASA, Greenbelt, USA

Correspondence: Marina Zara (zara@knmi.nl)

Received: 13 December 2017 – Discussion started: 11 January 2018
Revised: 11 June 2018 – Accepted: 12 June 2018 – Published: 11 July 2018

Abstract. Nitrogen dioxide (NO2 ) and formaldehyde                 has reduced but not altogether eliminated systematic errors
(HCHO) column data from satellite instruments are used for         in the fitting approach. For HCHO, we reach similar conclu-
air quality and climate studies. Both NO2 and HCHO have            sions (QA4ECV uncertainties of 8–12 × 1015 molec. cm−2 ),
been identified as precursors to the ozone (O3 ) and aerosol       but the closeness between the DOAS and statistical uncer-
essential climate variables, and it is essential to quantify and   tainty estimates suggests that HCHO uncertainties are in-
characterise their uncertainties. Here we present an intercom-     deed dominated by random noise from the satellite’s level
parison of NO2 and HCHO slant column density (SCD) re-             1 data. We find that SCD uncertainties are smallest for high
trievals from four different research groups (BIRA-IASB,           top-of-atmosphere reflectance levels with high measurement
IUP Bremen, and KNMI as part of the Quality Assurance              signal-to-noise ratios. From 2005 to 2015, OMI NO2 SCD
for Essential Climate Variables (QA4ECV) project consor-           uncertainties increase by 1–2 % year−1 , which is related to
tium, and NASA) and from the OMI and GOME-2A instru-               detector degradation and stripes, but OMI HCHO SCD un-
ments. Our evaluation is motivated by recent improvements          certainties are remarkably stable (increase < 1 % year−1 ) and
in differential optical absorption spectroscopy (DOAS) fit-        this is related to the use of Earth radiance reference spec-
ting techniques and by the desire to provide a fully trace-        tra which reduces stripes. For GOME-2A, NO2 and HCHO
able uncertainty budget for the climate data record generated      SCD uncertainties increased by 7–9 and 11–15 % year−1 re-
within QA4ECV. The improved NO2 and HCHO SCD val-                  spectively up until September 2009, when heating of the in-
ues are in close agreement but with substantial differences in     strument markedly reduced further throughput loss, stabil-
the reported uncertainties between groups and instruments.         ising the degradation of SCD uncertainty to < 3 % year−1
To check the DOAS uncertainties, we use an independent es-         for 2009–2015. Our work suggests that the NO2 SCD un-
timate based on the spatial variability of the SCDs within         certainty largely consists of a random component (∼ 65 % of
a remote region. For NO2 , we find the smallest uncertainties      the total uncertainty) as a result of the propagation of mea-
from the new QA4ECV retrieval (0.8 × 10¹⁵ molec. cm−2 for          surement noise but also of a substantial systematic compo-
both instruments over their mission lifetimes). Relative to        nent (∼ 35 % of the total uncertainty) mainly from “stripe
earlier approaches, the QA4ECV NO2 retrieval shows bet-            effects”. Averaging over multiple pixels in space and/or time
ter agreement between DOAS and statistical uncertainty esti-       can significantly reduce the SCD uncertainties. This suggests
mates, suggesting that the improved QA4ECV NO2 retrieval           that trend detection in OMI, GOME-2 NO2 , and HCHO time

Published by Copernicus Publications on behalf of the European Geosciences Union.
4034                        M. Zara et al.: Improved slant column density retrieval of nitrogen dioxide and formaldehyde

series is not limited by the spectral fitting but rather by the      project focused on characterising and quantifying the uncer-
adequacy of assumptions on the atmospheric state in the later        tainties associated with the NO2 and HCHO AMF calcula-
air mass factor (AMF) calculation step.                              tion (Lorente et al., 2017). Here, we quantify the uncertain-
                                                                     ties of state-of-science spectral fitting algorithms for the NO2
                                                                     and HCHO SCDs from the Ozone Monitoring Instrument
                                                                     (OMI), aboard the EOS Aura satellite, and the Global Ozone
1   Introduction                                                     Monitoring Experiment-2 (GOME-2) aboard the MetOp-A
                                                                     satellite.
Nitrogen oxides (NOx = NO + NO2 ) and formaldehyde                      Recently, spectral fitting procedures for NO2 have been
(HCHO) play important roles in atmospheric chemistry by              revised to accommodate improved information on absorp-
driving the formation of ozone (O3 ) (e.g. Sillman et al., 1990)     tion cross sections, instrument calibration, and surface effects
and aerosols (e.g. Bauer et al., 2007), and influencing hy-          (Richter et al., 2011; Marchenko et al., 2015; Van Geffen et
droxyl (OH) concentrations in the global troposphere (e.g.           al., 2015; Anand et al., 2015; Krotkov et al., 2017). Based on
Miyazaki et al., 2017). Surface atmospheric concentrations           extensive comparisons of spectral fitting approaches between
of nitrogen dioxide (NO2 ) may reach levels that are directly        BIRA-IASB, the University of Bremen (IUP), MPIC, and
harmful to health (e.g. Fischer et al., 2015) and lead to detri-     KNMI, the QA4ECV-consortium has developed improved
mental environmental impacts through acid rain. HCHO is              spectral fitting algorithms for NO2 and HCHO, which have
a known carcinogen (e.g. Zhu et al., 2017). Observations             been tested and applied to spectra from OMI, GOME-2A,
of NO2 and HCHO are thus important for air-quality mon-              SCIAMACHY, and GOME (QA4ECV Deliverable 4.2 in
itoring and forecasting as well as climate (IPCC, 2013). Re-         Muller et al., 2016; www.qa4ecv.eu). Here we will evalu-
cently, the Global Climate Observation System (GCOS) has             ate results from the new QA4ECV algorithm against existing
identified NO2 and HCHO as precursors to essential climate           SCD data sets, with special attention on characterising the
variables (ECVs) because of their value in detecting and at-         uncertainties in the data sets.
tributing changes in O3 (e.g. Verstraeten et al., 2015) and             The issue of slant column uncertainty1 remains relevant
aerosol distributions (GCOS-138, 2010).                              for NO2 retrievals because it dominates the overall re-
    Satellite instruments are providing long-term global             trieval uncertainty over low and moderately polluted areas
records of tropospheric NO2 and HCHO column densities,               (Boersma et al., 2004). For HCHO, SCD uncertainties are
as well as stratospheric NO2 , but there is a need still for         also substantial over regions with enhanced concentrations,
reliable and traceable information on data quality. The EU           and averaging multiple observations in time or over a larger
FP7 project Quality Assurance for Essential Climate Vari-            area is required in order to bring the random fluctuations in
ables (QA4ECV) (http://www.qa4ecv.eu/, last access: 10               the retrievals (e.g. Millet et al., 2008; Dufour et al., 2009)
June 2018) is addressing this need by making a fully trace-          down to a level at which they can be used for applications
able quality assurance effort on all aspects of the NO2 and          such as trend analyses and emission estimates. Previous stud-
HCHO (and carbon monoxide) retrieval algorithms. Spectral            ies have quantified SCD uncertainties from GOME (Boersma
fitting is the first step in the algorithms used for the retrieval   et al., 2004), GOME-2 (Valks et al., 2011; De Smedt et al.,
of NO2 and HCHO columns (e.g. Leue et al., 2001; Richter et          2012), and OMI (Boersma et al., 2007; Millet et al., 2008)
al., 2011; De Smedt et al., 2012). Using the differential op-        for short periods of time, so it is unclear how the SCD un-
tical absorption spectroscopy (DOAS) method, a modelled              certainties evolve over time, which is particularly relevant
reflectance spectrum is matched to a satellite-measured re-          for instruments with substantial degradation in the quality
flectance spectrum to determine the abundance of NO2 and             of level 1 (ir)radiances such as GOME-2A (e.g. Dikty and
HCHO along the average photon path between the Sun and               Richter, 2011; Munro et al., 2016). Furthermore, the main
the satellite, called the slant column density (SCD) of the          drivers of the SCD uncertainties need to be identified to in-
trace gas. The total SCD may consist of a tropospheric and a         form data users on where and when SCDs are most reliable
stratospheric part. In the second step of the retrieval, a sepa-
                                                                        1 Uncertainty is defined as a non-negative parameter that char-
ration of the two parts occurs. One procedure is via data as-
similation in a chemistry transport model (CTM), which esti-         acterises the dispersion of values attributed to a measured quantity
mates the stratospheric NO2 vertical column density (VCD).           (e.g. SCD). There is also uncertainty associated with the method
Alternative approaches estimate the stratospheric column di-         of measurement, as there can be other methods (i.e. different
                                                                     spectral fitting algorithms) that would give systematically differ-
rectly from the satellite total column measurements over
                                                                     ent results of apparently equal validity. This definition follows the
remote regions and above mid-altitude clouds, without in-            guidelines of the Guide to the Expression of Uncertainty in Mea-
put from CTMs (Bucsela et al., 2013; Beirle et al., 2016).           surement (GUM; https://www.bipm.org/utils/common/documents/
The stratospheric NO2 SCD is then subtracted from the to-            jcgm/JCGM_100_2008_E.pdf, last access: 10 June 2018) and the
tal SCD yielding the tropospheric NO2 SCD. In the final              International Vocabulary of Basic and General Terms in Metrol-
step the SCDs are converted to VCDs by dividing by the air           ogy (VIM; https://www.bipm.org/utils/common/documents/jcgm/
mass factors (AMFs). An earlier study within the QA4ECV              JCGM_200_2012.pdf, last access: 10 June 2018).

Atmos. Meas. Tech., 11, 4033–4058, 2018                                                 www.atmos-meas-tech.net/11/4033/2018/
M. Zara et al.: Improved slant column density retrieval of nitrogen dioxide and formaldehyde                                  4035

and to what extent averaging or filtering is required to bring     analysis of the SCD uncertainty derived from the DOAS and
down retrieval noise to render the data useful for applica-        the statistical technique over the 2005–2015 period is pre-
tions.                                                             sented. We also discuss whether NO2 and HCHO retrievals
   Our study on the quality assurance of NO2 and HCHO              from OMI and GOME-2 can meet the GCOS requirements
SCDs, therefore, has three coherent goals:                         (http://www.wmo.int/pages/prog/gcos/, last access: 10 June
                                                                   2018) for satellite-based data products for climate, such as
 1. to evaluate NO2 and HCHO retrievals (from BIRA-
                                                                   spatio-temporal resolution and instrumental stability. Finally,
    IASB, IUP, KNMI, NASA, QA4ECV) by quantifying
                                                                   Sect. 5 summarises our findings and discusses directions for
    and characterising the DOAS-derived SCDs and their
                                                                   future research.
    uncertainties;
 2. to investigate the dependencies of the DOAS-derived
    SCD uncertainties;                                             2     Quality of level 1 data for UV–VIS sensors
 3. to analyse how SCD uncertainties develop over time,
                                                                   2.1    Ozone Monitoring Instrument
    and how instrument degradation affects the stability of
    long-term climate data records.
                                                                   The Dutch–Finnish Ozone Monitoring Instrument (Levelt et
   The DOAS technique provides SCDs along with an un-              al., 2006b) is a push-broom nadir-viewing near-UV–visible
certainty estimate for each spectral fit. The SCD uncertain-       spectrometer aboard NASA’s EOS Aura spacecraft launched
ties computed by DOAS are challenging to validate because          in July 2004. In an ascending Sun-synchronous polar or-
direct independent reference measurements (of SCDs) are            bit, crossing the equator at 13:40 local time (LT), OMI pro-
lacking. In principle, ground-based DOAS or SAOZ (Pom-             vides measurements of various trace gases, NO2 and HCHO
mereau and Goutail, 1988) measurements can be used for             among them, along with ancillary information on UV-B sur-
validation, but they first require separate AMF conversions,       face flux, cloud and aerosol parameters. The instrument is
corrections for mismatches in time, and careful consideration      equipped with two two-dimensional charge-coupled device
of differences in vertical and spatial representativeness of the   (CCD) detectors (Dobber et al., 2006) for simultaneous spa-
satellite and ground-based measurements. In this paper, we         tial and spectral registration: CCD1 covers spectral chan-
therefore use an independent a posteriori method to establish      nels UV1 (264–311 nm) and UV2 (307–383 nm) and CCD2
the absolute level of the uncertainty in the NO2 and HCHO          covers the VIS channel (349–504 nm). It is in the latter
SCDs that can be attributed to instrument noise in the level 1     channel that the spectral features of NO2 are most promi-
data from OMI and GOME-2. This technique, first used by            nent, while the UV2 channel is used for retrieving HCHO
Wenig et al. (2001) and later by Boersma et al. (2007), trans-     SCDs. With a spectral resolution (full width at half maxi-
lates the spatial variability in the slant columns over con-       mum) between 0.42 and 0.63 nm and a spatial resolution of
fined pristine areas with known limited geophysical variabil-      13 × 24 km2 (along × across track) at nadir, OMI simultane-
ity (Pacific Ocean) into an uncertainty estimate for the slant     ously measures the solar backscattered irradiance in a swath
column itself. We concentrate on quality assurance of the          of 2600 km at every given orbital exposure, so that 60 pixels
most recent OMI and GOME-2 NO2 SCD data sets from                  are simultaneously registered across track. OMI is equipped
QA4ECV (QA4ECV Deliverable 4.2 in Muller et al., 2016),            with a scrambler that depolarises the light entering the spec-
KNMI (Van Geffen et al., 2015), and NASA (Marchenko                trometers. The instrument signal-to-noise ratio in the VIS
et al., 2015), and on OMI and GOME-2A HCHO from                    and UV2 channels for clear-sky, dark scenes is such that the
QA4ECV (Deliverable 4.2 in Muller et al., 2016) and BIRA-          spectral fitting of typical differential absorption signatures is
IASB (De Smedt et al., 2012, 2015).                                possible for NO2 (absorption signatures comparable to noise
   Section 2 introduces the OMI and GOME-2A instruments            in the reflectances) and challenging for HCHO (absorption
and discusses known issues with the quality of the level           signatures weaker than noise by one order of magnitude; see
1 data in the UV–VIS windows affecting the SCD uncer-              Table 1).
tainties. Section 3 presents the currently operational spec-          Since the beginning of the OMI mission, non-physical
tral fitting algorithms for NO2 and HCHO retrievals, and           variations in SCD values from one viewing angle (i.e. at
the main differences between the fitting approaches from dif-      a given cross-track position, or OMI “row” hereafter) rel-
ferent groups. Section 4 presents the intercomparison of the       ative to another have been observed in both the NO2 and
absolute SCDs retrieved from all fitting algorithms. We de-        HCHO data. These small, discrete jumps result in “stripes”
scribe our method for an independent a posteriori SCD un-          along the orbit. The origin of the stripes is not well known,
certainty estimation, followed by the evaluation of the DOAS       but it is probably related to small differences in wave-
SCD uncertainty with the statistical method. This section          length calibration for each of the 60 viewing angles, and
also investigates dependencies of the SCD uncertainties on         to noise and instrument-related artefacts (e.g. the relatively
potential drivers such as the SCD itself, AMFs, cloud frac-        low-amplitude spectral features introduced by the solar dif-
tions or top-of-atmosphere reflectances. Additionally, a trend     fuser) in the solar irradiance spectrum used in the compu-

www.atmos-meas-tech.net/11/4033/2018/                                                Atmos. Meas. Tech., 11, 4033–4058, 2018
4036 M. Zara et al.: Improved slant column density retrieval of nitrogen dioxide and formaldehyde
Table 1. Estimated signal-to-noise ratio (SNR) for OMI and GOME-2A in the UV and VIS channels for 1 pixel. The uncertainties in the
logarithm of the reflectances are based on the SNR for the radiance and a relatively dark, clear-sky planetary scene with a TOA reflectance
assumed to be 0.2 (or 0.8 × 10¹³ photons sr−1 s−1 nm−1 cm−2 ) for the UV2 channel and 0.1 (1.3 × 10¹³ photons sr−1 s−1 nm−1 cm−2 )
for the VIS channel. The differential optical thickness was calculated for a scenario with 10 × 1015 molec. cm−2 HCHO and 10 × 1015
molec. cm−2 NO2 and a total AMF of 4.
SNR radiances Noise on Differential optical SNR radiances Noise on Differential optical
340–360 nm ln(I /I0 ) thickness HCHO 400–470 nm ln(I /I0 ) thickness NO2
OMI 400a 2.5 × 10⁻³ 3 × 10⁻⁴ 500a 2 × 10⁻³ 2 × 10⁻³
GOME-2A 1000b 1 × 10⁻³ 3 × 10⁻⁴ 1000b 1 × 10⁻³ 2 × 10⁻³
a Based on globally averaged OMI level 1 radiance SNR levels recorded for orbit 21078 (1 July 2008) (Quintus Kleipool, personal communication, 2017).
The SNRs in the OMI irradiance (reference spectra used for retrievals, e.g. yearly averages in the OMNO2A v1, v2 approach) are much higher, 2000 for UV2
and 4000 for VIS, that it is neglected in the calculation of the uncertainty of the logarithm of the reflectance.
b This estimate (for 2007) is based on the level 1 radiance levels mentioned in the Table caption and signal-to-noise vs. level 1 curves for GOME-2A Band 4
and Band 5 obtained from Ruediger Lang (personal communication, 2017).
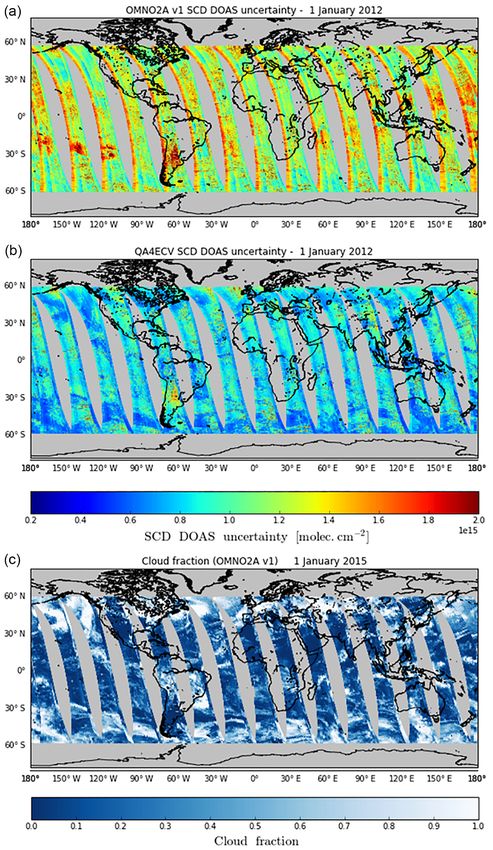
tation of the reflectance (Boersma et al., 2011; Veihelmann (Boersma et al., 2011) and remains below 2 % up to this day
and Kleipool, 2006; Nico Rozemeijer, personal communi- (see Sect. 4.3.1). Schenkeveld et al. (2017) report 1–2 % ra-
cation, 2017). Stripes appear as a systematic effect along diance (practically wavelength independent) and 3–8 % irra-
the orbit, and it is possible to correct for them follow- diance (slightly wavelength-dependent) degradation over the
ing an a posteriori “de-striping” procedure that is based on mission, and the wavelength calibration of the instrument re-
the premise that geophysical variation in NO2 or HCHO mained stable to 0.005–0.020 nm. OMI data are considered
in the across-track direction (east–west) is smooth rather to be reliable and of good quality for the full mission thus far.
than stripe-like (Boersma et al., 2007). The NO2 de-striping
corrections (for the OMNO2A retrievals in the DOMINO
v2 processing system) are generally of the order of 0.3– 2.2 Global Ozone Monitoring Experiment-2
0.5 × 10¹⁵ molec. cm−2 , which is within 10 % of typical
SCD values, but have grown in time (Boersma et al., 2011). The Global Ozone Monitoring Experiment-2 (Callies et al.,
Weaker absorbers like HCHO are affected more by this in- 2000) on board EUMETSAT’s METOP-A satellite (GOME-
strumental artefact (up to 50 × 1015 molec. cm−2 ), but the 2A) was launched in October 2006 into a descending
use of daily radiance spectra as a reference (instead of so- Sun-synchronous orbit, crossing the equator at 09:30 LT.
lar irradiance spectra) reduces the stripes in the OMI HCHO GOME-2A is a whisk-broom UV–visible spectrometer mea-
SCDs (down to 2 × 10¹⁵ molec. cm−2 ) (e.g. De Smedt et al., suring solar irradiance and Earth radiance in the nadir
2015). swath with ground pixels of 40 km along track and 80 km
Apart from the stripes, OMI measurements contend with across track using a scanning mirror to measure 24 scenes
the row anomaly (RA), a dynamic effect first noticed in across the 1920 km wide swath, followed by eight larger
June 2007 when several cross-track FOVs (rows) began (40 × 240 km2 ) back-scan pixels. Near-global coverage is
to experience partial blockage of incoming Earth radiance. obtained daily with small gaps in the equatorial regions.
Since then, the RA extended to other rows (https://disc.sci. GOME-2A records spectra in the range from 240 to 790 nm
gsfc.nasa.gov/Aura/data-holdings/OMI, last access: 10 June at a spectral resolution of 0.26–0.51 nm, allowing the re-
2018; see more discussion in Schenkeveld et al., 2017). This trieval of the same atmospheric components as OMI, as well
RA mostly appears as a signal suppression in the level 1B as Sun-induced fluorescence (e.g. Joiner et al., 2013; Sanders
radiance data at all wavelengths, leading to cloud retrievals et al., 2016). Additionally, two polarisation components are
of poor quality, even though successful spectral fits for NO2 retrieved with polarisation measurement devices (PMDs) at
and HCHO can still be achieved (QA4ECV Deliverable 4.2 30 broadband channels covering the full spectral range. From
in Muller et al., 2016). We exclude the affected rows 22–53 15 July 2013 onwards, GOME-2A operates in tandem with
(0-based) from the entire orbit throughout the 2005–2015 pe- its accompanying sensor GOME-2B (launched in Septem-
riod from our analysis. ber 2012) with a reduced swath of 960 km and pixels of
In spite of the above issues, OMI’s radiometric stability 40 × 40 km2 (Munro et al., 2016), motivated by the desire
is very good for a UV–VIS spectrometer. It is monitored by to monitor global air quality on a daily basis with the two
routine measurements of solar flux and by tracking on-board sensors. The GOME-2A signal-to-noise ratio in band 4 (UV)
parameters (Dobber et al., 2008) and geophysical parame- and band 5 (VIS) was (initially) better than for OMI, so that
ters (e.g. average reflectivity in Antarctica and Greenland) spectral fitting of typical differential absorption signatures is
(McPeters et al., 2015). Over the period 2004–2010 the op- quite feasible for NO2 (with a signature ∼ 2 × stronger than
tical degradation in the visible channel was less than 2 % the noise in reflectances), and possible for HCHO (absorp-
Atmos. Meas. Tech., 11, 4033–4058, 2018 www.atmos-meas-tech.net/11/4033/2018/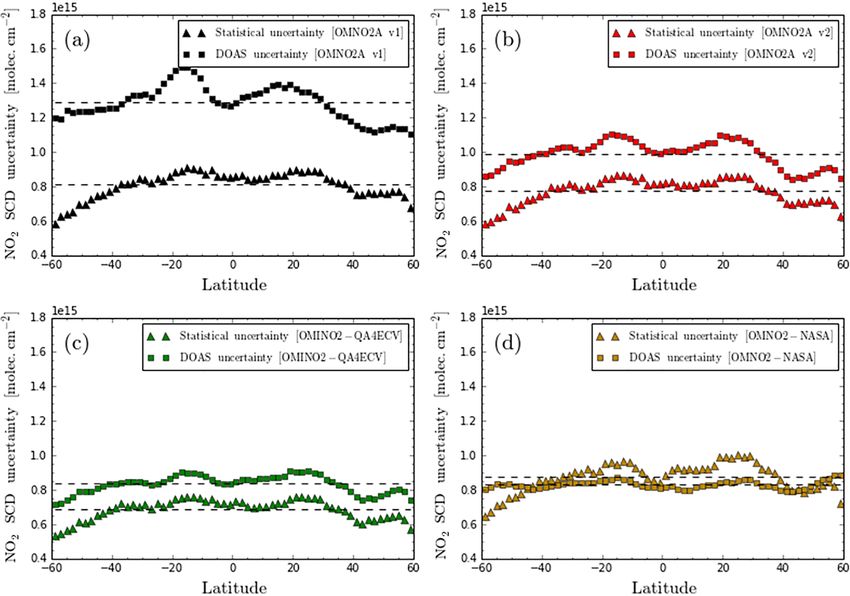
M. Zara et al.: Improved slant column density retrieval of nitrogen dioxide and formaldehyde                                     4037

tion signatures weaker than noise but of comparable magni-         pecially before September 2009. We will discuss this aspect
tude still – see Table 1).                                         further in Sect. 4.3.
   Since the GOME-2A launch, the quality of its level 1 data
seriously degraded due to (1) instability of the instrument
slit function (e.g. Dikty and Richter, 2011; De Smedt et al.,      3     DOAS technique
2012), (2) potential degradation in the reflectance noise be-
cause of solar diffuser degradation, (3) instrument through-       All retrievals in this work use the DOAS technique (Platt,
put loss, and (4) polarisation spectral structures in the UV       2017), which is based on the Lambert–Beer law, describing
channel. All these potentially influence the spectral fitting of   the attenuation of light passing through a medium. It deter-
HCHO and NO2 in the GOME-2A measurements. We dis-                  mines the trace-gas concentrations integrated along the ef-
cuss these issues in more detail below, since they are impor-      fective photon path in the atmosphere by identifying the rel-
tant for understanding the uncertainties associated with the       ative depth of their characteristic absorption fingerprints. The
HCHO and NO2 SCD retrievals from GOME-2A.                          technique discriminates the spectrally smooth component of
   The GOME-2A slit function varies seasonally and fluctu-         radiation attenuation (e.g. from Rayleigh and Mie scattering,
ations are larger in the UV than in the visible, with the width    variable surface reflectance, spectrally changing instrument
of the slit function narrowing over time (e.g. FWHM reduc-         throughput) from the attenuation from molecular absorp-
tions of 8 % at 359 nm and 6 % at 429 nm between 2007 and          tion, which has distinct spectral features. In DOAS, a high-
2015; e.g. Lacan and Lang, 2011; Dikty and Richter, 2011,          pass filter (nominally a low-order polynomial) of the spectra
De Smedt et al., 2012; Munro et al., 2016). These variations       eliminates these broadband extinction processes. Also, ref-
are mostly related to the thermal fluctuations of the GOME-        erence spectra are included to describe the effects of rota-
2A optical bench associated with seasonal and long-term            tional Raman scattering (the Ring effect). The observed sig-
changes in the solar irradiance (Munro et al., 2016). Changes      nal that varies rapidly with wavelength is matched to a mod-
to the slit function shape due to inhomogeneous slit illumi-       elled spectrum based on reference spectra (i.e. lab-measured
nation are not considered to be an issue due to the averaging      cross section spectra) of the trace gases of interest. For this
effect caused by across-track scanning (Munro et al., 2016).       purpose, a model spectrum is constructed      that approximates
The calibration of the GOME-2A solar irradiance measure-           the observed reflectance spectrum Robs (λ) = µπI          (λ)
                                                                                                                          0 I0 (λ)
                                                                                                                                   with
ments is different from that of the radiances, because the ir-     I (λ) the Earth radiance spectrum, I0 (λ) the reference spec-
radiances are reflected by the solar diffuser before arriving      trum, usually from the Sun, and µ0 the cosine of the solar
at the scan mirror. This additional optical component (rel-        zenith angle2 ) or the natural logarithm of the observed re-
ative to the radiance light path) implies that any inadequa-       flectance
                                                                             spectrum,
                                                                                        which is proportional to the optical depth
cies in the characterisation of the diffuser or changes during                    I0 (λ)
                                                                     τ (λ) = ln I (λ) . The DOAS-technique then minimises
the mission lead to degradation of the reflectances. To avoid
                                                                   the differences between the modelled and the observed spec-
these issues, but also the degradation in radiances and in
                                                                   tra within a pre-defined spectral or fitting window with op-
scan-angle-dependent calibration knowledge, radiance mea-
                                                                   timal sensitivity to the absorber of interest (e.g. González et
surements over a reference location are used instead of irradi-
                                                                   al., 2015; QA4ECV Deliverable 4.2 in Muller et al., 2016;
ances for GOME-2A HCHO SCD retrievals (e.g. De Smedt
                                                                   Liu et al., 2016). Those coefficients that minimise the differ-
et al., 2012).
                                                                   ences between the model and the observations are retained
   The degradation of other optical components in the
                                                                   as slant column densities for a given trace-gas species. Min-
GOME-2A instrument resulted in a progressive wavelength-
                                                                   imisation of the differences between modelled and observed
dependent loss of the instrument throughput. The throughput
                                                                   reflectances is usually called the intensity fit; between mod-
losses are more pronounced in the UV (around 20 % year−1 )
                                                                   elled and observed optical depths it is the optical depth fit.
than in the visible (10 % year−1 ) (EUMETSAT: GOME-2
Throughput Degradation ESA Final Report, 2011). The main           3.1     NO2 slant column density retrievals
impact of the degradation on the DOAS retrievals is an in-
crease in the noise due to throughput loss. EUMETSAT is-           3.1.1    OMI NO2 spectral fitting and SCDs
sued throughput tests in January and September 2009 in or-
der to understand the mechanisms responsible for this degra-       Table 2 lists the most important retrieval specifics of six NO2
dation and define actions to control it. The second test caused    satellite data sets studied here.
an additional decrease in throughput of 25 % in the UV and             2 In OMNO2A and QA4ECV–QDOAS algorithms (see
10 % in the visible relative to January 2007 but also stabilised   Sect. 3.1.1), the impact of the solar zenith angle at which the
GOME-2A degradation, with a reported degradation rate of           backscattered light is measured is taken into account in the viewing
3 % year−1 for the UV channel and 1 % year−1 for the vis-          geometry (i.e. AMF) of the measurement and the polynomial in the
ible after September 2009. Based on knowledge of the sig-          fit (See Sect. 3.1.1). A successful fit can be achieved even when
nal strength loss, we expect the random uncertainties of the       measurement occurs at 90◦ solar zenith angle (µ0 = 0) by using
SCDs to increase with time throughout the mission, but es-         Robs (λ) = II (λ)
                                                                                 (λ) as observed spectra instead.
                                                                                0

www.atmos-meas-tech.net/11/4033/2018/                                                 Atmos. Meas. Tech., 11, 4033–4058, 2018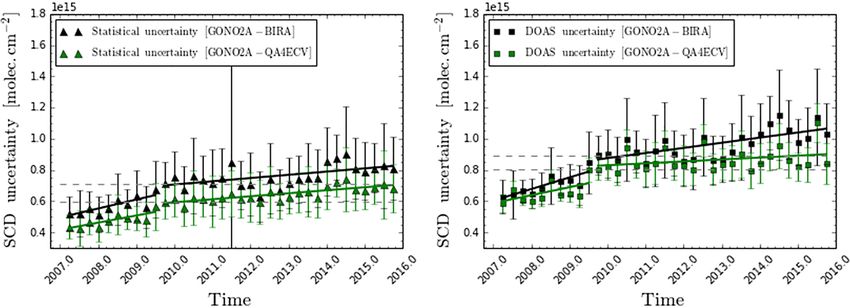
4038                                       M. Zara et al.: Improved slant column density retrieval of nitrogen dioxide and formaldehyde

Table 2. Satellite NO2 slant column density retrievals evaluated in this work.

  Retrieval                            Fitting        Fitting                           Fitted                                         Wavelength               Reference         Used in
                                      window          method                            parameters                                     calibration
                                         (nm)                                                                                          (radiance)
  OMNO2A v1                          405–465          Intensity fita                    NO2 , O3 , H2 Obg , Ring, wave-                Prior to fit             (1), (2)          DOMINO v2, SP v2
                                                                                        length shift, polynomial coeffi-               408–423 nm
                                                                                        cients
  OMNO2A v2                          405–465          Intensity fita                    NO2 , O3 , H2 Obg , Ring, O2 –O2 ,             Prior to fit             (2)
                                                                                        H2 Oblq , wavelength shift, poly-              409–428 nm
                                                                                        nomial coefficients
  OMINO2–QA4ECV                      405–465          Optical depth fita                NO2 , O3 , H2 Obg , Ring, O2 –O2 ,             Along with fit           (3)               QA4ECV OMI
                                                                                        H2 Oblq , Ioff
                                                                                                   c , wavelength shift &              405–465 nm
                                                                                        stretch, polynomial coefficients
  OMNO2–NASA                         402–465          Stepwise intensity fitd           NO2 , H2 Obg , CHOCHO, Ring,                   Prior to fit in 7        (4)               SP v3.1e
                                                                                        wavelength shift (each micro-                  micro-windows
                                                                                        window), polynomial coeffi-
                                                                                        cients (second order)
  GONO2A-BIRA                        425–450          Optical depth fitf                NO2 , O3 , O2 –O2 , H2 Obg , Ring,             Along with fit           (2)               TM4NO2A v2.3
                                                                                         c , wavelength shift & stretch,
                                                                                        Ioff                                           420        and
                                                                                        polynomial coefficients                        460 nm
                                                                                                                                       (5 sub-
                                                                                                                                       windows)
  GONO2A–QA4ECVg                    405–465           Optical depth fitf                NO2 , O3 , O2 –O2 , H2 Obg , Ring,             Along with fit           (3)               QA4ECV GOME-2A
                                                                                        H2 Oblq , Ioff
                                                                                                   c , wavelength shift &              405–465 nm
                                                                                        stretch, polynomial coefficients
(1) Bucsela et al. (2006); (2) Van Geffen et al. (2015); (3) QA4ECV Deliverable 4.2 in Muller et al. (2016); (4) Marchenko et al. (2015); this is a reference to the revised spectral fitting algorithm of NO2
SCDs used in the Standard Product (SP) v3.0 (Krotkov et al., 2017), which is publicly available at https://disc.gsfc.nasa.gov/datasets/OMNO2_V003/summary/ (last access: 10 June 2018). In our study,
we use an updated version (v3.1) (to be released) of OMI NO2 SCDs and their uncertainties.
a Annual average (2005) solar irradiance spectrum is used as the reference spectrum.
b Absorption cross sections of water vapour (H O ) and liquid water (H O ) are used as fitted parameters. The interaction of pure liquid water (e.g. ocean) with incident solar radiation in the VIS (via
                                                  2 g                      2 lq
absorption and vibrational Raman scattering) has an impact on scattered light measured over these areas affecting the DOAS retrievals (Peters et al., 2014).
c The intensity offset, I , corrects for any additive amount of light (either real, i.e. stray light, or an instrumental artefact, i.e. dark current changes) that influences the estimation of the optical depth,
                         off
            I0 (λ)

τ (λ) = ln   I (λ) , with I0 (λ) the solar irradiance spectrum and I (λ) the Earth radiance (Peters et al., 2014).
d Monthly averaged solar irradiance spectrum is used as the reference spectrum.
e See reference (4)
f Daily solar irradiance spectrum is used as the reference spectrum.
g The period 2007–2011 has been processed by IUP with NLIN software (Richter, 1997) and 2012–2015 by BIRA-IASB with QDOAS software (Danckaert et al., 2017) to share the burden of
processing tasks. The intercomparison shows that they are very consistent (QA4ECV Deliverable 4.2 in Muller et al., 2016; Sect. 2.3.1).

   In the OMNO2A v1 and v2 retrievals, the modelled spec-                                                   and IRing (λ)/I0 (λ) the Sun-normalised synthetic Ring spec-
trum is expressed in terms of reflectance (intensity), followed                                             trum. For usage in Eq. (1) σk and IRing have been con-
by a non-linear fit to the observed reflectances (intensity fit).                                           volved with the instrument slit function. This is different
The modelled reflectance used in OMNO2A v1 and v2 to                                                        from many other fit models that include the Ring effect as
minimise the fit residual r(λ) with the observed Robs (λ) is                                                a pseudo absorber, whereas in OMNO2A it is modelled as
                          "                       #                                                         a source of photons influencing the backscattered contribu-
                              Nk                                                                            tions to the modelled reflectance. The radiance I is wave-
       I (λ)                 X
Rmod =        =P (λ) · exp −      σk (λ) · Ns , k                                              (1)          length calibrated prior to solving the above equation, while
       I0 (λ)                k=1
                                                                                                          the irradiance I0 is assumed to be well calibrated. All terms
                            IRing (λ)                                                                       in Eq. (1) need to be given at the same wavelength grid: for
               · 1 + CRing              + r(λ),
                             I0 (λ)                                                                         OMNO2A the irradiance and the reference spectra are in-
                                                                                                            terpolated to the (calibrated) radiance wavelength grid. Fit
with I (λ) as the Earth radiance, I0 (λ) as the 2005 an-                                                    parameters are the trace-gas slant columns Ns,k , the Ring ef-
nual average solar irradiance spectrum, and σk (λ) as the                                                   fect coefficient CRingP, and the coefficients αm of the DOAS
trace-gas cross sections. The Ring effect, caused by inelas-                                                polynomial P (λ) = αm λm of order m. Note that Eq. (1) is
tic Raman scattering of incoming sunlight by N2 and O2                                                      fully non-linear due to the way the Ring effect is included on
molecules (Grainger and Ring, 1962), is accounted for by                                                    the right-hand side. OMNO2A v2 slant column retrievals are
the term inside the parenthesis on the right-hand side of                                                   improved relative to v1 via an optimised window used for the
Eq. (1). Here, CRing represents the Ring fitting coefficient

Atmos. Meas. Tech., 11, 4033–4058, 2018                                                                                                  www.atmos-meas-tech.net/11/4033/2018/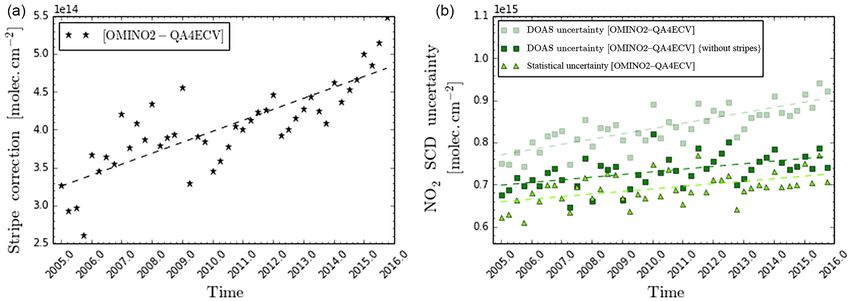
M. Zara et al.: Improved slant column density retrieval of nitrogen dioxide and formaldehyde                                                4039

prior-to-fit wavelength calibration, leading to much reduced              the mostly linear fit of Eq. (2) as performed in OMINO2–
fitting errors, and via the inclusion of the absorption by the            QA4ECV the residual is not weighted with the error on the
O2 –O2 collision complex and by liquid water (H2 Olq ) (Van               measurement, so that the χ 2 merit function is simply given
Geffen et al., 2015).                                                     by
    The OMINO2–QA4ECV retrieval performs a χ 2 -
                                                                                  Nλ
minimisation of the residual r(λ) using the QDOAS                                 X
                                                                          χ2 =          (r (λi ))2 .                                         (3b)
software (Danckaert et al., 2017) developed at BIRA-IASB,                         i=1
wherein the modelled spectrum is expressed in terms of
optical depth, followed by a mostly linear fit to the observed            The magnitude of χ 2 is a measure for how good the fit
optical depth (optical depth fit):                                        is. We discuss DOAS SCD uncertainties in more detail in
                                                                          Sect. 4.1.2.
            I (λ0 ) − Poff (λ0 )

 ∗
Rmod   = ln                                                         (2)      The OMNO2–NASA algorithm (used in NASA SP v3)
                   I0 (λ)                                                 uses the intensity fit (Eq. 1) as a default3 along with monthly-
                     Nk
                     X                                                    averaged irradiances. The algorithm is different from the
       = P ∗ (λ) −                   ∗
                           σk (λ) · Ns,k                ∗
                                         − σRing (λ) · CRing + r ∗ (λ),   OMNO2A and OMINO2–QA4ECV approaches in that it
                     k=1                                                  uses a step-by-step (iterative) rather than a simultaneous fit-
                                                                          ting procedure, wherein a reflectance spectrum is optimised
with Poff (λ) a first-order polynomial Poff (λ) = c0 +c1 ·λ that          for NO2 fitting. In the first step, seven small fitting windows
describes the intensity offset correction (denoted as Ioff in Ta-         (micro-windows) are used for iterative wavelength adjust-
ble 2), and λ0 = λI + ωq · (λI − λ0 ) + ωs the calibrated radi-           ments combined with (window-by-window) removal of the
ance wavelength grid, with λI the input radiance wavelength               Ring patterns and low-order polynomial smoothing. Wher-
grid, ωs a wavelength shift with respect to the wavelength λ0             ever appropriate, OMNO2–NASA uses a combination of at-
of the centre of the fit window, and ωq a stretch (ωq > 0)                mospheric and water-leaving Ring spectra in the CRing (λ) es-
or squeeze (ωq < 0) term. Note that the fit parameters on                 timates. In this iterative process the irradiances are eventually
the left side of Eq. (2), the wavelength calibration and inten-           mapped onto the radiance wavelength grid. Then, in step 2
sity offset correction, constitute non-linear terms of the linear         the NO2 , H2 O, and CHOCHO SCDs are sequentially deter-
fit. All terms in Eq. (2) need to be given at the same wave-              mined in the preliminary spectral regions specifically chosen
length grid: for QDOAS the calibrated λ0 and the reference                for the given trace-gas retrieval. After removal of these trace-
spectra are interpolated to the irradiance wavelength grid,               gas absorption features and a thorough evaluation and itera-
calibrated before the fit using a high-resolution solar spec-             tive removal of instrument noise, the final SCDs are obtained
trum (Fraunhofer calibration). Fit parameters are the trace-              via a similar sequential retrieval in slightly adjusted, broad
gas slant columns Ns,k ∗ , the Ring effect coefficient C ∗ , the
                                                        Ring              spectral windows optimal for a given trace-gas species (e.g.
coefficients αm of the DOAS polynomial P ∗ , the coefficients
               ∗
                                                                          402–465 nm for NO2 ).
ci of the intensity offset polynomial Poff , and the wavelength              All four OMI fitting approaches convolve high-resolution
calibration coefficients ωs and ωq . The polynomials P (λ)                absorption cross section spectra with the OMI slit function
and P ∗ (λ) effectively act as the high-pass filter mentioned             (Dirksen et al., 2006; this pre-flight slit function is slightly
in the description of the DOAS technique above. The co-                   modified to match the observed irradiances in OMNO2–
efficient ci represents the offset parameter that accounts for            NASA), which has proved to be stable throughout the OMI
instrumental effects like stray light inside the spectrometer,            mission period (Schenkeveld et al., 2017; Sun et al., 2017).
instrumental thermal instabilities, changes in the detector’s             OMNO2A v1 uses a fixed slit function for all 60 rows, where
dark current, wavelength shifts between I and I0 or other re-             in OMNO2A v2 the slit function has been updated with re-
maining calibration issues in the level 1 product which are               spect to OMNO2A v1 to better represent the across-track av-
known to be sources of bias in DOAS retrievals of minor                   erage (Van Geffen et al., 2015). In the OMINO2–QA4ECV
trace species. It may also account for atmospheric effects                and OMNO2–NASA algorithms, the cross section spectra
such as incomplete removal of Ring structures (De Smedt et                have been convolved for each of the 60 across-track positions
al., 2008; Coburn et al., 2011; Peters et al., 2014; QA4ECV               individually.
Deliverable 4.2 in Muller et al., 2016).
    The χ 2 merit function of the non-linear fit of Eq. (1) is            3.1.2    GOME-2A NO2 SCDs
defined by
                                                                          The GONO2A-BIRA spectral fits are performed using the
       Nλ                            2
                                                                          QDOAS software developed at BIRA-IASB, which solves
       X            r (λi )
χ2 =                                       ,                       (3a)
       i=1
              1 (I (λi ) /I0 (λi ))                                          3 When the intensity fitting approach fails (e.g. yields negative
                                                                          slant columns), the optical depth is modelled (Eq. 2) instead of the
with Nλ the number of wavelengths λi in the fit interval and              reflectances. If optical depth fitting also fails, then the solution from
1(I /I0 ) the standard error on the measurement. In case of               the intensity fit is provided as is.

www.atmos-meas-tech.net/11/4033/2018/                                                             Atmos. Meas. Tech., 11, 4033–4058, 2018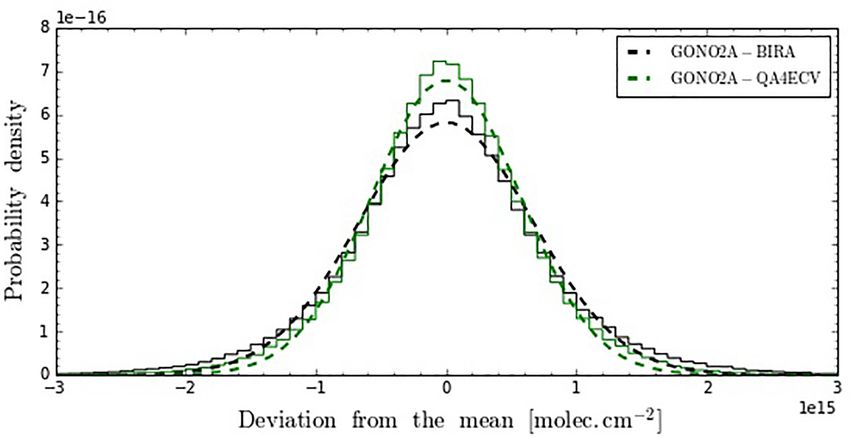
4040                                 M. Zara et al.: Improved slant column density retrieval of nitrogen dioxide and formaldehyde

Table 3. Satellite HCHO slant column density retrievals evaluated in this work.

  Retrieval                                Fitting          Fitting                   Fitted                                                 Wavelength               Reference
                                      window (nm)           method                    parameters                                             calibration
                                                                                                                                             (radiance)
  OMIHCHO–BIRA                         328.5–346.0          Optical depth fita        HCHO (297 K), O3 (228 and 243 K),                      Along with fit           (1)
                                                                                      BrO (223 K, pre-fittedb ), NO2 (220 K),                325–360 nm
                                                                                      O2 –O2 (293 K, pre-fittedb ), Ring1c ,                 (5 sub-
                                                                                      Ring2c , O3 Ld , O3 Od3 , Ioff , wavelength            windows)
                                                                                      shift, polynomial coefficients
  OMIHCHO–QA4ECV                       328.5–359.0          Optical depth fite        HCHO, O3 (223 and 243 K), BrO,                         Along with fit           (2)
                                                                                      NO2 , O2 –O2 , Ring, O3 Ld , O3 Od3 , Ioff ,           325–360 nm
                                                                                      wavelength shift & stretch, polynomial
                                                                                      coefficients
  GO2AHCHO–BIRA                        328.5–346.0          Optical depth fita        HCHO (297 K), O3 (228 and 243 K),                      Along with fit           (1)
                                                                                      BrO (223 K, pre-fittedb ), NO2 (220 K),                325–360 nm
                                                                                      O2 –O2 (293 K, pre-fittedb ), Ring1c ,                 (5 sub-
                                                                                      Ring2c , O3 Ld , O3 Od3 , Ioff , Eta and zeta          windows)
                                                                                      polarisation vectors, wavelength shift &
                                                                                      stretch, polynomial coefficients
  GO2AHCHO–QA4ECV                      328.5–359.0          Optical depth fite        HCHO, O3 (223 and 243 K), BrO,                         Along with fit           (2)
                                                                                      NO2 , O2 –O2 , Ring, O3 Ld , O3 Od3 ,                  325–360 nm
                                                                                      Ioff , Eta and zeta polarisation vectors,
                                                                                      pseudo cross section to correct for East-
                                                                                      West bias, wavelength shift & stretch,
                                                                                      polynomial coefficients
(1) De Smedt et al. (2015); (2) QA4ECV Deliverable 4.2 in Muller et al. (2016).
a Instead of a solar irradiance spectrum, daily Earth radiance spectra over the equatorial Pacific (15◦ S–15◦ N, 180–240◦ E) are used as the reference spectrum.
b BrO and O are pre-fitted in the 328.5–359 and 339–364 nm wavelength intervals respectively. The resulting SCD in each case is used as a fixed value in the nominal window of
             4
328.5–346.0 nm.
c Two cross sections are used to account for the Ring effect (Vountas et al., 1998), calculated in an ozone-containing atmosphere for low and high SZA (solar zenith angle) using
LIDORT RRS (Spurr et al., 2008).
d Two additional terms (O L and O O ) are included to better cope with strong O absorption effects (Puķı̄te et al., 2010; De Smedt et al., 2012). They result from the Taylor
                            3        3 3                                            3
expansion of the O3 absorption as a function of the wavelength.
e Instead of a solar irradiance spectrum, daily Earth radiance spectra over the equatorial Pacific (15◦ S–15◦ N, 150–250◦ E) are used as the reference spectrum.

Eq. (2). The GONO2A-BIRA algorithm uses the 425–                                                 For OMI and GOME-2 HCHO retrievals, a dynamical
450 nm window and fits the absorption cross sections of                                      convolution of the cross sections is performed along with
NO2 , O3 , O2 –O2 , and H2 Og . The fit also accounts for the                                the fit using the improved slit function derived prior to the
Ring effect and includes an intensity offset, along with                                     fit, during the Fraunhofer calibration. The QA4ECV HCHO
a third-order polynomial. The GONO2A–QA4ECV differs                                          retrievals share many aspects with the QA4ECV spectral fit-
from the GONO2A-BIRA retrieval in the choice of a wider                                      ting for NO2 . QA4ECV and BIRA HCHO SCD retrievals are
fitting window of 405–465 nm in the retrieval code and                                       also very similar in absorption cross sections and retrieval
is largely identical to the approach taken in OMINO2–                                        code used (QDOAS, solving Eq. 2). The most prominent dif-
QA4ECV. Both algorithms use daily solar reference spec-                                      ferences between the QA4ECV and BIRA retrievals are the
trum, which contrasts with the use of a fixed annual average                                 following.
or monthly-averaged solar reference spectra in the OMI re-                                      1. Fitting windows: while the BIRA retrievals used a re-
trievals. Previous studies indicated that SCDs retrieved from                                      duced fitting interval (328.5–346.0 nm) combined with
the same sensor in the 405–465 nm window are approxi-                                              pre-fits of O2 –O2 and BrO slant columns in dedicated
mately 0.5 × 10¹⁵ molec. cm−2 higher than those retrieved                                          windows, the QA4ECV retrievals use a single extended
from the 425–450 nm window (Van Geffen et al., 2015).                                              fitting interval (328.5–359.0 nm). There is therefore no
                                                                                                   pre-fit of O2 –O2 and BrO slant columns in QA4ECV.
3.2     HCHO slant column density retrievals
                                                                                                   However, the switch to an extended fitting interval in-
Table 3 lists retrieval specifics of the HCHO satellite data sets                                  troduces additional retrieval difficulties for GOME-2,
from OMI and GOME-2A.                                                                              since this instrument suffers from polarisation struc-
                                                                                                   tures not fully corrected by level 0–1 processing lead-

Atmos. Meas. Tech., 11, 4033–4058, 2018                                                                               www.atmos-meas-tech.net/11/4033/2018/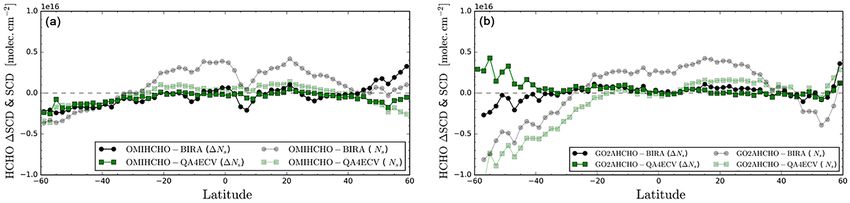
M. Zara et al.: Improved slant column density retrieval of nitrogen dioxide and formaldehyde                                4041

Figure 1. Average NO2 slant columns within 2◦ wide latitudinal bins for OMNO2A v1 (black circles), OMNO2A v2 (red triangles),
OMINO2–QA4ECV (green squares), and OMNO2–NASA (yellow stars) algorithms (a), and for GONO2A-BIRA (black circles) and
GONO2A–QA4ECV (green squares) algorithms (b) for the Pacific (reference sector: 60◦ N–60◦ S and 150–180◦ W) orbit from day 1 of
January, April, July, and October (or closest available data) 2005–2015 for OMI and 2007–2015 for GOME-2A.

       ing to scan-angle-dependent biases in HCHO. To mit-           ment (differences < 4 %). The OMNO2–NASA SCDs (and
       igate these biases, polarisation response cross sections      their uncertainties) used in this analysis correspond to the
       (eta and zeta) are added to the fit together with an em-      latest version (v3.1; to be released) of the new Stan-
       pirical cross section derived from East/West mean fit-        dard Product (SP) (Krotkov et al., 2017). Over the cho-
       ting residuals (Richter et al., 2016). While successful in    sen clean-sector area the v3.1 SCDs are on average higher
       eliminating polarisation-related biases, these additional     by ∼ 0.5 × 10¹⁵ molec. cm−2 than v3.0. Differences between
       cross sections have a non-negligible impact on the re-        v3.1 and v3.0 SCD values are related to the changed ap-
       trieval noise and its time evolution (this issue is further   proach to flagging the presumably noisy wavelength bins
       illustrated in Sect. 4.1.5 and 4.3.3).                        in the OMI radiances as well as improved solar reference
                                                                     spectra. The GOME-2A NO2 SCDs (Fig. 1b) are ∼ 2–
    2. The Ring (pseudo) cross sections are now calculated           3 × 10¹⁵ molec. cm−2 lower than for OMI, which is antici-
       following Chance and Spurr (1997) (previously Voun-           pated because of the diurnal increase in stratospheric NO2
       tas et al., 1998, was used).                                  (e.g. Dirksen et al., 2011) and differences in viewing ge-
    3. An improved earthshine reference selection scheme is          ometries. The GONO2A–QA4ECV SCDs are in line with
       implemented for GOME-2: Earth radiance spectra are            GONO2A-BIRA, with the latter showing on average slightly
       now grouped along viewing zenith angle instead of one         lower values (by < 0.5 × 10¹⁵ molec. cm−2 ), reflecting the
       generic Earth radiance reference spectrum.                    similarity of the BIRA and QA4ECV algorithms. Their main
                                                                     differences are the choice of fitting window and that the
                                                                     H2 Olq is not fitted in the small fitting window (for GONO2A-
4     Results and discussion                                         BIRA). Their relative difference is highest (∼ 12 %) around
                                                                     the Equator.
4.1     Quality assessment of NO2 and HCHO slant                        For HCHO, a comparison of SCDs is less straightforward
        column densities                                             than for NO2 . First of all, daily Earth radiance spectra are
                                                                     used as a reference for the DOAS retrievals instead of so-
4.1.1    Slant column density intercomparisons
                                                                     lar irradiance spectra. The Earth radiance reference spec-
We compare the NO2 SCDs from the OMNO2A v2,                          tra are taken over a reference sector in the equatorial Pa-
OMNO2–NASA, and OMINO2–QA4ECV algorithms, with                       cific, where CH4 oxidation is the only significant source of
OMNO2A v1. Figure 1a shows average absolute NO2 SCDs                 HCHO. The resulting (differential) HCHO SCDs may then
as a function of latitude for all four OMI SCD products              have values close to zero, or even be negative, indicating
for unpolluted Pacific orbits from day 1 of January, April,          that a scene has a similar or smaller HCHO amount than
July, and October 2005 up to 2015. The SCDs show lowest              in the reference spectrum. After the fit, a background cor-
values in the tropics (shorter light path and lower VCDs),           rection is applied to the SCDs (De Smedt et al., 2015). The
and higher values poleward. Averaged over all latitudes,             final differential SCDs (1SCDs) are the result of subtract-
the revised algorithms result in 12–15 % lower SCDs (1.2–            ing the mean HCHO SCD over each OMI row and by 5◦
1.4 × 10¹⁵ molec. cm−2 ) than OMNO2A v1 SCDs, in line                of latitude bins within the reference sector (Ns0 ), from the
with the reductions reported for OMNO2A v2 in Van Gef-               SCDs (Ns ) of the same day, 1Ns = Ns − Ns0 (QA4ECV De-
fen et al. (2015). The revised OMNO2A v2, OMINO2–                    liverable 4.2 in Muller et al., 2016; De Smedt et al., 2017a,
QA4ECV, and OMNO2–NASA SCDs are in close agree-                      2018). This normalisation approach and the choice of daily

www.atmos-meas-tech.net/11/4033/2018/                                                 Atmos. Meas. Tech., 11, 4033–4058, 2018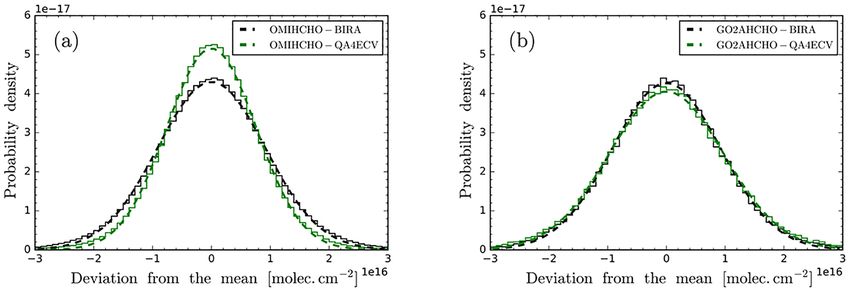
4042 M. Zara et al.: Improved slant column density retrieval of nitrogen dioxide and formaldehyde
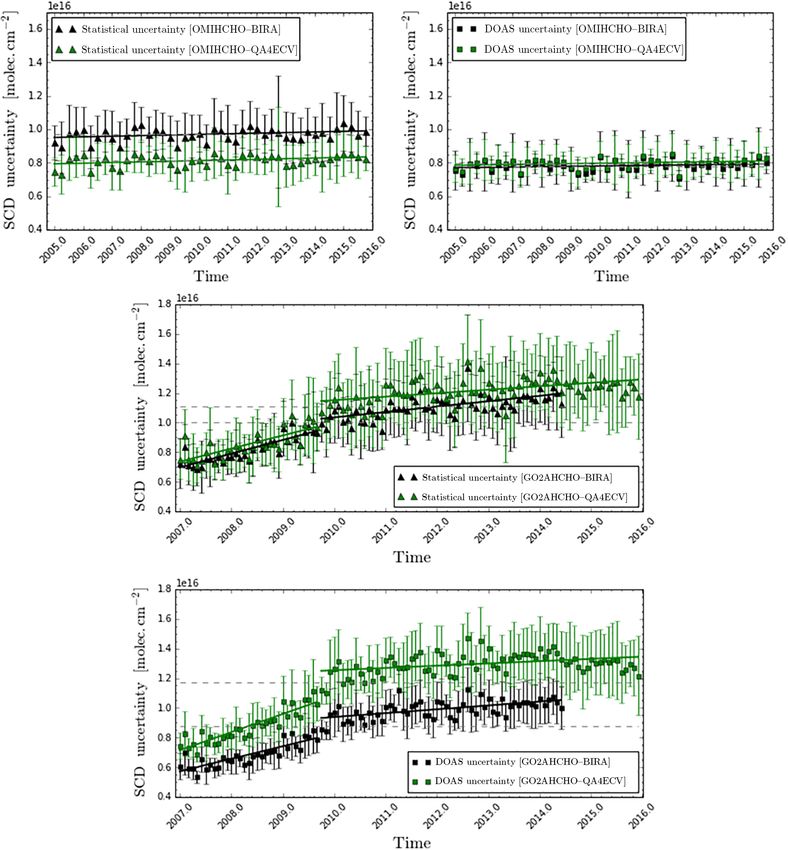
Figure 2. Average differential HCHO slant columns within 2◦ wide latitudinal bins for (a) OMIHCHO–BIRA (black circles) and
OMIHCHO–QA4ECV (green squares) for the Pacific (60◦ N–60◦ S and 150–180◦ W) orbit from day 1 of January, April, July, and Oc-
tober (or closest available data) 2005–2015, and for (b) GO2AHCHO–BIRA (black circles) and GO2AHCHO–QA4ECV (green squares)
for the Pacific orbits from day 1 of January up to December and from day 15 of January, April, July, and October (or closest available data)
2007–June 2014 and 2007–2015 respectively. The light grey and green lines represent the HCHO SCDs before the background correction.
radiance spectra results in 1SCDs close to zero over the the fitting parameters (SCD uncertainty, εNs, j ; “DOAS SCD
reference region. Selecting daily Earth radiance reference uncertainty” hereafter) for a typical non-linear fit. This rou-
spectra helps to reduce the effects of radiance degradation tine is also used by a mostly linear fit in order to find the
for GOME-2A retrievals and the effects of stripes for OMI. non-linear parameters, followed by a solution (the QR de-
The final tropospheric HCHO vertical columns (Nv ) are then composition of the cross sections matrix for QDOAS and the
M0
defined as Nv = 1N s
M + M Nv,0,CTM , where M is the tropo- singular value decomposition for NLIN) for a typical least
spheric AMF, and M0 and Nv,0,CTM are respectively the AMF squares problem for the linear parameters.
and the model background column in the reference sector. The diagonal elements of the covariance matrix, C, are the
Figure 2a shows a comparison of HCHO SCDs before variances of the fitted parameters. The uncertainty in the fit-
(light lines) and after (dark lines) background correction ted parameter, εNs, j , is the square root of the variance:
from the OMIHCHO–QA4ECV and OMIHCHO–BIRA al-
gorithms. Their differential SCDs (1SCDs; dark green and r
−1
black symbols) are highly consistent, with only a small dif- εNs,j = χ 2 AT A jj
, (4)
ference of ∼ 0.7 × 10¹⁵ molec. cm−2 on average. This sug-
gests that the improvements made in the QA4ECV OMI
where A is the matrix formed by the absorption cross sec-
HCHO fitting code do not lead to substantial changes in the
tions, which has K ×M components constructed from the M
HCHO columns, but we will see later that there is consider-
basis functions evaluated at the K abscissas xi (i.e. X1 (x),
able impact on the uncertainties of the fits.
. . . , XM (x)), and from the K measurement errors εi , using
We see similar behaviour for the GOME-2A HCHO SCDs
the prescription
provided by the GO2AHCHO–BIRA and GO2AHCHO–
QA4ECV algorithms (Fig. 2b). As with OMI, averaged
Xj (xi )
over all latitudes the difference between 1SCDs is small Aij = .
(< 0.9 × 10¹⁵ molec. cm−2 ). For the retrieved SCDs, the dif- εi
ferences are larger (up to 15 × 1015 molec. cm−2 ) at all lati-
tudes, stressing the importance of the background correction. The off-diagonal elements are the covariances between the
parameters. In the non-linear intensity fit approach of Eq. (1)
4.1.2 Evaluating slant column density uncertainties all components of the fit are accounted for in the uncertainty
estimate. In the QDOAS and NLIN fits (Eq. 2) only the linear
DOAS SCD uncertainty components in the fit are accounted for: uncertainties on esti-
mated values of the non-linear parameters (i.e. shift, squeeze
The DOAS technique tries to minimise the differences be- and intensity offset parameters) are not taken into account in
tween the observed and the modelled spectra within a nom- the uncertainty estimate of the SCDs, and the measurement
inal wavelength window (spectral points of length K). The errors are not used in the fit (εi = 1) (Danckaert et al., 2017).
Levenberg–Marquardt non-linear least-squares fitting proce- The SCD uncertainties are then estimated using the reduced
dure (M–L) is the numerical routine that performs the χ 2 – χ 2 (instead of the nominal χ 2 ), i.e. Eq. (3b) divided by the
merit function minimisation (Press et al., 1997) and provides number of degrees of freedom in the fit, K − M.
the fitting parameters (of length M) (SCDs, Ns ) and a covari- Uncertainties on the retrieved SCDs thus depend on the
ance matrix that contains an estimate of the uncertainty in following:
Atmos. Meas. Tech., 11, 4033–4058, 2018 www.atmos-meas-tech.net/11/4033/2018/M. Zara et al.: Improved slant column density retrieval of nitrogen dioxide and formaldehyde 4043
1. the accuracy (sensitivity) of the fitting model in captur- atmospheric temperature of the trace gas, but this is typi-
ing the ensemble of spectral features in the observed, cally done in the later AMF step. The slant columns used
noisy reflectance spectrum, in this analysis are not yet corrected for the temperature-
dependency of the NO2 and HCHO absorption cross sec-
2. the uncertainty in the measurements, tions. For all OMI algorithms the DOAS uncertainty esti-
mates may contain contributions from stripes. The statisti-
3. wavelength calibration.
cal HCHO SCD uncertainties reported in the following sec-
The DOAS SCD uncertainty may consist of two parts: a tions concern the differential HCHO SCDs (1SCDs), which
random and a systematic error component. are known to suffer to a lesser extent from this artefact (see
Sects. 2.1 and 4.3).
A posteriori statistical SCD uncertainty
4.1.3 OMI NO2 SCD uncertainties
To evaluate the DOAS SCD uncertainty estimates and to
have an independent means to intercompare the results of the We now compare the OMI NO2 DOAS and statistical SCD
different retrieval methods, we apply an alternative, statis- uncertainty estimates. The algorithms show a slight decrease
tical method. We follow the approach laid out in Wenig et in statistical and DOAS NO2 SCD uncertainties with increas-
al. (2001) and Boersma et al. (2007) to quantify the spatial ing latitude (Fig. 3). For OMNO2A v1, v2, and OMINO2–
SCD variability over pristine, unpolluted areas and assume QA4ECV the DOAS uncertainty exceeds the statistical un-
that such estimates serve as a statistical indicator of the SCD certainty. We attribute this to persistent (systematic) fitting
uncertainty. The main contributors to the SCD variability are residuals and signatures unexplained by the fitting technique.
the instrument (level 1) noise, natural variability within the Averaged over all latitudes, the relative difference between
unpolluted area, scene reflectance (surface, clouds) and view- the statistical and DOAS uncertainty reduces from ∼ 60 %
ing geometry variability. Our objective is to provide an esti- for OMNO2A v1 to ∼ 20 % for OMINO2–QA4ECV. This
mate of the random component of the SCD uncertainty by reduction hints at an improved understanding of the spectral
limiting the contributions from other components to the vari- features, and especially at the reduction in systematic parts
ability over the unpolluted area. We focus our analysis on of the residuals in the OMINO2–QA4ECV spectral fitting
the remote area within 60◦ N–60◦ S and 150–180◦ W (Pacific method relative to OMNO2A v1, in line with findings in Van
Ocean). Practically free of tropospheric pollution, this area Geffen et al. (2015) and Anand et al. (2015) that OMNO2A
is separated in 2◦ × 2◦ (longitude × latitude) “boxes”, which v1 was suffering from inaccurate wavelength calibration.
limits geophysical variability and provides statistically ro- Both statistical and DOAS SCD uncertainties are on av-
bust sampling. We assume that pixels within each box record erage smallest for OMINO2–QA4ECV (15 and 35 % lower
the same NO2 or HCHO total vertical columns. Any vari- than OMNO2A v1), which may indicate a more physically
ability emerging in the retrieved (all- or clear-sky) ensem- accurate fitting model for that algorithm. The DOAS uncer-
ble is then attributed to random uncertainty originating from tainty from OMNO2–NASA shows a smoother geographical
noise in the level 1 data and imperfections in the spectral fit- variation than the pattern of the statistical uncertainty, which
ting model, as long as the geometric AMFs within the box shows substantial variation with latitude (Fig. 3d). The aver-
show little variability4 . Sun glint over the ocean may cause age OMNO2–NASA DOAS and statistical uncertainties are
natural SCD variability for mostly cloud-free scenes, and we of similar magnitude, in contrast to higher DOAS than sta-
investigate this further by segregating the data into two broad tistical uncertainties for OMNO2A v1, v2 and OMINO2–
categories. QA4ECV. The OMNO2–NASA v3.1 DOAS SCD uncertain-
Boxes with relative AMF variability of more than 5 % are ties are on average 40 % lower than v3.0. This reduction in
discarded to prevent variability in viewing geometry influ- the DOAS SCD uncertainties stems from a correction of an
encing the results. In practice, the AMF variability in most error in the v3.0 algorithm. The statistical SCD uncertain-
boxes does not exceed 3.5 %; i.e. SCDs in each box are ties are similar between v3.1 and v3.0 (agreement within
observed under very similar viewing geometries. For these 0.02 × 10¹⁵ molec. cm−2 ). The DOAS and statistical uncer-
boxes we compute standard deviations of the SCDs as the tainties shown in Fig. 3 for the OMNO2A versions are con-
statistical SCD uncertainties. In the DOAS fit, NO2 is fitted sistent with estimates reported for OMNO2A v1 in Boersma
assuming a fixed temperature for its absorption cross section et al. (2007) and Anand et al. (2015), and for OMNO2A v2
of T0 = 220 K, and HCHO is fitted assuming T0 = 298 K. in Van Geffen et al. (2015).
In most retrieval algorithms, a post-correction on the slant Figure 4 shows histograms of the absolute differences
columns is applied to compensate for neglecting the actual between the individual SCDs and the box-mean SCD for
4 The relative AMF variability for each box was computed as
OMNO2A v1 and v2, OMINO2–QA4ECV, and OMNO2–
NASA. The histogram of SCD differences in the OMINO2–
2 0.5
follows: Mi2 − Mi /Mi , where Mi is the AMF attributed to QA4ECV ensemble has the highest peak and smallest width
each pixel within the box. (FWHM 1.6 × 10¹⁵ molec. cm−2 ) of the four algorithms. All
www.atmos-meas-tech.net/11/4033/2018/ Atmos. Meas. Tech., 11, 4033–4058, 2018You can also read