Quarterly Bulletin 2 / 2018 June - Swiss National Bank
←
→
Page content transcription
If your browser does not render page correctly, please read the page content below

Quarterly Bulletin 2 / 2018 June


Quarterly Bulletin
2 / 2018 June
Volume 36


Contents

Page

			 Monetary policy report                     4

1 Monetary policy decision of 21 June 2018     5
  Monetary policy strategy at the SNB          6

2 Global economic environment                  7

3 Economic developments in Switzerland        13

4 Prices and inflation expectations           18

5 Monetary developments                       21

			 Business cycle signals                    28

			 The Swiss National Bank goes to school –
			 with Iconomix                             34

			 Chronicle of monetary events              42

                                                    Quarterly Bulletin 2 / 2018 June   3
Monetary policy report

            Report for the attention of the Governing Board of the Swiss
            National Bank for its quarterly assessment of June 2018.

            The report describes economic and monetary developments
            in Switzerland and explains the inflation forecast. It shows
            how the SNB views the economic situation and the implications
            for monetary policy it draws from this assessment. The first
            section (‘Monetary policy decision of 21 June 2018’) is an excerpt
            from the press release published following the assessment.

            This report is based on the data and information available as at
            21 June 2018. Unless otherwise stated, all rates of change
            from the previous period are based on seasonally adjusted data
            and are annualised.

Quarterly Bulletin 2 / 2018 June
1                                                                   The new conditional inflation forecast for the coming
                                                                    quarters is slightly higher than it was in March 2018
Monetary policy decision                                            (cf. chart 1.1) due to a marked rise in the price of oil; this
                                                                    price rise ceases to affect annual inflation after the first
of 21 June 2018                                                     quarter of 2019. From mid-2019, the new conditional
                                                                    forecast is lower than it was in March 2018, mainly due
                                                                    to the muted outlook in the euro area. At 0.9%, the
                                                                    inflation forecast for 2018 is 0.3 percentage points higher
                                                                    than projected at the March assessment. For 2019, the
                                                                    SNB continues to anticipate inflation of 0.9%, and for
                                                                    2020 it expects to see inflation of 1.6%, compared with
Swiss National Bank leaves expansionary monetary                    1.9% forecast in the last quarter. The conditional inflation
policy unchanged                                                    forecast is based on the assumption that the three-month
The Swiss National Bank (SNB) is maintaining its                    Libor remains at – 0.75% over the entire forecast horizon.
expansionary monetary policy, thereby stabilising price
developments and supporting economic activity. Interest             Overall, global economic growth was solid in the first
on sight deposits at the SNB remains at – 0.75% and                 quarter. Growth in the US and China was strong and
the target range for the three-month Libor is unchanged             broad-based. The pace of economic expansion slowed in
at between – 1.25% and – 0.25%. The SNB will remain                 the euro area, however, albeit partly due to temporary
active in the foreign exchange market as necessary, while           factors. The economic signals for the coming months remain
taking the overall currency situation into consideration.           favourable. The SNB’s baseline scenario therefore
                                                                    assumes that the global economy will continue to grow
All in all, the value of the Swiss franc has barely changed         above its potential.
since the monetary policy assessment of March 2018.
The currency remains highly valued. Following the March             The risks to the SNB’s baseline scenario are more to the
assessment, the Swiss franc initially depreciated slightly          downside. Chief among them are political developments
against the US dollar and the euro. However, in light               in certain countries as well as potential international
of political uncertainty in Italy, there has since been             tensions and protectionist tendencies.
discernible countermovement, particularly against the
euro. The situation on the foreign exchange market thus
remains fragile, and the negative interest rate and the
SNB’s willingness to intervene in the foreign exchange
market as necessary therefore remain essential. These
measures keep the attractiveness of Swiss franc investments
low and ease pressure on the currency.

Chart 1.1

conditional inflation forecast of june 2018
Year-on-year change in Swiss consumer price index in percent

 2.5
 2.0
 1.5
 1.0
 0.5
 0.0
–0.5
–1.0
–1.5
               2015             2016              2017             2018              2019               2020          2021
       Inflation           Forecast June 2018,             Forecast March 2018,
                           with Libor at –0.75%            with Libor at –0.75%
Sources: SFSO, SNB

                                                                     Quarterly Bulletin 2 / 2018 June          5
Switzerland’s economy continued to recover as expected,                       Imbalances on the mortgage and real estate markets persist.
with GDP once again growing faster than estimated                             While growth in mortgage lending has been only moderate
potential in the first quarter. Overall capacity utilisation                  over the last few quarters, real estate prices have continued
improved further on the back of this positive development.                    to rise. Particularly in the residential investment property
The SNB still anticipates GDP growth of around 2%                             segment, there is the risk of a correction due to the strong
for the current year and expects to see unemployment                          increase in prices in recent years. The SNB will continue
falling further.                                                              to monitor developments on the mortgage and real estate
                                                                              markets closely, and will regularly reassess the need for
                                                                              an adjustment of the countercyclical capital buffer.

Monetary policy strategy at the SNB                                           same time, it allows inflation to fluctuate somewhat
The SNB has a statutory mandate to ensure price stability                     with the economic cycle. Second, the SNB summarises
while taking due account of economic developments.                            its assessment of the situation and of the need for
                                                                              monetary policy action in a quarterly inflation forecast.
The SNB has specified the way in which it exercises                           This forecast, which is based on the assumption of
this mandate in a three-part monetary policy strategy.                        a constant short-term interest rate, shows how the SNB
First, it regards prices as stable when the Swiss                             expects the CPI to move over the next three years.
consumer price index (CPI) rises by less than 2% per                          Third, the SNB sets its operational goal in the form of
annum. This allows it to take account of the fact                             a target range for the three-month Swiss franc Libor.
that the CPI slightly overstates actual inflation. At the

Table 1.1

observed inflation in june 2018
                                      2015                        2016                        2017                        2018                  2015 2016 2017

                                      Q1     Q2     Q3     Q4     Q1     Q2     Q3     Q4     Q1     Q2     Q3     Q4     Q1     Q2   Q3   Q4

Inflation                             – 0.7 – 1.1 – 1.4 – 1.4 – 1.0 – 0.4 – 0.2 – 0.2          0.5    0.4    0.5    0.8    0.7                  – 1.1 – 0.4   0.5

Source: SFSO

conditional inflation forecast of june 2018
                                      2018                        2019                        2020                        2021                  2018 2019 2020

                                      Q1     Q2     Q3     Q4     Q1     Q2     Q3     Q4     Q1     Q2     Q3     Q4     Q1     Q2   Q3   Q4

Forecast March 2018,
with Libor at – 0.75%                  0.7    0.6    0.6    0.6    0.7    0.8    1.0    1.2    1.5    1.7    2.0    2.2                          0.6   0.9    1.9
Forecast June 2018,
with Libor at – 0.75%                         0.9    0.9    0.9    0.8    0.9    0.9    1.0    1.2    1.4    1.7    1.9    2.2                   0.9   0.9    1.6

Source: SNB

                        6      Quarterly Bulletin 2 / 2018 June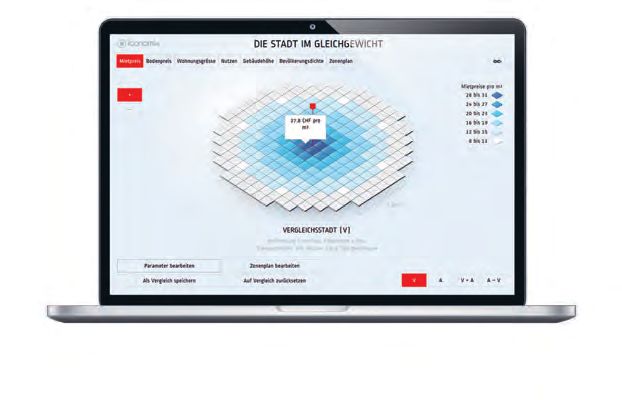
2                                                                                          Chart 2.1

Global economic                                                                            global exports of goods
                                                                                           Average of depicted period = 100

environment                                                                                Index
                                                                                             120

                                                                                             110

                                                                                             100

                                                                                               90

The global economy expanded robustly overall in the first                                      80
quarter. Growth in the US and China was strong and
                                                                                               70
broad-based. The pace of economic expansion slowed in
the euro area and Japan, albeit partly due to temporary                                                2009 2010 2011 2012 2013 2014 2015 2016 2017 2018
factors. On the whole, international goods trade remained                                           World                                   Emerging economies
dynamic (cf. chart 2.1). Furthermore, employment in the                                             Advanced economies
advanced economies continued to improve.                                                   Sources: CPB Netherlands Bureau for Economic Policy Analysis (CPB), Thomson
                                                                                           Reuters Datastream

Economic signals for the coming months are favourable.
Household and business survey results have weakened
somewhat since the beginning of the year, but are still very
positive overall and consistent with the SNB’s baseline
scenario, which assumes that global economic growth will
remain above potential. The risks to this baseline scenario
are more to the downside. These concern – first and
foremost – political developments in certain countries, as
well as potential international tensions and protectionist
tendencies. The normalisation of monetary policy in the
advanced economies will also pose additional challenges.

In the US, inflation has almost reached the target level
set by the Federal Reserve. The latter therefore plans to
continue its normalisation of monetary policy. In the euro
area, by contrast, core inflation has continued to move
sideways in recent months. The European Central Bank
(ECB) therefore intends to pursue its asset purchase
programme until December 2018, and to leave its key rates

Table 2.1

baseline scenario for global economic developments
                                                                                                                                                          Scenario

                                                                                                                2014       2015      2016      2017       2018      2019

GDP, year-on-year change in percent
Global 1                                                                                                             3.6       3.5       3.3        3.9       4.0        3.9
US                                                                                                                   2.6       2.9       1.5        2.3       2.8        2.3
Euro area                                                                                                            1.4       2.0       1.8        2.6       2.1        1.6
Japan                                                                                                                0.3       1.4       1.0        1.7       1.0        1.1

Oil price in USD per barrel                                                                                         99.0      52.5     43.8        54.3      74.1     77.0

1 PPP-weighted (US, euro area, UK, Japan, China, South Korea, India, Brazil and Russia).

Sources: SNB, Thomson Reuters Datastream

                                                                                            Quarterly Bulletin 2 / 2018 June                   7
Chart 2.2 at their present levels at least through the summer of 2019.
Japan is also likely to maintain its highly expansionary
stock markets
monetary policy given the ongoing modest rate of inflation.
Index Index
150 45 The SNB’s forecasts for the global economy are based on
140 40 assumptions about oil prices and the EUR/USD exchange
130 35
rate. The SNB is assuming a price for Brent crude of
USD 77 per barrel, which is USD 8 higher than in March’s
120 30
baseline scenario (cf. table 2.1), and an exchange rate of
110 25
USD 1.19 to the euro, compared with USD 1.23 in March.
100 20 Both correspond to the 20-day average when the
90 15 current baseline scenario was drawn up.
80 10
70 5 INTERNATIONAL FINANCIAL AND
2014 2015 2016 2017 2018
COMMODITY MARKETS
MSCI World (lhs; beginning of period = 100)
Sentiment on the international financial markets has
Implied volatility (VIX) (rhs)
remained dominated by turbulence since the monetary
Source: Thomson Reuters Datastream
policy assessment in mid-March 2018. Stock markets
struggled at times with political uncertainties and
protectionist tendencies, but recovered on the back of
Chart 2.3
the continued favourable growth outlook for the global
international long-term interest rates economy. In mid-June, the MSCI World Index was
10-year government instruments slightly above its mid-March level. The volatility of
US stocks as measured by option prices (VIX) – which
%
serves as a gauge of market uncertainty – declined,
3.5
following abrupt spikes in the first quarter (cf. chart 2.2).
3.0
2.5 In the US, yields on ten-year government bonds rose
2.0 temporarily to above 3.0% (cf. chart 2.3) as a result of
1.5 monetary policy tightening and rising inflation. Yields
1.0 in euro area member states presented a mixed picture
0.5
(cf. chart 2.4). In Italy, they increased considerably owing
to political uncertainty. They also rose in Europe’s
0.0
peripheral economies, while in Germany, they declined.
–0.5 In Japan, yields on ten-year government bonds remained
2014 2015 2016 2017 2018 close to the Bank of Japan’s target of 0%.
US Japan Germany
Source: Thomson Reuters Datastream
Chart 2.4
european long-term interest rates
10-year government instruments
%
7
6
5
4
3
2
1
0
–1
2014 2015 2016 2017 2018
Germany Italy Portugal
France Spain
Source: Thomson Reuters Datastream
8 Quarterly Bulletin 2 / 2018 JuneThe US dollar gained significantly in value on a trade- Chart 2.5
weighted basis, returning in mid-June to its year-back
level. It appreciated markedly against the euro. The exchange rates
Trade-weighted, beginning of period = 100
euro and the yen trended somewhat weaker on a trade-
weighted basis (cf. chart 2.5). Index
130
Oil prices rose substantially against a backdrop of higher 125
demand and tighter supply (cf. chart 2.6), and climbed 120
temporarily to USD 80 per barrel in the wake of the US’s 115
announcement to withdraw from the nuclear deal with Iran 110
and its threat of sanctions on importers of Iranian oil. 105
The ongoing crisis in Venezuela also contributed to higher 100
oil prices. Amid plans to increase the oil output in Russia 95
and Saudi Arabia, oil prices dropped again somewhat 90
recently. Cyclically sensitive prices of industrial metals 85
continued to trend upwards. 2014 2015 2016 2017 2018
USD JPY EUR GBP
UNITED STATES
Source: Thomson Reuters Datastream
In the US, economic growth remained robust and broad-
based at 2.2% in the first quarter of 2018 (cf. chart 2.7).
Chart 2.6
In addition, employment continued to increase in the past
few months, and the unemployment rate dropped further commodity prices
to 3.8% by May (cf. chart 2.10).
Index, beginning of period = 100 USD/barrel
The economic outlook for the US remains positive. 130 160
The latest indicators suggest ongoing sound economic 120 140
momentum – industrial output rose sharply in April. 110 120
Turnover in the retail sector as well as new orders for
100 100
capital goods also continued to develop favourably.
Furthermore, the SNB expects that fiscal policy in the 90 80
US will support the economy in the coming years. 80 60
The GDP forecast remains almost unchanged, with the
70 40
SNB anticipating growth of 2.8% for 2018 and 2.3%
for 2019 (cf. table 2.1). 60 20
2014 2015 2016 2017 2018
Annual consumer price inflation rose further between Commodities Oil: Brent (rhs)
February and May to 2.8% (cf. chart 2.11), this increase Industrial metals
being partly due to higher energy prices. Core inflation Source: Thomson Reuters Datastream
also climbed further, to 2.2% (cf. chart 2.12). The Federal
Reserve’s preferred price inflation measure, the personal
consumption expenditure (PCE) deflator, reached the Chart 2.7
US central bank’s target value of 2.0% in April; the core
PCE deflator also approached the target value. real gdp: advanced economies
Change from previous period
In light of the progress made with regard to inflation %
and on the labour market, the Federal Reserve increased 8
the target range for its policy rate in March and in June, 6
ultimately reaching 1.75 – 2.0% (cf. chart 2.13). Its plan is 4
to continue with the normalisation of monetary policy. 2
0
–2
–4
–6
–8
2014 2015 2016 2017 2018
US Japan Euro area
Source: Thomson Reuters Datastream
Quarterly Bulletin 2 / 2018 June 9Chart 2.8 EURO AREA
real gdp: emerging economies
The economy in the euro area lost some momentum at the
Change from previous period
beginning of 2018, due in part to temporary factors such
% % as strikes and the exceptionally cold weather. Following
15 7.5 on from strong growth in previous quarters, GDP
10 7.0
subsequently expanded in the first quarter by only 1.5%
(cf. chart 2.7). Although private consumption picked
5 6.5 up pace, exports and manufacturing receded for the first
time in quite a while. In Germany and France, the slowdown
0 6.0
was pronounced, whereas in Italy and Spain developments
–5 5.5 were stable. Meanwhile, the improvement in euro area
employment continued, and the unemployment rate declined
–10 5.0
further (cf. chart 2.10).
2014 2015 2016 2017 2018
India 1 Russia Underpinned by favourable financing conditions and
Brazil China 1 (rhs) sound income growth, economic activity in the next few
1 Seasonal adjustment: SNB quarters is likely to expand once again at a more robust
Sources: CEIC, Thomson Reuters Datastream
rate. The positive outlook nevertheless remains subject to
various risks, including political imponderables in Italy
as well as uncertainty over the protectionist tendencies
Chart 2.9
outside the euro area and the shape of future relations
purchasing managers’ indices between the EU and the UK. Overall, the SNB has left its
(manufacturing) growth forecasts for the euro area virtually unchanged.
However, owing to the muted growth at the beginning of
Index
the year, the forecast for 2018 is slightly lower than
62
three months ago at 2.1%. For 2019, by contrast, it is
60 marginally higher at 1.6% (cf. table 2.1).
58
56 Consumer price inflation in the euro area trended upwards
54 in recent months on the back of rising energy and food
52 prices, reaching 1.9% in May (cf. chart 2.11). Core inflation,
50
however, remained modest and continued to fluctuate
around 1.0% (cf. chart 2.12), as it has done over the last
48
few years. Medium-term inflation expectations derived
46 from financial market indicators showed scarcely any
2014 2015 2016 2017 2018 change, remaining below the ECB’s target level of just
US Japan Euro area China under 2%.
Source: Markit Economics Ltd 2009; all rights reserved
The ECB left its key rates unchanged in June. It plans to
continue its asset purchases of EUR 30 billion a month
Chart 2.10 until the end of September 2018, thereafter reducing this
to EUR 15 billion and ending the programme at the end
unemployment rates of the year. It also expects its key rates to remain at their
% present levels at least through the summer of 2019.
14
12
10
8
6
4
2
2009 2010 2011 2012 2013 2014 2015 2016 2017 2018
US Japan Euro area
Source: Thomson Reuters Datastream
10 Quarterly Bulletin 2 / 2018 JuneJAPAN Chart 2.11
consumer prices
In the wake of a massive snow storm in Japan, which
Year-on-year change
temporarily impaired domestic activity quite severely
at the beginning of the year, GDP receded by 0.6% %
in the first quarter, having registered robust growth for 4
eight consecutive quarters (cf. chart 2.7). Nonetheless,
the upswing in exports continued in the first quarter. 3
Employment also saw a further increase. In April,
2
unemployment stood at 2.5%, well below the estimated
natural rate of 3.5%. 1
The latest indicators suggest a rapid recovery of 0
growth. Solid global manufacturing and investment in
infrastructure and tourism in the run-up to the 2020 –1
Olympic Games in Tokyo will keep the Japanese economy 2014 2015 2016 2017 2018
on track in the coming quarters. Furthermore, new tax
US Japan Euro area China
incentives should encourage companies to significantly
Source: Thomson Reuters Datastream
increase wages, which is likely to lend support to private
consumption. The SNB expects GDP growth to slightly
exceed potential, forecasting 1.0% for 2018 and 1.1% for
Chart 2.12
2019 (cf. table 2.1).
core inflation rates 1
Despite favourable overall capacity utilisation, inflation Year-on-year change
momentum has been weak in recent months. Core inflation
%
thus remained modest at 0.1% in April (cf. chart 2.12).
4
The positive capacity utilisation coupled with the impact
of higher oil prices are likely to cause inflation to rise 3
further in the months to come. Meanwhile, the longer-term 2
inflation expectations derived from company surveys
trended sideways and remained significantly below the 1
Japanese central bank’s inflation target of 2%. Under 0
these conditions, the Bank of Japan is maintaining its
–1
expansionary monetary policy.
–2
CHINA 2014 2015 2016 2017 2018
US Japan Euro area China
In China, GDP growth of 7.1% in the first quarter
1 Excluding food and energy.
was stronger than in the previous quarter (cf. chart 2.8). Source: Thomson Reuters Datastream
Industrial activity, in particular, gained momentum,
while the services sector saw slightly weaker growth.
Strong export demand continued to support the economy.
The outlook for China essentially remains unchanged. The
purchasing managers’ indices still indicate sound business
performance (cf. chart 2.9). The phased tightening of
financial market regulations since the end of 2016 and the
rise in capital market interest rates over the course of 2017
have led to a further slowdown in credit growth, and this
is likely to curb activity in real estate and construction in
particular. Overall, economic momentum can still be
expected to wane somewhat over the course of the year.
For 2018, the SNB anticipates GDP growth of 6.6%,
which is in line with the Chinese government’s target.
Quarterly Bulletin 2 / 2018 June 11Chart 2.13 There has been little change in inflation momentum.
Core inflation has been at around 2% for over a year
official interest rates (cf. chart 2.12). The People’s Bank of China (PBC) left
% % its reference rate unchanged, but lowered the reserve
2.0 6.5 requirement ratio by 100 basis points in April. This move
is particularly intended to encourage lending to small
1.5 6.0 companies, which have had insufficient access to loans
1.0 5.5 in the past. At the same time, the PBC announced that
most of the freed-up liquidity would be removed from the
0.5 5.0 market via its medium-term lending facility, so as to
0.0 4.5
ensure that its monetary policy stance remains essentially
unchanged.
–0.5 4.0
2014 2015 2016 2017 2018 Brazil, India and Russia
US 1 Euro area 3
Japan 2 China 4 (rhs) The remaining emerging economies registered positive
1 Federal funds rate (upper limit of target range). 3 Main refinancing rate.
growth. In India, GDP strengthened further in the first
2 Call money target rate. 4 One-year lending rate. quarter (8.4%). In Russia and Brazil, there were growing
Source: Thomson Reuters Datastream
signs of recovery. In both countries, GDP grew above
potential in the first quarter, having been weak in the
previous quarter (cf. chart 2.8).
Chart 2.14
monetary base The economies of these countries are likely to firm up in
Relative to GDP the course of 2018. In India, economic policy is providing
positive stimuli. In particular, weak, quasi-governmental
%
credit institutions will be recapitalised and infrastructure
90
improved. GDP growth in 2018 is expected to be
80
considerably stronger year-on-year at around 7.5%. In
70 Brazil, although the easing of monetary policy is acting
60 as a growth driver, the recent currency depreciation does
50 entail risks. In Russia, private consumption is likely to
40 benefit from low unemployment and rising real incomes.
30
Moreover, the higher oil prices will encourage
investment activity in the energy industry.
20
10
2014 2015 2016 2017 2018
US Japan Euro area
Source: Thomson Reuters Datastream
12 Quarterly Bulletin 2 / 2018 June3 Chart 3.1
Economic developments real gdp
in Switzerland
% Index Q1 2010 = 100
6 115.0
4 112.5
2 110.0
The Swiss economy continued to recover as expected,
0 107.5
GDP once again grew faster than estimated potential in
the first quarter. On the output side, growth was driven
primarily by services, which gained momentum compared –2 105.0
with the previous quarters. 2014 2015 2016 2017 2018
Change from previous period Level (rhs)
Overall capacity utilisation has improved further on the
back of this favourable development, while unemployment Source: State Secretariat for Economic Affairs (SECO)
has also dropped lower still in recent months.
Chart 3.2
Leading indicators suggest that the economic recovery
will continue. The SNB expects GDP growth to remain snb business cycle index
at around 2% for 2018 and unemployment to decrease
further. Standardised
2
Output and demand 1
The SNB takes a wide range of information into account 0
when assessing the economic situation. According –1
to this information, the favourable economic momentum
continued in the first quarter. –2
–3
Robust GDP growth in the first quarter of 2018
According to a provisional estimate by the State –4
Secretariat for Economic Affairs (SECO), GDP growth –5
remained robust in the first quarter at 2.3% (cf. chart 3.1).
2009 2010 2011 2012 2013 2014 2015 2016 2017 2018
On the output side, growth was driven primarily by
services. Almost all key industries in the tertiary sector Source: SNB
contributed to this expansion, including trade, business-
related services, healthcare, and transportation and
communications. In manufacturing, meanwhile, there Chart 3.3
was only a moderate rise in value added, this following
strong growth in the previous quarters. manufacturing pmi and kof economic
barometer
On the expenditure side, too, growth proved broad-based. Index Index
With the exception of construction investment and 70 130
government consumption, all final demand components
65 120
showed increases. Equipment investment – the main
60 110
growth driver – more than recouped the decrease recorded
in the previous quarter. 55 100
50 90
45 80
40 70
35 60
30 50
09 10 11 12 13 14 15 16 17 18
PMI KOF Economic Barometer (rhs)
Sources: Credit Suisse, KOF Swiss Economic Institute
Quarterly Bulletin 2 / 2018 June 13Positive economic indicators The Business Cycle Index, calculated by the SNB and
In addition to GDP, other economic indicators are also offering a comprehensive overview of economic
pointing towards positive momentum. At the turn of the momentum, remained at an above-average level during
year, all composite economic indicators were at a very the entire first quarter (cf. chart 3.2). The purchasing
high level. Although they receded slightly in the months managers’ index (PMI) also stayed at a high level, while
that followed, they nevertheless remained consistent the KOF Economic Barometer approached its long-term
with a robust pace of growth. average (cf. chart 3.3).
Table 3.1
real gdp and components
Growth rates on previous period in percent, annualised
2014 2015 2016 2017 2016 2017 2018
Q2 Q3 Q4 Q1 Q2 Q3 Q4 Q1
Private consumption 1.3 1.8 1.5 1.2 0.8 1.2 3.1 0.4 0.5 1.3 0.7 1.5
Government consumption 2.2 1.2 1.6 1.0 1.7 0.9 1.4 0.4 0.3 1.6 2.2 – 1.3
Investment in fixed assets 3.0 2.2 3.1 3.1 1.5 4.2 – 0.3 6.6 3.4 3.5 – 1.6 8.4
Construction 3.2 1.6 0.9 2.0 – 2.3 5.6 – 2.2 3.9 3.3 0.2 4.3 – 1.7
Equipment 2.9 2.6 4.5 3.8 3.9 3.3 0.9 8.3 3.5 5.5 – 5.0 15.1
Domestic final demand 1.9 1.8 1.9 1.7 1.1 2.0 2.0 2.0 1.3 1.9 0.3 3.0
Change in inventories 1 – 0.5 – 0.3 – 1.9 – 0.9 – 3.9 5.6 – 5.3 – 6.5 7.7 – 7.1 8.9 – 0.1
Total exports 2 5.2 2.3 6.8 2.8 7.0 – 10.3 14.4 1.0 0.2 13.3 – 6.7 6.7
2
Goods 5.8 2.6 6.2 4.6 3.2 – 15.0 – 3.5 23.0 2.9 16.8 – 4.9 8.3
Goods excluding merchanting 2 4.0 0.7 6.6 5.3 4.5 4.0 – 7.3 15.4 8.8 4.6 7.1 3.2
Services 4.0 1.7 7.9 – 0.5 15.1 – 0.3 54.7 – 28.9 – 4.8 6.9 – 10.2 3.7
Total imports 2 3.3 3.2 4.7 2.3 – 0.7 2.8 10.8 – 11.3 17.0 – 2.8 7.0 9.2
Goods 2 1.7 0.0 4.4 3.7 2.8 1.1 – 2.3 – 4.1 24.5 – 3.9 21.6 12.3
Services 6.8 9.6 5.4 – 0.3 – 6.8 6.1 38.8 – 22.8 4.6 – 0.8 – 16.2 3.2
3
Net exports 1.3 – 0.1 1.6 0.5 3.9 – 6.6 3.0 5.4 – 7.0 8.3 – 6.7 – 0.4
GDP 2.4 1.2 1.4 1.1 1.1 0.8 – 0.5 0.7 1.9 3.0 2.5 2.3
1 Contribution to growth in percentage points (including statistical discrepancy).
2 Excluding valuables (non-monetary gold and other precious metals, precious stones and gems as well as works of art and antiques).
3 Contribution to growth in percentage points.
Source: SECO
14 Quarterly Bulletin 2 / 2018 JuneLABOUR MARKET Chart 3.4
unemployment rate
The moderate recovery in the labour market continued.
%
Ongoing decline in unemployment 6
The number of people registered as unemployed at the
regional employment offices continued to decrease. 5
Excluding seasonal fluctuations, a total of 115,000 people 4
were recorded as unemployed at the end of May, while
the seasonally adjusted unemployment rate published by 3
SECO stood at 2.6% (cf. chart 3.4). However, the decline
2
in unemployment in recent months is being overstated by
2009 2010 2011 2012 2013 2014 2015 2016 2017 2018
a statistical effect; this can partly be ascribed to technical
adjustments in the recording of unemployment figures. SECO, seasonally adjusted SECO
ILO, seasonally adjusted ILO
In addition, the Swiss Federal Statistical Office (SFSO) SECO: Unemployed registered with the regional employment offices, as a
percentage of the labour force according to the 2000 and 2010 censuses and
calculates unemployment figures in line with the the 2012 to 2014 structural surveys.
International Labour Organization (ILO) definition, based ILO: Unemployment rate based on International Labour Organization definition.
Sources: Swiss Federal Statistical Office (SFSO), SECO
on data provided by the Swiss Labour Force Survey (SLFS),
a household survey conducted quarterly. It includes
people who are unemployed (although looking for work)
Chart 3.5
but not registered, or no longer registered, with the
regional employment offices. The SFSO unemployment employed persons
rate calculated in accordance with the ILO definition
is therefore higher than the one published by SECO. % Thousands of persons
In the first quarter of 2018, the seasonally adjusted 3.0 5 100
unemployment rate amounted to 4.9%, which was below 2.5 5 000
the peak reached at the end of 2015. Unlike the SECO 2.0 4 900
unemployment rate, however, it did not post a further 1.5 4 800
decline over the last few quarters. 1.0 4 700
0.5 4 600
Higher growth in employment
0.0 4 500
The Employment Statistics (ES), which are also based
–0.5 4 400
on SLFS data, measure the number of employed persons
–1.0 4 300
on the household side. These statistics suggest that the
number of gainfully employed persons continued to rise –1.5 4 200
slightly in the first quarter (cf. chart 3.5). 09 10 11 12 13 14 15 16 17 18
Change from previous period Level (rhs)
The national job statistics, which are based on a survey Source: SFSO; seasonal adjustment: SNB
of firms, measure employment on the company side.
They thus complement the ES, especially with regard to
developments at industry level. According to these Chart 3.6
statistics, the number of full-time equivalent positions
registered noticeable, broad-based growth in the first full-time equivalent jobs
quarter (cf. chart 3.6). An increasing number of jobs Beginning of period = 100
were created, both in services and in manufacturing. Index
Construction also saw a rise in employment. 112.5
110.0
107.5
105.0
102.5
100.0
97.5
95.0
92.5
2009 2010 2011 2012 2013 2014 2015 2016 2017 2018
Total Construction
Manufacturing Services
Source: SFSO; seasonal adjustment: SNB
Quarterly Bulletin 2 / 2018 June 15Chart 3.7
CAPACITY UTILISATION
output gap
Output gap narrows further
%
The output gap, which is defined as the percentage
1.5
deviation of actual GDP from estimated aggregate
1.0 potential output, shows how well the production factors
0.5 in an economy are being utilised. The negative output
0.0
gap has narrowed further recently. Potential output as
estimated by means of a production function showed an
–0.5
output gap of – 0.2% for the first quarter, compared
–1.0 with – 0.4% in the previous quarter. Estimates using other
–1.5 methods to establish potential output (Hodrick-Prescott
–2.0
filter and multivariate filter) confirm that the gap has
narrowed considerably in recent quarters (cf. chart 3.7).
–2.5
2009 2010 2011 2012 2013 2014 2015 2016 2017 2018 Surveys suggest normal utilisation
Production function HP filter MV filter According to the KOF survey, utilisation of technical
Source: SNB capacity in manufacturing increased to 83.9% in the first
quarter. Owing to this increase, capacity utilisation in
manufacturing slightly exceeded its long-term average
(cf. chart 3.8). Machine utilisation in construction
Chart 3.8
recorded a significant rise, thus remaining above its long-
capacity utilisation in manufacturing term average (cf. chart 3.9). As for the different services
industries, the surveys point to an average level of
% utilisation. Overall, these indicators thus show
85 a somewhat more positive picture than GDP-based
84 measures of the output gap.
83
82
81
80
79
78
77
76
2009 2010 2011 2012 2013 2014 2015 2016 2017 2018
Capacity utilisation Long-term average
Source: KOF Swiss Economic Institute
Chart 3.9
capacity utilisation in construction
%
79
78
77
76
75
74
73
72
2009 2010 2011 2012 2013 2014 2015 2016 2017 2018
Capacity utilisation Long-term average
Source: KOF Swiss Economic Institute
16 Quarterly Bulletin 2 / 2018 JuneChart 3.10
OUTLOOK
manufacturing pmi abroad
The outlook for Switzerland remains positive overall. Export-weighted, 27 countries
While many leading indicators, such as the export- Index
weighted PMI abroad (cf. chart 3.10), have receded 60
somewhat since the beginning of the year, they
still suggest a continuation of the positive economic 55
momentum. The economic outlook thus remains
optimistic (cf. chart 3.11). In the labour market, too, 50
there are signs of further improvement (cf. chart 3.12).
45
The discussions conducted by the SNB delegates for
regional economic relations between mid-April and the 40
beginning of June likewise point to solid and sustained
35
economic momentum in the second quarter. In addition,
respondents are confident about the second half of the 2009 2010 2011 2012 2013 2014 2015 2016 2017 2018
year (cf. ‘Business cycle signals’, pp. 28 et seq.).
Sources: International Monetary Fund – Direction of Trade Statistics (IMF – DOTS),
SNB, Thomson Reuters Datastream
The SNB expects positive and broad-based economic
growth in Switzerland in the medium term, too. This
favourable outlook is based on a number of factors. First,
Chart 3.11
according to the baseline scenario (cf. chapter 2), global
economic developments are expected continue to economic outlook
stimulate the Swiss economy. Second, the exchange rate Next 6 months
situation has eased considerably year-on-year. Third,
Index Index
population growth is also likely boost demand. Fourth,
75 30
low interest rates are supporting growth.
50 20
For 2018, the SNB continues to expect GDP growth of 25 10
around 2%. Equipment investment and foreign trade, in 0 0
particular, are likely to remain dynamic. As usual, this –25 –10
forecast is subject to uncertainties, mostly in connection
–50 –20
with developments abroad (cf. chapter 2).
–75 –30
–100 –40
09 10 11 12 13 14 15 16 17 18
Financial market survey, CS-CFA
KOF, business situation in industry (rhs)
Sources: CFA Society Switzerland, Credit Suisse, KOF Swiss Economic Institute
Chart 3.12
employment leading indicators
Standardised
2.5
2.0
1.5
1.0
0.5
0.0
–0.5
–1.0
–1.5
–2.0
2014 2015 2016 2017 2018
PMI 1 KOF SFSO 2
1 Monthly figures.
2 Seasonal adjustment: SNB.
Sources: Credit Suisse, KOF Swiss Economic Institute, SFSO
Quarterly Bulletin 2 / 2018 June 174 CONSUMER PRICES
Prices and inflation Rise in annual inflation rate to 1%
The annual inflation rate as measured by the Swiss
expectations consumer price index (CPI) climbed in May 2018 to 1.0%,
the highest level since March 2011 (cf. table 1.1). The
driving force behind the rise were prices for oil products.
Despite accounting for only a small share in the CPI
basket of goods, their contribution to the annual inflation
rate is currently 0.5 percentage points (cf. chart 4.1).
Influenced by higher oil product prices, annual consumer High price inflation for oil products
price inflation rose further in the past few months. Core In April and May 2018, oil product prices rose month-on-
inflation rates remained largely unchanged, however, and month by 3.0% and 4.7% respectively. Their annual
are below the unadjusted annual rate. inflation thus climbed to 15.2%. Prices for other imported
goods and services increased year-on-year on a par with
Inflation expectations remain in the low positive range and the CPI.
are thus consistent with the objective of price stability,
which the SNB equates to a rise in consumer prices of less Unchanged inflation for domestic goods and services
than 2% per year. Annual inflation for domestic goods and services remained
very stable. In May 2018, it stood at 0.4%, the same level
as in the two previous months. Although prices of goods
saw a stronger increase than prices of services compared
with last year, the contributions made by both components
to inflation for domestic goods and services were almost
the same, owing to the lower weighting of goods
(cf. chart 4.2).
Table 4.1
swiss consumer price index and components
Year-on-year change in percent
2017 2017 2018 2018
Q2 Q3 Q4 Q1 March April May
Overall CPI 0.5 0.4 0.5 0.8 0.7 0.8 0.8 1.0
Domestic goods and services 0.3 0.3 0.4 0.4 0.3 0.4 0.4 0.4
Goods – 0.2 – 0.3 – 0.3 – 0.1 0.3 0.5 0.6 0.8
Services 0.5 0.4 0.6 0.5 0.3 0.4 0.3 0.3
Private services excluding housing rents 0.3 0.4 0.3 0.4 0.6 0.8 0.5 0.6
Housing rents 1.1 1.1 1.3 0.9 0.6 0.6 0.6 0.3
Public services – 0.1 – 0.4 0.1 0.1 – 0.9 – 0.9 – 0.8 – 0.8
Imported goods and services 1.2 0.6 0.8 2.0 1.9 2.0 2.1 2.7
Excluding oil products 0.2 – 0.1 0.2 1.3 1.5 1.5 1.3 1.0
Oil products 8.8 6.1 5.5 6.8 4.9 5.2 8.4 15.2
Sources: SFSO, SNB
18 Quarterly Bulletin 2 / 2018 JuneStable rents Chart 4.1
The data on housing rents are collected on a quarterly cpi: domestic and imported goods and
basis in February, May, August and November. Although services
rents rose marginally quarter-on-quarter in May 2018, Year-on-year change in CPI in percent. Contribution of individual
annual rent inflation fell to 0.3% owing to a base effect components, in percentage points.
(cf. chart 4.3). In May, the rent index stood at the same 1.0
level as three quarters ago. This stability is consistent with
the reference interest rate used for rent adjustments 0.5
based on mortgage rate fluctuations; the reference rate 0.0
has been unchanged at 1.5% since June 2017.
–0.5
Stable core inflation
–1.0
Core inflation rates have hardly changed since autumn
2017. The trimmed mean calculated by the SNB (TM15) –1.5
stood at 0.5% in May 2018, while the SFSO’s core 2014 2015 2016 2017 2018
inflation rate 1 (SFSO1) amounted to 0.4% (cf. chart 4.4). Total Imported, excluding oil products
Domestic Oil products
Core inflation rates are thus well below the annual CPI Sources: SFSO, SNB
inflation rate. The growing difference can be attributed
to the fact that the sharp rise in oil product prices had little
or no effect on core inflation.
Chart 4.2
Core inflation rates are based on the prices of a reduced cpi: domestic goods and services
basket of goods. When calculating SFSO1, energy and fuel Year-on-year change in domestic CPI in percent. Contribution of
as well as fresh and seasonal products are excluded. individual components, in percentage points.
TM15 excludes the products with the most extreme price
0.8
changes every month (15% at either end of the distribution
0.6
curve of annual rates of change in product prices).
0.4
0.2
PRODUCER AND IMPORT PRICES
0.0
Rise in producer and import price inflation –0.2
Annual inflation for producer and import prices rose further –0.4
over the past few months, registering 3.2% in May 2018. –0.6
A major contributor to this growth were energy prices. The –0.8
difference between import price inflation and producer 2014 2015 2016 2017 2018
price inflation continued to increase (cf. chart 4.5). Total domestic goods and services Goods
Services, excluding housing rents Housing rents
Sources: SFSO, SNB
Chart 4.3
housing rents
Year-on-year change
%
2.00
1.75
1.50
1.25
1.00
0.75
0.50
0.25
0.00
2014 2015 2016 2017 2018
Housing rents
Reference interest rate for mortgages
Sources: Federal Office for Housing (FOH), SFSO
Quarterly Bulletin 2 / 2018 June 19Chart 4.4 INFLATION EXPECTATIONS
core inflation rates
Year-on-year change Inflation expectations consistent with price stability
Surveys show that inflation expectations remain consistent
%
with the objective of price stability, which the SNB
1.0
equates to a rise in the CPI of less than 2% per year.
0.5
Survey figures largely unchanged
0.0 The quarterly survey of households conducted by SECO
shows that, in April 2018, 56% of respondents anticipated
–0.5 a rise in prices over the next twelve months (cf. chart 4.6),
37% expected prices to remain the same, while 7% expected
–1.0 them to go down. These proportions have changed only
marginally since the previous quarter.
–1.5
2014 2015 2016 2017 2018 Somewhat more than half of the analysts questioned
CPI TM15 SFSO1 in May 2018 for the joint monthly financial market survey
Sources: SFSO, SNB
by CFA Society Switzerland and Credit Suisse expected
inflation rates to rise in the next six months. All other
analysts anticipated unchanged inflation rates, i.e. none
of the respondents expected inflation rates to go down.
Chart 4.5
Analysts’ expectations have remained largely unchanged
producer and import prices since the beginning of the year.
Year-on-year change
The talks conducted in the second quarter by the SNB’s
%
delegates for regional economic relations with companies
7.5
from all sectors provide an indication of the expected
5.0
level of inflation. As in the previous quarter, company
2.5 representatives anticipated an annual inflation rate of
0.0 0.7% on average in the next six to twelve months.
–2.5
–5.0 Longer-term expectations slightly above
short-term expectations
–7.5
Longer-term inflation expectations were again slightly
–10.0
higher than short-term inflation expectations. In the
–12.5 second quarter – as in the previous quarter – company
2014 2015 2016 2017 2018 representatives interviewed by the SNB’s delegates
Total Producer prices Import prices put the rate of inflation in three to five years at 1.1%.
Source: SFSO
Chart 4.6
price expectations
Survey of households on expected movements in prices for coming
12 months
%
60
50
40
30
20
10
0
2014 2015 2016 2017 2018
Decrease Modest increase
Unchanged Strong increase
Sources: SECO, SNB
20 Quarterly Bulletin 2 / 2018 June5 Summary of monetary policy since
the last assessment
Monetary developments
Expansionary monetary policy remains unchanged
The SNB confirmed its expansionary monetary policy
stance at its assessment on 15 March 2018. It decided to
leave the target range for the three-month Libor
unchanged at between – 1.25% and – 0.25%. It also left
unchanged, at – 0.75%, the interest rate on sight deposits
At its monetary policy assessment of mid-March 2018, held by banks and other financial market participants
the SNB left its expansionary monetary policy unchanged. at the SNB which exceed a given threshold. Furthermore,
This means that, over the last three months, monetary the SNB reaffirmed that it will remain active in the
policy has continued to be based on the negative interest foreign exchange market as necessary, while taking the
rate on sight deposits held at the SNB and on the SNB’s overall currency situation into consideration.
willingness to intervene in the foreign exchange market as
necessary. The negative interest rate and the SNB’s willingness to
intervene in the foreign exchange market serve to ease
Money market interest rates remained at the level of the upward pressure on the Swiss franc. The SNB’s monetary
SNB’s negative interest rate, while confederation bond policy thus helps to stabilise price developments and
yields temporarily declined significantly. Share prices also support economic activity.
fell, influenced by the dispute between the US and its
trading partners, as well as uncertainty about the euro in Sight deposits at the SNB virtually unchanged
connection with the formation of a new government Since the monetary policy assessment of March 2018,
in Italy. total sight deposits held at the SNB have remained
virtually unchanged. In the week ending 15 June 2018 (last
The Swiss franc appreciated slightly against the euro, calendar week before the mid-June assessment), they
but weakened against the US dollar. Despite fluctuations, amounted to CHF 576.5 billion, only marginally higher
by mid-June the trade-weighted external value of the than in the last calendar week preceding the mid-March
franc was back at practically the same level as at the time 2018 assessment (CHF 575.9 billion). Between the
of the monetary policy assessment in March. assessments in mid-March and mid-June 2018, sight deposits
at the SNB averaged CHF 575.9 billion. Of this amount,
Overall, the Swiss franc is still highly valued. Developments CHF 468.7 billion was accounted for by the sight deposits
on the foreign exchange markets show that the situation of domestic banks and the remaining CHF 107.2 billion
remains fragile and that the franc continues to be perceived by other sight deposits.
as a safe haven in times of heightened uncertainty.
High level of banks’ surplus reserves
As in the previous quarter, the M3 monetary aggregate and Statutory minimum reserves averaged CHF 16.4 billion
bank loans have grown at a moderate pace. between 20 February and 19 May 2018. Overall, banks
exceeded the minimum reserve requirement by CHF 453.9
billion (previous period: CHF 458.4 billion). Banks’
surplus reserves have thus barely changed.
Quarterly Bulletin 2 / 2018 June 21Chart 5.1 MONEY AND CAPITAL MARKET INTEREST RATES
money market rates
Money market rates stable
% Since the monetary policy assessment in March 2018,
0.25 money market rates have consistently tracked close to the
0.00 interest rate on sight deposits held at the SNB, which
–0.25
has been set at – 0.75% since January 2015. The same goes
for both secured (SARON) and unsecured (three-month
–0.50
Libor) money market transactions (cf. chart 5.1).
–0.75
–1.00 Volatile long-term interest rates
–1.25 Capital market interest rates were subject to far greater
fluctuations than money market rates. At the end of May,
–1.50
the political uncertainty in Italy and the trade dispute
–1.75 between the US and its major trading partners pushed
2014 2015 2016 2017 2018 up prices for Confederation bonds, causing their yields
3M Libor Target range SARON to drop accordingly, in line with yields of foreign
Sources: Bloomberg, SIX Swiss Exchange Ltd, SNB
government bonds. Subsequently, for the first time since
January 2018, yields on ten-year Confederation bonds
slipped occasionally back into negative territory.
Chart 5.2
Flatter yield curve
term structure of confederation bonds The yield curve for Confederation bonds has flattened out
Years to maturity (hor. axis); Nelson-Siegel-Svensson method slightly since the monetary policy assessment in March
(cf. chart 5.2). In mid-June, yields on Confederation bonds
%
with maturities of less than ten years were trading in
0.6
negative territory.
0.4
0.2 Long-term real interest rates low
0.0 The estimated long-term real interest rate was at a low,
–0.2 positive level in mid-June 2018. Compared to March,
–0.4
it remained largely unchanged (cf. chart 5.3).
–0.6
The real interest rate estimate is based on the development
–0.8 of the ten-year yield on Confederation bonds and inflation
0 5 10 15 20 expectations for the same time horizon, estimated with
Mid-June 2018 Mid-December 2017 a vector autoregressive (VAR) model.
Mid-March 2018
Source: SNB
Chart 5.3
estimated real interest rate
10-year Confederation bonds
Inflation expectations estimated with VAR model
%
1.75
1.50
1.25
1.00
0.75
0.50
0.25
0.00
–0.25
2009 2010 2011 2012 2013 2014 2015 2016 2017 2018
Source: SNB
22 Quarterly Bulletin 2 / 2018 JuneEXCHANGE RATES Chart 5.4
exchange rates
Swiss franc stronger against euro and weaker
against US dollar 1.20
After the monetary policy assessment in March 2018, the
Swiss franc initially depreciated further against the euro, 1.15
thus continuing the downward trend that had commenced
in the second half of 2017. In mid-April, one euro cost 1.10
more than CHF 1.20, the highest value since the minimum
1.05
exchange rate was discontinued in January 2015. From
mid-May, however, the Swiss franc strengthened again 1.00
considerably against the euro. This appreciation reflected
the general weakness of the euro, which was being 0.95
driven by the political uncertainty in Italy. In mid-June,
one euro cost CHF 1.15, i.e. approximately 2 centimes 0.90
less than at the time of the monetary policy assessment Jan 18 Feb Mar Apr May Jun
in mid-March. USD in CHF EUR in CHF
Source: SNB
The US dollar has gained significantly in value against
most currencies since mid-March. In mid-June, it was
trading at CHF 1.00 to the dollar, thus costing roughly
Chart 5.5
5 centimes more.
nominal external value of swiss franc
Fluctuations in Swiss franc’s nominal trade-weighted December 2000 = 100
external value
Index
On a nominal trade-weighted basis, the Swiss franc has
155
fluctuated back and forth in recent months (cf. chart 5.5).
In mid-June it was back at roughly the same level as at 154
the time of the monetary policy assessments in December 153
2017 and March 2018. 152
151
Real external value of Swiss franc still at high level
150
In May 2018, the real trade-weighted exchange rate index
calculated by the SNB dropped to its lowest level since 149
July 2010 (cf. chart 5.6). The equivalent indices calculated 148
by the Bank for International Settlements (BIS) and the 147
International Monetary Fund (IMF) paint a similar picture.
Jan 18 Feb Mar Apr May Jun
The franc is thus still highly valued.
Source: SNB
Chart 5.6
real external value of swiss franc
December 2000 = 100
Index
135
130
125
120
115
110
105
100
95
2009 2010 2011 2012 2013 2014 2015 2016 2017 2018
SNB IMF BIS (61 countries)
Sources: Bank for International Settlements (BIS), IMF, SNB
Quarterly Bulletin 2 / 2018 June 23Chart 5.7 SHARE AND REAL ESTATE PRICES
share prices and volatility
Falling share prices
Index % Having reached an all-time high in January 2018,
9 500 30 the Swiss Market Index (SMI) lost considerable value
between the end of January and the end of March
9 250 25 (cf. chart 5.7). This drop was in line with developments in
the major share indices abroad and was driven primarily
9 000 20 by geopolitical risks as well as the trade dispute between
the US and its key trading partners. Although share prices
8 750 15 initially recovered again somewhat, they saw a renewed
decline in the second half of May. In mid-June, the SMI
8 500 10 was around 10% lower than at the start of the year.
8 250 5 Market uncertainty temporarily rises significantly
Jan 18 Feb Mar Apr May Jun The volatility index derived from options on SMI futures
SMI Volatility index of SMI (rhs) contracts is used to gauge uncertainty on the stock market.
Sources: Bloomberg, Thomson Reuters Datastream
After rising substantially in the first quarter, by mid-May
the index had dropped back down practically to its level at
the beginning of the year. It then edged up again towards
the end of May, inversely to the drop in share prices
Chart 5.8
(cf. chart 5.7).
selected spi sectors
1 January 2018 = 100 Movements in sectoral indices
Overall, the main sub-indices of the broader-based Swiss
Index
Performance Index (SPI) developed on parallel paths during
110
the first half of 2018. Shares in financials and industrials
105 have since performed somewhat better than the healthcare
and consumer goods sub-indices, which are dominated
100 by SPI heavyweights (cf. chart 5.8).
95
Slight rise in residential real estate prices
90 The available price indices for residential real estate rose
slightly in the first quarter of 2018, with prices for single-
85 family houses and privately owned apartments increasing
Jan 18 Feb Mar Apr May Jun more strongly than those for apartment buildings. The
Health care Financials transaction prices for all three segments are at a historically
Consumer goods Industrials high level (cf. chart 5.9).
Source: Thomson Reuters Datastream
Chart 5.9
housing transaction prices
Nominal (hedonic), beginning of period = 100
Index
160
150
140
130
120
110
100
90
2009 2010 2011 2012 2013 2014 2015 2016 2017 2018
Privately owned apartments (FPRE, IAZI, WP; average)
Single-family houses (FPRE, IAZI, WP; average)
Apartment buildings (WP)
Sources: Fahrländer Partner Raumentwicklung (FPRE), IAZI, Wüest Partner (WP)
24 Quarterly Bulletin 2 / 2018 JuneMONETARY AND CREDIT AGGREGATES Chart 5.10
monetary base
Monetary base largely unchanged
The monetary base, which consists of banknotes in CHF billions
circulation and sight deposits of domestic banks held at 600
the SNB, has remained largely stable since mid-2017, 500
averaging CHF 549.1 billion in May 2018 (cf. chart 5.10).
400
Sight deposits of domestic banks – similar to other sight 300
deposits held at the SNB – fluctuated slightly in this
period. Total sight deposits at the SNB nevertheless 200
remained practically unchanged. 100
Slower growth in broad monetary aggregates 0
Growth in the M1, M2 and M3 monetary aggregates has 2009 2010 2011 2012 2013 2014 2015 2016 2017 2018
slowed slightly since the beginning of 2018. In May 2018, Monetary base Sight deposits
M1 (cash in circulation, sight deposits and transaction Banknotes in circulation
accounts) was 5.9% above its year-back level, while M2 Source: SNB
(M1 plus savings deposits) was up by 3.2% and M3
(M2 plus time deposits) rose by 2.9% in the same period
(cf. table 5.1).
Chart 5.11
In the last decade, almost all components of the M3 monetary aggregates
monetary aggregate have grown significantly (cf. chart 5.11).
Time deposits are the only exception; they have decreased CHF billions
and, owing to the low interest rate differential with sight 1 200
deposits, now make up only a small part of M3. 1 000
800
Lending growth picks up slightly in first quarter
Growth in bank lending picked up slightly in the first 600
quarter of 2018. Bank loans grew 2.9% year-on-year, 400
compared to a 2.6% increase in the fourth quarter of 2017.
200
Both mortgage lending and other lending contributed
to the slight rise in the growth rate (cf. table 5.1). 0
2009 2010 2011 2012 2013 2014 2015 2016 2017 2018
Banks’ mortgage claims, which make up roughly 85% Currency in circulation Sight deposits
of all bank lending to domestic customers, were 2.8% Deposits in transaction accounts Savings deposits
above their year-back level in the first quarter of 2018. Time deposits M1 M2 M3
Having decreased by half between 2012 and 2015, the Source: SNB
rate of growth has since remained more or less stable
(cf. chart 5.12).
Chart 5.12
Demand for mortgages continues to be supported by the
low mortgage interest rates. Although these rates have mortgage claims and interest rates
edged up slightly in recent times, they still remain close
%
to their all-time low. The ten-year mortgage rate stood
6
at 1.8% in April 2018.
5
4
3
2
1
0
–1
2009 2010 2011 2012 2013 2014 2015 2016 2017 2018
Mortgage claims (year-on-year change) 3M Libor
10-year mortgage rate
Sources: Bloomberg, SNB
Quarterly Bulletin 2 / 2018 June 25Chart 5.13 In the first quarter of 2018, the volume of other loans
loans to households and companies was 3.4% above its year-back level. Amid considerable
fluctuations at times, the trend line for other loans has
CHF billions CHF billions remained flat since the onset of the financial and economic
800 300 crisis in 2008.
750 250
Lending growth by sector
700 200
Both households and non-financial companies have
650 150 benefited from the favourable financing conditions
600 100
in the last decade, as reflected by a steady rise in bank
loans extended to these two important customer groups
550 50 (cf. chart 5.13).
500 0
09 10 11 12 13 14 15 16 17 18 At the end of March 2018, loans to households recorded
a year-on-year increase of CHF 20.3 billion (2.7%) and
Households
Private companies, excluding financial sector (rhs)
loans to non-financial companies a rise of CHF 8.6 billion
Private companies in financial sector (rhs) (3.1%). Loans to financial companies, which exhibit
Source: SNB
greater volatility at a significantly lower volume, advanced
by CHF 3.6 billion (7.3%) compared to the previous year.
Table 5.1
monetary aggregates and bank loans
Year-on-year change in percent
2017 2017 2018 2018
Q2 Q3 Q4 Q1 March April May
M1 6.6 6.4 6.6 7.5 7.4 7.1 6.9 5.9
M2 4.2 4.1 4.4 4.4 4.1 3.9 3.7 3.2
M3 3.7 3.7 4.2 4.0 3.7 3.3 3.3 2.9
Bank loans, total 1, 3 2.6 2.5 2.6 2.6 2.9 3.2 3.4
Mortgage claims 1, 3 2.6 2.6 2.6 2.7 2.8 2.8 2.8
Households 2, 3 2.6 2.6 2.5 2.6 2.5 2.5 2.6
2, 3
Private companies 3.4 3.2 3.5 3.7 3.4 3.4 3.2
Other loans 1, 3 2.4 2.2 2.3 2.1 3.4 5.4 6.9
Secured 1, 3 4.9 5.0 4.6 2.1 3.1 5.0 9.6
Unsecured 1, 3 0.6 0.2 0.7 2.1 3.6 5.7 4.9
1 Monthly balance sheets (domestic bank offices, domestic positions, all currencies).
2 Credit volume statistics (domestic bank offices, domestic positions, all currencies).
3 Growth rates for the bank loans item and its components include information provided by banks on changes in their classification practices. Consequently, they may deviate
from growth rates published on the SNB’s data portal, data.snb.ch.
Source: SNB
26 Quarterly Bulletin 2 / 2018 JuneBusiness cycle signals
Results of the SNB company talks
Second quarter of 2018
Report submitted to the Governing Board of the Swiss National
Bank for its quarterly assessment.
The appraisals presented here are based on discussions between
the SNB’s delegates for regional economic relations and
company managers. A total of 244 company talks were conducted
between mid-April and the beginning of June.
Regions Delegates
Central Switzerland Walter Näf
Eastern Switzerland Urs Schönholzer
Fribourg/Vaud/Valais Aline Chabloz
Geneva/Jura/Neuchâtel Jean-Marc Falter
Italian-speaking Switzerland Fabio Bossi
Mittelland Roland Scheurer
Northwestern Switzerland Daniel Hanimann
Zurich Rita Kobel
28 Quarterly Bulletin 2 / 2018 JuneYou can also read