ICELAND SELECTED ISSUES - International Monetary Fund
←
→
Page content transcription
If your browser does not render page correctly, please read the page content below
IMF Country Report No. 18/319

                ICELAND
                SELECTED ISSUES
November 2018
                This paper on Iceland was prepared by a staff team of the International Monetary Fund
                as background documentation for the periodic consultation with the member country. It
                is based on the information available at the time it was completed on October 29, 2018.

                                 Copies of this report are available to the public from

                                  International Monetary Fund • Publication Services
                                        PO Box 92780 • Washington, D.C. 20090
                                   Telephone: (202) 623-7430 • Fax: (202) 623-7201
                                E-mail: publications@imf.org Web: http://www.imf.org
                                             Price: $18.00 per printed copy

                                        International Monetary Fund
                                              Washington, D.C.

                © 2018 International Monetary Fund
ICELAND
SELECTED ISSUES
October 29, 2018
Approved By Prepared by Chikako Baba, Ashok Vir Bhatia, Uwe Böwer,
European Department Sílvia Domit, and Morgan Maneely (all EUR),
Shakill Hassan (SPR), and Niall O'Hanlon (STA)
CONTENTS
ICELAND’S FISHERIES SECTOR—TAKING STOCK ___________________________________ 2
A. Iceland as a Fishing Nation _________________________________________________________2
B. Governance of Fishing Rights _______________________________________________________6
C. Fishing Outlays and Revenues ______________________________________________________7
D. Prospects and Sustainability ______________________________________________________ 10
E. Conclusions ______________________________________________________________________ 14
References ____________________________________________________________________________ 16
BOXES
1. Iceland and the Concept of the EEZ ________________________________________________6
2. Fisheries in a Game Theory Framework ___________________________________________ 15
INFLATION TARGETING IN ICELAND—THE ISSUE OF HOUSING COSTS __________ 18
A. The Issue _________________________________________________________________________ 18
B. Measurement Considerations ____________________________________________________ 19
C. International Comparison ________________________________________________________ 21
D. Considerations on the Choice of Inflation Target _________________________________ 22
E. Policy Implications ________________________________________________________________ 23
F. Conclusions ______________________________________________________________________ 25
References ____________________________________________________________________________ 26ICELAND
ICELAND’S FISHERIES SECTOR—TAKING STOCK1
Fishing and fish processing form a core sector of Iceland’s economy. Major developments in the
management of the sector have included the introduction of a catch limitation system in the 1980s
and a fishing fee in 2004, both of which continue to evolve. These policy measures have helped
improve environmental sustainability and, thereby, the sector’s medium-term prospects. Some fish
stocks, however, notably of several of the migratory species, remain under threat. Seeking coordinated
fishing agreements amongst coastal states therefore remains a high priority.
A. Iceland as a Fishing Nation
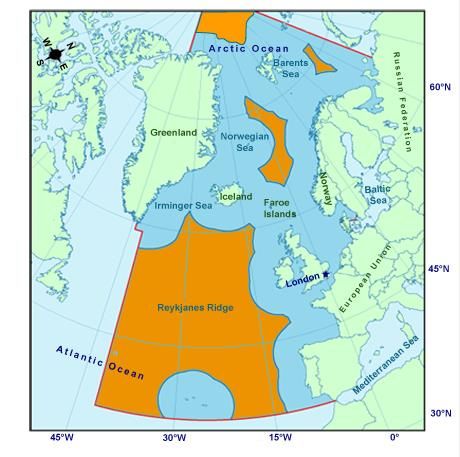
1. Iceland has the third largest fish catch in the northeast Atlantic, after Russia and
Norway. By volume, its total catch amounted to 1.1 million tonnes in 2016, exceeding those of
larger countries such as Spain and the United Kingdom. By value, Iceland is the fourth largest
exporter of marine products in the Northeast Atlantic Fisheries Convention Area.2 Besides Norway
and Russia, Iceland’s other main competitors in these fishing grounds are the ten EU states with
Atlantic coastlines as well as Greenland and the Faroe Islands.3
Northeast Atlantic Fish Catch by Value and Volume, 2016 1/ Northeast Atlantic Fisheries Convention Area
3500
3000 Denmark
Export value (€ million)
Norway Russia
2500
2000
Iceland
1500
1000 Faroe
Spain
500
Greenand UK
Catch volume (millions of tonnes)
0
-1 1 2 3 4 5
Sources: Eurostat; UN Food and Agriculture Organization (FAO); and
national statistical offices.
1/ Or most recent. Source: Northeast Atlantic Fisheries Commission.
1 Prepared by Uwe Böwer, Chikako Baba, and Ashok Vir Bhatia, with research support from Morgan Maneely (all EUR).
This paper would not have been possible without the Ministry of Industries and Innovation, the Central Bank of
Iceland, and the Marine and Freshwater Research Institute. Special thanks are given to Brynhildur Benediktsdóttir,
Ásgeir Daníelsson, Jóhann Gudmundsson, Arnór Snæbjörnsson, and Gudmundur Thórdarson for their inputs.
2 The Area spans the Atlantic and Arctic Oceans and their dependent seas north of 36° latitude and between 42° west
longitude and 51° east longitude, as well as north of 59° north latitude and between 44° west longitude and 42° west
longitude, excluding the Baltic Sea and the Mediterranean Sea.
3 The EU-10 comprises Belgium, Denmark, France, Germany, Ireland, the Netherlands, Portugal, Spain, Sweden, and
the United Kingdom. Greenland and the Faroe Islands are autonomous territories within Denmark, but not members
of the EU and not bound by its Common Fisheries Policy.
2 INTERNATIONAL MONETARY FUNDICELAND
2. The fisheries sector remains a major contributor to Iceland’s economy. Icelandic vessels
caught 3.2 tonnes of fish per Icelander in 2016, a per capita haul exceeded only by the Faroe Islands
and Greenland. The sector’s direct contributions to gross value added and employment were about
7 percent and 4 percent, respectively, in 2017. But, including large indirect benefits, one estimate
puts the total economic contribution of the so-called “ocean cluster” at some 25 percent of GDP and
up to 20 percent of the workforce in 2010 (Íslandsbanki, 2012). Marine products contributed
17 percent of goods and services exports by value in 2017, making them Iceland’s third-largest
export earner, after the tourism sector and aluminum and silicon.
Total Catch per Capita Gross Value Added of Fisheries
(Tons) (Percent of total gross value added)
9.1 18.4 16.6
10
6 13.3 2016 10 17
6 12 17
12
2016
2010 2010
9 9
4 4
6 6
2 2
3 3
0 0 0 0
Portugal
Den mark
Green land
Ireland
Iceland
Norway
Islands
coast al 1/
Spain
Den mark
Ireland
Green land
Iceland
Russia
Islands
Norway
coast al 1/
Other EU
Other EU
Faroe
Faroe
Sources: Eurostat; and FAO. Sources: Eurostat; and national statistical offices.
1/ Belgium, France, Germany, Netherlands, Portugal, Spain, Sweden, 1/ Belgium, France, Germany, Netherlands, Sweden, and United
and United Kingdom. Kingdom.
Employment in Fisheries Exports of Marine Products
(Percent of total employment) (Percent of goods exports)
18 18 100 100
15 15
2017 80 2017 80
12 12 2010
2010
60 60
9 9
6 6 40 40
3 3 20 20
0 0
0 0
Portugal
Iceland
coast al 1/
Greenland
Norway
Russia
Islands
Spain
Other EU
Faroe
Denmark
Iceland
Greenland
Norway
Russia
Islands
coast al 1/
Spain
Other EU
Faroe
Source: National statistical offices.
1/ France, Germany, Ireland, Netherlands, Sweden, and United Sources: National statistical offices; and UN Comtrade.
Kingdom. 1/ Germany, Ireland, Portugal, and United Kingdom.
3. Catch volumes have varied over time and by species type. The two broad categories of
species are the demersals, also referred to as groundfish—sea-bottom dwellers, including cod,
golden redfish, haddock, ling, tusk, and saithe—and the pelagics—migratory mid-depth shoal
swimmers, including blue whiting, capelin, herring, and mackerel. Some species, notably capelin,
have proven to be highly variable in stock size. Others have seen rising catch volumes, most notably
for mackerel, which is a recent arrival in Icelandic waters. Catch volumes of both pelagic and
demersal species dipped over the winter of 2016–17, partly owing to a fishermen’s strike. While the
INTERNATIONAL MONETARY FUND 3ICELAND
pelagic species make up a larger share of Iceland’s total catch by volume, the demersals dominate
by value. Cod is the single most valuable species and a consistent revenue generator.
Iceland Fish Catch by Volume Iceland Fish Catch by Value and Volume, 2016
(Thousands of tonnes) 25
45
2000 2000 Cod
20
40
Value (in percent of total ISK)
1600 Capelin 1600
15
1200 1200
Blue whiting 10 Capelin
800 800 Redfish
Mackerel Saithe
Herring
5
Mackerel
400 Other 400
Herring
Blue whiting
Cod
0
0 0
0 5 10 15 25
20 30
25
2000 2002 2004 2006 2008 2010 2012 2014 2016
Volume (in percent of total kg)
Source: Statistics Iceland. Source: Statistics Iceland.
2.95
4. The United Kingdom and Norway are Iceland’s largest export markets. By value, the
largest buyer is the United Kingdom, which takes a significant share of Iceland’s cod catch among
other items, followed by Spain and France. By volume, Iceland’s largest buyer is Norway, importing
mainly fishmeal, followed by the United
Kingdom and Denmark. Other markets include Iceland Fisheries Exports, 2016
Value (outer), Volume (inner)
destinations as diverse as Nigeria and Russia. Norway
While exports of demersals have remained Other
relatively unimpeded, exports of pelagics have United
faced new obstacles in recent years. Russia Kingdom
imposed a retaliatory import ban on
United
agricultural products including fish in response States
Denmark
to the EU’s economic sanctions on it (to which
Germany
Iceland is a party as a member of the European Spain
Economic Area). Nigeria proscribed importers Netherlands
of certain goods, including selected fish Source: Statistics Iceland.
China
France
products, from accessing foreign exchange on
its interbank market.
5. Major productivity improvements have been made in recent decades, amid significant
industry consolidation. Since the launch of the quota system in 1984, and especially after quota
shares were made transferable in 1991, fishing firms have had strong incentives to maximize value
added from their quotas by importing the most technologically advanced boats, including from
Norway and Turkey, scrapping older and less efficient equipment. The transferability of quotas has
led to consolidation in the most efficient operators. By 2016, the ten largest firms accounted for half
of the total allowable catch. Production value per employee has risen substantially over time.
4 INTERNATIONAL MONETARY FUNDICELAND
Iceland Fishing Quota Holders Iceland Fisheries Jobs and Value per Worker
(Percent share) (Thousands) (Millions of ISK)
10 largest quota holders Others 16 50
Thousands
100 100 Employment
14 45
Production value per employee (rhs)
90 90 40
80 80 12
50 35
53
70 70 10
68 30
60 60
8 25
50 50
6 20
40 40
15
30 30 4
47 50 10
20 20
32 2
10 10 5
0 0 0 0
1999 2004 2017 1997 1999 2001 2003 2005 2007 2009 2011 2013 2015
Source: Directorate of Fisheries. Source: Statistics Iceland.
6. As a major export earner, most of the sector’s financing is in foreign currency. Total
debt—comprising bank loans, typically secured by vessels, as well as export credit—is estimated at
about €2.1 billion as of end 2016, equivalent to 11 percent of GDP. Some 90 percent of this is owed
to domestic banks, with the remainder mostly from Nordic banks with marine sector experience.
Equity participation by the domestic pension funds is limited, and only one large fisheries firm is
listed. In recent years, the industry has increasingly financed equipment upgrades from retained
earnings. Icelandic banks’ outstanding loans to the sector accounted for 11 percent of total loans to
customers as of mid 2018, the third largest sectoral exposure after households and real estate. The
nonperforming ratio on these exposures was 7 percent in Q3 2018, up from 4 percent at end 2017.
7. Value added has been lifted by advances in fish processing. Iceland’s fishing companies
have invested in state-of-the-art technologies to link fishing with processing. Plants processing fresh
and frozen products operate in various parts of the country, focusing on groundfish, pelagics, or roe,
with the pelagic plants also processing fishmeal and oil. Large freezing vessels also process catches
on board, allowing them to land finished products. Most of the large fishing companies are vertically
integrated, covering fishing, processing, and marketing.
8. The sector has also benefited from improved air connectivity related to Iceland’s
tourism boom. This has supported the latest
trend in enhancing marine products’ value Number of Direct
Airline Destinations
added: exporting fresh fish that has never been
Summer 101
frozen. Since 2001, as tourist arrivals have soared, 65
the number of direct air connections in the peak
summer tourist season has nearly doubled while all-year 50
54
that of year-round connections has increased 27
more than threefold. This has allowed fishing 14
companies to dispatch ever greater volumes of
high-value unfrozen product, to a broader range 2011 2015 2018
of markets (IMF, 2017a; IMF 2017b). Source: Isavia.
9. A wide range of ancillary businesses has emerged. Products and activities range from
fishing gear to packaging and logistics, helping form Iceland’s wider “ocean cluster” (Íslandsbanki,
INTERNATIONAL MONETARY FUND 5ICELAND
2012). Technology has advanced to include assembly lines equipped with x-ray and waterjet
technologies, and innovation has blossomed, helping ensure that no part of the catch goes to waste.
Fishing-related biotechnology activities have found applications ranging from therapeutics to
cosmetics to transplantation (Iceland Ocean Cluster, 2014).
B. Governance of Fishing Rights
10. Iceland’s fishing grounds are defined by the global concept of the exclusive economic
zone (EEZ), and foreign participation in its fisheries sector is restricted (Box 1). Act No. 34/1991
on Investment by Nonresidents in Business Enterprises, as amended, restricts fishing operations in
Icelandic territorial waters and fish processing in Iceland to Icelandic citizens and Icelandic-
controlled legal entities generally with no more than 25 percent ownership by citizens of other
countries, including member states of the EU or the European Economic Area.
Box 1. Iceland and the Concept of the EEZ
The concept of the EEZ is enshrined in the UN Convention on the Law of the Sea. Amounting to a
maritime extension of sovereign territory, the EEZ extends to 200 nautical miles from a country’s coastal
baseline. According to the Convention, each coastal state enjoys sovereign rights over its EEZ for the
purposes of exploring, exploiting, conserving, and managing the natural resources therein. The Convention
notes that each state shall determine the allowable catch of the living resources in its EEZ, considering the
best scientific evidence and ensuring proper conservation and management measures to protect from
over-exploitation. States shall cooperate with other coastal states and with international organizations to
this end. States can give other states access to their EEZs while applying regulations relating to the licensing
of fishermen and vessels, catch quotas by species, and enforcement procedures. Besides fisheries, states
also have the freedom of navigation, overflight, the laying of submarine cables and pipelines, and the
construction of artificial islands and other installations and structures in their EEZs.
The establishment of the EEZ concept helped put to rest a long history of north Atlantic fishing
disputes. In the late 19th century, technological progress including steam power extended the range of
fishing vessels and resulted in repeated disputes between Icelandic and U.K. fishermen both seeking to
explore the rich fishing grounds surrounding Iceland. The Anglo-Danish Territorial Waters Agreement of
1901 set a 3 nautical mile limit to each country’s offshore zone (“the range of a cannon shot”). Disputes
erupted anew in 1952 when Iceland’s decision to extend its fishery limit to 4 nautical miles was met with a
ban on landing Icelandic fish in the United Kingdom, Iceland’s primary export market. After the Soviet
Union stepped in to purchase Icelandic fish, the U.K. recognized Iceland’s 4 nautical mile claim. Iceland
went on to extend its fishing limit to 12 nautical miles in 1958, 50 nautical miles in 1972, and 200 nautical
miles in 1975. These extensions led to ugly confrontations involving naval vessels, known as the Cod Wars.
Ultimately, international law came down in favor of Iceland’s position when, in 1982, the UN Convention on
the Law of the Sea formally adopted the universal 200 nautical mile limit.
11. Icelandic fishing is governed by a system of catch limitations and quotas. The Marine
and Freshwater Research Institute (MFRI), an official research body in Iceland, issues advice for about
35 marine species each year, and has developed harvest control rules for eight stocks, starting with
cod in 1995 (see Assessing and Ensuring Sustainability). These now include haddock, saithe, golden
redfish, capelin, Icelandic summer-spawning herring, ling, and tusk, potentially soon to be joined by
Atlantic wolffish, Greenland halibut, and plaice. Informed by the MFRI’s scientific advice, the minister
of fisheries sets species-specific total allowable catch (TAC) quantities for each fishing year, running
6 INTERNATIONAL MONETARY FUNDICELAND
September–August, currently for 25 species. Some 98 percent of Iceland’s total landed catch is
subject to TACs. Each vessel holds fixed shares of the TACs by species, known as Individual
Transferable Quota Shares (ITQSs), such that its annual catch quotas are a simple multiple of the
TACs and its ITQSs. There are also direct catch limitation measures, including permanent area
closures to conserve vulnerable habitats and temporary closures to protect spawns or juveniles.
12. Both the fixed ITQSs and the annually adjusted catch quotas are transferable, subject
to certain restrictions. They are also perfectly divisible, meaning any fraction of a given ITQS or
quota may be transferred. The main restrictions on transferability are between the category of small
boats, which fish with hand lines, and larger vessels that can use other fishing gear. The quotas of
the larger vessels can be transferred to the smaller boats, but not vice-versa. Industry concentration
is addressed under Act no. 116/2006 on Fisheries Management, as amended, which states that the
combined quota share of vessels owned by related firms or individuals may not exceed
12–35 percent, depending on the species, and 12 percent in the aggregate.
13. First distributed in 1984 based on each vessel’s past catch, the quotas led to a
significant reduction of total fleet capacity. Early on, there was some tendency to set TACs higher
than scientific advice and not all catches came under the TAC system., Since 2013, however, the
TACs for all national stocks have been set equal to scientific advice. Moreover, through refinements
in regulations, implementation errors in the system have been reduced sharply. Results included less
overfishing and higher productivity (Íslandsbanki, 2016). Internationally, Iceland’s quota system and
strict oversight have received positive recognition for enhancing efficiency, eliminating discards, and
ensuring full value extraction from catches (OECD, 2017).
14. Iceland also participates in numerous International cooperation arrangements.
In addition to various bilateral agreements, Iceland is a member of the Northeast Atlantic Fisheries
Commission, alongside Norway, Russia, the EU, and Denmark (on behalf of the Faroe Islands and
Greenland); the International Council for the Exploration of the Sea (ICES), an international body
based in Denmark that issues advice on the conservation and utilization of living marine resources
to competent authorities; the North Budgetary Support to Fisheries, 2015
Atlantic Fisheries Commission; the (Share of value of landings)
International Commission for the
Conservation of Atlantic Tuna; and the 80 General support to the sector 80
North Atlantic Marine Mammal Transfers to individual fisheries
Commission. 60 60
C. Fishing Outlays and
40 40
Revenues
20 20
15. Direct budget support to
Iceland’s fisheries sector is minimal,
unlike in many other fishing nations. 0 0
DNK
OECD
JP N
ARG
SWE
EST
TWN
ESP
PRT
COL
GBR
SVN
CAN
ISL
IRL
GRC
BEL
NOR
IDN
MEX
LVA
FRA
TUR
CRI
NZL
DEU
LTU
ITA
CHL
USA
NLD
AUS
KOR
CHN
Iceland does not provide direct
transfers to individual fisheries firms. Source: OECD.
INTERNATIONAL MONETARY FUND 7ICELAND
In contrast, several OECD countries apply decommissioning schemes tied to the reduction of
productive capacity, including Australia and Spain; Slovenia made a one-off payment using EU funds
in 2015. China’s individual transfers include fuel subsidies and vessel construction payments. General
support payments, in contrast, are paid to the sector as a whole. These typically include support for
infrastructure, marketing and promotion, community support, education and training, research and
development, and resource management (OECD, 2018). Iceland’s general support expenditure is
among the lowest of OECD countries and is fully recovered by its fishing fee.
16. Iceland also has a fishing fee. The vessel-specific ITQSs, which were allocated free of
charge when they were introduced, have risen in value over time. This gave rise to calls for a social
contribution from the sector, which profits from a natural resource regarded as a national treasure.
A general fee was introduced in 2004 to cover the costs of the public system of oversight and
research. A special fee was added in 2012 as a resource tax to vary with industry profits. This new fee
boosted revenue from the fisheries firms. The two fees were unified in 2015. In 2016, revenues from
the fishing fee stood at ISK 8½ billion, or about 0.3 percent of GDP—the budget for 2018 includes a
figure of ISK 10 billion, and the Fiscal Strategy Plan has ISK 7 billion per year for 2019–23. Including
corporate income tax and social security contributions, one estimate puts total revenue from the
fisheries firms at 4 percent of general government revenue in 2016 (Íslandsbanki, 2016).
Iceland Fishing Fee Revenue Iceland Revenue from Fisheries Firms
(Percent of GDP) (Percent of total revenue) 2016 (outer), 2005 (inner)
0.6
General fee 1.4
0.5 Special fee
1.2 Corporate
Fee (rhs)
income tax
0.4 1.0
0.8 Fishing fees
0.3
0.6
0.2
0.4 Social security
0.1 contribution
0.2 (estimated)
0.0 0.0
2004 2006 2008 2010 2012 2014 2016
Sources: Ministry of Industries and Innovation; and Ministry
of Finance. Source: Íslandsbanki.
17. The fee is based on industry profits. The fee for groundfish is set as the sum of 33 percent
of earnings before taxes (EBT) in fishing, 5 percent of EBT in salting, drying, and fresh fish
processing, and 78 percent of EBT in onshore freezing; the fee for pelagics is set as 33 percent of
EBT in fishing plus 25 percent of the sum of 22 percent of EBT in freezing and 100 percent of EBT in
fishmeal and oil production. Regarded as a tax, the fee is subject to strict rules on transparency,
predictability, and parliamentary decision making, including a requirement that, once it is set for a
given year, it must remain unaltered for 12 months. One result is that, by necessity, the fee is based
on EBT with a 20 month lag from the close of accounts to the point where it goes into effect—the
fee for the 2017/18 fishing year, for example, was set in early 2017, before the fisheries firms’
audited accounts for 2016 were available, and was therefore based on EBT for calendar year 2015.
8 INTERNATIONAL MONETARY FUNDICELAND
18. The fee system seeks to guard against profit shifting. As the fee started to rise in 2008,
the profit share of fish processing expanded steadily (Gunnlaugsson and others, 2018). This gave rise
to concerns that vertically integrated fisheries firms were artificially lowering landing prices to shift
profits from fishing to processing, for tax efficiency. In vertically integrated fisheries firms, landing
prices are often prices for off-market sales from vessels to onshore processing or marketing units
within the same group. These prices are loosely linked to market prices, which in turn reflect
international prices, but tend to be some 10–15 percent lower. The decision, in effect since 2012, to
include profits from fish processing in the fee basis sought to address the transfer-pricing problem.
19. The overall fee is allocated across fish species to generate a specific, króna-
denominated fee per unit weight, species by species. Traditionally, this was done based on
average landing prices, using a system of “cod equivalences”: a species with a per-kilogram landing
price equal to, say, 60 percent of that on cod had a cod equivalence of 0.6, and a fee equal to
0.6 times the per-kilogram fee on cod. Since 2015, the minister of fisheries has notionally also taken
into account the cost of catching each species, and thus the species-specific profitability, although in
practice the allocation remains closely linked to landing prices. The allocation is based on price and
cost information with a 4 month lag—allocating the fee for the 2017/18 fishing year, for example,
used landing prices and costs for the 12 month period ending in April 2017.
20. The fee system is constantly evolving. Between 2012 and 2015, the fishing fee was
reformed every year. With the current fee legislation expiring at end 2018, the government has put a
bill to parliament proposing to adjust the system of calculation. Specific proposals include:
• Removing the exchange rate and inflation adjustments that are now factored into the
calculation of the fee base. Such adjustments are viewed as making the fee excessively volatile,
linking it not only to catch volumes and prices but also to the exchange rate.
• Shortening the lag between fee setting and the EBT upon which it is based. This would be
done by shifting the fee to a calendar year basis—thus the fee for calendar year 2019, for
example, would be based on audited financial statements for 2017, a lag of 12 months.
• Removing EBTs of the fish processing sector from the fee base. Here the argument is that
fishing, not processing, is the activity that should be subject to natural resource taxation, and
that the ultimate safeguard against transfer pricing is the time-honored industry practice of
linking vessel crew remuneration to landed value—such that integrated fisheries groups that set
excessively low landing prices will risk losing their most talented seamen.4
21. If approved, these changes would reduce the fee in the first year, 2019, by
leapfrogging the highly profitable year of 2016 from the base calculation. Much of those
profits, however, were from the exchange rate adjustments to the calculated EBT—the appreciation
of the króna in 2015–16 meant lower earnings in local currency terms but a substantial “revenue”
from exchange rate effects on the sector’s mostly foreign currency-denominated debt. Preparatory
discussions for the bill had also considered other options such as the government auctioning fishing
rights to collect resource rents, but these were not included in the final legislative proposals.
4 Stevedores and most other onshore personnel receive fixed hourly wages.
INTERNATIONAL MONETARY FUND 9ICELAND
D. Prospects and Sustainability
22. Iceland’s policy framework seeks to ensure sustainability. The authorities view the UN
Convention on the Law of the Sea and the principle of sustainable development as adopted at the
1992 UN Conference on Environment and Development as central elements of their fisheries policy.
Their overarching policy is laid out in the 2007 Statement on Responsible Fisheries in Iceland,
sponsored by the government, the MFRI, and the Fisheries Association. The catch limitation system
is central, supported by strict monitoring and enforcement to ensure that each vessel’s catch
remains within its quotas—all catch is brought ashore and measured. 5 As noted, the TAC is
determined, species by species, based on scientific advice issued by the MFRI—although the
Statement also indicates that social and economic factors play a role. Thus, the TAC has at times
exceeded MFRI advice, although this has not been the case last 5–6 years.
23. Although the framework includes provisions for Fisheries by Vessel Type, 2016
area restrictions by type of gear, it has generally
resulted in a shift to larger vessels, with potential Open &
environmental implications. Demersals are caught mainly decked Trawlers
vessels
by longlining or trawling the sea floor—where trawling is
economically more efficient due to its scale effects but also
has the potential to significantly damage vulnerable marine
ecosystems on the seafloor, and where one argument
against longlining is that it is less good at discriminating by
species than trawls. Within each vessel type, smaller vessels
are generally not as efficient, although some argue they
are more protective to the environment as most only fish
for demersals with handline. Pelagics are usually caught by
large vessels using midwater trawls or purse seines.
Overall, 44 trawlers catch a larger volume of fish than all Source: Statistics Iceland.
1,578 other vessels combined.
24. Assessing fishing sustainability is not straightforward, with several well publicized
methods subject to serious scientific critiques:
• One method is the catch-based approach used by Yale University’s Environmental
Performance Index. This was launched at the UN to help assess the Sustainable Development
Goals. The method used for calculating the sub-index for fishing assumes that if, after a peak,
the catch of a fish stock falls to 10–50 percent of its peak catch, then the stock is overexploited;
if it falls to below 10 percent, the stock is collapsed (Wendling and others, 2018). On this
measure, Iceland’s catch of overexploited or collapsed stocks has risen sharply, while
5 Discards are banned. All bycatch, including of noncommercial species such as seabirds, must be recorded in
logbooks, usually in electronic format. Small or damaged fish weighing up to 5 percent of the demersal catch are set
aside and not counted against quotas. This fish is sold at auction and most of the revenue flows to a public fund.
10 INTERNATIONAL MONETARY FUNDICELAND
Greenland’s and Norway’s shares have fallen in recent decades.6 Critics point out, however, that
omitting stock size from the evaluation is a fatal flaw. If managers decide to reduce catches to
rebuild the stock, then the stock can be deemed “overexploited” even if it is close to BMSY (the
spawning stock biomass that results from fishing for a long time at FMSY (the fishing mortality
consistent with achieving maximum sustainable yield), or “collapsed” even if it is well above Blim
(the limit reference point for spawning biomass).
2.45
Iceland Fish Catch by Stock Status Catch of Overexploited and Collapsed Fish Stock
(Thousands of tonnes) (Percent of total national catch)
Catch of overexploited and collapsed stock
80 Iceland 80
2.0 2.0 Norway
2014:
Faroe Islands
58% Greenland
1.5 1.5 60 60
1.0 1.0 40 40
Catch of rebuilding, developing,
0.5 0.5 20 20
and exploited stock
0.0 0.0 0 0
1950 1966 1982 1998 2014 1980 1988 1996 2004 2012
Sources: University of British Columbia; and Yale University.
• Another method looks at ecosystems from the perspective of the food chain. This method,
by focusing on the trophic level of each species (its position in a food web), seeks to detect
whether there is “fishing down the food chain,” implying that larger, high-level species have
already been exploited and smaller, lower-level species are increasingly targeted, with a negative
impact on ecosystem health (Wendling and
others, 2018). To better isolate the effect of Iceland Fish Catch and Ecosystem Health 1/
(Thousands of tonnes) (Change in trophic index)
fishing intensity on biodiversity, a region- -0.018
2.1 Ecosystem health
based marine trophic index has been deteriorating
-0.013
developed which accounts for changes in 1.7
-0.008
trophic levels caused by geographic -0.003
expansions of fisheries (Kleisner and others, 1.3 0.003
2014). Iceland’s trophic index has 0.008
0.9 Catch (lhs)
fluctuated over the post-war period, with Ecosystem health
0.013
improving
ecosystem improvements since the mid 0.5 0.018
2000s. Critics, however, find no link 1950 1960 1970 1980 1990 2000 2010
between trophic level and fish value—some Source: University of British Columbia.
1/ Ecosystem health measured as ratio of change in 5 yr. to
of the most prized quarry are prawns, 10 yr. moving avg. of marine trophic index.
crabs, scallops, and lobsters, all relatively
6 Catch data are compiled across countries by SeaAroundUs, a research project at the University of British Columbia’s
Institute for Oceans and Fisheries. The data are based on FAO landings statistics (FAO, 2004) and supplemented by
estimations to fill data gaps. For Icelandic data, see also Valtýsson (2014).
INTERNATIONAL MONETARY FUND 11ICELAND
low trophic level species, and even among higher trophic level fish there is no correlation
between trophic level and value (Sethi and others, 2010).
25. Iceland’s view is that evaluation methods based on virtual population analysis and
sampling are preferred. Both the MFRI and ICES focus on this approach in determining their
recommendations on catch sizes for groundfish. The MFRI provides the government with scientific
advice on the sustainable use and protection of the environment and the ecosystem, including
sustainable exploitation levels for the main fish stocks. The ICES develops advice at the north
Atlantic regional level, based on the work of its large network of marine scientists. These analyses
look at sustainability from multiple ecosystem angles. Each year, the MFRI’s recommendations for
the main Icelandic commercial species, including its multi-annual harvest control rules, are peer
reviewed by the advisory committee of the ICES to ensure consistency.
26. The MFRI uses multiple methodologies. For long-lifespan demersal species, it mainly relies
on data on catch by age, weight, and gender, analyzing samples from the catch all year round and
reviewing logbook data on all hauls by trawlers and other gear. Twice a year, the MFRI conducts
special research projects for estimating changes in catchability of demersal species by sampling fish
in the same fishing areas with the same fishing methods. Fishing areas are also cross checked by a
survey of boat captains. The information from all these sources are combined to obtain estimates of
individual year-class and stock size. For pelagics, especially the short-lifespan species such as capelin
and blue whiting, stocks have to be estimated using sonar. In some cases, neither virtual population
analysis nor acoustic measurements are possible and data on catch per unit effort are used.
27. Such methods suggest Iceland‘s all-important cod stock is well above its target size,
having overcome past episodes of overfishing. Cod, as Iceland’s most profitable species, is also
its most-fished demersal in terms of both volume and value—and has seen bouts of overfishing.
Most recently, in a “calculated risk” to help mitigate the effects of Iceland’s financial crisis, the TAC
for cod was raised to exceed the MFRI’s scientific advice by around 23 percent in 2008/09, while
actual catches exceeded those recommendations by more than 30 percent. Since 2013, however,
quotas have matched recommendations, and catches have been within the permitted 5 percent
deviation from quota. Stocks of cod and most other demersal species have recovered.
Iceland Cod Advice and Catch Iceland Cod Stock
(Thousands of tonnes) (Percent of MFRI advice) (Thousand of tonnes)
280 42 1000 1000
Advice Spawning-stock biomass
260 Catch 36 900 900
Biomass target
Overfishing ratio (rhs) 800 800
240 30
700 700
220 24
600 600
200 18
500 500
180 12 400 400
160 6 300 300
140 0 200 200
120 -6 100 100
05/06
06/07
07/08
08/09
09/10
10/11
11/12
12/13
13/14
14/15
15/16
16/17
0 0
1955 1965 1975 1985 1995 2005 2015
Sources: MFRI; and Statistics Iceland. Source: FishSource.
12 INTERNATIONAL MONETARY FUNDICELAND
28. Overall, Iceland’s efforts have been broadly successful in ensuring sustainable fishing
in its waters, boding well for the future. The policy framework and its strict application have
resulted in a significant decrease in catch volumes relative to the period 1950–90, but also much
larger stock sizes, leading to higher catch per unit effort—fishing has become more profitable. The
most recent ICES ecosystem overview for Iceland finds that (i) the main commercial stocks are close
to their largest sizes since 1985; (ii) effort in terms of hours trawled has plummeted from around
500,000 hours in 1992 to 150,000 in 2015; and (iii) the trawling footprint has shrunk concomitantly.
29. Looking beyond Icelandic waters, however, international cooperation failure has bred
severe overfishing, most notably for mackerel. Potentially related to global warming, the
migration pattern of this species began to change around 2007, when it first appeared in large
numbers in the north Atlantic. With the drivers and permanence of this phenomenon in dispute, the
coastal states have failed to achieve agreement thus far (Spijkers and Boonstra, 2017). Initially,
Iceland was not recognized as a coastal state for mackerel; in 2010, Iceland was granted that status,
but disagreements remained around its rightful share (as well those of Russia and Greenland).
Pending agreement, Iceland took unilateral steps to set its own quotas for mackerel, among other
pelagic species. At the regional level, however, total mackerel catches by all countries fishing in the
north Atlantic started to exceed ICES advice by as much as 72 percent.
Northeast Atlantic Mackerel Catch Northeast Atlantic Mackerel Advice and Catch
(Thousands of tonnes) (Thousands of tonnes) (Percent of ICES advice)
1400 1400 1500 80
Other Advice
1200 1200 Overfishing 70
Faroe Islands 1300
1000 1000 Overfishing ratio (rhs) 60
Iceland
800 Russia 800 1100 50
600 600 40
Norway 900
400 400 30
UK
200 200 700 20
EU-8 1/
10
0 0 500
2001 2003 2005 2007 2009 2011 2013 2015 2017 0
Source: ICES. 300 -10
1/ EU-8 comprise Denmark, France, Germany, Ireland, 2001 2003 2005 2007 2009 2011 2013 2015 2017
Netherlands, Portugal, Spain, Sweden. Source: ICES.
30. Other migratory species have faced similar problems. Landings of pelagic fish, notably
herring, capelin, mackerel, and blue whiting, account for over half of Iceland’s total annual catch by
volume and about one-fifth by value. All these species have experienced episodes of overfishing and
stock collapse. Capelin is the only straddling stock in the north Atlantic subject to a regional
agreement. That agreement, between Iceland, Greenland, and Norway, grants Iceland an 80 percent
share in the regional TAC. Mirroring the plight of mackerel, the aggregate blue whiting catch was
67 percent above ICES advice in 2015, and 11 percent above the sum of the unilateral quotas of the
coastal states. Herring has lacked an accord since 2013, and blue whiting since 2014. Much effort
has been expended in seeking to find agreement, but with no success thus far.
INTERNATIONAL MONETARY FUND 13ICELAND
Northeast Atlantic Blue Whiting Catch Northeast Atlantic Blue Whiting Advice and Catch
(Thousands of tonnes) (Thousands of tonnes) (Percent of ICES advice)
2500 2500 2500 350
Faroe Islands Advice 300
2000 Other 2000 Overfishing
2000 250
Iceland Overfishing ratio (rhs)
200
1500 Russia 1500 1500
150
1000 1000 100
Norway UK 1000
50
500 500 500 0
EU-10 1/ -50
0 0 0 -100
2001 2003 2005 2007 2009 2011 2013 2015 2017 2001 2003 2005 2007 2009 2011 2013 2015 2017
Source: ICES. Source: ICES.
1/ EU-10 comprise Denmark, France, Germany, Ireland, Note: The overfishing for 2002 is calculated against the
Lithuania, Netherlands, Poland, Portugal, Spain, and Sweden. average advice for 2001-03.
31. The challenges that make the needed international agreements elusive could be
further complicated by Brexit (Box 2). Fisheries featured prominently in the pro-Brexit campaign
leading up to the U.K. referendum, with many in the U.K. fisheries sector declaring the vote to leave
a great opportunity for the sector (House of Lords, 2016). Brexit brings a U.K. departure from the
London Fisheries Convention and, most likely, from the EU’s Common Fisheries Policy. After Brexit,
the United Kingdom is likely to negotiate its own fishing agreements with neighboring coastal states
(Phillipson and Symes, 2018). As such negotiations take place, the very existence of one additional,
autonomous player will further complicate the discussion.
E. Conclusions
32. Fisheries remain at the heart of Iceland’s economy. Despite trend reductions in catch
volumes and the emergence of other economic sectors, fisheries are still a core element of Iceland’s
production, employment, and export chain. Productivity has been lifted by the catch limitation
system, which has shifted the emphasis from volume to value added. Transportation synergies with
tourism have facilitated growing exports of unfrozen product. Innovative ancillary businesses have
emerged to form the wider ocean cluster, with further contributions to GDP and employment.
33. At home, efforts to ensure sustainability have generally been successful, boding well
for the future. Iceland’s fisheries framework and its rigorous application have resulted in much
larger stock sizes, supporting catchability and profitability, and have slashed waste. International
studies find the main commercial stocks to be healthy, effort per unit catch to have fallen, and the
trawling footprint to have shrunk. Efforts to fine-tune the fee system are generally welcome, and
further enhancements to the catch limitation system should be seen as a continuous process.
34. Looking beyond Icelandic waters, however, there are serious collective action
problems in the northeast Atlantic. Several pelagic species remain threatened, leaving
environmental sustainability as an important, pressing, and shared challenge. Protecting the
transboundary fish stock requires better international cooperation, which has proven elusive thus
far. Icelandic efforts in this regard have been energetic, and should remain so. But eliminating
overfishing of the migratory species will require good faith by all parties.
14 INTERNATIONAL MONETARY FUNDICELAND
Box 2. Fisheries in a Game Theory Framework
The management of shared fish stocks offers a prime application for game theory. With a
transboundary fish stock, the harvesting decisions of one country impact the possible harvest of another
country, as well as the long-term viability of the stock available for future harvesting. One country will thus
try to incorporate the expected reaction of the other in its decision making process, and vice versa. This
process can be cooperative, leading to a maximized payoff for all participants in terms of fishing stock
sustainability, or can be competitive and result in free riding and overfishing, essentially the “tragedy of the
commons” (Hardin, 1968). Game theory is often used to analyze this type of challenge. Schelling and
Aumann were awarded the Nobel Prize in 2005 for addressing the question, “Why do some groups of […]
countries succeed in promoting cooperation while others suffer from conflict?” (Royal Swedish Academy of
Sciences, 2005). Since the seminal work of Munro (1979), game theory has been applied to better
understand strategic interactions in fisheries management, as reviewed by Bailey and others (2010).
Competitive harvesting can lead to severe damage to the fishing stock. Non-cooperative game theory
shows that rational choices by individual players can result in a suboptimal result, as illustrated by the well
known prisoners’ dilemma—a situation where two separately detained criminals rationally choose to betray
each other, although both would be better off by jointly staying silent. Similarly, fishing nations tend to
deviate from attempted cooperation if commitment cannot be enforced and the payoff from free riding
exceeds that of cooperation (Miller and others, 2013). Hannesson (2013) shows that, with two players of
different size and fixed fish migration patterns (which is not the case in practice), the minor player has no
incentive to leave any fish behind, so the conservation burden falls entirely on the major player; with more
than two players, the likelihood of complete extinction of the species increases further. Jensen and others
(2015) note that, indeed, all players in the mackerel dispute have an incentive to act non-cooperatively, and
that the observed limited amount of cooperation between some of the northeast Atlantic coastal states
cannot be explained by the model; moreover, Iceland is very much the “new entrant” for this species.
Regional fisheries cooperation tends to be beneficial but fragile. Using a coalition-formation model,
Pintassilgo and others (2010) analyze the stability of regional fisheries management organizations such as
the Northeast Atlantic Fisheries Commission. They find that a larger number of competing fishing states, as
well as higher harvesting efficiency, tends to increase the gains from cooperation but weigh on the stability
of the network, as members cannot exclude non-members from harvesting anyway, thereby free riding on
the organization’s efforts to keep the stock sustainable. Toumasatos and Steinshamn (2018) show that the
United Kingdom becoming a standalone player in the mackerel dispute adds uncertainty as outsiders are
better off free riding despite the positive effects of cooperation on profits and stock preservation. One of
their stable constellations is a coalition of Iceland and the United Kingdom acting against the existing EU–
Norway–Faroe Islands coalition. Hence, new entrants, be it on the back of altered fish migration patterns in
Icelandic waters, or caused by political choices such as Brexit, have a destabilizing effect on the overall
system and put further pressure on the mackerel stock.
The destructive potential of competitive harvesting highlights the need to facilitate cooperation.
Additional incentives may be required to avoid a catch-22 situation, some of which can be incorporated
into the game theory framework while others go beyond. Models can be extended to feature side
payments which broaden the scope of negotiations and compensate actors that might otherwise act non-
cooperatively (Bailey and others, 2010). Coalitions that tilt the relative size of actors, as well as more specific
assumptions on stock-dependent migration patterns and cost asymmetry, can increase the potential gains
from cooperation (Hannesson, 2013; Pintassilgo and others, 2010). The threat of total extinction can also
prevent a destructive result, formalized within the Folk Theorem, according to which a strategy threatening
to revert to a Nash equilibrium could support a cooperative outcome (Hannesson, 2013). Better information
about the damages of competitive harvesting, potentially coupled with prior experience of near-extinction,
can change the expected payoffs from cooperation (Miller and others, 2013). Beyond the realm of game
theory, political economy factors can influence harvesting choices in both directions. Lobbying from small
yet effective pressure groups such as fisheries associations can push national choices towards overfishing
while binding international commitments, such as highly valued trade agreements in other sectors, as
between the EU and Norway, can induce discipline (Toumasatos and Steinshamn, 2018).
INTERNATIONAL MONETARY FUND 15ICELAND
References
Bailey, Megan, U. Rashid Sumaila, and Marko Lindroos, 2010, “Application of Game Theory to
Fisheries Over Three Decades,” Fisheries Research 102, 1–8.
Food and Agriculture Organization of the United Nations (FAO), 2004, Handbook of Fishery Statistical
Standards (Rome).
Gunnlaugsson, Stefán, Kristofersson, Dadi and Agnarsson, Sveinn, 2018, “Fishing for a Fee: Resource
Rent Taxation in Iceland's Fisheries.” Ocean and Coastal Management 163, 141–150.
Hannesson, Rögnvaldur, 2013, “Sharing a Migrating Fish Stock,” Marine Resource Economics 28,
1–17.
Hardin, Garrett, 1968, “The Tragedy of the Commons,” Science 162(3859), 1243–1248.
House of Lords, 2016, “Brexit: Fisheries,” European Union Committee 8th Report of Session 2016–17,
Paper 78.
Iceland Ocean Cluster, 2014, “Icelandic Businesses in Ocean Biotech” (Reykjavik).
International Monetary Fund (IMF), 2017a, “Iceland’s Tourism Eruption,” in Iceland: Selected Issues
Paper, IMF Country Report No. 17/164 (Washington).
———, 2017b, “Iceland: Staff Report for the 2017 Article IV Consultation,” IMF Country Report
No. 17/163 (Washington).
Íslandsbanki, 2012, The Importance of the Ocean Cluster for the Icelandic Economy (Reykjavik).
———, 2016, Icelandic Seafood Market Report (Kópavogur).
Jensen, Frank, Hans Frost, Thomas Thøgersen, Peder Andersen, and Jesper Levring Andersen, 2015,
“Game Theory and Fish Wars: The Case of the Northeast Atlantic Mackerel Fishery,” Fisheries
Research 172, 7–16.
Kleisner, K., H. Mansour, D. Pauly, 2014, “Region-Based MTI: Resolving Geographic Expansion in the
Marine Trophic Index,” Marine Ecology Press Series 512, 185–199.
Miller, Kathleen, Gordon Munro, U. Rashid Sumaila, and William Cheung, 2013, “Governing Marine
Fisheries in a Changing Climate: A Game-Theoretic Perspective,” Canadian Journal of
Agricultural Economics 61, 309–334.
Munro, Gordon, 1979, “The Optimal Management of Transboundary Renewable Resources,”
Canadian Journal of Economics 12(3), 355–376.
16 INTERNATIONAL MONETARY FUNDICELAND
Organisation for Economic Cooperation and Development (OECD), 2017, “Sustaining Iceland’s
Fisheries Through Tradeable Quotas,” OECD Environment Policy Paper No. 9.
———, 2018, “OECD Review of Fisheries 2017. General Survey of Fisheries Policies,” OECD
Document No. TAD/FI(2017)14/FINAL.
Phillipson, Jeremy and David Symes, 2018, “A Sea of Troubles: Brexit and the Fisheries Question,”
Marine Policy 90, 168–173.
Pintassilgo, Pedro, Michael Finus, Marko Lindroos, and Gordon Munro, 2010, “Stability and Success
of Regional Fisheries Management Organizations,” Environmental Resource Economics 46,
377–402.
Royal Swedish Academy of Sciences, 2005, The Sveriges Riksbank Prize in Economic Sciences in
Memory of Alfred Nobel 2005, Press Release,
https://www.nobelprize.org/nobel_prizes/economic-sciences/laureates/2005/press.html
Sethi, Suresh A., Trevor A. Branch, and Reg Watson, 2010, “Global Fishery Development Patterns are
Driven by Profit but not Trophic Level,” Proceedings of the National Academy of Sciences,
Vol. 107, No. 27, pp. 12163–12167.
Spijkers, Jessica, and Wiebren J. Boonstra, 2017, “Environmental Change and Social Conflict: The
Northeast Atlantic Mackerel Dispute,” Regional Environmental Change 17, 1835–1851.
Toumasatos, Evangelos and Stein-Ivar Steinshamn, 2018, “Coalition Formation with Externalities: The
Case of the Northeast Atlantic Mackerel Fishery in a Pre and Post Brexit Context,”
International Game Theory Review Vol. 20 (2) 185000.
Valtýsson, Hreidar Thór, 2014, “Reconstructing Icelandic Catches from 1950–2010,” in Fish Catch
Reconstructions: Islands, Part IV ed. by Zylich, D., M. Ang, and D. Pauly (Vancouver: Fisheries
Centre, University of British Columbia).
Wendling, Zachary, Marc Levy, Daniel Esty, Alex de Sherbinin, John Emerson, 2018, Environmental
Performance Index Report 2018 (New Haven: Yale Center for Environmental Law and Policy).
INTERNATIONAL MONETARY FUND 17ICELAND
INFLATION TARGETING IN ICELAND—THE ISSUE OF
HOUSING COSTS1
The recent divergence between housing costs and other prices in Iceland’s consumer price index (CPI)
has reignited the debate about the most suitable reference index for Iceland’s inflation target.
Reviewing alternatives and considering the effects on inflation and monetary policy suggests a case
for smoothing the impact of high-frequency movements in housing prices on targeted inflation while
continuing to target CPI inflation including housing costs. Any adopted changes could have
implications for monetary policy, however, which would need to adjust accordingly.
A. The Issue
1. Inflation in Iceland has been close to Policy Rate, CPI and CPIXH Inflation
target in recent years, but inflation (Percentage change y/y)
25 25
excluding housing has tended to be Nominal policy rate (percent p.a.)
CPI
negative. Since Iceland introduced inflation 20 20
CPIXH
targeting in 2001, overall CPI inflation has been 15 15
higher on average than inflation based on the
CPI excluding housing (CPIXH), and more 10 10
procyclical—higher in booms, and lower in 5 5
busts. The contribution of housing costs to CPI
inflation reached an all-time high of almost 0 0
5 percentage points in mid 2017, allowing CPI -5 -5
inflation to hover close to the 2½ percent Jan-00 Jan-03 Jan-06 Jan-09 Jan-12 Jan-15 Jan-18
target despite CPIXH inflation falling to as low Sources: CBI; Statistics Iceland; and IMF staff calculations.
as -3 percent—its lowest rate in nearly 60 years.
2. This divergence has reignited the debate about the most suitable reference index for
Iceland’s inflation target. It has revived questions about whether the CPI is the appropriate
reference index and whether there is scope for improving the way housing costs are incorporated in
Iceland’s CPI. These issues were also debated in the mid 2000s (IMF, 2006; and Herbertsson and
Mishkin, 2006). More recently, the Central Bank of Iceland (CBI) has highlighted the benefits of
sticking to the CPI (CBI, 2016). Finally, this year, a government-commissioned taskforce of external
experts suggested that for monetary policy purposes the CPI should be replaced by a measure that
excludes housing costs (Task Force on Monetary Policy, 2018).
1 Prepared by Sílvia Domit (EUR), Shakill Hassan (SPR), Morgan Maneely (EUR), and Niall O'Hanlon (STA).
18 INTERNATIONAL MONETARY FUNDICELAND
B. Measurement Considerations
3. Housing costs can be incorporated in the CPI in different ways. Total housing costs are a
combination of renters’ and homeowners’ spending on shelter. Whereas the former tends to be
measured by data on rents, the latter has to be estimated. There is no international consensus on
whether or how to include owner-occupied housing (OOH) expenses in the CPI. Three broad
approaches are typically used to include OOH (Consumer Price Index Manual, 2004). OOH costs may
be proxied using at least three methods: 2
• Rental equivalence. This approach calculates how much homeowners would have to pay to
rent their dwellings, excluding costs typically borne by landlords such as home insurance,
maintenance, and property taxes.
• User cost. This approach sums recurring actual costs such as home insurance, maintenance,
property taxes, and mortgage interest payments, as well as estimated depreciation costs
based on the current market value of the OOH stock and an average rate of depreciation.
• Acquisitions. This approach looks at the cost of purchasing and owning a dwelling,
including renovations, home insurance, maintenance, and transfer costs.
4. Each of these methods has its limitations. The appropriate choice depends on country
specific characteristics, data availability, and the primary use of the CPI. Rental equivalence may not
be a good proxy for OOH costs in countries where the rental market is small, geographically or
demographically concentrated, subject to rent control, or unrepresentative of the stock of OOH
(which tends to be of higher quality). By construction, the user-cost approach includes interest rates
and house purchase prices in the CPI, directly linking the index to an asset price and creating a
cyclical mechanism whereby, as first-round effect, policy rate increases (decreases) raise (lower) CPI
inflation. The acquisitions approach can also create a stronger link between CPI inflation and house
purchase prices and may prove difficult to implement due to data limitations, including availability
(e.g., the lack of a price index for newly built housing), volatility (weights may fluctuate significantly
over the housing cycle), and timeliness (Hill, Steurer, and Waltl, 2017).
5. Iceland uses a version of the user-cost approach, with two potential limitations.
The flow of services of living in an owner-occupied dwelling is calculated as an annuity, derived from
the depreciation of the property, the market price of the house, and real interest rates (Gudnason
and Jónsdóttir, 2009; Gudnason, 2004; and Gudnason, 2005). The latter two components could
create issues for an inflation targeting central bank by: (i) increasing the sensitivity of targeted
2 A fourth method, referred to as the payments approach, is based on the expenditure incurred in occupying a house,
including deposits on newly purchased dwellings, fees, repayments of mortgage principal, mortgage interest
payments, home insurance, maintenance, and property taxes. In practice, this approach has several limitations and is
used by very few countries (Diewert, 2003 and Diewert, 2009).
INTERNATIONAL MONETARY FUND 19You can also read