Value Chain Analysis of the Solar PV Market in Pakistan
←
→
Page content transcription
If your browser does not render page correctly, please read the page content below
Value Chain Analysis of the Solar PV
Market in Pakistan

                              Value Chain Analysis of the Solar PV Market in Pakistan – 1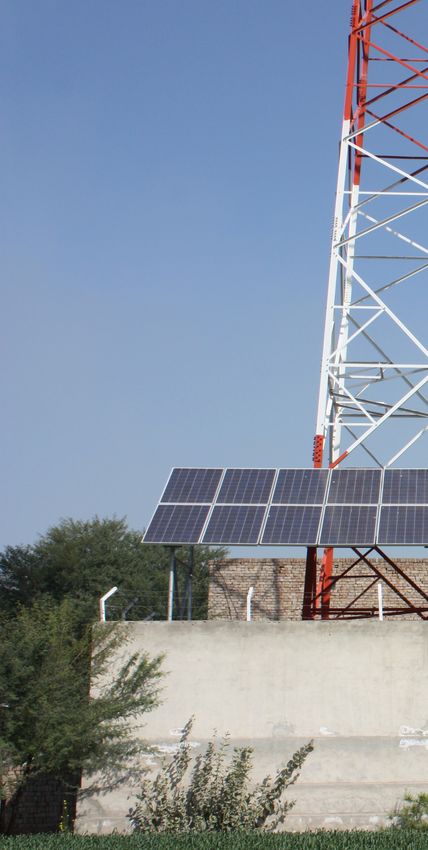
Imprint

Published by
Deutsche Gesellschaft für
Internationale Zusammenarbeit (GIZ) GmbH

Registered offices
Bonn and Eschborn, Germany

GIZ Pakistan – Country Office
House 23, Street 55, F-7/4, 44000 Islamabad - Pakistan

T: +92 51 8351102, 8358913-14
F: +92 51 8351103
Email: giz-pakistan@giz.de
Internet: www.giz.de/pakistan

Person responsible for content under §55 paragraph 2 RStV
Jörg Mayer (BSW-Solar)

Authors
Saad Malik
VARIEGATE Consult
House 11-B, Street 50, Sector F-8/4, Islamabad
T: +92 300 522 9360
Email: smalik(at)variegateconsult.com

&

Jörg Mayer
Luz Alicia Aguilar
German Solar Association – BSW-Solar / Bundesverband Solarwirtschaft e.V.
Lietzenburger Straße 53
10719 Berlin
Email: info(at)bsw-solar.de
T: +49 30 2977788-0
F: +49 30 2977788-99
www.solarwirtschaft.de

Designed by
Anna Landskron

Place and date of publication
Berlin, December 2016

    2 – Value Chain Analysis of the Solar PV Market in Pakistan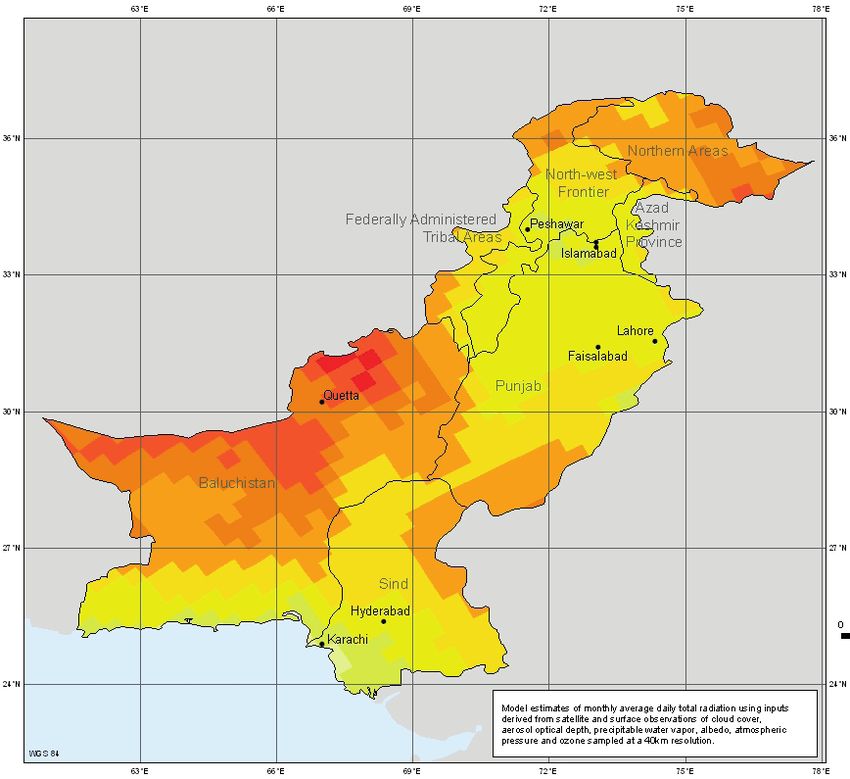
Contents
i Summary ........................................................................................................................................... 6
1 Introduction ....................................................................................................................................... 8
1.1 Background........................................................................................................................................ 8
1.2 Objective. .......................................................................................................................................... 8
1.3 Methodology of the Value Chain Analysis......................................................................................... 8
1.4 Introducing Pakistan........................................................................................................................ 10
2 Key Stakeholders for Power Sector Development in Pakistan ........................................................... 12
2.1 Government Institutions. ................................................................................................................ 12
2.2 Renewable Energy Associations. ..................................................................................................... 15
2.3 International Organizations............................................................................................................. 15
2.4 Scientific/Academic Organizations. ................................................................................................. 15
3 PV Sector in Pakistan........................................................................................................................ 16
3.1 Power Sector Status in Pakistan. ..................................................................................................... 16
3.2 Legal Framework for PV Development............................................................................................ 17
3.3 PV Market Potential......................................................................................................................... 18
3.4 Updates on Net Metering................................................................................................................ 19
4 Results of the Value Chain Analysis.................................................................................................. 20
4.1 Proportion of Revenue from Solar Components............................................................................. 20
4.2 Importers/Wholesalers.................................................................................................................... 20
4.3 Manufacturers/Assemblers............................................................................................................. 21
4.4 Suppliers/Installers.......................................................................................................................... 21
4.5 Solar PV Product and Service Range in the Pakistani Market.......................................................... 21
4.6 Imported Products........................................................................................................................... 23
4.7 Analysis of Products Fulfilling Norm and Quality Standards............................................................ 27
4.8 Availability Analysis of High-Quality Products and Services............................................................ 29
4.9 Potential Areas for Solar PV Products.............................................................................................. 29
4.10 Market Segments Using Different Product Qualities....................................................................... 30
4.11 Customer Segmentation Product Preferences. ............................................................................... 31
4.12 Quality Perceptions of Key PV Target Groups.................................................................................. 32
4.13 Payback Time Expectations of Each Customer Segment. ................................................................ 33
5 Business Environment for German PV Businesses............................................................................. 34
5.1 Challenges and Opportunities for German PV Businesses. ............................................................. 34
5.2 Target Segments for German Products in Pakistan.......................................................................... 35
5.3 Proposed Modality for Engagement of German Products in Pakistan. ........................................... 36
5.4 Business Conditions for PV Companies. .......................................................................................... 36
Annexes................................................................................................................................................. 37
Annex A. .................................................................................................................................................. 37
Annex B. .................................................................................................................................................. 38
Annex C. .................................................................................................................................................. 45
Annex D................................................................................................................................................... 49
Value Chain Analysis of the Solar PV Market in Pakistan – 3
Figures Figure 1: Methodology of the value chain analysis.................................................................................... 8 Figure 2: PV Value Chain Actors................................................................................................................. 9 Figure 3: Map of Solar Irradiation Levels in Pakistan. .............................................................................. 11 Figure 4: Institutional Setup of the Power Sector in the Country............................................................ 14 Figure 5: Power Supply and Demand Scenario in Pakistan...................................................................... 16 Figure 6: Share of Renewables in Power Sector Landscape of Pakistan................................................... 16 Figure 7: Electricity Consumption Trend by Sector.................................................................................. 17 Figure 8: Revenue Generated From Different PV Components................................................................ 20 Figure 9: Landscape of PV Panels in Pakistan........................................................................................... 21 Figure 10: Landscape of Batteries for Use with PV Systems in Pakistan. ................................................... 22 Figure 11: Import Trend for PV Panels in Pakistan..................................................................................... 23 Figure 12: Import Trend For Deep Cycle Batteries in Pakistan. ................................................................. 24 Figure 13: Import Trend for Inverters in Pakistan....................................................................................... 25 Figure 14: Import Trend for Charge Controllers in Pakistan...................................................................... 26 Figure 15: Proportion of Certified Products in the Local Market............................................................... 27 Figure 16: Imported PV Brands in Pakistan............................................................................................... 28 Figure 17: Price Versus Quality Preferences............................................................................................... 30 Figure 18: Customer Awareness Landscape of PV Quality Products.......................................................... 31 Figure 19: Preferences of the PV Market Segments in Pakistan................................................................. 32 Figure 20: Payback Expectations of Each Customer Segment................................................................... 33 Figure 21: Challenges and Opportunities .................................................................................................. 34 Figure 22: Target Segments for German PV Products and Services . ......................................................... 35 4 – Value Chain Analysis of the Solar PV Market in Pakistan
Acronyms
GIZ Deutsche Gesellschaft für Internationale Zusammenarbeit
REEE Renewable energy and energy efficiency
BSW-Solar Bundesverband Solarwirtschaft e.V. (German Solar Association)
MoWP Ministry of Water and Power
AEDB Alternative Energy Development Board
FBR Federal Board of Revenue
PSQCA Pakistan Standards and Quality Control Authority
NEPRA National Electric Power Regulatory Authority
NTDC National Transmission and Despatch Company Limited
DISCO Distribution company
MFI Microfinance institutions
CPPA Central Power Purchasing Agency (Guarantee) Limited
PCRET Pakistan Council for Renewable Energy Technologies
PSA Pakistan Solar Association
REAP Renewable Energy Association of Pakistan
ADB Asian Development Bank
JICA Japan International Cooperation Agency
UNDP United Nations Development Programme
USAID United States Agency for International Development
KfW Kreditanstalt für Wiederaufbau
EU European Commission
UET University of Engineering and Technology
NUST National University of Science and Technology
RE Renewable energy
PV Photovoltaic
PKR Pakistani rupee
Value Chain Analysis of the Solar PV Market in Pakistan – 5
i. Executive Summary
Pakistan is a federal parliamentary republic and the pricing that caters to different economic classes of
sixth most populous country in the world, with a customers.
present population of over 190 million.1 Recent eco-
nomic developments in the country have been posi- However, sub-standard/low-quality PV products pro-
tive, with a GDP growth of 4.2 percent in FY 2015 liferate in Pakistan and awareness concerning the
compared to 4 percent in FY 2014 and a growth of benefits of quality PV is lacking.
4.5 percent forecasted for 2016. 2 The country has
been facing a significant energy deficit in the past According to the survey conducted with the selected
decade with power shortfalls of approx. 5 GW3 and stakeholders from the solar value chain for the de-
load shedding across the country varying between velopment of this analysis 4 , the level of customer
5 to 12 hours a day in rural areas that bear the main awareness regarding quality PV is low: The value
brunt of the load shedding. chain players perceive the share of ‘certified’ PV
components related to the total PV components in
The Government of Pakistan (GoP) has taken a con- the market to be only 20 percent for PV panels, 14
siderable number of incentives in its energy strategy percent for inverters and 9 percent for batteries.
to overcome the energy deficit through the promo-
tion of both large-scale grid-connected PV projects Amongst the different PV customer segments in the
as well as smaller-scale projects. The introduction of Pakistan market, the residential sector remains the
the net metering scheme in September 2015 has most price-sensitive, although a niche market does
been an encouraging sign. Further steps are being exist for high-quality products, particularly batteries
taken to reduce bureaucratic procedures (i.e. ‘red and inverters. The industrial sector claims to prefer
tape’) n the processing of applications for issuance European products, since they are bankable and
of net metering licenses. The GoP has also encouraged more reliable. However, currently they are mostly
‘large-scale’ grid-connected PV projects through the purchasing Chinese products (PV panels and inver-
introduction of a feed-in tariff (FiT), increasing the ters) due to the higher costs of European products
interest of investors. and the limited offer of after-sales services in com-
parison to Chinese products.
Currently the PV market is dominated by Chinese
products: 95.6 percent (975.3 MW) of PV panels, Grid-tied systems, particularly ‘inverters’, are expec-
71.5 percent (1328.8 MW) of inverters and 85.1 ted to remain the prime market segment for German
percent (24,970 tons) of deep cycle batteries have PV companies targeting the Pakistani market for use
been imported from China into Pakistan between in medium-scale (100 kW-1 MW) and large-scale
October 2015 and September 2016. The dominance (>1 MW) grid-connected projects which are usually
of Chinese products is attributed to price competitive set up by the industrial and commercial sectors.
ness with similar products from other countries, However, price competitiveness with comparable
extensive customer outreach through dealership products from other countries will be critical. Batte-
networks and the large variation in product quality/ ries as backup systems (AGM) for the residential sector,
1 data.un.org
2 data.worldbank.org/country/Pakistan
3 NEPRA et al 2015 “State of Industry Report’’
4 Please see the methodology in chapter 1
6 – Value Chain Analysis of the Solar PV Market in Pakistan
for off-grid systems and for the commercial sector renewable energy’ in June 2016, with loans being
also hold considerable potential, with price competi offered at 6 percent interest rate for PV projects up
tiveness being the main aspect to be focused on by to 50 MW.5
European manufacturers. There is also potential for
European PV testing and monitoring equipment such Pakistan has a huge PV potential and all the neces-
as battery testers, PV panel testers, etc. sary conditions for its implementation: high radiation
yield, a regulatory framework and financing instru-
In terms of provision of services, there is consider- ments that support its development. However, the
able potential for technical consulting services such level of awareness of quality of PV is very low and
as conducting techno-economic feasibility studies, customers are still not aware of the benefits of
maintenance and operation of medium and large- high-quality products. The implementation and dis-
scale projects, monitoring of installed projects, etc. semination of quality standards for PV are expected
European EPC companies interested in developing to lead to a reduction of price sensitivity and increase
commercial sector (kW scale) and large-scale (over the procurement of high-quality PV products.
1 MW) grid-connected projects in the country, also
have a large market potential, since there are not
many EPC services available.
Payback expectations from the different customer
segments vary between 3.5 to 5 years. The commer-
cial sector expects the shortest payback period with
3.5 years, followed by the industrial sector with 4.5
years.
The GoP will soon implement ‘import quality stan-
dards for PV equipment’ and will curb the import of
uncertified and sub-standard equipment into the
country. Once these standards have been implemen-
ted, there will be greater standardization, both in
terms of pricing and quality of products available in
the market. This will encourage leading solar compa-
nies to increase their participation in Pakistan’s
emerging solar market.
In order to increase the ‘access to finance’ for PV, the
GoP has also taken steps with the State Bank of
Pakistan, announcing the ‘Financing scheme for
5 http://www.sbp.org.pk/smefd/circulars/2016/C3.htm
Value Chain Analysis of the Solar PV Market in Pakistan – 71 Introduction
1.1 Background develop policy recommendations to improve the
The Deutsche Gesellschaft für Internationale Zusam- quality demand of the Pakistani PV market.
menarbeit (GIZ) GmbH’s Renewable Energy & Energy
Efficiency (RE-EE) project in Pakistan was initiated in 1.3 Methodology of the Value Chain Analysis
2005, with a focus on promoting renewable energy The methodology of the study includes:
(RE) and industrial energy efficiency (EE). The main
counterpart to the project on behalf of the Govern- a) The analysis of available market data on the PV
ment of Pakistan is the Alternative Energy Develop- market in Pakistan. The main sources of information
ment Board (AEDB), Ministry of Water and Power were the Alternative Energy Development Board
(MoWP). (AEDB), the National Electric Power Regulatory
Authority (NEPRA) and the customs authorities.
On December 17, 2015, under the framework agree-
ment of the Pakistan-Germany Renewable Energy b) Carrying out a survey with selected actors in the
Forum (PGREF), the German Solar Association PV value chain. This information was analyzed and
(BSW-Solar) and the Pakistan Solar Association (PSA) backed up with previously published literature to
signed a memorandum of understanding (MoU) develop a landscape of the existing PV value chain in
declaring mutual support for awareness, quality as- the country. The gradual approach adopted for this
surance and business networking to promote high- activity is provided in the Figure 1 below.
quality solar photovoltaic (PV) products and services
in Pakistan.
In order to create wide-ranging business opportuni- Review and compilation of published
ties for the private sector of both countries and to data/statistics on PV
engage German solar companies that can offer
top-quality components, this value chain analysis
was agreed to be developed under the framework Identification of the key value chain actors
of the project ‘Pakistan Solar Quality Potential: Mea-
sures to Increase the Market Demand for Quality’,
coordinated by BSW-Solar.
Development of the questionnaire
1.2 Objective
The objective of this report is to analyze the value
chain of PV in Pakistan and to describe the existing
Carrying out interviews with selected
and required supply structure and customer seg- PV value chain actors
mentation. This will allow the identification of the
market potential for high-quality German manufac-
turers and the needs of local stakeholders and to Results based on interviews and complemented
with statistics and available market data
Figure 1: Methodology of the value chain analysis
8 – Value Chain Analysis of the Solar PV Market in PakistanThe customized questionnaire is provided in Annex B. 1.3.1 PV Value Chain Actors
The interviews were conducted with different value The PV value chain actors in the country are provided
chain actors (importers, installers, retailers, etc.) to in Figure 2 below. A total of twenty-six small, medium
identify Pakistan’s perception of quality and their and large PV companies and businesses were inter-
willingness to pay for quality PV products, including viewed in order to obtain their feedback regarding
the assessment of customer awareness and interests existing and future PV market dynamics. Their names
based on the respective merchant’s perceptions. The and contact details are provided in Annex C.
results were complemented with statistics and avai-
lable market data, despite limited availability of the It was ensured that the value chain actors interviewed
latter. The obtained results were identified and sum- included market leaders as well as medium-sized
marized for the identification of the potential for firms and start-ups, in order to get a holistic picture
quality PV products. of the entire PV landscape.
MANUFACTURERS SUPPLIERS
IMPORTERS WHOLESALERS
ASSEMBLERS INSTALLERS
FINANCIAL PROJECT
EPCs
INSTITUTIONS DEVELOPERS
PRIVATE SYSTEM SYSTEM
CONSULTANTS
INVESTORS MAINTENANCE MONITORING
Figure 2: PV Value Chain Actors
Value Chain Analysis of the Solar PV Market in Pakistan – 91.3.2 Types of PV Companies/Businesses Consulted 1.4.2 Energy Situation & Rationale for Development
96 percent of the PV businesses surveyed for this of Solar PV in Pakistan
activity are directly importing PV equipment into the The country has been facing a significant energy de-
country and are increasing their profit margins in ficit for the past decade, with power shortfalls stan-
comparison to PV businesses that procure equip- ding at 5 GW8 and load shedding across the country
ment locally. varying between 5 to 12 hours a day, with rural areas
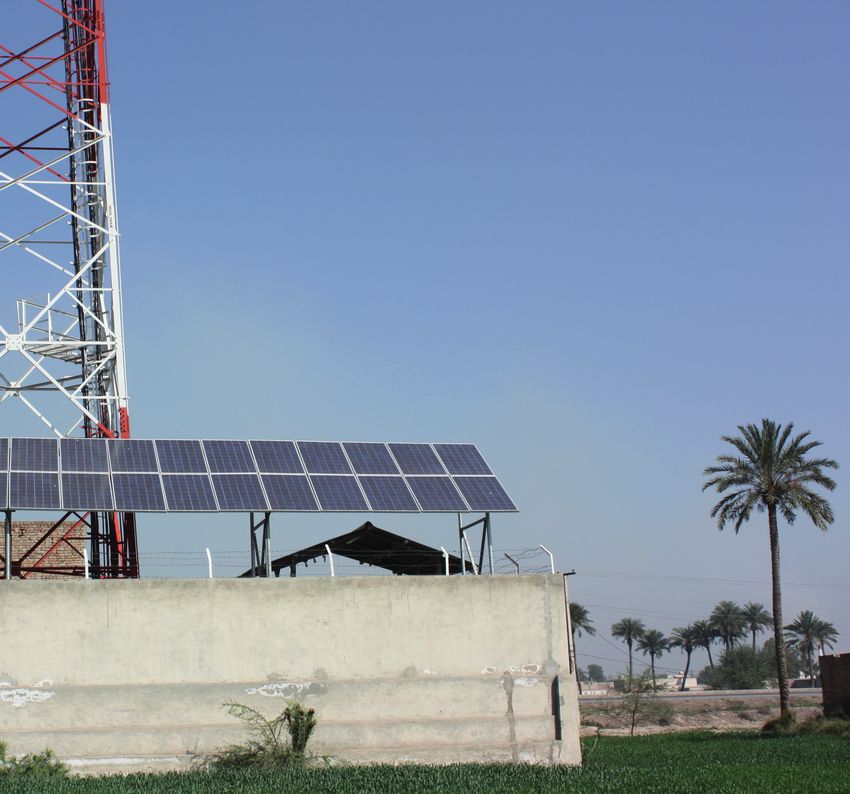
bearing the brunt of load shedding. Solar PV could
Only 38 percent of the firms are acting as ‘wholesa- be a viable and cost-effective long-term solution to
lers’ and selling equipment directly to other business meet Pakistan’s energy needs. The country has a
entities in the market, while 4 percent of the firms large potential, being one of the sunbelt countries
are engaged in the monitoring of the PV systems. with solar irradiation of 6-7 kWh/m2/day in the areas
It needs to be mentioned that ‘monitoring’ of PV identified for PV development, as shown in Figure 3.
systems is currently in its infancy and holds consider-
able potential. Most of the firms are focused on The Punjab and Sindh provinces are considered the
obtaining business with little emphasis put on moni- focal points for both kW and MW-scale PV develop-
toring system performance, unless the client high- ment in the country, due to their high population
lights an issue. density, as well as the high level of infrastructure and
industry.
1.4 Introducing Pakistan
1.4.1 General Description
Pakistan is a federal parliamentary republic. It has
four provinces (Khyber Pakhtunkhwa, Balochistan,
Punjab and Sindh), one capital territory (Islamabad
Capital Territory), two autonomous and disputed
territories (Azad Jammu & Kashmir and Gilgit Baltis-
tan) and the Federally Administered Tribal Areas
(FATA). It is the sixth most populous country in the
world, with a population of over 190 million.6
Recent economic developments in the country have
been positive, with a GDP growth of 4.2 percent in
FY15 compared to 4 percent in FY14, and growth of
4.5 percent forecasted for 2016.7
6 data.un.org
7 data.worldbank.org/country/Pakistan
8 NEPRA et al 2015 “State of Industry Report’’
10 – Value Chain Analysis of the Solar PV Market in PakistanPakistan
Direct Normal
Solar Radiation
Annual
kWh/m2/day
>9
8,5–9,0
8,0–8,5
7,5–8,0
7,0–7,5
6,5–7,0
6,0–6,5
5,5–6,0
5,0–5,5
4,5–5,0
4,0–4,5
3,5–4,0
0 100 200 400
3,0–3,5
Kilometers
2,5–3,0
2,0–2,52 Key Stakeholders for Power Sector Development in Pakistan 10
2.1 Government Institutions11 utility companies and determines investment tariffs
for bulk generation and transmission and retail dis-
2.1.1 MoWP (Ministry of Water and Power) tribution of electric power.
The Federal Ministry of Water and Power is the
GoP’s executive arm for all issues relating to electri- 2.1.4 CPPA (Central Power Purchasing Agency Gua-
city generation, transmission and distribution, pri- rantee Limited)
cing, regulation, and consumption in the country, The CPPA is a non-profit independent company es-
and it exercises this function through its various tablished under the 1984 Companies Ordinance and
agencies as well as relevant autonomous bodies. It is solely responsible for implementing and adminis-
also serves to coordinate and plan the nation’s power tering the “Single Buyer Plus” market mechanism, i.e.
sector, formulate policy and specific incentives and awarding of exclusive rights by the government to
liaise with provincial governments on all related the transmission and dispatch company, the single
issues. buyer, to purchase electricity from generators and
sell it to distributors (ultimately leading to competi-
2.1.2 AEDB (Alternative Energy Development Board) tive market operations). Under this mechanism, since
The AEDB was established as an autonomous body the risk is borne by a single entity, i.e. the buyer, the
with the aim of promoting and facilitating the ex- generators are expected to accept lower tariffs since
ploitation of renewable energy projects in Pakistan. they assume a lower risk.
It has been designated as a ‘one-window’ facilitator
at federal level for processing solar projects of all 2.1.5 NTDC (National Transmission and Despatch
sizes. The AEDB can issue a letter of intent (LOI), Company Limited)
which is the first contract that a solar developer The National Transmission & Despatch Company
enters into with the AEDB. The AEDB has also deve Limited (NTDC) commenced commercial operations
loped a standard power purchase agreement (known on 24 December, 1998. It was organized to take over
as the Energy Purchase Agreement (EPA) and a all the properties, rights and assets, obligations and
government support agreement (implementation liabilities of 220 KV and 500 KV grid stations and
agreement (IA). transmission lines/network owned by Pakistan
Water and Power Development Authority (WAPDA).
2.1.3 NEPRA (National Electric Power Regulatory Au- NTDC operates and maintains 12 500-KV and 29
thority) 220-KV Grid Stations, 5077 km of 500-KV transmis-
Under the 1997 Regulation of Generation, Transmis- sion line and 7359 km of 220-KV transmission line in
sion and Distribution of Electric Power Act, NEPRA Pakistan.12
was appointed as the sole regulator in the power
sector. NEPRA was established to ensure a transpa- 2.1.6 DISCOs (Distribution Companies)
rent, competitive and commercially-oriented power There are a total of 11 DISCOs in the country, tasked
market in Pakistan. NEPRA issues generation licen- with ensuring a smooth and uninterrupted delivery
ses, establishes and enforces standards, approves of power to residential, commercial and industrial
investment and power acquisition programs of the customers.
10 The contact information of the stakeholder is provided in Annex A.
11 The contact information of the stakeholder is provided in Annex A.
12 http://www.ntdc.com.pk
12 – Value Chain Analysis of the Solar PV Market in PakistanThey are the following: IESCO (Islamabad Electric accreditation services of PNAC were launched during
Supply Company), QESCO (Quetta Electric Supply the year 2001.
Company), PESCO (Peshawar Electric Supply Compa-
ny), HESCO (Hyderabad Electric Supply Company), PNAC achieved a milestone in the form of a mutual
GEPCO (Gujranwala Electric Power Company), K-Elec- recognition arrangement (MRA) with the Internatio-
tric, LESCO (Lahore Electric Supply Company), MEP- nal Laboratory Accreditation Cooperation (ILAC) and
CO (Multan Electric Power Company), TESCO (Tribal the Asia Pacific Laboratory Accreditation Cooperati-
Electric Supply Company), FESCO (Faisalabad Electric on (APLAC) in 2009, and MLA status in 2013. Now
Supply Company) and SEPCO (Sukkur Electric Power Pakistan is included in the list of countries having
Company). equivalent status for accreditation of testing and
calibration laboratories and certification bodies for
2.1.7 PCRET (Pakistan Council of Renewable Energy QMS & EMS all over the world.
Technologies)
PCRET was, according to its mandate, developed for 2.1.10 PSQCA (Pakistan Standards and Quality Cont-
coordinating R&D and promotional activities in dif- rol Authority)
ferent renewable energy technologies. However, it The PSQCA is the national standardization body. Its
is a largely inactive organization, with no noteworthy main function is to foster and promote standards
role relating to solar technology promotion in the and conformity assessment as a means of advancing
country. the national economy, promoting industrial efficien-
cy and development, ensuring the health and safety
2.1.8 FBR (Federal Board of Revenue) of the public, protecting consumers, facilitating do-
The FBR has the responsibility for formulating and mestic and international trade and furthering inter-
administering fiscal policies, levying and collecting national cooperation in relation to standards and
federal taxes and conducting quasi-judicial hearings conformity assessment.
of appeals. In the context of the solar sector of the
country, FBR’s role is key in ensuring that all impor- 2.1.11 Provincial Energy Departments
ted solar equipment into the country complies with The energy departments based in each province of
the recently approved quality import standards for the country act as the focal points for all energy-re-
Solar PV equipment. lated matters for the respective province. Their key
functions consist of attracting private-sector invest-
2.1.9 PNAC (Pakistan National Accreditation Council) ment, providing an enabling environment and pro-
The Pakistan National Accreditation Council (PNAC) moting energy efficiency and conservation.
was established under the administrative control of
the Government of Pakistan’s Ministry of Science The most active provincial energy department is the
and Technology as the national apex agency to ac- Punjab Energy Department (PED), with a key focus
credit conformity assessment bodies such as labora- on exploiting the province’s energy resources and
tories and certification bodies. PNAC was established exploiting power projects in the private and public
in 1998 after Pakistan joined the WTO in 1995. The sectors. PED has also played a key role in ensuring
Value Chain Analysis of the Solar PV Market in Pakistan – 13that the concept of the Quaid-e-Azam solar park was 2.1.12 Cabinet Committee on Energy (CCE)
realized. The Prime Minister of Pakistan chairs the CCE with
the ministers of Finance, Water and Power, Petroleum
Similarly, the Pakhtunkhwa Energy Development Or- and Natural Resources and Chief Minister of Punjab
ganization (PEDO) is also active in promoting solar as as its members. The CCE was developed to conduct
well as micro- and mini-scale hydropower projects bi-weekly meetings and take decisions on matters
in the province. relating to entire power chain including generation
and distribution.
The energy department of Sindh has been suppor-
ting the considerable wind energy installations in the A graphic summarizing the inter-relationships of the
province, while the Gilgit Baltistan energy depart- key power sector actors in the country is presented
ment remains focused primarily on micro- and mini- in Figure 4.
scale hydropower projects.
CABINET COMMITTEE ON ENERGY
MINISTRY OF WATER & POWER
NEPRA MOWP
NATIONAL ELECTRIC
POWER REGULATORY
AUTHORITY
PROVINCIAL DoEs AEDB
DEPARTMENT OF ENERGY ALTERNATE ENERGY DEVELOPMENT BOARD
RE PROJECTS
NEPRA PROVINCIAL RE PROJECTS EXCLUDING HYDEL > 50 MW & THERMAL IPPs
is sole regulator in
power sector which
issues generation
licenses determines
tariffs for generation
etc.
CPPA NTDC
CENTRAL POWER NATIONAL TRANSMISSION &
PURCHASING AGENCY DESPATCH COMPANY
11 DISCOs
BULK CONTRACTS DISTRIBUTION COMPANIES
CCoE is chaired by PM MoWP is Federal AEDB is autonomous Provincial DoEs are NTDC operates and CPPA responsible for
of Pakistan and takes Ministry and GoP’s body and ’one window‘ focal points for all maintains 500 kV and implementing and
decisions on fortnightly body for all issues facilitator at federal energy related issues 220 kV grid stations administering ’Single
basis on entire power relating to energy level for processing in the province. and transmission lines. Buyer Plus‘ market
chain. generation, transmission solar projects of all mechanism leading to
and distribution, policy sizes and issues LOls competitive market
formulation etc. and issues tax operations.
exemption certificates.
Figure 4: Institutional Setup of the Power Sector in the Country
14 – Value Chain Analysis of the Solar PV Market in Pakistan2.2 Renewable Energy Associations 2.4 Scientific/Academic Organizations
Although there is a high level of interest from all sec-
2.2.1 PSA & REAP tors, there are no focused academic institutions wor-
The Pakistan Solar Association (PSA) and the Renew king solely on solar PV, since the market is still at an
able Energy Association of Pakistan (REAP) are the early stage. Certain reputed universities such as Na-
only major associations/platforms representing the tional University of Science and Technology (NUST)
interests of private-sector firms/companies working with campuses in both Rawalpindi/Islamabad and
in renewables in the country. REAP presently has Karachi have developed a dedicated ‘U.S. Center for
over 400 members consisting of both small and large Advanced Studies in Energy’ (USPCAS-E)13 in order
private-sector entities as well as individual business to focus on renewable technologies such as solar and
entities. On the other hand, PSA presently has over biomass. Similarly, the University of Engineering and
100 members, primarily large and medium-sized en- Technology (UET) in Lahore presently has an accre-
tities and individual business entities. dited laboratory for conducting flash tests in order
While REAP was the first association to be established to assess panel efficiency.
in the country, PSA was founded to focus primarily
on solar energy-based ventures and to provide a In the recent years, USAID has extended considerable
forum for firms/companies working specifically on financial support to NUST for the establishment of
solar. Both associations are still at a very early stage the Center for Energy Studies.
of development.
The PCRET, mentioned in Section 2.1.7, is a public-
2.3 International Organizations sector research organization focused on conducting
research and development (R&D) in different renew
The international organizations actively working in able energy technologies, with one of the focal areas
the country and playing a key role in the energy sec- being solar PV.
tor are USAID, JICA, ADB, KfW, EU, GIZ and UNDP.
Amongst these institutions, the GIZ RE-EE project is
the only one dedicated to the promotion of renewa-
ble energy and energy efficiency in Pakistan.
The United States Agency for International Develop-
ment (USAID), together with the government-owned
DISCOs, have been playing a key role through its
three-year program aimed to improve the perfor-
mance of DISCOs through reduction of losses as well
as improvement of revenues and customer services.
13 http://www.nust.edu.pk/INSTITUTIONS/Centers/CES/Pages/default.aspx
Value Chain Analysis of the Solar PV Market in Pakistan – 153 PV Sector in Pakistan
3.1 Power Sector Status in Pakistan The share of renewables in Pakistan has been steadily
increasing each year, with 1136 MW of renewables
3.1.1 Existing and Projected Supply and Demand having been installed by 2016 (primarily PV, biogas
Scenario and wind projects). During the last year, i.e. 2015-16,
The power deficit in the country currently stands there has been a promising increase in the share of
near 5 GW, with the supply and demand scenario renewables, with 728 MW of renewables added. The
shown in Figure 5. However, multiple power genera- increase in renewables to the overall power sector
tion projects from various sources are currently in landscape of Pakistan is provided in the Figure 6
the pipeline and are envisaged to eliminate the po- below.
wer deficit by 2019, provided that expected projects
are completed on time. PV projects can play a key
role in the elimination of the power deficit, particu-
larly in the industrial and residential sectors.
MW 21.527 23.167 23.302 23.617 24.953 25.255 26.197
Capacity
Availability
Demand
30 938
27 600
2010 2011 2012 2013 2014 2015 2016
25 080 26 590
23 107 RE - - - 50 106 408 1.136
21 599 24 262 25 961
18 738 Nuclear 462 787 787 787 787 787 1.127
Thermal 14.240 15.753 15.888 15.852 16.963 16.963 16.814
19 917
17 107 18 262 Hydro 6.555 6.627 6.627 6.928 7.097 7.097 7.121
21 096
17 500
Figure 6: Share of Renewables in Power Sector Landscape of Pakistan15
14 121
Aug 16
Aug 17
Dec 16
Dec 17
Apr 18
Feb 18
Apr 17
Feb 17
Oct 16
Oct 17
Jun 18
Jun 16
Jun 17
Figure 5: Power Supply and Demand Scenario in Pakistan14
14 MoWP
15 CPPA, NEPRA and AEDB
16 – Value Chain Analysis of the Solar PV Market in PakistanThe trend in electricity consumption is provided in
the Figure 7 below.
2009–10 2014–15
Domestic 46,1 % Domestic 48,3 %
Industrial 26,7 % Industrial 29,1 %
Bulk Supplies 5,9 % Bulk Supplies 5,0 %
Agriculture 13,0 % Agriculture 9,4 %
Commercial 7,5 % St. Light, Traction & Oth. 0,7 % Commercial 7,6 % St. Light, Traction & Oth. 0,6 %
Total: 74.348 GWh Total: 85.818 GWh
Figure 7: Electricity Consumption Trend by Sector
An overall growth in demand of 11,000 GWh in over- This was followed by the introduction of net mete-
all electricity consumption has taken place over the ring in September 2015, with further steps being
past five years, with both the domestic and industrial taken to reduce bureaucratic ‘red tape’ in the pro-
sectors displaying an increase in electricity consump- cess of applications for issuance of net metering
tion. The overall growth in demand over this period licenses.
was approximately 7300 MW.
Additionally, the ‘import quality standards for PV
3.2 Legal Framework for PV Development 16
equipment’ by the GoP is expected to be adopted
soon and aims to curb the import of uncertified and
The GoP has also taken a considerable number of sub-standard equipment into the country. Once these
incentives in its strategy to overcome the energy standards are implemented, there will be greater
deficit through the promotion of both large-scale standardization, both in terms of pricing as well as
grid-connected PV projects as well as smaller-scale the quality of products available in the market, and
projects. The first step in this regard was its 2006 the leading international solar companies will be en-
‘Policy for development of renewable energy for couraged to increase their stakes in this emerging
power generation,’ which intends to increase the solar market. These approved standards are detailed
deployment of renewable energy technologies in in Annex D.
Pakistan to 9700 MW by the year 2030, according to
the Medium Term Development Framework (MTDF).17
16 IFC et al 2016. Solar Developer’s Guide to Pakistan
17 GoP, et al 2006: Policy for Development of Renewable Energy for Power Generation
Value Chain Analysis of the Solar PV Market in Pakistan – 17The GoP has also taken some very promising steps 3.3 PV Market Potential
with its focal public-sector financial institution, the
State Bank of Pakistan, announcing a ‘financing The Alternative Energy Development Board (AEDB)
scheme for renewable energy’ in June 2016 with reports that 35 renewable energy projects including
loans being offered at 6 percent for PV projects of 4 solar, wind and other technologies with a capacity of
kW up to 50 MW.18 1.1 GW are under development within the frame-
work of the AEDB policies and procedures. FiTs (or
At the same time, the government has also taken upfront tariffs as they are known in Pakistan) have
steps to encourage ‘large-scale’ grid-connected PV been approved for 10 developers, and of those,
projects through the introduction of a feed-in tariff three projects of 100 MW each have signed a power
(FiT) mechanism, which has proved a much needed purchase agreement with the public off-taker.
catalyst to induce investor interest and considerably
speed up the project development cycle. Apollo Solar Pakistan, Crest Energy Pakistan, and
Best Green Energy Pakistan are each working on a
In the off-grid sector, approximately 40,000 villages 100-MW PV project. These projects are expected to
across Pakistan are presently un-electrified. This sec- be commissioned by the end of this year.
tor has a large potential, with only a small amount of
companies being ac tive. Microfinancing for Six other developers have been issued letters of sup-
small-scale solar has considerable potential if it is port for the development of projects with a cumula-
implemented successfully. tive capacity of 48 MW. The AEDB has also issued
letters of intent for the development of 25 projects
According to the last statistic available, the import with a combined generation capacity of 660 MW.
of PV products was at 260 MW19 in 2014. The volume These projects are expected to be operational by
of PV commercial and residential installations has 2018.
been steadily increasing, with a total of 33.68 MW
of PV installed by 2013 and 49.97 MW installed by Additionally, the government of the Punjab province
2014.20 As a result of the commissioning of the 100- has issued letters of intent for projects with a total
MW PV project at the Quaid-e-Azam Solar Park in capacity of 1519 MW.
May 2015, the total installed capacity of PV in 2016
stands close to 400 MW; this is only the contribution The recent introduction of net metering is expected
from large-scale grid-connected installations and to catalyze the local solar industry with the residen-
does not include off-grid and small-scale installations tial, commercial and industrial sectors being key
(data is not available). beneficiaries, with high levels of interest being ex-
pressed for installing systems to reap the benefits of
this mechanism. The process of obtaining the license
for utilization of net metering has also been fine-
tuned by the respective power utilities to minimize
the time period for obtaining such a license.
18 http://www.sbp.org.pk/smefd/circulars/2016/C3.htm
19 GIZ REEE Project et al 2014. Updating of Renewable Energy Installations Database
20 GIZ REEE Project et al 2014. Updating of Renewable Energy Installations Database
18 – Value Chain Analysis of the Solar PV Market in PakistanApart from the many residential users of solar sys- 3.4 Updates on Net Metering
tems who are planning to obtain a net metering
license, a significant number of commercial entities The introduction of net metering is generating high
such as hospitals, educational facilities (such as levels of interest and expectations across all seg-
school, colleges and universities) as well as public ments of the PV market.
and private-sector office buildings and premises are
planning to install installations up to 1 MW to bene- The NEPRA’s ‘Distributed Generation and Net Mete-
fit from the cost savings expected through this sup- ring Regulations’ were announced/approved on 1
port scheme. If different types of industry can be September 2015, while the first net metering gene-
convinced, based on the potential of additional in ration license of 1 MW at the parliament building
come through net metering, to switch to solar PV as was issued on 28 January 2016 after a period of 4
an electricity source, this could lead to a significant months and 28 days.
pipeline of PV projects. It is expected that in the next
three to four years, between 3000 and 4000 MW of While NEPRA is the authority that issues the genera-
solar PV will be installed across the country through tion licenses, the DISCOs sign the ‘Distributed Gene-
net metering. ration Interconnection Agreement’ with the prosu-
mers and forward the prosumers’ application for
electricity generation license to NEPRA.
Currently, the processing time for issuance of net
metering licenses has been reduced to one month.
About seventeen net metering license applications
are being processed with IESCO, with nine connec-
tions in Islamabad. The installed capacity through
net metering stands at 1.6 MW for IESCO, while a
135-kW system has been recently installed at an in-
dustrial unit under the distribution company LESCO.
This is a most encouraging sign, since the LESCO mar-
ket for net metering-based installations is much lar-
ger compared to the market size for IESCO systems.
The origin (local/foreign) of electricity meters for net
metering installations is not mentioned in NEPRA
regulations. Currently, local companies that fulfill the
specification from the authorities produce energy
meters.
.
Value Chain Analysis of the Solar PV Market in Pakistan – 194 Results of the Value Chain Analysis
4.1 Proportion of Revenue from Solar 4.2 Importers/Wholesalers
Components
As mentioned above, 96 percent of the companies
The revenue generated from sale of the different consulted import equipment themselves in order to
solar components by the firms surveyed is provided maximize profit margins. At present the emphasis
in Figure 8. remains on importing equipment from China since it
is the most readily accessible market with a large
Inverter range of products varying in both price and quality.
Battery For the most part, companies either import an entire
Panel container of goods or share a container with another
interested business entity for importing the required
37 % 35 % solar components.
The entities involved in importing solar components
themselves were observed to possess a project
28 % pipeline as well as the financial strength to develop
a sizeable inventory and thus bear the risk of market
turbulence and diminished demand. The importers
that were consulted expressed the hope that the
Figure 8: Revenue Generated From Different PV Components adoption of net metering will provide greater stabi-
lity to the local PV market through a stable demand
As displayed in the figure above, 37 percent of re- of PV systems and will reduce the risk of holding a
venue is generated from panels, 35 percent from the large inventory.
sale of inverters and 28 percent from the sale of bat-
teries. Since the cost of PV panels is lower in compa- On the other hand, 38 percent of businesses inter-
rison to the two other components in a solar system, viewed are involved in wholesale activities, with
a large number of businesses are generating consi- their business models focused on importing and
derable revenue from their sale. In contrast, even then selling their products to other business entities.
though inverters are a much costlier item, the sale The types of firms that are currently involved in the
of a smaller proportion of this component leads to wholesale sector tend to be prosperous business
greater profit margins. Batteries were generally ob- entities, often active in other business fields, with
served to be the item contributing the least to the the required financial muscle to import large quan-
revenue generation of the solar businesses interviewed tities of inventory and hold onto it during lean peri-
as a part of this activity. ods as well as during periods of uncertainty.
20 – Value Chain Analysis of the Solar PV Market in Pakistan4.3 Manufacturers/Assemblers Additionally, there is limited expertise in the market
related to system designing and installation. Most
The assembly of silicon wafers is currently carried installers working in the PV field are electricians with
out by five different companies in the country. These no specific training related to solar PV, and are, as a
are: result, ‘learning by doing.’
Ikram Solar
Akhtar Solar 4.5 Solar PV Product and Service Range in the
Saba Solar Pakistani Market
Tesla PV
PV Silicon 4.5.1 Locally Produced Products
However, the imported panels manufactured by Apart from minor accessories such as wiring and
reputed brands are currently preferred, due to the panel mounting structures, 80 percent of PV compo-
higher reliability and trust enjoyed by the foreign nents are currently being imported into the country.
brands.
4.5.2 PV Panels
4.4 Suppliers/Installers Currently, five companies in Pakistan are conducting
the local ‘assembly’ of panels. However, imported
Most of the PV businesses interviewed import solar panels are preferred. The PV panel landscape in the
PV components in large quantities, capitalizing on country is provided in Figure 9 below.
the larger profit margins and at times selling the solar
solutions as wholesalers to other smaller business
entities. These businesses deal directly with clients,
irrespective of which sector they might belong to –
i.e. residential, industrial or commercial – and they
also install the systems and offer customized solutions.
Local manufacturing Local assembly
No Yes
Customers NOT satisfied with
Limited volumes and
performance of local panels
questionable quality
(efficiency versus price)
Low quality panels Import of PV panels High quality panels
(low cost brands & smuggled) (reputed brands)
(≈ 70 %) (≈ 30 %)
Figure 9: Landscape of PV Panels in Pakistan21
21 The figures provided with regards to proportion of PV panel market shares are rough estimates based on feedback collected during surveys and
market research. Detailed surveys are necessary to determine more accurate statistics regarding the PV panel landscape in Pakistan.
Value Chain Analysis of the Solar PV Market in Pakistan – 214.5.3 Batteries The manufacturing of AGM batteries is expected to
Locally manufactured and low-quality flooded lead commence soon in the country, with the following
acid batteries are being widely used wherever bat- industrial groups setting up factories in the southern
tery backup is necessary, particularly in hybrid solar Pakistani city of Karachi:
systems in the residential and commercial sectors as Daewoo (Korea)
well as in the off-grid systems in rural parts of the Treet (Korea)
country. Eco star (DWP Group, GREE Group) – China
Homage (China)
These batteries are used both in cars and also in ho-
mes for utilization with the UPS hybrid inverters as The landscape and dynamics of battery usage for
well as with solar PV systems. Needless to say, these solar PV systems in Pakistan is illustrated in Figure
batteries are not developed for use with solar sys- 10 below.
tems and thus do not provide a long life; there have
also been frequent cases of malfunctioning.
Considering the significant opportunity with regards
to the demand for these batteries, there is a high
proportion of instances where the batteries are
refurbished and sold as new.
Landscape of batteries for
PV systems in Pakistan
Local battery Imported battery
(≈ 60 %) (≈ 30 %)
High quality (≈ 30 %)
Sub-standard (≈ 100 %) High quality Sub-standard (≈ 30 %)
(European,
(Lead acid car batteries) (0 %) (Low grade Chinese)
American, Chinese)
Figure 10: Landscape of Batteries for Use with PV Systems in Pakistan22
22 The figures provided with regards to proportion of battery market shares are rough estimates based on feedback collected during interviews and
market research. Detailed surveys are necessary to determine more accurate statistics regarding the battery landscape in Pakistan.
22 – Value Chain Analysis of the Solar PV Market in Pakistan4.6 Imported Products 4.6.1 Import Trend for ‘PV Panels’ from Different
Countries
Chinese products have a considerable market share As can be seen in Figure 11 below, Chinese PV panels
of the PV market in the country, with over 90 percent have the highest share of imports in Pakistan, which
of PV panels and over 80 percent of ‘deep cycle’ bat- has increased between 2014 and 2016. This is attri-
teries imported. This is attributed to price competi- buted to price competitiveness with similar
tiveness with similar products from other countries, products from other countries, extensive customer
extensive dealership networks and a large variation outreach through dealership networks and a large
in product quality/pricing, which caters to different variation in product quality/pricing, which caters to
economic classes of customers. different economic classes of customers.
There is a niche in every market sector (industrial,
commercial and residential) that requires high-qua-
lity and reliable PV products, particularly inverters
and batteries. These elements of the market consti-
tute the target customer group for high-quality
European products.
Pakistan currently purchases Chinese products (PV
panels and inverters) due to the high cost of European
products, the lack of awareness about the benefits
of quality PV and the limited offer of after-sales ser-
vices in comparison to the Chinese products.
Oct 2014 – Sept 2015 Oct 2015 – Sept 2016
0,40 % (4 MW)
0,22 % (1,1 MW) 0,21 % (1,1 MW) 1,39 % (14,1 MW) 0,53 % (5,4 MW)
3,20 % (16,7 MW) 1,40 % (7,3 MW) 0,62 % (6,3 MW) 1,47 % (15 MW)
China
China UAE
UAE Malaysia
Germany Germany
Korea 94,98 % (497 MW) Hong Kong 95,60 % (975,3 MW)
Others Others
Figure 11: Import Trend for PV Panels in Pakistan
Value Chain Analysis of the Solar PV Market in Pakistan – 234.6.2 Import Trend for Deep Cycle Batteries from
Different Countries
A high proportion of Chinese ‘deep cycle’ batteries
are being imported into the country, with the same
reasons behind this dynamic as those already cited
above for PV panels. The overall volume of batteries
imported from Germany has increased over the last
year (October 2015 to September 2016), although
there has been a minor decrease in the market share
as can be seen in Figure 12 below.
Oct 2014 – Sept 2015 Oct 2015 – Sept 2016
2,57 % (621,3 t) 1,81 % (530,6 t)
1,97 % (475,2 t) 1,03 % (247,9 t) 3,70 % (1.086,6 t) 0,98 % (286,4 t)
2,62 % (634,3 t) 0,49 % (117,4 t) 3,03 % (888,1 t) 0,47 % (137 t)
5,17 % (1.249 t) 3,71 % (899,8 t) 3,24 % (950,0 t) 1,65 % (483,2 t)
China
China
Vietnam
USA
USA
Vietnam
Korea
France
82,44 % (19.900 tonnes) Singapore 85,13 % (24.970 tonnes)
Korea
Other EU States
UK
Germany
Germany
Others
Others
Figure 12: Import Trend For Deep Cycle Batteries in Pakistan
24 – Value Chain Analysis of the Solar PV Market in Pakistan4.6.3 Import Trend for Inverters from Different
Countries
Chinese inverters have the highest share of imports
in Pakistan, which has increased between 2014
and 2016, as can be seen in Figure 13 below. The
reasons behind this dynamic are the same as in the
case of import of the other PV components, i.e. price
competitiveness with similar products from other
countries, extensive dealership networks and a large
variation in product quality/pricing, which caters to
different economic classes of customers.
Oct 2014 – Sept 2015 Oct 2015 – Sept 2016
2,58 % (47,9 MW) 2,16 % (40,1 MW)
2,55 % (39,5 MW) 3,17 % (58,9 MW) 2,13 % (39,5 MW)
China 4,21 % (78,3 MW) 7,28 % (135,1 MW)
20,46 % (317,1 MW)
UAE 6,93 % (128,8 MW)
UK
Germany
Finland China
Others Germany
Finland
UAE 71,54 % (1.328,8 MW)
65,01 % (1.007,4 MW)
Other EU States
2,86 % (44,3 MW)
UK
6,01 % (93,2 MW)
Italy
3,11 % (48,1 MW)
Others
Figure 13: Import Trend for Inverters in Pakistan
Value Chain Analysis of the Solar PV Market in Pakistan – 254.6.4 Import Trend for Charge Controllers from
Different Countries
A high proportion of Chinese charge controllers are
being imported into the country, with the same rea-
sons behind this dynamic as those already cited
above for the other PV components. The overall
volume of charge controllers imported from Germany
has increased by 0.92% over the last year (October
2015-September 2016), although there has been a
minor decrease in the market share as can be seen
in Figure 14 below.
Oct 2014 – Sept 2015 Oct 2015 – Sept 2016
2,41 % (17,5 MW)
3,35 % (19,6 MW) 2,60 % (18,9 MW) 2,04 % (14,8 MW)
4,47 % (26,2 MW) 6,72 % (39,4 MW) 5,96 % (43,2 MW) 5,83 % (42,3 MW)
China
Germany
USA
China 36,03 % (211,1 MW) Italy 38,78 % (237,7 MW)
7,02 % (50,9 MW)
Germany 23,58 % (138,1 MW) Other EU States
19,37 % (140,5 MW)
USA UAE
Singapore Turkey
25,86 % (151,5 MW) 21,98 % (159,4 MW)
Italy Sweden
Others Others
Figure 14: Import Trend for Charge Controllers in Pakistan
26 – Value Chain Analysis of the Solar PV Market in PakistanYou can also read