Cramlington Housing Needs Assessment 2016 - Northumberland ...
←
→
Page content transcription
If your browser does not render page correctly, please read the page content below
Cramlington

                    Housing Needs Assessment

                                            2016

                  Northumberland County Council
                    Cramlington Town Council

                                     Final Report
                                       October 2016

Main Contact:       Dr Michael Bullock
Email:              michael.bullock@arc4.co.uk
Telephone:          0800 612 9133
Website:            www.arc4.co.uk
         4
© 2016 arc Limited (Company No. 06205180)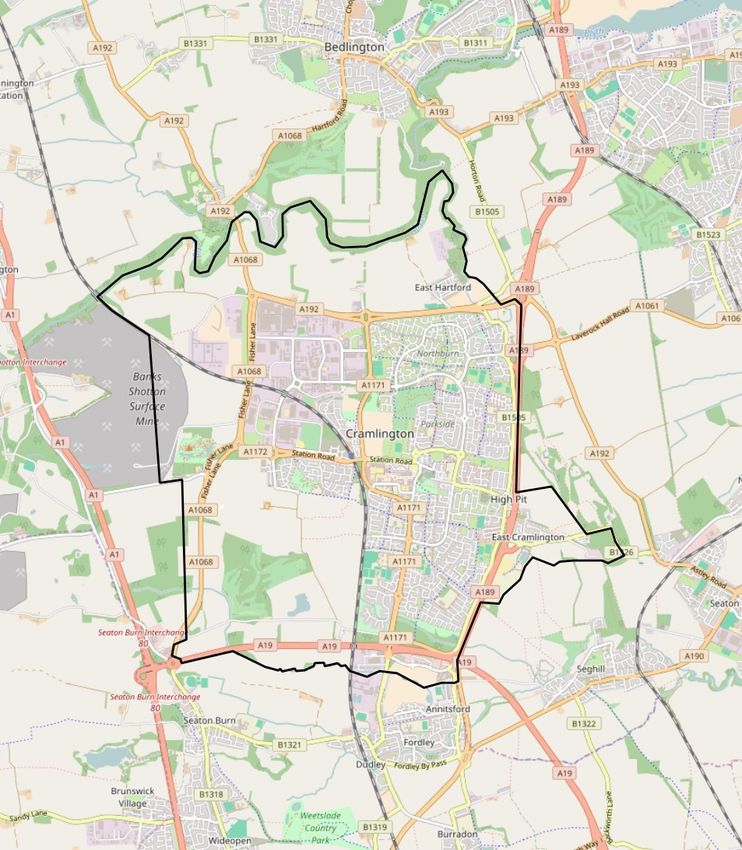
Cramlington 2016 HNA – Final Report                                                                                    Page | 2

Table of Contents
1.      Introduction..................................................................................................... 6
        Background and objectives .............................................................................. 6
        National Planning Policy Framework (NPPF) requirements ............................. 6
        Definitions ......................................................................................................... 7
        Geography ........................................................................................................ 8
        Research methodology ................................................................................... 10
        Presentation of data ....................................................................................... 10
        Report structure .............................................................................................. 10
2.      Policy and strategic review.......................................................................... 12
        Introduction ..................................................................................................... 12
        Local strategic priorities .................................................................................. 12
        Concluding comments .................................................................................... 14
3.      Housing market dynamics in Cramlington ................................................. 16
        Introduction ..................................................................................................... 16
        Dwelling profile ............................................................................................... 16
        Housing tenure ............................................................................................... 17
        Owner-occupied sector ................................................................................... 18
        Private rented sector ...................................................................................... 19
        Affordable sector ............................................................................................ 21
        Household characteristics .............................................................................. 21
        Migration and moving patterns ....................................................................... 22
        Concluding comments .................................................................................... 24
4.      Housing need, affordable housing requirements and relative
        affordability ................................................................................................... 25
        Introduction ..................................................................................................... 25
        Current households in need............................................................................ 25
        Affordable housing requirements .................................................................... 27
        Relative affordability of housing options ......................................................... 29
        Concluding comments .................................................................................... 35
5.      Future housing market demand in Cramlington ........................................ 36
        Introduction ..................................................................................................... 36
        Suggested future development profile of market dwellings ............................ 36
        Executive housing .......................................................................................... 37
        Self-Build ........................................................................................................ 39
        Housing for older people ................................................................................ 39
        Householder views on dwelling requirements ................................................ 41
        Summary ........................................................................................................ 43
6.      Conclusions .................................................................................................. 44
        Housing market profile .................................................................................... 44

October 2016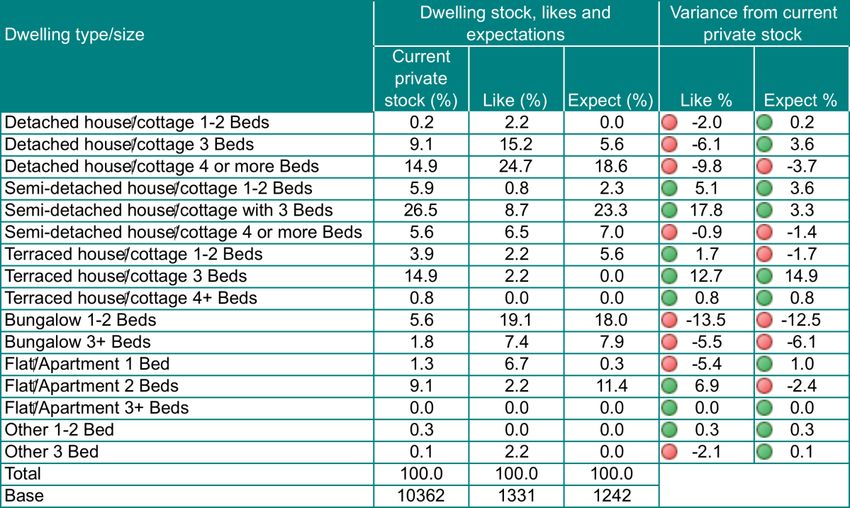
Cramlington 2016 HNA – Final Report                                                                                   Page | 3

        Need for affordable housing ........................................................................... 44
        Future housing market demand ...................................................................... 45
        The ageing population and specialist need .................................................... 46
        Final comments .............................................................................................. 46
Introduction to Technical Appendices .................................................................. 47
Technical Appendix A: Research Methodology ................................................... 48
Technical Appendix B: Policy Review ................................................................... 50
Technical Appendix C: Housing need calculations ............................................. 64
Technical Appendix D: Stakeholder survey findings ........................................... 76
Technical Appendix E: Monitoring and updating ................................................. 81

List of Tables
Table 3.1        House prices 2010-2015 ...................................................................... 18
Table 3.2        Lower Quartile and median house price and income required to be
                 affordable ............................................................................................. 19
Table 3.3        Private sector rental prices 2010-2015 ................................................ 20
Table 3.4        Local Housing Allowance Rates 2016 (Weekly) .................................. 20
Table 3.5        Residential mobility – movement between different tenures ................ 23
Table 3.6        First choice destination of households planning to move in next five
                 years .................................................................................................... 24
Table 4.1        Housing need in Cramlington ............................................................... 26
Table 4.2        Housing need by tenure ....................................................................... 27
Table 4.3        Housing need by household type ......................................................... 27
Table 4.4        Annual affordable housing imbalance by property size and
                 designation 2016/17 to 2020/21(including affordable capacity) ........... 28
Table 4.5        Tenure preferences of existing households in need and newly-
                 forming households requiring affordable housing ................................ 29
Table 4.6        Property type preferences.................................................................... 29
Table 4.7        Cost of alternative tenure options ........................................................ 30
Table 4.8        Income required for alternative tenure options..................................... 30
Table 4.9        Assumptions in assessing income required for alternative tenure
                 options ................................................................................................. 31
Table 4.10       Percentage of households who could/could not afford the tenure
                 option ................................................................................................... 33
Table 5.1        Open market dwelling stock and preferences ...................................... 37
Table 5.2        Summary of open market dwelling stock and preferences................... 37
Table 5.3        High income household dwelling aspirations and expectations ........... 38
Table 5.4        Older persons’ housing options ........................................................... 40

October 2016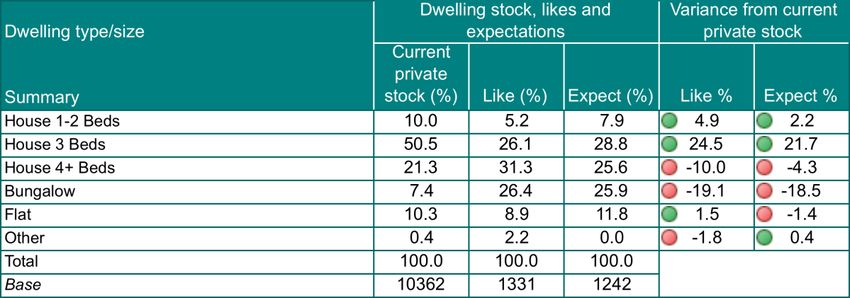
Cramlington 2016 HNA – Final Report                                                                            Page | 4

Table 5.5       Dwelling aspirations and expectations of households containing a
                HRP aged 65 or over ........................................................................... 41
Table 5.7       Residents’ views on dwelling requirements ......................................... 43
Table A1        Household Survey sample information ................................................ 48
Table A2        Unweighted sample information obtained ............................................ 49
Table A3        Weighted sample information for reporting .......................................... 49
Table C1        CLG Needs Assessment Summary for Cramlington ............................ 66
Table C2        Summary of current housing need across Cramlington ....................... 67
Table C3        Lower quartile house prices (2015) ...................................................... 69
Table C4        Annual affordable imbalance 2016/17 to 2020/21................................ 73
Table C5        Affordable tenure preferences ............................................................. 74
Table C6        Ability of existing households in need and newly-forming
                households requiring affordable housing to afford intermediate
                tenure dwellings ................................................................................... 74
Table C7        Property type preferences.................................................................... 75

List of Figures
Figure 3.1      Cramlington: tenure profile of occupied dwellings ................................ 17
Figure 4.1      Cramlington household income and housing costs .............................. 32

List of Maps
Maps 1.1 and 1.2         Cramlington context maps ........................................................... 9

October 2016
Cramlington 2016 HNA – Final Report Page | 5 Please note that in this report some of the tables include rounded figures. This can result in some column or row totals not adding up to 100 or to the anticipated row or column ‘total’ due to the use of rounded decimal figures. We include this description here as it covers all tables and associated textual commentary included. If tables or figures are to be used in-house then we recommend the addition of a similarly worded statement being included as a note to each table used. This report takes into account the particular instructions and requirements of our client. It is not intended for and should not be relied upon by any third party and no responsibility is undertaken to any third party. 4 arc Limited accepts no responsibility or liability for, and makes no representation or warranty with respect to, the accuracy or completeness of any third party information (including data) that is contained in this document. October 2016
Cramlington 2016 HNA – Final Report                                                   Page | 6

1. Introduction

           Background and objectives
1.1        A comprehensive Housing Needs Assessment (HNA) covering the parish of
           Cramlington has been commissioned by Northumberland County Council and
           Cramlington Town Council to provide an up-to-date evidence base to help
           shape the future planning and housing policies and strategies for the area.
1.2        As set out in the project brief, the HNA is intended to supplement the
           Northumberland Strategic Housing Market Assessment (SHMA)(October 2015),
           which was also prepared by arc4, and the earlier SHMA of December 2014.
           While the SHMA documents provide evidence at the County and Delivery Area
           level, the HNA provides parish-level data analysis to inform planning and
           housing policies at a more local level. In particular, the HNA will provide the
           evidence to assist in the formulation and implementation of housing policies
           contained in the emerging Cramlington Neighbourhood Plan and the
           implementation of policies in the emerging Northumberland Core Strategy.
1.3        The HNA supports the requirements of the National Planning Policy Framework
           (NPPF, March 2012) and Planning Practice Guidance, Housing and economic
           development needs assessments (last updated February 2016). This HNA
           includes a review of housing market dynamics, housing need, affordable
           housing requirements and future housing market demand.

           National Planning Policy Framework (NPPF) requirements
1.4        The National Planning Policy Framework (NPPF) was published in March 2012
           and sets out the Government’s planning policies for England and how these are
           expected to be applied.
1.5        Paragraph 159 of the NPPF states that Local Planning Authorities should have
           a clear understanding of housing needs in their area and they should prepare a
           Strategic Housing Market Assessment (SHMA) to assess their full housing
           needs. The SHMA should identify the scale and mix of housing and the range
           of tenures that the local population is likely to need over the plan period.
1.6        Planning Practice Guidance (PPG), Housing and economic development needs
           assessments, states that housing needs should be assessed in relation to the
           relevant functional area i.e. Housing Market Area and this may identify smaller
           sub-markets with specific features and it may be appropriate to investigate
           these specifically in order to create a detailed picture of local need. It is also
           important to recognise that there are 'market segments' i.e. not all housing
           types have the same appeal to different occupants1.
1.7        Paragraph 47 of the NPPF makes it clear that local planning authorities should
           "use their evidence base to ensure that their Local Plan meets the full
           objectively assessed needs for market and affordable housing". Supplementing
           the evidence of the SHMA, this HNA for Cramlington will provide more detailed

1
    Paragraph: 008 Reference ID: 2a-008-20140306

October 2016
Cramlington 2016 HNA – Final Report Page | 7
local evidence to help the Councils "plan for a mix of housing based on current
and future demographic trends, market trends and the needs of different groups
in the community" and will help them to "identify the size, type tenure and range
of housing that is required in particular locations, reflecting local demand"
(NPPF para 50).
Definitions
1.8 Planning Practice Guidance, Housing and economic development needs
assessments, defines need for housing at paragraph 3 as:
“the scale and mix of housing and the range of tenures that is likely to be
needed in the housing market area over the plan period – and should cater for
the housing demand of the area and identify the scale of housing supply
necessary to meet that demand”2.
1.9 For the purposes of this study, the term housing need refers to “the housing
that households are willing and able to buy or rent, either from their own
resources or with assistance from the state”3.
1.10 Definitions relating to affordable housing have been revised in the National
Planning Policy Framework (NPPF, March 2012):
Affordable Housing: Social Rented, Affordable Rented and Intermediate
Housing, provided to eligible households whose needs are not met by the
market. Eligibility is determined with regard to local incomes and local house
prices. Affordable housing should include provisions to remain at an
affordable price for future eligible households or for the subsidy to be
recycled for alternative affordable housing provision.
Social Rented housing is owned by local authorities and private Registered
Providers (as defined in Section 80 of the Housing and Regeneration Act
2008), for which guideline target rents are determined through the national
rent regime. It may also be owned by other persons and provided under
equivalent rental arrangements to the above, as agreed with the local
authority or with the Homes and Communities Agency.
Affordable Rented housing is let by local authorities or private Registered
Providers of social housing to households who are eligible for Social Rented
housing. Affordable Rent is subject to rent controls that require a rent of no
more than 80% of the local market rent (including service charges, where
applicable).
Intermediate Housing is homes for sale and rent provided at a cost above
Social Rent, but below market levels subject to the criteria in the Affordable
Housing definition above. These can include shared equity (shared
ownership and equity loans), other low cost homes for sale and Intermediate
Rent, but not Affordable Rented housing.
2
Paragraph: 003 Reference ID: 2a-003-20140306
3
Planning Advisory Service Objectively Assessed Need and Housing Targets Advice Note July 2015
October 2016Cramlington 2016 HNA – Final Report Page | 8
Homes that do not meet the above definition of Affordable Housing, such as
“low cost market” housing, may not be considered as Affordable Housing for
planning.
1.11 Note that these definitions are subject to possible change in the forthcoming
revisions to NPPF (anticipated to be published in Autumn 2016), particularly in
the light of the requirement to provide Starter Homes under the provisions of
the Housing and Planning Act 2016.
Geography
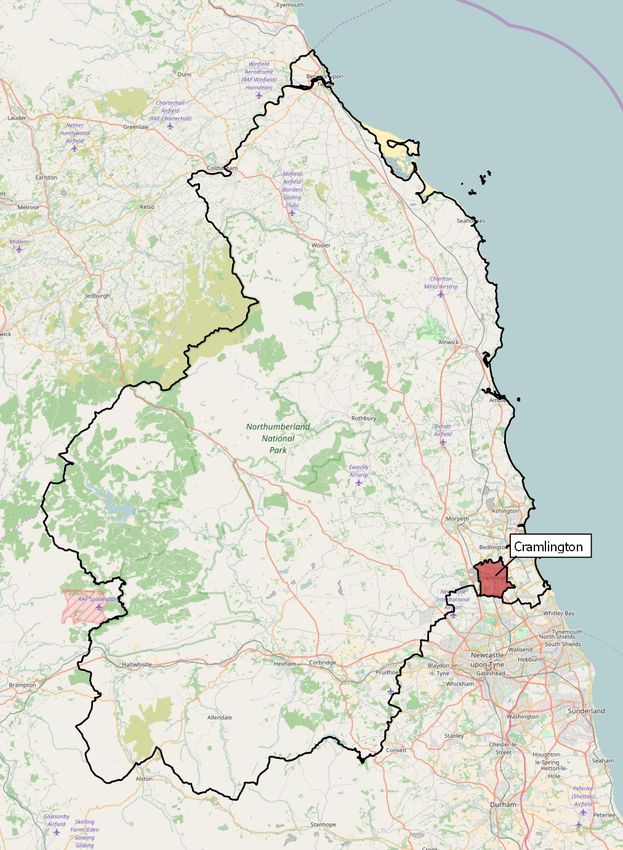
1.12 Maps 1.1 and 1.2 illustrate the geographical context of Cramlington.
October 2016Cramlington 2016 HNA – Final Report Page | 9 Maps 1.1 and 1.2 Cramlington context maps October 2016
Cramlington 2016 HNA – Final Report Page | 10
Research methodology
1.13 To deliver the 2016 HNA, a multi-method approach was adopted, which
comprised:
A sample survey of households across Cramlington parish. A total of 2,650
households were contacted and 512 questionnaires were returned and used
in data analysis. This represents a 19.3% response rate overall;
A review of relevant secondary data including the 2011 Census, house price
trends, CORE lettings data and CLG Statistics; and
An online questionnaire of key stakeholders, with six separate responses
obtained from representatives from the County Council, the Town Council,
housing associations and a community action group.
1.14 Further information on the research methodology is presented at Appendix A.
1.15 Please note that the stakeholder feedback reported in this document is based
on the comments received from people engaging with the research. As only six
stakeholders responded to the online survey, their views and feedback have
been included in Appendix D, rather than within the main body of the report.
Presentation of data
1.16 Data presented in this report is based on the 2016 Household Survey carried
out as part of the Housing Needs Assessment unless otherwise stated.
1.17 It is important to note that survey responses have been weighted to correct for
response bias and then grossed up to reflect the total number of households
and this process is explained in Appendix A. The 512 responses are therefore
weighted and grossed up to 12,688 occupied dwellings4. All survey information
presented in this report is for weighted and grossed responses which are
rounded up where appropriate.
1.18 Household survey data is available down to postcode level and for the
purposes of this report, data has been presented for the parish of Cramlington.
Report structure
1.19 The Cramlington 2016 HNA report is structured as follows:
Chapter 2 reviews the national and regional policy context within which the
research needs to be positioned;
Chapter 3 reviews the current housing market dynamics;
Chapter 4 considers current households in need, affordable housing
requirements and a consideration of the relative affordability of different
tenures;
4
2016 Council Tax data
October 2016Cramlington 2016 HNA – Final Report Page | 11
Chapter 5 looks at housing market demand and provides a suggested
future development profile and a consideration of different market sectors
including housing for older households; and
Chapter 6 concludes the report with a summary of findings and a
consideration of strategic issues.
1.20 The report includes a substantial technical appendix, which provides detailed
material that underpins the core outputs of the HNA. The technical appendix
material includes:
General methodology (Appendix A);
Policy review (Appendix B);
Housing need calculations (Appendix C);
Stakeholder survey findings (Appendix D); and
Monitoring and updating (Appendix E).
October 2016Cramlington 2016 HNA – Final Report Page | 12
2. Policy and strategic review
Introduction
2.1 The purpose of this chapter is to set out the policy and strategic context for
housing delivery in Cramlington.
2.2 Under the previous Coalition Government, the five years 2010-2015 saw a
radical and sustained programme of reform of welfare, housing and planning
policy, set within the context of national austerity and an economic policy of
deficit reduction and public spending cuts. These reforms championed localism,
decentralisation and economic growth.
2.3 Since the election of a majority Conservative Government in May 2015 further
welfare reforms have been accompanied by policies seeking to increase the
rate of housebuilding and promoting home ownership as the tenure of choice.
The recent passing of the Housing and Planning Act 2016 has put in place the
legislative structure for implementing some of the Government’s key policies,
including Starter Homes, restrictions on lifetime tenancies and ‘Pay to Stay’.
2.4 The recent outcome of the EU referendum and subsequent leadership changes
within Government will clearly have an impact on the further evolution of
economic, planning and housing policies in England. A detailed national policy
review is presented at Appendix B.
Local strategic priorities
North East Local Enterprise Partnership and Combined Authority
2.5 The abolition of regional development agencies and the creation of local
enterprise partnerships were announced as part of the June 2010 Government
Budget. Local authorities and business leaders were invited to submit proposals
to replace regional development agencies in their areas with Local Enterprise
Partnerships (LEPs). In October 2010, 24 bids were announced, establishing
LEPs aimed at overseeing economic growth and job-creation in their relevant
areas. There are now 39 partnerships, set up to be the key bodies determining
strategic economic priorities for their areas, driving economic growth and local
job creation.
2.6 Northumberland County lies within the North East Local Enterprise Partnership,
which also includes the local authority areas of Newcastle, Gateshead, North
Tyneside, South Tyneside, Sunderland and Durham. The LEP is a
public/private partnership that brings together the public sector and partners
from business and higher education to ‘create growth’ across the area.
2.7 Whilst the LEP has no statutory land use planning powers, it is responsible for
determining local economic priorities and undertaking activities to drive
economic growth and local job creation.
2.8 The North East LEP is working “to make the North East a place where more
businesses invest, grow and prosper, to deliver more and better jobs for
everyone.” The LEP is responsible driving the delivery of the North East’s
Strategic Economic Plan, which is broken down into six key themes:
October 2016Cramlington 2016 HNA – Final Report Page | 13
Innovation;
Business support and access to finance;
Skills;
Economic assets and infrastructure;
Employability and inclusion; and
Transport and connectivity.
2.9 Alongside the creation of the North East LEP, the seven authorities have also
created the North East Combined Authority, a new legal body that has statutory
status. This brings together the seven councils with the following joint objective:
“Our ambition is to create the best possible conditions for growth in jobs,
investment and living standards, to make the North East an excellent location
for business, to prioritise and deliver high quality infrastructure and to enable
residents to raise their skill levels and to benefit from economic growth long into
the future.”
“To deliver these aims we have united to speak with one voice to Government,
business, investors and partners.”
Northumberland County strategies and plans
2.10 The Council’s Housing Strategy for Northumberland 2013-2018 outlines its
plans for meeting people’s housing need by delivering new affordable housing,
maintaining and improving the existing housing stock, and through providing
housing support to people who need it. The Strategy has three priorities:
Affordable and quality housing;
Healthy people; and
Sustainable local economies and communities.
2.11 In terms of planning policy, Northumberland County Council is preparing a
Local Plan (Core Strategy) which will provide the overarching planning
policies to guide future development. A Pre-Submission Draft was published for
public consultation in October 2015. Amendments to the document have been
made, to address some of the issues raised during the consultation, and the
Proposed Major Modifications have been subject to further consultation during
June and July 2016.
2.12 Providing existing and future communities with a choice of decent, affordable
homes is one of the Plan’s strategic objectives. It is proposed in the Major
Modifications (June 2016) that the Local Plan Policy 15 (Housing Provision –
scale and distribution) makes the following provisions:
“To ensure that housing development helps to support the plan to positively
grow and diversify the Northumberland economy and meet housing need, the
Core Strategy will:
A. Provide for the delivery of at least 24,320 additional net dwellings over the
plan period (1,216 per annum), distributed as follows:
October 2016Cramlington 2016 HNA – Final Report Page | 14
Delivery Area Average Annual Net Total Delivery over
Dwelling Provision Plan Period (2011-
2031)
South East 642 12,840
Northumberland
Central Northumberland 297 5,940
North Northumberland 210 4,190
West Northumberland 68 1,350
B. In accordance with Policy 3, the majority of housing development will be
focused in Northumberland's Main Towns and Service Centres. Table 6.2
provides a realistic but indicative scale and distribution of housing across
each Delivery Area. The Northumberland Delivery Document and
Neighbourhood Plans will allocate land in accordance with this distribution.”
2.13 Table 6.2 (Indicative scale and distribution of housing) sets out housing
numbers for the 25 ‘small areas’ that together make up the four Delivery Areas
in Northumberland. Cramlington is identified as one of the ‘Main Towns’ in the
South East Northumberland Delivery Area. Table 6.2 includes an allocation of
3,820 houses to Cramlington during the plan period (191 per annum).
2.14 Paragraph 6.16A explains that:
“In the preparation of the Core Strategy, evidence base work divided the
County into 25 'small areas' comprising of one or more parishes. The housing
numbers presented in Table 6.2 refer to the small areas rather than just the
settlements listed. However, within each small area, it is expected that the
majority of development will be focused upon the larger settlement(s) and in
sustainable locations.”
2.15 The Cramlington Neighbourhood Plan is being prepared by a steering group,
formed by Cramlington Town Council. Under the new neighbourhood planning
provisions, first introduced by the Localism Act 2011, neighbourhood plans can
be prepared to give local residents, businesses, landowners and developers a
direct say in the direction of future development of their area. In this case, the
Neighbourhood Area comprises the parish of Cramlington.
2.16 The vision and objectives of the plan have been agreed by the steering group
and evidence gathering is underway, to guide the planning policy development.
A draft Pre-Submission Plan document will be published for community
consultation later in 2016.
Concluding comments
2.17 The previous Coalition Government had established its housing and planning
priorities within the context of local decision making and accountability, reduced
capital expenditure on housing, fundamental changes to welfare, a changing
role for social rented housing, and a need for future housing investment to
support economic growth. It is likely that this direction of travel will continue,
October 2016Cramlington 2016 HNA – Final Report Page | 15
with the Conservative Government’s legislative programme prioritising
measures to increase access to home ownership, further reduce welfare
spending, control immigration and assist devolution to cities.
2.18 The importance of having robust and up-to-date information to help inform
decision making at local authority level is evermore essential. In the context of
future uncertainties, particularly relating to the economic climate post-
referendum, this Housing Need Assessment for Cramlington provides the
Councils with an excellent range of material to inform policy decisions.
October 2016Cramlington 2016 HNA – Final Report Page | 16
3. Housing market dynamics in Cramlington
Introduction
3.1 Planning Practice Guidance, Housing and economic development needs
assessments (last updated February 2016) states that housing needs should be
assessed in relation to the relevant functional area i.e. Housing Market Area
and this may identify smaller sub-markets with specific features and it may be
appropriate to investigate these specifically in order to create a detailed picture
of local need5.
3.2 It is within this policy context that this HNA is being undertaken to investigate
the housing market in Cramlington in more detail. The purpose of this chapter is
to explore the housing market dynamics of Cramlington focusing on the current
stock profile, house prices and rent and household characteristics.
3.3 The analysis is based on the findings of the 2016 Household Survey and a
range of secondary data. In addition, relevant findings from the stakeholder
online survey are set out within this chapter.
3.4 Cramlington is a town and civil parish located within Northumberland in the
North East of England. An important airbase in the First World War,
Cramlington remained relatively rural in nature until it became a ‘New Town’ in
1964 and large areas were developed as housing estates.
3.5 The emerging Northumberland Local Plan (Core Strategy) identifies
Cramlington as one of the ‘main towns’ in the South East Northumberland
Delivery Area.
3.6 The resident population of Cramlington is 29,4136. There is a total of 12,534
households across the parish7.
3.7 The household survey data has been weighted based on 12,688 occupied
dwellings (2016 Council Tax data).
Dwelling profile
Dwelling type
3.8 The 2016 Household Survey found that 78.0% of occupied dwellings are
houses (38.2% semi-detached, 19.9% detached and 19.9% terraced), 12.1%
are flats/maisonettes, 9.6% are bungalows and 0.3% are other property types.
3.9 These findings are similar to those of the 2011 Census, which identifies that the
majority (87.1%) of households live in houses, of which 39.0% are semi-
detached, 27.9% are terraced and 20.2% are detached. 12.9% of households
live in flats, maisonettes or apartments and 0.1% live in other housing types.
5
Paragraph: 008 Reference ID: 2a-008-20140306
6
2011 Census (age data)
7
2011 Census (household type, tenure data)
October 2016Cramlington 2016 HNA – Final Report Page | 17
Property size and age
3.10 The Household Survey found that 49.5% of dwellings have three bedrooms,
25.8% have two bedrooms, 17.6% have four or more bedrooms and 7.1% have
one bedroom/bedsit.
3.11 In terms of property age, only 17.6% of the accommodation in Cramlington was
built before 1965, while 61.8% was built between 1968 and 1984; a further
20.6% has been built from 1985 onwards. This reflects the designation of
Cramlington as a New Town in the mid-1960s, and the rapid development that
followed.
Housing tenure
3.12 In terms of tenure, the Household Survey identified that 72.0% of dwellings are
owner-occupied, 9.6% are privately rented (including tied accommodation),
18.3% are social rented and 0.1% are intermediate tenure. This is broken down
into further detail in Figure 3.1.
3.13 These findings compare well with 2011 Census data, which indicates that
72.0% of occupied dwellings are owner-occupied, 9.6% are private rented
(including tied accommodation or living rent free), 18.0% are social rented and
0.3% are intermediate tenure dwellings.
Figure 3.1 Cramlington: tenure profile of occupied dwellings
0.0% 5.0% 10.0% 15.0% 20.0% 25.0% 30.0% 35.0% 40.0% 45.0%
Owned (no mortgage) 39.1%
Owned (with mortgage) 32.9%
Rented Privately (furnished) 0.7%
Rented Privately (unfurnished) 8.9%
Rented from a HA or the Council 18.3%
Shared Ownership etc 0.0%
Tied accommodation 0.0%
Source: 2016 Household Survey
October 2016Cramlington 2016 HNA – Final Report Page | 18
Owner-occupied sector
3.14 The 2016 Household Survey found that 72.0% (8,875) of households across
Cramlington are owner-occupiers. 39.1% of all households (4,965) own outright
and 32.9% of all households (4,180) have a mortgage.
3.15 The Household Survey provides the following information on owner occupied
stock:
Most owner-occupied properties are houses, with 27.4% detached, 38.5%
semi-detached and 18.4% terraced; a further 8.2% are bungalows, 7.0%
flats/maisonettes and 0.4% other property types;
51.6% of properties have three bedrooms, 24.4% have four or more
bedrooms, 23.1% have two bedrooms and 0.9% have one bedroom;
Around 1.8% of owner-occupied stock was built pre-1919, 11.4% was built
between 1919 and 1964; 62.5% was built between 1965 and 1984 and
24.2% has been built since 1984;
89.6% of owner-occupier households are satisfied or very satisfied with the
state of repair in their accommodation, 5.7% are neither satisfied nor
dissatisfied and 4.7% expressed degrees of dissatisfaction.
3.16 Over the six-year period 2010 to 2015, Land Registry data reveals that lower
quartile, median and average (mean) house prices across Cramlington have all
risen, although there has been some fluctuation in the case of lower quartile
and median prices. Average (mean) house prices experienced a steadier
trajectory, with year-on-year price increases from £130,781 in 2010 to £146,236
in 2015. By 2015, the median house price was £135,500 and the lower quartile
price was £94,000. This is summarised in Table 3.1.
Table 3.1 House prices 2010-2015
Price (£)
Year Lower
Median Mean No. Sales
quartile
2010 85,000 118,000 130,781 242
2011 83,970 122,000 133,659 275
2012 93,000 132,995 136,527 293
2013 89,000 122,250 134,479 330
2014 100,000 133,998 144,188 392
2015 94,000 135,500 146,236 360
Source: Data produced by Land Registry © Crown copyright 2016
3.17 It is interesting to note that in 2010, a household income of £21,857 was
required for a lower quartile price to be affordable; by 2015 this had increased
to £24,171 (Table 3.2). Similarly, an income of £30,343 was required for a
median priced property to be affordable in 2010 compared with £34,843 in
2015. This indicates that house prices in Cramlington have become less
affordable during the period.
October 2016Cramlington 2016 HNA – Final Report Page | 19
Table 3.2 Lower Quartile and median house price and income required to be
affordable
House Price (£) Income to be affordable*
Cramlington 2010 2015 2010 2015
Lower Quartile 85,000 94,000 21,857 24,171
Median 118,000 135,500 30,343 34,843
Source: Data produced by Land Registry © Crown copyright 2016
*Assuming a 3.5x income multiple and a 10% deposit is available
3.18 A range of socio-economic and demographic information on residents has been
obtained from the 2016 Household Survey. Some interesting observations
relating to owner-occupiers include:
In terms of household type, 27.9% of owner occupiers are older (65 or over)
singles and couples, 20.5% are couples (under 65 with no children), 23.1%
are couples with children under 18, 14.5% are singles (under 65), 11.3% are
parent(s) with adult children, 1.9% are lone parents with children under 18
and 0.8% are other household types;
57.9% of Household Reference People (Heads of Household) living in
owner occupied dwellings are in employment and a further 37.1% are wholly
retired from work;
21.8% of owner occupied households receive less than £15,600 gross per
year, 32.8% receive between £15,600 and £26,000 per year and 45.4%
receive at least £26,000 per year; and
In terms of length of residency, 41.9% of owner occupiers have lived in the
same property for 20 years or more.
Private rented sector
3.19 The 2016 Household Survey indicates that the private rented sector
accommodates around 9.6% (1,213) of households across Cramlington. Of
these households, 1,124 rent unfurnished properties, 85 rent furnished
accommodation and 4 rent with their job (tied accommodation).
3.20 The Household Survey found that most private rented properties (63.4%) are
houses (of which 35.2% are semi-detached, 28.2% are terraced); a further
35.4% are flats/maisonettes, 0.9% are bungalows and 0.3% are other types of
property.
3.21 7.9% of privately rented properties have one bedroom/bedsit, 35.4% have two
bedrooms and 56.7% have three bedrooms;
3.22 The characteristics of tenants are diverse and the Household Survey revealed
that in particular the private rented sector accommodates couples with children
under 18 (48.8%), singles under 65 (27.9%), lone parents with children under
18 (13.9%), older singles and couples (65+)(2.1%) and other household types
(7.3%).
October 2016Cramlington 2016 HNA – Final Report Page | 20
3.23 36.0% of private renting households have lived in their accommodation for less
than two years and 56.0% have lived in their accommodation for less than five
years.
3.24 In terms of income, the Household Survey found that 24.2% of privately renting
households receive less than £15,600 gross per year, 38.2% receive between
£15,600 and £26,000 per year and 37.5% receive at least £26,000 per year,
indicating that the private rented sector tends to accommodate lower income
households.
3.25 91.1% of Household Reference People (Heads of Household) living in private
rented accommodation are employed, 1.9% are wholly retired from work and
7.0% are unemployed and available for work;
3.26 Table 3.3 summarises the lower quartile, median and mean private sector
rental prices over the period 2010-2015. Over the six-year period, the annual
average rents fluctuated around a lower quartile of £420-429 per month, a
median of £451-494 per month and a mean of £481-499 per month.
Table 3.3 Private sector rental prices 2010-2015
Price per calendar month (£)
Year Lower
Median Mean No. Rentals
quartile
2010 425 466 496 246
2011 429 494 499 254
2012 425 451 489 407
2013 425 477 490 271
2014 420 451 481 410
2015 425 451 494 411
Source: Zoopla 2016
3.27 Table 3.4 sets out the Local Housing Allowance Rates that are applicable to
private renting households in Cramlington. Local Housing Allowance is used to
work out how much housing benefit you can get if you rent your home from a
private landlord.
Table 3.4 Local Housing Allowance Rates 2016 (Weekly)
No. Bedrooms Northumberland (Local Authority)
Shared room rate £65.65
One room £74.15
Two rooms £87.45
Three rooms £103.56
Four rooms £138.08
Source: VOA, August 2016
October 2016Cramlington 2016 HNA – Final Report Page | 21
Affordable sector
3.28 The 2016 Household Survey found that there are around 2,330 households
who live in an affordable (social rented or shared ownership) property across
Cramlington, accounting for 18.3% of all occupied dwellings. Of these, 2,326
households live in accommodation rented from a Housing Association or
Registered Provider and 4 live in shared ownership properties (intermediate
tenure).
3.29 The Household Survey identified that houses account for 60.7% of occupied
affordable accommodation (38.9% semi-detached, 21.2% terraced and 0.6%
detached), 19.3% are bungalows and 20.0% are flats/maisonettes. Affordable
dwellings tend to have one/bedsit (31.2%), two (31.3%) or three (37.6%)
bedrooms;
3.30 The Household Survey found that 28.3% of households living in affordable
dwellings are singles under 65, 25.2% are older singles and couples (65+),
12.6% are couples under 60 with no children, 4.9% are couples/lone parents
with adult children, 15.7% are couples with children under 18, 12.6% are lone
parents with children under 18 and 0.6% are other household types.
3.31 32.8% of Household Reference People living in affordable housing are in
employment. 23.6% are wholly retired from work, 17.9% are permanently
sick/disabled, 14.3% are unemployed and 10.7% look after the home/are caring
for someone.
3.32 Incomes are generally low, with 67.7% receiving an income of less than
£15,600 gross per year and 30.0% receiving less than £7,800 gross per year.
3.33 The Housing and Planning Act 2016 includes a requirement that registered
providers should uprate the rents of households earning over £31,000 (or
£40,000 in London). Only taxable income will be assessed, some tenants on
benefit would be exempted. The thresholds will be reviewed annually and
uprated in line with the Consumer Price Index. There has not been time
nationally to assess the precise implications of the compromise clause that
emerged between the Lords and Commons.
Household characteristics
3.34 The 2016 Household Survey found that one-quarter (24.9%) of households in
the study area are older singles or couples (65 years or more); 8.2% are single
adults, 24.2% are couples with children under 18, 16.7% are couples with no
children, 9.0% are couples/lone parents with adult children, 5.0% are lone
parents with children under 18 and 1.3% are other household types.
3.35 The Household Survey identified that 26.5% of households across the study
area are single-person households; 38.1% include two people, 16.9% three
people, 15.0% four people and 3.4% five or more people. This means that
64.7% of households comprise of either one or two people.
3.36 In terms of the age of the Household Reference Person (HRP), the Household
Survey reveals that 22.2% are 16-39 years, 38.1% are 40-59 years, 32.4% are
60-74 years and 7.4% are 75+ years.
October 2016Cramlington 2016 HNA – Final Report Page | 22
3.37 In terms of socio-economics, 57.0% of HRP are in employment, 31.3% are
retired, 3.7% are permanently sick or disabled, 4.1% are unemployed, 3.8% are
looking after the home or a carer and 1.8% were in full-time education. 37.0%
of households across the study area have an income of less than £15,600 per
annum, 29.7% receive between £15,600 and £26,000 and 33.3% receive over
£26,000.
3.38 The Household Survey asked how much households pay for their rent or
mortgage. 52.3% pay under £100 per week; 41.7% pay £100-200 per week;
and 6.0% pay £200 or more per week. 22.4% of households are fairly
concerned about their ability to pay their rent or mortgage; a further 7.3% are
very concerned.
3.39 The Household Survey found that 6.6% of occupied dwellings across
Cramlington have been adapted or purpose-build for a person with a long-term
illness, health problem or disability.
3.40 83.9% of households are satisfied or very satisfied with their neighbourhood as
a place to live; 8.2% are neither satisfied or dissatisfied; and 7.9% expressed
degrees of dissatisfaction of whom 1.4% were very dissatisfied.
Migration and moving patterns
Out-migration
3.41 The 2016 Household Survey asked whether, in the preceding five years,
anyone in the household had moved away from the Cramlington area due to
difficulties in findings a suitable home locally. 3.9% (482 households) said that
this had happened within their household. Of the moving household members,
32.9% had moved to elsewhere in Northumberland and 67.1% had moved
outside of Northumberland.
3.42 In terms of reasons for moving, lack of affordable housing and to take up work
elsewhere were the two reasons mentioned the most.
In-migration and movement within Cramlington
3.43 The 2016 Household Survey indicated that around 30.6% (3,885 households)
had moved home in the preceding five years. Of these households, 57.0%
(2,214 households) originated within Cramlington and 43.0% (1,671
households) originated from outside the area. Many moved from elsewhere in
Northumberland or Tyne and Wear, including 5.2% from Ashington.
3.44 Information from the Household Survey relating to households moving within
and into Cramlington, within the preceding five years includes:
A majority (67.4%) moved into a house, particularly semi-detached (42.8%),
terraced (16.6%) and detached (8.0%), 20.0% moved into a
flat/apartment/maisonette, 12.4% into a bungalow and 0.1% into another
type of property;
October 2016Cramlington 2016 HNA – Final Report Page | 23
Almost half (47.9%) moved into properties three bedrooms, 42.2% moved
into properties with one or two bedrooms and 9.9% moved into properties
with four or more bedrooms;
47.1% moved into owner occupied properties, 28.9% moved into private
renting and 24.1% moved into affordable (social rented/intermediate tenure)
dwellings;
Couples with children under 18 accounted for 38.0% of moving households;
25.6% were single adults (under 65); 14.9% were younger couples with no
children (under 65); 8.5% were older households (over 65); 8.5% were lone
parents; 2.0% were couples/lone parents with adult children; and 2.5% were
other households;
93.3% of in-migrant Household Reference People (Heads of Household)
were aged under 65 years and 6.7% were aged 65 or over;
The majority of Heads of Household of in-migrant households were in
employment (71.3%) with a further 10.1% unemployed, 8.2% retired, 6.2%
looking after the home or caring for someone, 3.9% permanently
sick/disabled and 0.4% in full-time education;
26.1% of households had an annual income of less than £15,600 per
annum; 30.7% had an income of between £15,600 and £26,000 per annum;
and 43.1% had an income of at least £26,000 per annum;
6.6% of moving Heads of Household in employment worked in Cramlington
and 93.4% worked outside the study area.
3.45 Table 3.5 reviews the tenure choices of households moving within and into
Cramlington, within the preceding 5 years, based on data from the 2016
Household Survey. The majority of those moving remain in the same tenure,
with 68.7% of those in affordable accommodation, 67.4% of those in owner
occupied properties and 66.6% of those in private rented housing staying in the
same tenure. Respondents who had previously lived with family and friends (i.e.
newly forming households) tended to move into owner occupation (70.3%).
Table 3.5 Residential mobility – movement between different tenures
Previous Tenure
Previously
Social/ living with
Affordable Private family/friend
Current Tenure Owned Rented Rented s Total
Owned 67.4 0.0 31.8 70.3 47.9
Social/Affordable 13.7 68.7 1.5 29.7 20.3
Private Rented 18.9 31.3 66.6 0.0 31.8
Total 100.0 100.0 100.0 100.0 100.0
Base (Valid responses) 1814 553 908 246 3522
Source: 2016 Household Survey
October 2016Cramlington 2016 HNA – Final Report Page | 24
Households planning to move
3.46 The 2016 Household Survey found that around 2,283 households plan to move
in the next five years. The main reasons for planning to move were the need for
either a larger or smaller property. Most of those planning to move were of
working age, with only 2.0% aged 65 or over, but 62.8% aged 45-64.
3.47 Table 3.6 summarises the moving intentions of households based on the first
preference they stated in the Household Survey. Overall, 60.7% of households
intend on remaining in Cramlington and 39.3% intend to move out.
3.48 Of the 39.3% of households planning to move out, the Household Survey found
that 23.5% were planning to move to elsewhere in Northumberland and 15.8%
were planning to move outside Northumberland.
Table 3.6 First choice destination of households planning to move in next five
years
Destination % stating as first preference
Within Cramlington
North East Cramlington 28.1
South East Cramlington 19.5
West Cramlington 13.1
Total within Cramlington 60.7
Outside Cramlington
Elsewhere in Northumberland 23.5
Outside Northumberland 15.8
Total outside of Cramlington 39.3
Source: 2016 Household Survey
Concluding comments
3.49 The purpose of this chapter has been to consider the general housing market
dynamics of Cramlington and its inter-relationships with other areas. By
reviewing the dwelling profile, house prices and rents, household characteristics
and movements, a picture of the market dynamics of Cramlington emerges.
3.50 In summary, the 2016 Household Survey found that 72.0% of dwellings are
owner-occupied, 9.6% are privately rented (including tied accommodation),
18.3% are social rented and 0.1% are intermediate tenure.
3.51 Analysis of house prices over the past five years indicates that there has been
an increase in prices, meaning that accessing owner-occupation has been
more unaffordable in recent years. On the other hand, private rental prices have
been relatively static over the same five-year period.
3.52 The Household Survey identified that around 30.6% of households had moved
house in the past five years. Of these, 57.0% originated within the study area,
and 43.0% from outside the study area. Most moved into the private housing
sector, with around 47.1% moving into owner occupation and 28.9% into private
renting.
October 2016Cramlington 2016 HNA – Final Report Page | 25
4. Housing need, affordable housing requirements
and relative affordability
Introduction
4.1 This Chapter considers housing need and affordable housing requirements
within Cramlington. Primary and secondary data sources have been used to
assess existing housing need across all households in the study area. There is
also a full analysis of how housing need varies by tenure and household type.
4.2 The affordable housing requirements arising are set out, including a suggested
tenure split (between social/affordable rented and intermediate/shared
ownership) and a consideration of existing and newly-forming households’
property type preferences.
4.3 In addition, there is a consideration of the relative affordability of different
tenures, including Starter Homes.
Current households in need
4.4 A robust and defensible assessment of housing need is essential for the
development of affordable housing policies. Housing need is defined in NPPG
as:
‘The number of households and projected households who lack their
own housing or live in unsuitable housing and who cannot afford to
meet their housing needs in the market’’8.
4.5 The 2016 Household Survey and a range of secondary data provide the robust
and transparent evidence base required to assess housing need across the
Cramlington area. This is presented in detail at Appendix C of this report and
follows CLG modelling guidance.
4.6 Across Cramlington there are 870 existing households in need which
represents 6.9% of all households. Reasons for housing need are summarised
in Table 4.1.
8
DCLG, NPPG, Housing and economic development needs assessments, paragraph 22
October 2016Cramlington 2016 HNA – Final Report Page | 26
Table 4.1 Housing need in Cramlington
No. of Households
Category Factor in Need
Homeless households N1 Under notice, real threat of notice or
or with insecure tenure lease coming to an end 114
N2 Too expensive, and in receipt of
housing benefit or in arrears due to 117
expense
Mismatch of housing N3 Overcrowded according to the
need and dwellings 'bedroom standard' model 116
N4 Too difficult to maintain 250
N5 Couples, people with children and
single adults over 25 sharing a kitchen,
83
bathroom or WC with another household
N6 Household containing people with
mobility impairment or other special needs 171
living in unsuitable accommodation
Dwelling amenities and N7 Lacks a bathroom, kitchen or inside
condition WC and household does not have 11
resource to make fit
N8 Subject to major disrepair or unfitness
and household does not have resource to 142
make fit
Social needs N9 Harassment or threats of harassment
from neighbours or others living in the
187
vicinity which cannot be resolved except
through a move
Total no. households in need (with one or more housing needs) 870
Total Households 12,688
% households in need 6.9%
Note: A household may have more than one housing need.
Source: 2016 Household Survey
4.7 Tables 4.2 and 4.3 demonstrate how the proportion of households in housing
need varies by tenure and household type for Cramlington. Private renters are
more likely to be in housing need, at around one-fifth (21.8%) of households;
along with lone parent with one or two children (15.9%), couples with one or
two children (12.4%) and lone parents with adult children (9.2%).
October 2016Cramlington 2016 HNA – Final Report Page | 27
Table 4.2 Housing need by tenure
No. H'holds % H'holds Total no.
Tenure in need in need households
Owner Occupier 445 4.9 9,147
Private Rented 265 21.8 1216
Affordable 160 6.9 2,326
Cramlington Total (All households in need) 870 6.9 12,689
Source: 2016 Household Survey
Table 4.3 Housing need by household type
%
No. H'holds H'holds Total no.
Household Type in need in need households
Single Adult (under 65) 142 6.1 2326
Single Adult (65 or over) 27 2.6 1041
Couple only (both under 65) 87 4 2170
Couple only (one or both over 65) 67 3.2 2122
Couple with 1 or 2 child(ren) under 18 330 12.4 2663
Couple with 3 or more children under 18 29 7.2 404
Couple with child(ren) aged 18+ 44 5.2 843
Lone parent with 1 or 2 child(ren) under 18 101 15.9 636
Lone parent with 3 or more children under 18 0 0 0
Lone parent with child(ren) aged 18+ 29 9.2 316
Other type of household 14 8.3 168
Cramlington Total (All households in need) 870 6.9 12,689
Source: 2016 Household Survey
Affordable housing requirements
4.8 A detailed analysis of the following factors determines overall affordable
housing requirements:
Households currently in housing which is unsuitable for their use and who
are unable to afford to buy or rent in the market (backlog need);
New households forming who cannot afford to buy or rent in the market;
Existing households expected to fall into need;
The supply of affordable housing through social renting and intermediate
tenure stock.
4.9 The needs assessment model advocated by the CLG has been used and
detailed analysis of each stage of the model is presented at Appendix C. In
addition to establishing the overall affordable housing requirements, analysis
considers the supply/demand variations by property designation (i.e. general
needs and older person) and property size (number of bedrooms). Analysis
provides a gross figure (absolute shortfalls in affordable provision) and a net
figure (which takes into account supply of existing affordable accommodation).
Modelling suggests an annual gross imbalance of 126 dwellings and after
October 2016Cramlington 2016 HNA – Final Report Page | 28
taking account of affordable supply an annual net imbalance of 22 affordable
dwellings across Cramlington as shown in Table 6.5.
Table 4.4 Annual affordable housing imbalance by property size and designation
over 5 years 2016/17 to 2020/21(including affordable capacity)
Housing Need (per annum)
Number of Affordable
Designation Bedrooms Gross Supply Net
General Needs 1 24 28 -4
2 48 40 7
3 40 28 12
4+ 0 2 -2
Older Person 1 2 3 -1
2+ 11 2 10
Total 126 104 22
Note: This does not include new build supply
Sources: 2016 Household Survey; RP CORE Lettings and Sales
4.10 In terms of the size of affordable housing required, the gross need is split by
smaller general needs one/two bedrooms (57.1%), general needs three or more
bedroom (31.7%) and older person two bedrooms (10.3%). It is therefore
appropriate for the continued delivery of affordable housing to reflect underlying
need.
4.11 Analysis is based on the next five years and in the absence of any updated
information this could be extrapolated forward to the Local Plan period.
Tenure split
4.12 In terms of the split between social rented and intermediate tenure products,
the 2016 Household Survey identified tenure preferences of existing and newly-
forming households and also the extent to which intermediate tenure products
could be afforded.
4.13 Table 4.5 indicates that existing households in need mainly considered
social/affordable renting as a preferred tenure option but newly-forming
households had a stronger preference for Starter Homes and intermediate
tenure options.
October 2016You can also read