Authority Monitoring Report 2019/20 - MERTON COUNCIL futureMerton - www.merton.gov.uk
←
→
Page content transcription
If your browser does not render page correctly, please read the page content below
MERTON COUNCIL
futureMerton

2019/20
Authority Monitoring Report

www.merton.gov.uk
AMR 2019/20

       Contents

1.      Introduction ............................................................................................................................ 2
2.      Planning policy updates and Local Development Scheme .......................................... 3
3.      Merton in Numbers ............................................................................................................... 6
4.      Housing ................................................................................................................................. 15
     Starts, completions, five year supply and trajectory .............................................................. 15
     Merton’s Annual Position Statement ....................................................................................... 22
     Change of use from office to homes ....................................................................................... 32
     Affordable housing .................................................................................................................... 36
     Conversions, housing sizes and appeals ............................................................................... 38
5.      Local Economy .................................................................................................................... 42
     Retail vacancy rate, town centres and industrial areas ......................................................... 42
     Industrial market in Merton....................................................................................................... 46
6.      Local Environment ............................................................................................................. 55
     Climate, Biodiversity and conservation management............................................................ 55
     Flood risk management ............................................................................................................ 57
7.      Local Infrastructure ............................................................................................................ 59
     Community infrastructure levy and planning obligations ....................................................... 59
     Planning Obligations................................................................................................................. 59
     Transport and Public Realm .................................................................................................... 62
     Road Maintenance.................................................................................................................... 64
Appendix A: Housing trajectory list of sites ......................................................................... 65

                                                                                                                                                       1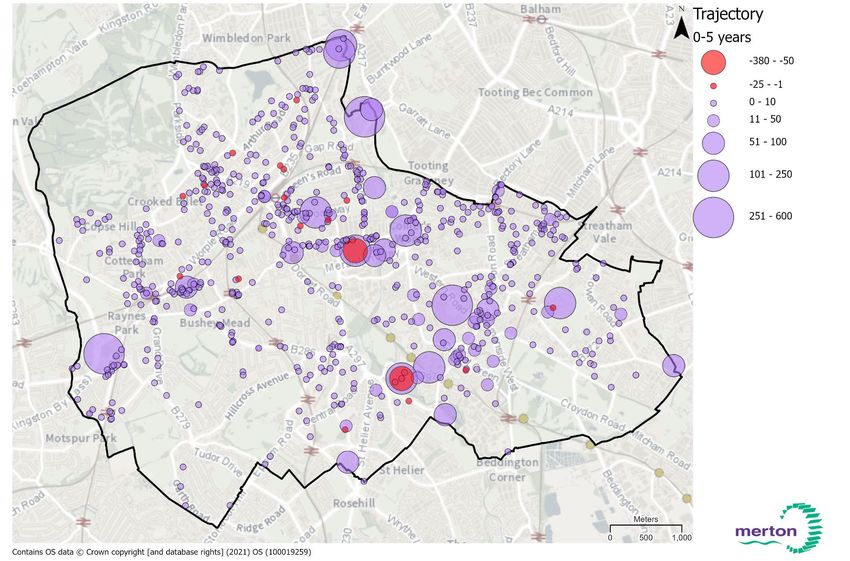
AMR 2019/20
1. INTRODUCTION
1.1. Every local planning authority is required to publish an Authority Monitoring Report (AMR)
each year containing information on the implementation of the Local Development Scheme
(LDS), and the extent to which the planning policies set out in the Local Plan documents are
being achieved including the five year supply of housing developments.
1.2. This monitoring report covers the financial year 2019/20 (1st April 2019 to 31st March 2020)
Events that take place outside this time period may be referred to but will be monitored in
previous or subsequent reports.
1.3. This report is produced on the light of the following legislation:
National Planning Policy Framework (NPPF) published on 27 March 2012
National Planning Practice Guidance (regularly updated and web-based)
Localism Act came into force in 2011 and Part 6, section 113 amended the Planning and
Compulsory Purchase Act 2004 in respect of the requirements for producing Annual
Monitoring Reports and;
Part 8 of the Town and Country Planning Regulations 2012.
1.4. To collate information covering the range of topics in Merton’s Local Plan the monitoring
report relies on a variety of data sources. Some of them are listed below (please note this is
not an exhaustive list):
Merton’s Monitoring Datastore (including housing monitoring database, commercial
monitoring database, conversions monitoring database, appeals database and so on);
London Development Database;
Office for National Statistics;
Merton’s reports from other departments (Joint Strategic Needs Assessment-JSNA,
draft Schools Places Strategy, Housing Strategy and so on);
NOMIS
Housing Register and;
DCLG Statistics
2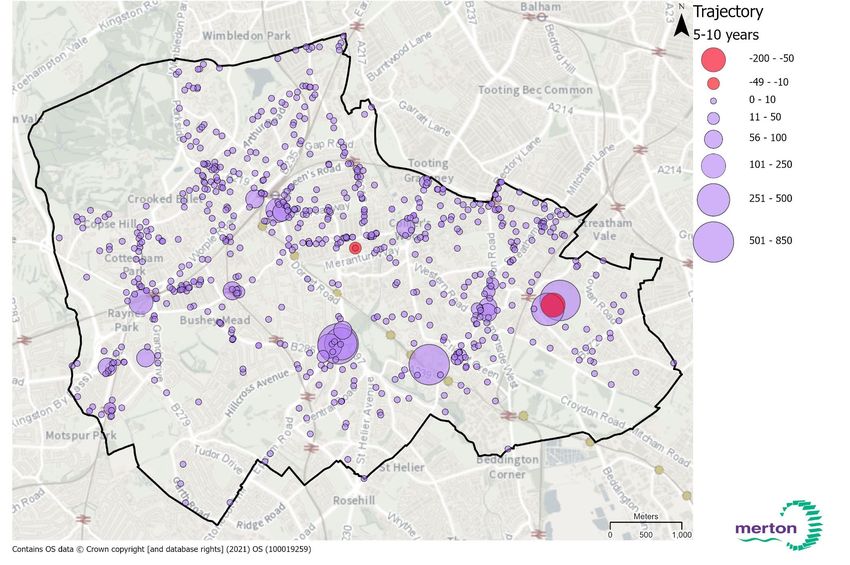
Planning policy updates and LDS AMR 2018/19
2. PLANNING POLICY UPDATES AND LOCAL DEVELOPMENT SCHEME
Headlines
Sites and Policies Plan and Policies map adopted in July 2014
New Local Plan Stage 2a Consultation 13 November 2020 – 1 February 2021,
submission to Inspectorate July 2021
Submission version of the draft South London Waste Plan published for comments from 4
September 2020 until 22 October 2020
Future Wimbledon SPD Adopted at Full Council 18 November 2020
Morden town centre regeneration: the council and TfL are working together to bring
forward the regeneration of Morden, working towards the procurement of a development
partner in 2021/2022
2.1. This section presents the progress towards the timetables and milestones of Merton’s statutory
Development Plan and other planning policy documents and reports. The Figure 2.1 presents the
relationships between all the planning frameworks.
2.2. Local Development Scheme is the project plan that sets out what documents are going to be produced
in the Local Plan, when they are going to be produced - including the stages of community consultation
- and some information on what they are likely to contain.
2.3. Statement of Community Involvement SCI: sets out how the council will involve communities,
businesses, and stakeholders in the preparation of development planning documents such as the Local
Plans and planning applications. It also gives advice on Neighbourhood Plans. In 2020, the council
adopted a new SCI. In October 2020, the council amended the SCI due to Covid-19 Restrictions in
accordance with the updated National Planning Guidance. The amendments are to protect the health
of our communities and staff, while still ensuring that the council can conduct its planning functions in a
manner underpinned by extensive and effective engagement.
2.4. Core Planning Strategy: sets out the strategic planning framework for the borough including the guiding
principles and objectives as well as the policies for delivering the spatial strategy and vision in Merton,
for 15 year period following its adoption on 13th July 2011.
2.5. Sites and Policies Plan and Policies Map: sets out the general approach to development, the use of
land and buildings in the borough and provides guidance for development control to support the
effective delivery of planning decisions in Merton. It also allocates sites for specific future land uses or
developments. Sites and Policies Plan was adopted on 9th July 2014.
2.6. Estates Plan: The outline planning applications for Merton’s Estate Regeneration Projects comprising
of; High Path, Eastfields and Ravensbury Estate have been granted permission with s106 signed and
completed on 29th April 2019. The reserved matters application for High Path Estate Regeneration
Phase 2 was granted permission at Planning Applications Committee on 26th September 2019. Further
phased applications for High Path Estate will be submitted once detailed designs have been
progressed and discussed at pre-planning application meetings with the Local Planning Department
and independent design experts (Design Review Panel). The reserved matters application for
Ravensbury Estate Regeneration Phases 2 – 4 was also granted permission at Planning Applications
Committee on 14th November 2019.
We anticipate the early phases for Reserved Matters Applications for Eastfields Estate Regeneration to
be submitted and planning application process to commence this autumn 2021. Further Reserved
Matters Applications for High path Phase 3 are likely to commence this spring 2021.
3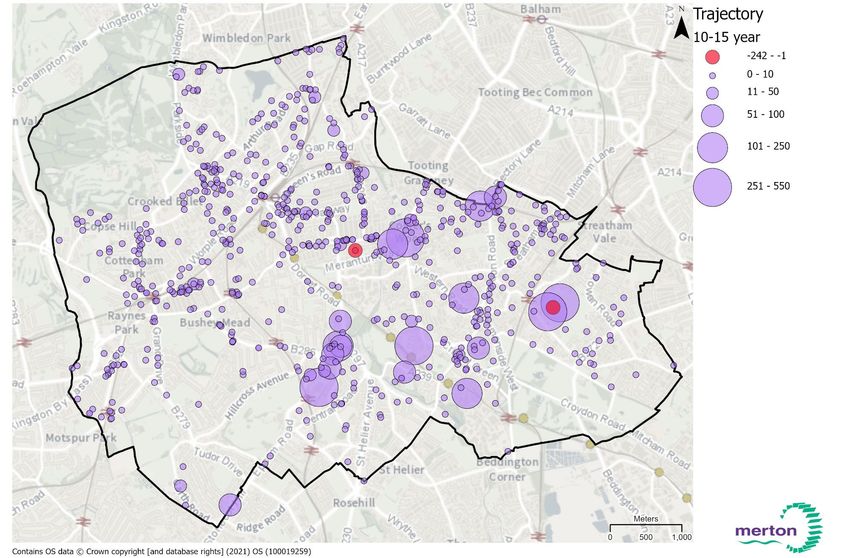
Merton in Numbers                                                                             AMR 2018/19

      Phase 1 of High Path and Ravensbury are completed in 2020/21 and existing residents will start to
      move into them so the development for Phase 2 can be started.

  2.7. Community Infrastructure Levy charges ‘£ per sqm’ for new residential and retail
       warehouse/superstore floorspace. It is a levy on development that local councils across the country
       including Merton, and the Mayor of London are implementing to help pay for infrastructure. Merton’s
       CIL Charge applies to new development granted permission from 1 April 2014, in addition to the Mayor
       of London's CIL which has been applicable to new development since April 2012.

  2.8. South London Waste Plan sets out the issues and objectives to be met in waste management for the
       next ten years. It is a joint DPD and covers the geographical area comprising the London Borough of
       Croydon, the Royal Borough of Kingston upon Thames, the London Borough of Merton and the London
       Borough of Sutton. It contains policies to guide the determination of planning applications for waste
       facilities and identifies existing waste sites to be safeguarded and areas where waste facility
       development may be suitable. SLWP was adopted in March 2012.

      The ‘submission version’ of the Draft South London Waste Plan was published for comments from 4
      September 2020 until 22 October 2020. The draft plan, which will cover the period 2021-2036,
      proposes that all the waste apportioned to the partner boroughs in the London Plan, can be managed
      on the existing safeguarded sites. The new plan is scheduled to be adopted in 2021.

  2.9. Supplementary planning documents (SPDs) add further detail to the policies in the Local Plan. They
       can be used to provide further guidance for development on specific sites, or on particular issues, such
       as design, shop fronts and basement development. SPDs do not create new polices.

 2.10. Authority Monitoring Reports: monitors the performance of Merton's planning policies and the extent to
       which the council meets targets set out in the LDS. Visit the website for the most recent updates.

 2.11. Morden town centre regeneration: Morden town centre regeneration is one of the biggest projects in the
       borough, following on from the 2015 announcement that Morden is one of the Mayor of London’s
       Housing Zones. Morden has been identified by both the council and Transport for London (TfL) as a
       strategic priority and will meet a number of objectives in the London Plan, Merton’s Local Plan and the
       Mayor’s Transport Strategy. The council and TfL are working together to bring forward the regeneration
       of Morden, working towards the procurement of a development partner in 2021/22.

 2.12. Future Wimbledon Supplementary Planning Document: has been prepared by to create a long-term
       vision for the future of development of Wimbledon town centre. It supplements Merton's existing
       planning policies to provide guidance for development, public spaces and to attract investment in
       SW19. The document was adopted by the council on 18 November 2020.

 2.13. New Local Plan: We are creating a new Local Plan to provide a sound basis for planning decisions.
       The plan will help guide how the borough develops over time and create a vision that enables the
       council to successfully and responsibly manage growth, while ensuring the best interests of the
       borough, its residents and businesses. The document has been out for Stage 2 consultation between
       31 October 2018 and 6 January 2019. There has been another Regulation 18 consultation 13
       November 2020 – 1 February 2021. The aim is for the new Local Plan to be adopted in 2022. Upon its
       adoption it will supersede the Sites and Policies Plan (2014) and the Core Strategy (2011).

                                                                                                            4
Merton in Numbers                                     AMR 2018/19

      Figure 2.1 Merton’s Planning Policy Framework

                                                                    5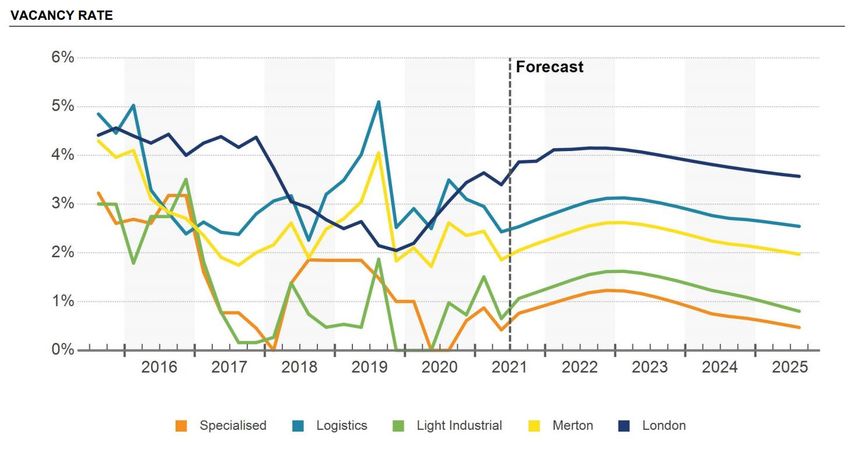
Merton in Numbers                                                                                AMR 2016/17

        3. MERTON IN NUMBERS
 3.1.   This chapter presents some key figures that enhance the readers’ understanding of the
        borough. For more data on Merton please visit the Merton Data Hub.

        Population
 3.2.   Merton’s population is projected to increase to 222,717 by 2025 and 232,473 by 2030. The
        age profile is also predicted to shift with a notable growth in the proportion of the population
        that are under the age of 16 and those over 50 years old. The number of households is
        projected to rise to 99,000 by 2021, an average annual household growth of 2.2%, with
        much of the increase expected to be in single person households.

 3.3.   Merton Council has agreed to use the Borough Preferred Option (BPO) for population
        projections instead of the GLA housing-led projection. This is because Merton’s housing
        target in the draft New London Plan increased from 411 new homes per annum to 918 new
        homes per annum and the GLA housing-led population projections take the higher housing
        target into account, even though the level of assumed development is much higher than
        Merton has delivered historically.

 3.4.   The Borough Preferred Option (BPO) population projections. These are calculated using
        our housing trajectory (published in the Authority Monitoring Report each year), which is
        considered to be the best estimate of assumed development in Merton.

                                                                                                               6
Housing                                                                                    AMR 2019/20

 3.5. Merton has a rich mix of ethnicity, culture, and languages. GLA data at 2020 puts Merton’s
      Black, Asian and Minority Ethnic (BAME) population as 78,390, meaning BAME groups
      make up just under 37% of the population.

      Housing
 3.6. In 2020 there are 85,440 households in Merton. The median house price in Merton in 2020
      is £475,000, the nineteenth highest in London. The average house price in London is
      £540,937. The ratio of house prices to earnings in Merton is 12.9, which is the twentieth
      highest in London and below the London average of 14.5.

                                                                                                         7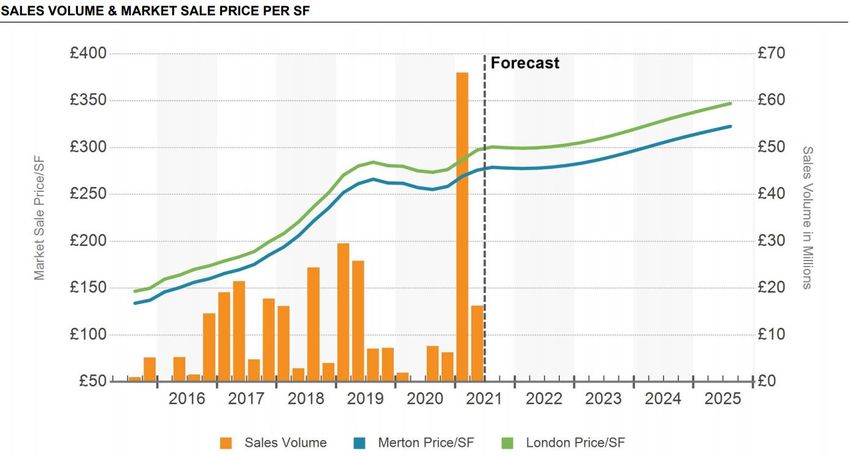
Housing                                                                                   AMR 2019/20

 3.7. 59.3% of households in the borough are owner occupied, either owned outright or with a
      mortgage. This is higher than the London average of 49.5%. In Merton 0.9% of residents are
      living in shared ownership properties, and 24.8% are privately rented through a private
      landlord or letting agency. In Merton 28.2% of households are social rented, with 3.7%
      rented from the council. This is lower than the London average of 24.1%. The rate of
      homeless priority in need persons in Merton is 1.4%, much lower than the London average
      of 4.2% and the third lowest of all of the London boroughs.

                                                                                                        8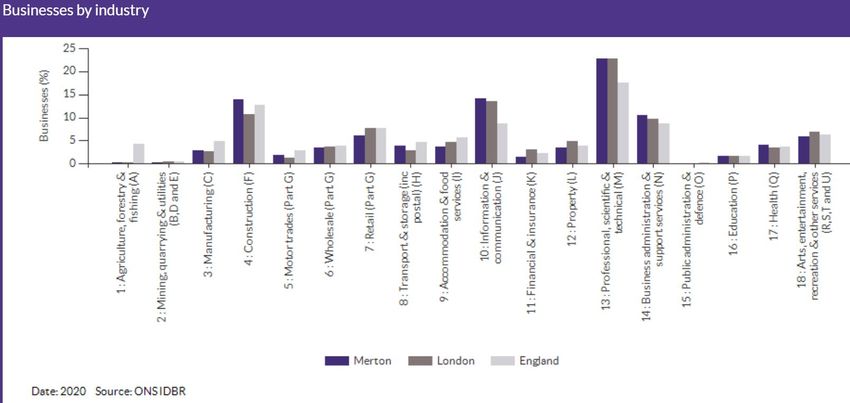
Housing                                                                                  AMR 2019/20

      Economy

 3.8. Served by 13,220 (2019) active businesses, the borough’s main commercial centres are
      Mitcham, Morden and Wimbledon, of which Wimbledon is the largest. Other smaller centres
      include Raynes Park, Colliers Wood, South Wimbledon, Wimbledon Park and Pollards Hill,
      each with well-developed characters of their own. The borough is predominantly suburban in
      character, with high levels of commuter flows in and out of central London.

                                                                                                       9
Housing AMR 2019/20
3.9. Merton has the third highest economic activity rate for persons aged 16-64 of all of the
London boroughs (86%). The employment rate for the borough as at September 2020 is
80.7%, higher than the London average of 75.2%. Unemployment in the borough is 6.2% in
September 2020, above the London average of 5%. The median gross annual pay for
residents in Merton as at 2020 is £32,197, slightly below the London average of £32,533.
10Housing AMR 2019/20
3.10. The percentage of persons in full time employment in Merton is 16.1%, lower than the
London average of 20%. Merton also has a higher proportion of residents who are self-
employed (13%) compared to the London average of 12.6% in September 2020. The
occupation type of Merton residents is shown below. The greatest proportion is 27.6%
professional occupations and 20.3% associate professional and tech occupations.
11Housing AMR 2019/20
3.11. As at December 2020, the monthly claimant rate for Merton is 7.3. This increased from 2.6 in
December 2019. The London average in December 2020 was 8.2. The overall economic
inactivity rate for persons aged 16-64 in Merton is 14% (September 2020).
12Housing AMR 2019/20
13Housing AMR 2019/20
Deprivation
3.12. The Index of Multiple Deprivation (IMD) 2019 is the official measure of relative deprivation
for small areas (or neighbourhoods) in England. The IMD ranks every small area (Lower
Super Output Area) in England from 1 (most deprived) to 32,844 (least deprived). For larger
areas we can look at the proportion of LSOAs within the area that lie within each decile.
Decile 1 represents the most deprived 10% of LSOAs in England while decile 10 shows the
least deprived 10% of LSOAs.
3.13. Merton ranks as ‘very low’ in terms of overall social deprivation compared to other London
boroughs and nationally in the UK. It is the sixth least deprived of the 33 London boroughs
and ranks 114th out of 326 authorities (where 1 is the most deprived) in England. This
overall lack of deprivation does, however, hide inequalities and extremes in the borough
between deprived wards in the east of the borough that are some of the top 15% most
income-deprived in the country, and the more affluent wards in the west that are amongst
the top 5% most affluent. Three wards are more deprived than the average for London:
Cricket Green, Figges Marsh and Pollards Hill.
Index of Multiple
Deprivation score 2019
14Housing AMR 2019/20
4. HOUSING
Headlines
375 additional new homes were built during the monitoring period
70 new affordable homes delivered on site. Average of 48.5% affordable housing delivered on
eligible sites.
Affordable housing was 19% of total housing delivery during the financial year 2019/20
Starts, completions, five year supply and trajectory
Core Strategy: To provide new homes and infrastructure within Merton’s town centres and
Strategic Objective residential areas, through physical regeneration and effective use of space.
3
Core Strategy CS8, CS9
Policies
Sites and Policies DM H1, DM H2, DM H3, DM H5
Plan Policies
Source of
Indicator Borough Target Progress
Information
NET ADDITIONAL For the 15 year period 2011-2026 Progress against this target is as Merton’s
HOUSING Merton’s minimum housing target follows: the total completed and Monitoring
COMPLETED (London Plan 2016) is 5,801 This projected: 8,439 homes (see Datastore
OVER THE PLAN is divided into: Table 4.1) and LDD
PERIOD:
2011-16 target: 1,691 new homes 2011-16 provision: 2,573 new
2011-2026 homes, 52% over the target
2016-21 target: 2,055 new homes
TOTAL OVER 15 2016-21 provision: 2,297 new
YEARS
2021-26: 2,055 new homes homes (delivered and projected),
12% over the target
For the 10 year period 2019/20- Merton’s housing trajectory for the
2028/29 Merton’s minimum period 2019/20-2028/29 has a
housing target (London Plan 2021) provision of 10,044 (delivered and
is 9,180 new homes projected), 9% over the target.
PRIOR In 2019/20 27 new homes were
APPROVALS the result of Prior Approvals from
Office and Retail uses to
Residential.
15Housing AMR 2019/20
SELF-BUILD The Act places a duty on certain During the financial year 2019/20
AND CUSTOM public authorities to keep a register the following number of
HOUSE of individuals and associations individuals and groups joined
BUILDING ACT who wish to acquire serviced plots Merton’s register:
2015 of land for self-build and custom
housebuilding projects. The Act Self-Build Register Part 1
also places duty on certain public (meets Local Connection
authorities to have regard to those criteria):
registers in carrying out planning 10 individuals and 2 groups
and other functions. Self-Build Register Part 2
(without Local Connection):
1 individuals
17 homes were granted self-build
exemption from Community
Infrastructure Levy (CIL) in the
financial year 2019/20
Brownfield land registers will 90 sites have been added to
BROWNFIELD
provide up-to-date and consistent Merton’s Brownfield Land
LAND REGISTER
information on sites that local Register. These include sites
authorities consider to be larger than 0.25 hectares or
appropriate for residential capable of supporting more than 5
development having regard to the homes, with valid planning
criteria set out in regulation 4 of permission that have not
the Town and Country Planning commenced, sites where planning
(Brownfield Land Register) permission has lapsed, and
Regulations 2017. allocations in Merton’s Sites and
Policies Plan (2014) and Merton’s
New Local Plan.
The Brownfield Land Register can
be found at
https://www.merton.gov.uk/planni
ng-and-
buildings/planning/brownfield-
land-register and via
https://maps.london.gov.uk/brownf
ield-site-register
16Housing AMR 2019/20
Table 4.1 – Home Completions 2004/5 – 2019/20
Financial Year No. of homes Target (London Plan) % of target
achieved
2004/05 987 430 230%
2005/06 791 430 184%
2006/07 427 430 -1%
2007/08 435 430 101%
2008/09 774 370 209%
2009/10 338 370 -9%
2010/11 357 320 -4%
2011/12 453 320 142%
2012/13 478 320 149%
2013/14 440 320 138%
2014/15 459 320 143%
2015/16 743 411 181%
2016/17 434 411 106%
2017/18 675 411 164%
2018/19 273 411 -34%
2019/20 375 411 --9%
Total 8,439 6,165 137%
4.1. Merton’s current housing target to meet its housing need is set by the adopted London Plan
(2016) which identifies Merton’s housing target of 411 homes per annum. The recently
adopted London Plan (adopted March 2021) increases Merton’s target to 9,180 homes over
ten years, averaged at 918 homes per year.
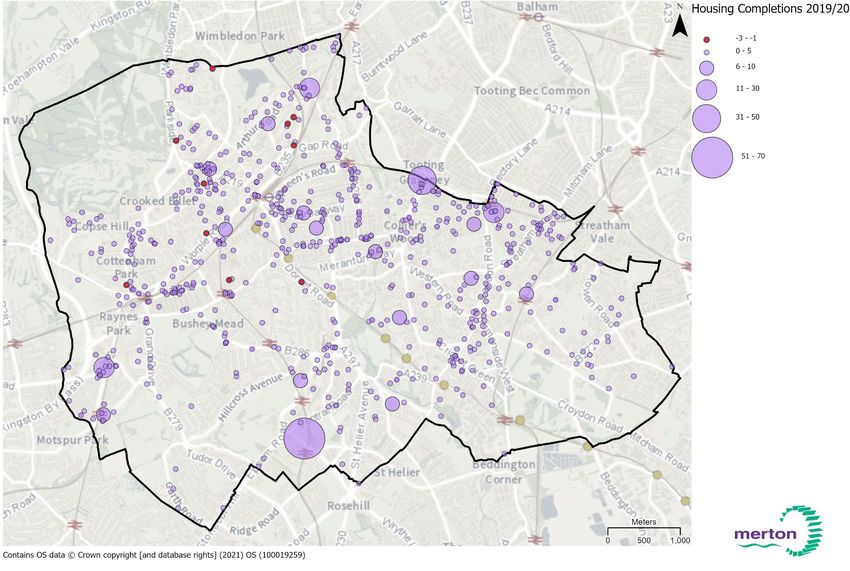
4.2. During the monitoring year 139 schemes have been completed resulting in 375 new homes
(Graph 4.1 and Figure 4.4). 73 schemes were started during the monitoring year, 34 of
which were started but not completed. Over the past 15 years circa 2,300 additional homes
have been built above the London Plan housing targets during that period (Graph 4.2).
Moreover 113 schemes that will provide 276 new homes have been approved during
2019/20 (Graph 4.3).
4.3. There are circa 500 sites in Merton’s housing trajectory which will deliver over 15,000 new
homes in the next 15 years (2021/22 to 2035/36).
4.4. The Methodology and phasing assumptions made in the trajectory are based on evidence
gathered during site visits and assumptions of completion timescales based on the size of
each site. For all sites their history from case officers and evidence from site visits precedes
all assumptions. Otherwise, for example, sites that commenced works in the 2020/21
financial year with 10 homes or less are assumed to be completed within the 2020/21
financial year.
4.5. Those with more than 10 homes are assumed to be completed in the 2020/21 financial year.
Sites that have not started have followed the same principles of timescale to completion but
have been pushed back another year. The development plan sites, (those identified in the
local plan but without a planning application), have been phased according to the knowledge
of case officers, developers, planning agents and the phasing of schemes of a similar size.
17Housing AMR 2019/20
The estates that are part of the Estates Regeneration follow phasing plans submitted by
Clarion Housing Group.
4.6. A detailed housing sites list of completions in 2019/20 and the 15 year housing trajectory is
presented in Appendix A. The list includes all the sites that currently informed the Merton’s
housing pipeline and the number of homes in the five year supply.
It should be noted that officers have not identified significant land banking of residential
permissions in Merton this year. Sites with planning permission for residential are being
progressed, there is no evidence to support the view that land banking is currently taking
place.
Graph 4.1 Home Completions 2004 - 2020
987
1000
Home Completions
900 Target
791 774
800 743
700 675
Number of homes
600
478
500
427 435
453 440 459 434
375
400 338 357
300 273
200
100
0
2004/05
2005/06
2006/07
2007/08
2008/09
2009/10
2010/11
2011/12
2012/13
2013/14
2014/15
2015/16
2016/17
2017/18
2018/19
2019/20
18Housing AMR 2019/20
Graph 4.2 Cumulative over-delivery against Merton's housing
target 2004-2020
9000 8439
Cumulative Completions Cumulative Target
8000
7000
6165
6000 5480
Number of homes
5000
3752 3790
4000
3000 2460
2000
987
1000
430
0
2004/05
2005/06
2006/07
2007/08
2008/09
2009/10
2010/11
2011/12
2012/13
2013/14
2014/15
2015/16
2016/17
2017/18
2018/19
2019/20
Graph 4.3 Merton approved schemes and total homes 2011-
2020
Approved Units (net gain)
1475
Approved Schemes
844
596 605
422 448 406
387
236 276
140 131 132 170 177
128 113
62
2011-12
2012-13
2013-14
2014-15
2015-16
2016-17
2017-18
2018-19
2019-20
19Housing AMR 2019/20
Figure 4.4: Merton housing completions 2019/20
20Housing AMR 2019/20
4.7. Housing Delivery Test
4.8. In February 2017 the Government published the Housing White Paper “Fixing our broken
housing market”, which proposed a new initiative to measure the performance of local
authorities via a Housing Delivery Test. This has been taken forward as part of the revised
National Planning Policy Framework (NPPF) that was published in July 2018.
4.9. Full details of the method for calculating the HDT are specified within the “Housing Delivery
Test Rule Book” and Planning Practice Guidance. The data used to assess delivery is
Ministry for Housing, Communities and Local Government (MHCLG) statistics for the total
net housing completions in a local planning authority area over a rolling three-year period.
This includes student accommodation and other communal accommodation, using a ratio to
adjust for occupancy.
4.10. The Housing Delivery Test measurement for 2019/20 taking into account delivery over the
past three financial years against the adopted London Plan housing target of 411 results in a
PASS with 107% of housing need delivered. This means that Merton is not required to
produce an Action Plan.
Table 4.5 Housing Delivery Test
Housing Delivery Test measurement 2019/20
2017/18 2018/19 2019/20 Total
Target 411 411 411 1,233 107%
Delivery 675 273 375 1,323 PASS
4.11. Policy DM H2 Housing Mix indicates the proportion of different sized homes required in the
borough as follows: 1–bed 33%, 2-bed 32% and 3-bed 35%. Of the homes delivered in
2019/20 30% were family sized (3+ beds), the data is shown below in Graph 4.6.
Graph 4.6 Size of new homes built in 2019/20
Studio
4+ bed 6%
15%
1 bed
3 bed 30%
15%
2 bed
34%
21Housing AMR 2019/20
Merton’s Annual Position Statement
4.12. The National Planning Policy Framework requires Councils to identify a supply of specific
‘deliverable’ sites sufficient to provide five years’ worth of housing with an additional buffer of
5% to provide choice and competition.
4.13. All of the sites included in Merton’s five-year land supply are considered to be deliverable
under the NPPF definition:
To be considered deliverable, sites for housing should be available now, offer a suitable
location for development now, and be achievable with a realistic prospect that housing will
be delivered on the site within five years. In particular:
a) sites which do not involve major development and have planning permission, and all sites
with detailed planning permission, should be considered deliverable until permission expires,
unless there is clear evidence that homes will not be delivered within five years (for example
because they are no longer viable, there is no longer a demand for the type of units or sites
have long term phasing plans).
b) where a site has outline planning permission for major development, has been allocated
in a development plan, has a grant of permission in principle, or is identified on a brownfield
register, it should only be considered deliverable where there is clear evidence that housing
completions will begin on site within five years.
4.14. Merton’s housing target, which is set out in the London Plan 2021, is 9,180 homes for the
ten-year period 2019/20 to 2028/29 or 918 homes per annum. This is based on a detailed
analysis of land availability and capacity across London that Merton worked with the GLA
and all other London boroughs. The London Plan expects 261 homes of the 918 homes per
annum to come forward on Small Sites.
4.15. In recognition of the significant increase in housing delivery required by these targets, the
London Plan states at paragraph 4.1.10, that these may be achieved gradually and
encourages boroughs to set a realistic and where appropriate, stepped housing delivery
target over a ten-year period. London Plan paragraph 4.1.11 states that if a target is needed
beyond the 10-year period (2019/20 to 2028/29), boroughs should draw on the 2017 SHLAA
findings which cover the period to 2041 and any local evidence of identified capacity and roll
forward the housing capacity assumptions applied in the London Plan for small sites.
4.16. In accordance with the London Plan requirements and in consultation with and endorsed by
the GLA, the housing trajectory set out in Graph 4.10 demonstrates how Merton’s housing
target will be met for the Local Plan period 2021/22 – 2035/36 using a stepped housing
delivery target. Merton’s housing trajectory is considered an appropriate approach for Merton
as it sets out a realistic picture of housing delivery over the Local Plan period. A stepped
housing delivery target is appropriate in Merton as there is a significant uplift in the level of
housing target between emerging and previous policies, and several large sites will be
delivered in phases.
4.17. Merton’s New Local Plan proposes an annual housing target of 775 homes per annum for
the period 2021/22 – 2023/24, and then increase to 1,080 for the period 2024/25 – 2026/27,
then further increase to 1,350 for the period 2027/28 – 2028/29. This ensures that Merton
will meet the housing need of 8,265 new homes in the London SHLAA (2018) for the period
2019/20 to 2028/29.
22Housing AMR 2019/20
4.18. In accordance with London Plan paragraph 4.1.11, Merton’s target for the period 2029/30 to
2035/36 (3,466 total) is drawn from the 2017 SHLAA findings. This sets a target for the
period 2029/30 to 2033/34 of 2,370 and for 2034/35 to 2035/36 of 1,096.
4.19. As at July 2021, Merton’s Local Plan production is between Regulation 18 and Regulation 19
and the proposed stepped trajectory approach has not been considered at examination,
which is required to confirm a five year land supply in accordance with the NPPF and
NPPG. Therefore, for monitoring purposes at this time the New London Plan target of
918 new homes will be used for the period 2021/22 to 2025/26.
4.20. The five-year supply covers the period from the financial years 2021/22 to 2025/26. The
target for the total number of new homes over this period is 4,590 homes. Merton can
demonstrate a supply of 5,027 new homes that will be built within the next five years.
Therefore Merton has 110% supply, equivalent of 5.5 years. The projected completions
against the 918 target are shown on an annual basis in Graph 4.7 and cumulatively in
Graph 4.8.
Graph 4.7 Five-year supply 2021-2026
1,400 1,304
1,200 1,159
Net additional homes
1,000 893 855 816
800
600
400
200
-
2021/22 2022/23 2023/24 2024/25 2025/26
Projected completions Target
Graph 4.8 Cumulative five-year supply 2021-2026
6,000
5,027
5,000
Net additional homes
4,000 3,723
3,000 2,564
2,000 1,748
893
1,000
-
2021/22 2022/23 2023/24 2024/25 2025/26
Projected completions Target
23Housing AMR 2019/20
4.21. To calculate the five-year supply of homes in Merton, the following sources of land supply
have been included:
4.22. Large identified sites (>0.25ha)
• Sites with planning permission;
• Sites where the principle of residential use has been established through previous
planning permissions or refusals that have registered new applications or lodged an
appeal;
• Suitable sites undergoing pre-application discussion and there is clear evidence that
housing completions will begin on site within five years;
• Council-owned sites with redevelopment potential within five years.
4.23. Small identified sites (Housing AMR 2019/20
Table 4.8: Sources of supply
Site status Net gain new homes % of supply
Permissioned and Started 1,384 28%
Permissioned and Not Started 1,670 33%
Submitted 230 5%
Pre-application 665 13%
Site allocation 295 6%
Small Sites assumption 783 16%
Total 5,027 100%
4.26. Merton’s 15 year Housing Trajectory is made up of a huge range of different types of
development on brownfield land. These include:
• Morden town centre regeneration, where over 1,800 new homes will be built in the area
in addition to the public realm improvements and the TfL’s plan for a new bus station in
Morden;
• The Estates Regeneration of Eastfields, High Path and Ravensbury, which will result in
an uplift of over 2,000 new homes, is also included in the trajectory;
• Wimbledon Stadium development, which will provide an additional 632 new homes;
• Benedict Wharf redevelopment, which will provide up to 850 new homes on a former
waste site;
• Small site development across the borough, such as change of use from commercial
spaces
4.27. Merton is a pro-growth borough and has substantial experience in delivering small sites over
a long timeframe and throughout different economic and political cycles. Every year,
between 85%-95% of Merton’s planning applications for new homes are for small sites (sites
of 10 homes or less). However, as each small site delivers fewer than 10 homes, small sites
contribute about 50% of the overall number of homes built each year in Merton, with large
sites (which make up usually less than 10% of the planning applications received)
contributing the other 50% of homes built.
4.28. Merton’s housing trajectory is supported by Merton’s Housing Delivery Test Actions Plan
which includes details on the actions the council can take to increase the rate and number of
homes built in Merton. The delivery of sites will be monitored in Merton’s Authority
Monitoring Report (AMR) and Merton’s Housing Delivery Test Action Plan.
4.29. The London Plan envisages that key town centres in the borough – Wimbledon, Mitcham,
Morden and Colliers Wood – offer ‘high’ potential for residential growth (Table A1.1), with
Wimbledon, Colliers Wood and South Wimbledon identified as an Opportunity Area which
25Housing AMR 2019/20
indicatively is expected to contribute 5,000 new homes and 6,000 jobs. The Opportunity
Area homes figure is based on the 2017 SHLAA capacity from 2019 to 2041.
4.30. Assessment of projected housing over the Local Plan period by locality, indicates as set out
in Graph 4.9 that the majority of residential growth and associated infrastructure and social
facilities will take place in Morden, Mitcham and Wimbledon which are characterised with
good public transport access.
4.31. Figures 4.11, 4.12 and 4.13 show the mapped spatial distribution of housing delivery in
years 0-5, 5-10 and 10-15 of the housing trajectory respectively.
Graph 4.9: Projected delivery of new homes in each Local Plan neighbourhood
Delivery of new homes in each neighbourhood
2,500
2,000
1,500
1,000
500
-
Years 0-5 Years 5-10 Years 10-15
Colliers Wood Mitcham Morden Raynes Park Wimbledon
4.32. The regeneration of Morden town centre is a key priority for the council and the emerging
Local Plan by means of policy N3.3 and site allocation Mo4, which seek to enable delivery of
around 2,000 homes within the Morden Regeneration Zone.
4.33. Mitcham is proposed to accommodate a range of new homes, including major development
sites of Eastfields and Ravensbury estates and other such as Benedict's Wharf. For Raynes
Park larger sites close to Shannon Corner and incremental development within the
surrounding neighbourhood will contribute to providing new homes. These are set out in
more detail in the area-based policies within this Plan.
4.34. Wimbledon is similarly proposed to accommodate a range of new homes, including major
development sites of Wimbledon Stadium, Wimbledon YMCA, and High Path estate
regeneration.
4.35. Merton’s Local Plan and accompanying proactive strategies that support future housing
delivery, such as Merton’s Character Study and Small Sites Toolkit, are pro-growth and
26Housing AMR 2019/20
geared towards optimising the provision of good quality and design-led housing to meet this
ambition. For a decade Merton have been allocating sites of any size i.e. no minimum small
sites threshold and has taken forward initiatives including town centre regeneration, estate
regeneration and modular construction of affordable homes. Merton will continue to bring
forward and support these initiatives.
4.36. Merton’s Character Study SPD (2021) identifies appropriate areas where there is potential
for a range of sensitive and extensive character-led growth. At the heart of the study is to
ensure that future shaping of the borough is informed by Merton’s existing and unique
character.
4.37. The Small Sites Toolkit SPD (2021) is designed to give designers and developers a clearer
picture of what would be considered acceptable development on sites up to 0.25 hectares in
the Borough. The toolkit will comprise of guidance notes, case studies and a design and
access statement template. The guidance in the toolkit builds on the findings of the
Character Study in providing contextual advice to applicants and their design teams. The
guidance aims to encourage more development by giving a greater certainty of approval in
addition to improving overall design quality.
4.38. There are a number of factors outside of local planning authority control that influence
housing delivery including macroeconomics, economic effects of Covid-19 house prices,
land values, investment confidence and finance availability and unsecured funding for
Crossrail 2. However, it is considered that the council’s proactive strategies will contribute to
support future housing delivery despite these factors.
4.39. We will encourage housing in sustainable brownfield locations. The London Plan need for
11,732 additional homes for the period 2021/22 – 2035/36 will come forward in Merton by:
• Bringing forward housing capacity through regeneration, including Morden town
centre.
• Prioritising the development of previously developed land and ensuring it is used
efficiently.
• Development of sites identified in Merton's Housing Trajectory.
• Development of windfall sites.
• Enabling mixed use development within the town centres.
• Bringing vacant properties back into use through the council’s empty homes strategy.
• Resisting the loss of housing to other uses.
• Preparing masterplans, development briefs and design guidance for larger housing
sites.
• Demonstrating a continuous delivery of housing for at least 15 years as the Housing
Trajectory sets out below.
• Setting out a 5-year supply of identified sites as shown in the Authority Monitoring
Report.
• Monitoring housing provision levels through the Housing Trajectory within the
Authority Monitoring Report.
27Housing AMR 2019/20
Graph 4.10 Merton 15 year housing trajectory
28Housing AMR 2019/20
Figure 4.11 Merton 0 – 5 year housing trajectory
29Housing AMR 2019/20
Figure 4.12 Merton 5 – 10 year housing trajectory
30Housing AMR 2019/20
Figure 4.13 Merton 10 – 15 year housing trajectory
31Housing AMR 2019/20
Change of use from office to homes
4.40. In May 2013 amendments to the Town and Country Planning Act 1995 allowed change of
use from office to residential via a process known as “prior approval”. This means that
between May 2013 and May 2016 (with potentials to be extended) offices (use class B1a)
can change to residential use (use class C3) without seeking planning permission. 19
schemes were submitted and assessed in the financial year 2017-2018.
4.41. Graph 4.14 summarises the office to homes decisions during the last five financial years.
The number of homes permissioned, started and completed on office to residential permitted
development schemes is shown in Graph 4.15.
4.42. It should be noted that there is no requirement for the applicants to provide figures of the
proposed home size or office floor space that is being lost or whether the offices were
occupied at the time of conversion to residential. Thus the council do not always receive this
information. Only when completed homes are added to the council tax database can the
exact number be confirmed.
Graph 4.14 Office to homes planning decisions - schemes
Permitted Schemes
15 15 Prior Approval not required Schemes
Refused Prior Approval Schemes
12
11 11
Numer of schemes
8 8
7
3 3
2 2 2 2
1
2015-16 2016-17 2017-18 2018-19 2019-20
Graph 4.15 Office to homes permissions, starts and completions
387 Permissioned homes
Started homes
320
Completed homes
Number of homes
149
117
100 86
41 52 52
37 36 25
13 12 20
2015-16 2016-17 2017-18 2018-19 2019-20
32Housing AMR 2019/20
4.43. The number of permissioned homes through prior approval from office to residential has
fallen over the past three years. Graph 4.16 shows all prior approval applications since 2013
by ward. The majority have been in Cricket Green and Wimbledon Park wards.
Graph 4.16 Prior Approvals from Office to Residential - Total homes
per ward approved 2019/20
350
300
250
200
150
100
50
0
Planning Application is Needed - (Refused Prior Approval) (units)
Prior Approval is Not Required (units)
Permitted (units)
4.44. Graph 4.17 shows the number of schemes permitted for conversion of retail spaces to
residential use since 2015/16 and Graph 4.18 shows the number of units. These represent
just a smaller proportion of the total homes gained through prior approval, as shown in
Graph 4.19 where 7 new homes were completed in 2019/20.
Graph 4.17 Retail to homes planning decisions - schemes
Permitted Schemes
Prior Approval not required Schemes
10 Refused Prior Approval Schemes
4 4
3
2 2 2 2 2
1 1 1 1 1 1
2015-16 2016-17 2017-18 2018-19 2019-20
33Housing AMR 2019/20
Graph 4.18 Retail to homes planning decisions - units
Permitted Units Prior Approval not required Units Refused Prior Approval Units
4 4
3 3 3
2 2 2
1 1 1 1
0 0 0
2015-16 2016-17 2017-18 2018-19 2019-20
Graph 4.19 Retail to homes permissions, starts and completions -
units
16
Permissioned homes
Started homes
Number of units
Completed homes
9
8 8
7
5
4 4 4
3 3 3
2 2 2
2015-16 2016-17 2017-18 2018-19 2019-20
4.45. Permitted development rights were also temporarily applied to B8 premises under 500sqm
where the prior approval was permitted before 10th June 2019. 6 new homes on 3 schemes
were approved and started during the 2019/20 financial year.
34Housing AMR 2019/20
Graph 4.20 Storage to homes planning decisions - schemes
No of Submitted Prior approvals
Permitted Schemes
9
Prior Approval not required Schemes
7 Refused Prior Approval Schemes
4
3
2 2 2 2
1 1 1 1
0 0 0 0
2016-17 2017-18 2018-19 2019-20
35Housing AMR 2019/20
Affordable housing
Source of
Indicator Borough Target Progress
Information
NUMBER AND PROMOTION Aim for the borough-wide 4 schemes completed Merton’s
OF NEW DWELLINGS THAT affordable housing target of in 2019/20 that Monitoring
ARE AFFORDABLE ON 40% which is equivalent to provided 70 new Datastore,
SITES WITH A THRESHOLD the numerical target of affordable homes on LB Merton
OF 10 HOMES OR MORE 1,920 affordable homes in site. Housing
Merton for the period 2011- Between 2011 2020 Department
2026. 1,092 affordable
homes have been built
in Merton. 56% of the
total target for 2011-
2026.
PROPORTION OF New affordable dwellings to 60% Affordable rented LDD and LB
AFFORDABLE DWELLINGS: consist of: 30% Intermediate Merton
Housing
SOCIAL RENTED AND 60% social/affordable Department
INTERMEDIATE. rented
40% of intermediate
provision.
PROVISION OF Development Plan policy 1 scheme completed in Merton’s
AFFORDABLE HOUSING requires the provision of 2019/20 that made a S106
REQUIRED ON SITE; affordable housing on-site contribution of Monitoring
WHERE THIS IS NOT as part of housing £466,002. Datastore
POSSIBLE A FINANCIAL development schemes. In
CONTRIBUTION IN LIEU exceptional circumstances
MUST BE MADE. where it is not possible to
secure on-site homes,
payment of a financial
contribution in-lieu of onsite
provision for the provision of
off-site affordable housing is
made.
4.46. Table 4.21 shows the contribution of affordable homes and S106 money received this year.
4.47. The delivery of affordable housing has been affected by the introduction of Prior Approval
rights to convert office, retail and storage premises to residential use without the need for full
planning permission. This is particularly evident in the financial years 2015/2016 and
2016/2017 where 47% and 36% of the total delivery was via prior approval.
36Housing AMR 2019/20
Table 4.21 – Affordable Home Completions 2018/19
Application Total Affordable % Affordable S106
Total Homes
Number Homes Homes Contribution
16/P1696
68 27 40% -
13/P1038
20 25% -
5
17/P1601
14 29% -
4
15/P0211
34 100% -
34
17/P4187
18 - £466,002
-
Total 154 70 £466,002
4.48. Current planning policy in Merton, like most of the country, seeks a percentage of new
homes from large sites as affordable homes. Merton’s Core Planning Strategy 2011 sets a
borough wide housing target of 40% of new homes. Graph 4.22 below summarises housing
delivery over the past 10 years. It shows that over that period 4,630 new homes were
completed, of which 1,082 (23%) were affordable housing.
Graph 4.22 – Affordable Home Completions 2010-2020
800
Total Completions Affordable Home Completions
700
600
500
400
300
186
200 162 163
141
112
90 79
100 74 70
5
0
2010/11 2011/12 2012/13 2013/14 2014/15 2015/16 2016/17 2017/18 2018/19 2019/20
37Housing AMR 2019/20
4.49. In the past 5 years, Registered Providers have delivered 192 affordable homes either by
buying sites once they have received planning permission, by buying more homes within a
development above those required by planning permission or by developing sites
themselves. These sites include:
• 118-120 Christchurch Road, Colliers Wood – L&Q (54 affordable homes, 100%)
• 191-193 Western Road, Colliers Wood – L&Q (48 affordable homes, 100%)
• Former community centre, Woodstock Way, Mitcham (36 affordable homes, 100%)
• 2-6 High Street, Colliers Wood – Optivo (34 affordable homes, 100%)
• Windmill Road, Mitcham (20 affordable homes, 100%)
4.50. A list of the planning obligations secured through S106 for the provision of affordable
housing and off-site contributions is detailed in section Table 7.1.
Conversions, housing sizes and appeals
Core Strategy: To promote a high quality urban and suburban environment in Merton
Strategic Objective where development is well designed and contributes to the function and
8 character of the borough
Core Strategy CS14
Policies
Sites and Policies DM D1 – DM D7
Plan Policies
Conversions
Source of
Indicator Borough Target Progress
Information
PROTECTION OF All conversions of existing 25 scheme conversions Merton’s
FAMILY SIZED family sized single dwellings completed that resulted in Monitoring
HOMES IN into two or more smaller 19 new homes total net Datastore
DWELLING homes to include the re- gain, and a net loss of 4
CONVERSIONS. provision of at least one family homes.
family sized home.
38 scheme conversions
were approved this year
that will result in a net gain
of 55 new homes and the
loss of 8 family homes.
4.51. Over the past 5 years an average of 34 schemes have been approved for the conversion of
family homes to smaller sized homes. From 2018/19 to 2019/20 the number of schemes for
conversions from house to flat fell from 51 to 36 respectively. There has been little change in
the number of schemes approved for the conversion of flats to a single family dwelling.
38Housing AMR 2019/20
4.52. 18 schemes with houses converted to flats were completed in the monitoring year. This
resulted in a net gain of 25 new homes including a net loss of 4 family homes. Of the 5
schemes that resulted in a loss of a family sized unit 3 were Lawfulness applications.
4.53. 28 schemes were approved in the monitoring year for conversions of houses to flats that
would result in a net gain of 49 new homes, and the loss of 2 family sized homes. 5 schemes
were approved for the conversion of flats to houses that would result in a net loss of 8
homes but no overall net loss or gain in the number of family sized homes.
4.54. Graphs 4.23 shows that the majority of conversions approved in the last five years have
been from houses to flats. Graph 4.24 shows that as a result there has been an annual
approved net gain in homes. Of these, there have been more schemes that retain family
sized homes than do not (Graph 4.25).
Graph 4.23 Conversions approved in the last five years
House to Flat Flat to House
60
51
50
Number of Schemes
40
35
33
30 28
23
20
11
10 8
6 6 5
0
2015-2016 2016-2017 2017-2018 2018-2019 2019-2020
39Housing AMR 2019/20
Graph 4.24 Conversion decisions in the last five years
Refused Approved Annual Approved Net Gain
70
62
60
55
50 47
Number of Schemes
43 43
39 38
40
35
31
29
30
19
20
14
10 6
2 2
0
2015-2016 2016-2017 2017-2018 2018-2019 2019-2020
Graph 4.25 Approvals that maintain family units in the last five
years
Yes No
40
37
35 33
32
30
26
Number of Schemes
25
20
15 13
11 11
10
10
6
5 4
0
2015-2016 2016-2017 2017-2018 2018-2019 2019-2020
40Housing AMR 2019/20
Appeals
Source of
Indicator Borough Target Progress
Information
THE NUMBER OF Increase in the % of 58 appeals were made in Merton’s
PLANNING appeals dismissed per 2019/20. Monitoring
APPEALS total number of appeals 25 appeals were allowed Datastore
DISMISSED PER citing design policies. in 2019/20
TOTAL NUMBER OF 43% of appeals were
APPEALS CITING allowed
DESIGN POLICIES 33 appeals (67%) were
dismissed
4.55. Graph 4.26 shows the number of appeals permitted and dismissed over the past five
years. The number dismissed has always been greater than the number permitted, and the
majority of those permitted cite design policies. The percentage of appeals dismissed is 6%
higher this financial year than the last financial year.
Graph 4.26 Appeal decisions in the past five years
70
60
50
Number of Schemes
40
30
20
10
0
2015/16 2016/17 2017/18 2018/19 2019/20
Dismissed Permitted
41Local Economy AMR 2019/20
5. LOCAL ECONOMY
Headlines
All the town centres shop vacancy rates are below the national and London’s average.
All Merton’s town centres perform well as they meet the targets of both core strategy and
sites and policies plan.
Retail vacancy rate, town centres and industrial areas
To make Merton more prosperous with strong and diverse long term
economic growth.
Core Strategy:
Strategic Objective
4
Core Strategy CS1, CS2, CS3, CS7, CS12
Policies
Sites and Policies DM R1 – DM R7, DM E1 – DM E4
Plan Policies
Source of
Indicator Borough Target Progress
Information
RETAIL VACANCY Maintain the retail vacancy National vacancy rate for Merton’s
RATE IN TOWN rate below the national Town Centres in Great Monitoring
CENTRES. average for the monitoring Britain: 12.4% (British Datastore
period. Retail Consortium Q2 2020.
2020) British
Mitcham: 8.6% Retail
Morden: 5.6% Consortium
Wimbledon: 13.3% 2020.
RETAIL VACANCY Maintain the retail vacancy Arthur Road: 0% Merton’s
RATE IN LOCAL rate below the national Colliers Wood 10.2% Monitoring
CENTRES, average for the monitoring Motspur Park: 3.3% Datastore –
NEIGHBOURHOOD period. North Mitcham: 3.5% Retail
PARADES AND Raynes Park: 6.3% Survey
COLLIERS WOOD. Wimbledon Village: 3.7% 2020
South Wimbledon: 7.9%
All of the neighbourhood
parades: 7.8%
AMOUNT OF Percentage of retail use (A1 Total A1 Uses in Core Merton’s
RETAIL Use class) in Core shopping shopping frontages: Monitoring
DEVELOPMENT frontages: Approximately Wimbledon: 51.0% Datastore –
FOUND IN TOWN 50% of units should remain in (central frontage) and Retail
CENTRES. retail use (A1 Use Class). 56.1% (core frontage) Survey
Mitcham: 60.3% 2020
42Local Economy AMR 2019/20
Morden: 50.7%
Arthur Road: 60.87%
Raynes Park: 58.70%
Wimbledon Village: Note: this
62.2% monitoring
Motspur Parks: 58.8% period pre-
North Mitcham: 66.67% dates the
Total commercial uses in introduction
Secondary shopping of Use
Secondary shopping
frontages: Approximately Class E on
frontages:
50% of units should remain in 1st
Wimbledon: 80.9%
commercial use (A1,A2,A3, September
Mitcham: 89.5%
A4 and A5 classes) 2020
Morden: 83.3%
Arthur Road: 100%
Raynes Park: 75%
Wimbledon Village:
80.00%
Motspur Park: 78.6%
North Mitcham: 84.5%
Neighbourhood Parades: a
minimum of 30% of units
should remain in retail use All Neighbourhood Parades
(A1 Use Class). are above the minimum 30%
A1 use class target (48.9%
in 2020).
RETENTION OF No net loss of employment Loss of 6 office spaces Merton’s
EXISTING land for which there is a caused by Prior approval Monitoring
EMPLOYMENT demand. As measured each from office to residential Datastore
FACILITIES OR
year in AMR. Target to be permitted development
REFURBISHMENT
TO PROVIDE
considered on 5-year basis. rights resulting in the
ATTRACTIVE creation of 20 new
BUSINESS SPACE. homes.
The vacancy rate figures are below the national vacancy, thus Merton’s town centres and
neighbourhood parades are healthy. The shopping survey shows that all the policy
requirements regarding the protection of certain type of commercial uses in designated
shopping frontages are met. Graph 5.1 shows how retail vacancy increased in designated
town centres and local centres in 2020, in particular Wimbledon town centre, where the
vacancy rate of Centre Court Shopping Centre exceeded 30%.
43Local Economy AMR 2019/20
Graph 5.1 Vacancy rates in Merton’s town centres and local centres
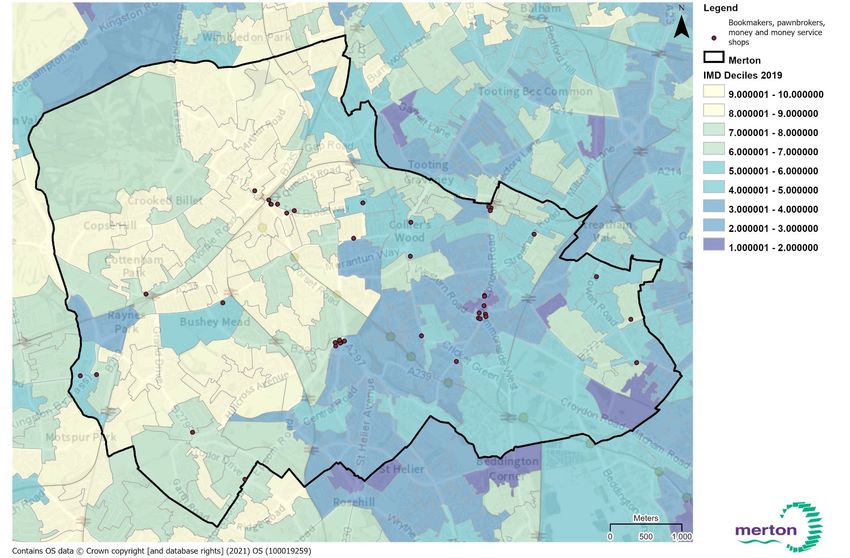
5.1. Hot food takeaways, betting shops and money services shops are three types of uses that
are monitored separately of all the rest town centre uses. Table 5.2 shows the number and
proportion of these uses in Merton and the number granted planning this financial year. The
map in Figure 5.2 shows the location of betting shops, pawnbrokers and money service
shops and the Index of Multiple Deprivation 2019.
Table 5.2 Takeaways and betting shops
Total number in Number granted
2018/19 Merton (2020 planning permission
shopping survey) in 2019/20
134 (6% of shop
Hot food takeaways 2
units)
Bookmakers,
pawnbrokers, money 34 (1.5% of shop
0
and money service units)
shops
44Local Economy AMR 2019/20
Figure 5.2 – Location of bookmakers, pawnbrokers, money and money service shops with the Index of Multiple Deprivation Deciles 2019
45Local Economy AMR 2019/20
5.2. During the monitoring year, 85 commercial schemes have been completed and 57 have
been started. Table 5.3 shows the completed and started permissions, and the proposed
floor space per class use. Permissions of over 1,000sqm include office schemes at
Wellington House, Wimbledon Hill Road and 22-24 Worple Road, and the Cricket Green
School extension. The new Wimbledon Stadium is still under construction.
Table 5.3 Starts and Completions
Completions Started and not completed
2019/20 Floorspace (proposed Floorspace (proposed
Permissions Permissions
gross sqm) gross sqm)
A1-A5 41 - 2,283.30 27 - 2,976.20
B1 16 7,414.80 11 3,611.70
B2-B8 6 - 2,458.00 1 - 4,296.60
C1 1 663.00 - -
D1 10 19,525.90 10 19,366.40
D2 7 15,433.30 3 17,924.50
SG 4 12,605.30 5 14,481.80
Loss to
39 - 1,943.00 27 - 4,471.90
C3
Total 85 50,901.00 57 48,111.60
Industrial market in Merton
5.3. Fuelled by a combination of robust occupier demand and limited supply, the Merton
industrial submarket has seen marked vacancy compression over the past decade. As a
result, vacancies were lower than pre-financial crisis levels in early 2020, with positive net
absorption outpacing scarce new supply additions. However, the onset of the coronavirus
has largely disrupted these dynamics in the submarket, with vacancies rising into 2021.
5.4. Leasing activity has slowed over the past year, with only a few notable deals taking place
since mitigation measures initially came into effect last spring. However, despite this
slowdown, the submarket's fundamentals remain tight, with current vacancies still well below
both historical averages for the submarket and the wider London average. These tight
conditions could also help support rental values in the submarket. While growth is predicted
to continue moderating this year, it is expected to remain positive before picking up in the
medium term. There have been several new deliveries in the submarket over the past year
or two. Developed speculatively, these projects are likely to remain available in the near term
due to the outbreak, though once market conditions begin to normalise, they are well placed
to capitalise on demand.
5.5. Like the occupier market, investment activity slowed initially due to the crisis, though activity
has started to pick up in recent quarters. Indeed, 21Q1 recorded the strongest investment
volumes in over a decade, with one standout sale and leaseback transactions posting a
record low net initial yield for the submarket driving volumes.
5.6. Vacancies in the Merton industrial submarket have seen marked improvement over the past
decade. Periods of strong positive net absorption have outpaced the limited new supply that
has come online, and coupled with the removal of swathes of inventory, Merton has seen
steady vacancy compression, from near double digits in 2011 to lows of sub-2% last year.
46You can also read