FINAL HOUSING NEEDS ASSESSMENT JANUARY 2021
←
→
Page content transcription
If your browser does not render page correctly, please read the page content below
FINAL HOUSING NEEDS ASSESSMENT
               JANUARY 2021

                          Rees Consulting,
                                Inc.
(this page intentionally blank)

Williford/WSW/Rees/Continuum

Table of Contents
Executive Summary............................................................................................................................................. 4
   Introduction ........................................................................................................................................................ 4
   Defining What Households Can Afford In Alamosa ..................................................................................... 4
   Demographics, the Economy and The Housing Market .............................................................................. 4
   Housing Inventory ............................................................................................................................................. 5
   Special Populations ........................................................................................................................................... 6
   Considerations for Action Planning ................................................................................................................ 7
Current and Projected Housing Needs ............................................................................................................ 8
   Catch-up Needs (Current Conditions) ............................................................................................................ 8
   Keep-Up (Future Needs)................................................................................................................................. 10
   Summary of Needs .......................................................................................................................................... 11
   Needs by Own/Rent and Income .................................................................................................................. 12
Demographics.................................................................................................................................................. 14
   Population and Households ........................................................................................................................... 14
   Household Income .......................................................................................................................................... 17
   Housing Cost-burden...................................................................................................................................... 19
Employment ..................................................................................................................................................... 20
   Number of Jobs ............................................................................................................................................... 20
   Types of Jobs and Wages .............................................................................................................................. 21
   Seasonality of Jobs .......................................................................................................................................... 22
   Commuting....................................................................................................................................................... 23
   Unfilled Jobs and local labor force ............................................................................................................... 23
   Employer Survey Insight ................................................................................................................................. 25
Housing Inventory ............................................................................................................................................ 30
   Housing Units ................................................................................................................................................... 30
   Tenure ............................................................................................................................................................... 30
   Types of Housing ............................................................................................................................................. 31
   Age of Housing ................................................................................................................................................ 32
   New and Proposed Housing .......................................................................................................................... 33
Housing Market Conditions ............................................................................................................................ 36
   For Sale Market ................................................................................................................................................ 36
   Rental Market ................................................................................................................................................... 41
   Subsidized and Income Restricted Housing ................................................................................................ 43

Williford/WSW/Rees/Continuum

Housing for Special Populations .................................................................................................................... 45
   Senior Households .......................................................................................................................................... 45
   Persons with Disabilities ................................................................................................................................. 47
   Veterans ............................................................................................................................................................ 48
   Homeless .......................................................................................................................................................... 49
   Seasonal Agricultural Workforce ................................................................................................................... 53
   Students ............................................................................................................................................................ 56
Acknowledgements ......................................................................................................................................... 58
   Alamosa City council ....................................................................................................................................... 58
   Alamosa Staff .................................................................................................................................................... 58
   Consulting Team.............................................................................................................................................. 58
Area Median Income Chart............................................................................................................................. 59
Methodology .................................................................................................................................................... 60
   Primary Research ............................................................................................................................................. 60
   Subject Matter Expert and Key Stakeholder Interviews ............................................................................. 61
   Secondary and Local Data Sources............................................................................................................... 61
Glossary ............................................................................................................................................................ 63

Williford/WSW/Rees/Continuum
Executive Summary
INTRODUCTION
The City of Alamosa (City) commissioned a Housing Needs Assessment (Assessment) and Action Plan
to understand current housing conditions and work towards solutions to address the housing
challenges that people in the community are facing. This Assessment takes a comprehensive look at
current housing conditions and the factors that are shaping the housing market. The next phase of the
work will be the Action Plan, which will focus on solutions.

DEFINING WHAT HOUSEHOLDS CAN AFFORD IN ALAMOSA
This Assessment centers on the understanding of what households can afford for housing in Alamosa,
and explores where their needs are being met, and where there are gaps. It uses the definition that
housing is affordable when the monthly payment (rent or mortgage) is equal to no more than 30% of a
household’s gross income (i.e., income before taxes).

The affordable rents and purchase prices for two-person households are as follows.

Incomes and Housing Affordability
                                           Percent Area
 Household Income
                                          Median Income                  Max Rent             Max Purchase Price
 (2 people)
                                              (AMI)
 $0 to $28,400                                $113,600                                   >200%
Source: HUD, Consultant team
Note: Max purchase price assumes 30-year mortgage at 5.5% with 5% down and 20% of the payment covering taxes, HOA, PMI
and insurance.

DEMOGRAPHICS, THE ECONOMY AND THE HOUSING MARKET
Over the past twenty years, there has been a decline of working age people in their 30s and 40s, which
is linked to employer’s observations that finding and keeping qualified employees is a major
challenge. A shortage of housing choices that are attractive to and attainable by working households
contributes to this dynamic. With more investment in attractive workforce housing, Alamosa might
entice more young working people to put down roots in the community. These “workforce” housing
choices include high quality rentals priced between $700 and $1,400/month and first-time homebuyer
opportunities in the $150,000 - $275,000 range.

The presence of Adams State University (ASU) and Trinidad State Junior College (TSJC) contribute to a
young population (median age of 28, compared to median age of 37 for Colorado). Investment in
attractive and attainable housing could help to retain this potential workforce as they graduate from
high school and college and begin their careers. These investments in housing could in turn support
growth in area entrepreneurship, professional jobs, and economic growth.

Williford/WSW/Rees/Continuum                                                                                             4
Prior to COVID-19, jobs and wages had grown steadily since 2010. Between 2010 and 2019, jobs grew
at about 1.5% per year, and average wages increased about 2.5% per year. Unfortunately, individuals
and households have not been able to realize much increased quality of life from these gains, because
housing prices have increased faster than wages. Many households are facing increasing burdens as
rents and home prices trend upwards. About half of renters and a third of owners pay more than 30%
of their income on housing.
A number of dynamics are contributing to the tight housing market and increased housing costs:
• Building of new homes has not kept pace with jobs and population growth – the rate of new
residential development has only been 1.2% annually over the past 10 years.
• Low vacancy is driving increased rental rates (current average asking rent is $774 compared to
$577 in 2009), and landlords are increasingly selective about to whom they will rent.
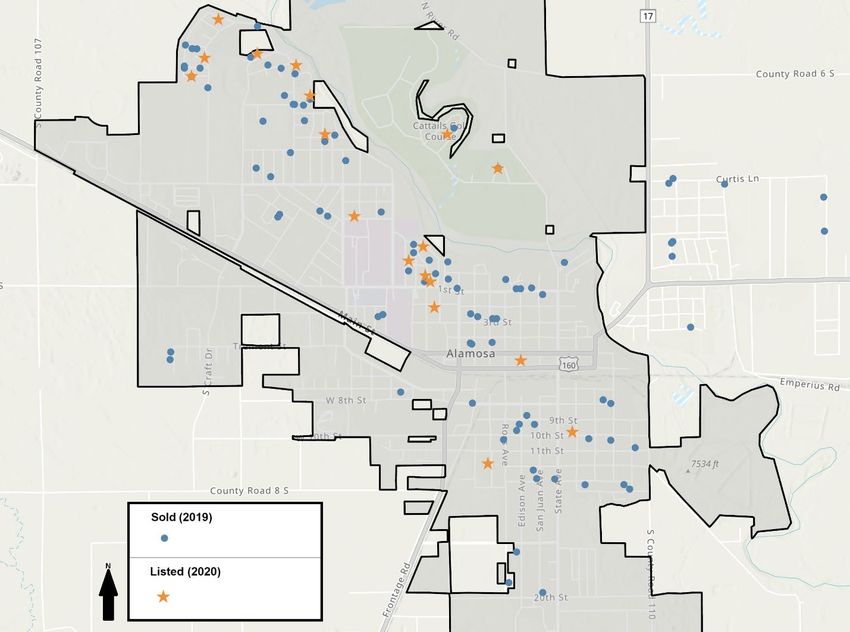
• Home prices are on the rise, and there is almost no inventory of homes for sale that are
affordable to households earning local wages. The larger size of homes on the market also
means higher prices. For 2019, the median sale price was $207,000. In October 2020 the
median asking price is $328,950. Only eight homes were listed that would be affordable for
households with incomes of less than $68,200.
• The high cost of construction means that private developers can only deliver new housing to
the highest income segment of the population.
• The transition from renting to owning has become harder: with higher rents, households have
fewer opportunities to save for down payments, while homeownership opportunities are
growing more elusive with almost no homes available at attainable price points.
• The transition from receiving rental assistance to living in market rate housing has also become
harder. Service providers observe a “cliff effect” that disincentivizes full time work and career
advancement for households that are receiving public assistance for housing, food, and/or
healthcare.
The addition of The Flats at Iron Horse, new proposed market rate rentals, and future Self Help
Housing for homeownership through the Colorado Rural Housing Development Corporation (CRHDC)
are both on track to make a positive impact for households in the 50-100% Area Median Income (AMI)
range, which are typically working households.
HOUSING INVENTORY
Two major themes emerged from analysis of the housing inventory:
(1) The inventory for homeownership is lacking in quality and variety. Households of all sizes and
incomes are stuck competing for similar products: mostly mid-size single family homes with
three bedrooms. Homes are mostly older, with more than half built before 1980, which
contributes to wear, tear, and a need for renovation. Increasing the diversity of the housing
stock with more duplexes, townhouses, condos, small units for starting out and downsizing
would help to create choices for buyers and differentiation within the market. Residential
development anticipated in 2021 continues the trend of single family for homeownership and
apartments for renters, where both owners and renters could benefit from more “missing
middle” housing types and price points.
(2) A higher proportion of rental units have been added to the inventory compared to new homes
for ownership in the past decade. This growth is not surprising, as it responds to market need
Williford/WSW/Rees/Continuum 5for additional rental inventory, and is beneficial in stabilizing rising rents and alleviating very
low vacancy rates. Additional rental housing is needed for the large demographic of low-
income renters (74% of renters have incomes below 80% AMI). However, Alamosa should
balance new rental housing with similar levels of new homes for ownership, if retaining the
historic ratio of renters and owners in the community is desired. Creating opportunities for
individuals, families, and young couples to move into homeownership will also free up rental
inventory for students, existing households that are struggling to find rental housing, and
people moving to the area for employment.
SPECIAL POPULATIONS
This Assessment delves into the existing resources dedicated to several special populations, including
elderly, disabled, veterans, and homeless. Many organizations are hard at work to serve these
individuals and households, and the needs in Alamosa are extensive. The organizations serving these
groups have all identified housing, and housing enriched with services, as a major challenge and much
needed resource for their clients. Many housing strategies are already in place, while others are being
proposed and explored.
Identifying the specific needs for each special group will require a full assessment of each population,
which was beyond the scope of this study. Based on interviews with special needs providers and
available information, however, the following potential housing needs were identified and should be
further explored:
• Seniors - Subsidized rentals for lower-income seniors are in short supply. Affordable purchase
options for seniors to downsize that are in good condition are also scarce. Providing
ownership and rental options for seniors to downsize can free up existing homes and
apartments for families and create a more attractive choice for aging in place.
• People living with disabilities - Many persons with disabilities need assistance to upgrade their
homes to accommodate their disability. The current program through the San Luis Valley
Housing Coalition (SLVHC) limits assistance to $24,999 absent a waiver, whereas
improvements often cost more than this. Strengthening this existing program and ensuring
newly built rental housing has ample accessible units should be a priority.
• Veterans – Many vulnerable veterans in the community can benefit from additional housing
support and behavioral health services. Housing combined with behavioral health and job
training support can help struggling Veterans.
• Homeless - To help persons break the cycle of homelessness, Alamosa has a significant need
for supportive housing, and appears well positioned to pursue this strategy. Investing in
permanent supportive housing is a proven strategy to increase positive outcomes for people
experiencing homelessness, and other extremely low income and vulnerable households. This
approach also reduces the burden on high-cost public services. Further refinement of
population(s) to be served, location, funding, and ongoing roles is recommended in the Action
Plan phase. Populations to consider include youth, veterans, single people, and families with
children.
• Agricultural Workers - Seasonal housing options or dorms could assist the estimated 70
migrant workers in Alamosa County (county) in 2019 and could be in the form of programs to
help employers provide options. However, programs to improve local workforce reliability,
motivation to undertake agricultural jobs, and help with State of Colorado (State) certification
Williford/WSW/Rees/Continuum 6(for higher paying cannabis jobs) could help employers hire local employees that already have
housing – seasonal agricultural workforce needs are not solely housing based.
• Students – University and college students helps drive up rental occupancies in Alamosa when
school is in session, which is the case in any community with higher education opportunities.
Over 2,200 ASU students (about 63% of students) do not reside on campus and either live with
their parents or relatives in the Valley or find homes or apartments to rent. TSJC does not
provide on-campus housing, although international students may live in ASU dorms.
Additional on-campus housing can reduce competition for market rate rentals in the city.
Dorms are an unlikely option given that undergraduate enrollment has been declining and
existing ASU dorms are not fully occupied during the school year. Family apartments, which
are typically fully occupied, may be a consideration provided enrollment trends support more
housing.
CONSIDERATIONS FOR ACTION PLANNING
As the City and local stakeholders’ transition from assessing current housing conditions and needs to
drafting their proposed action plan, the following should be considered:
• Between 444 to 514 housing units for residents and employees are needed by 2026, or an
average of about 80 to 100 units per year. Alamosa has been adding an average of about 44
units annually since 2010. In the Action Planning phase, policy makers and local stakeholders
should consider setting a goal that lands somewhere between historic production and 100%
fulfillment of these needs projections, taking funding, land, and other local resources into
consideration.
• Public/private partnerships are likely needed to overcome the high cost of construction
compared to the rental and sale prices needed locally.
• Over the past 40 years, there has been considerable investment in subsidized housing. This
approach should be balanced with investing in young workers and families to help grow jobs
and create more synergy between housing self-sufficiency and economic vibrancy. A greater
focus on “missing middle” housing types and price points for rent and ownership is
recommended.
• Greater diversity of housing for sale and for rent is needed. This includes variations in housing
size (more small units) and different housing types (more attached housing for sale, accessory
dwelling units and medium density housing for rent, consideration of mobile homes and
manufactured housing).
• Additional rentals for very low-income households are also needed. Recruiting and retaining
additional Housing Choice Vouchers to the community can help to bridge the gap between
what renters can afford and the cost to construct new rental housing. More on-campus housing
would also address student housing needs, which is a distinct group competing for affordably
priced rentals.
• Policy makers should be mindful to promoting diversity and inclusion in all neighborhoods to
reverse historic racial and economic disparities.
Williford/WSW/Rees/Continuum 7Current and Projected Housing Needs
This section evaluates how many housing units are needed, and at which price points, to address
housing deficiencies in the city to support residents, businesses and the economy. This section builds
upon and summarizes the analysis in subsequent sections of the report.
Needs are projected through 2026 and quantified in two categories:
Catch-Up Needs – the number of housing units needed to address current deficiencies in housing
based on the number of ownership and rental units needed to provide a functional housing market.
Keep-Up Needs – the number of units needed to keep-up with future demand for housing based on
projected job and related resident growth and jobs that will be vacated by retiring employees.
Housing shortages worsen when local job growth and the need for more workers exceeds the growth
in available housing units.
CATCH-UP NEEDS (CURRENT CONDITIONS)
Unfilled jobs
Employer survey respondents reported that about 3% of jobs were unfilled. This equates to about 250
unfilled jobs in the city.
About 130 housing units are needed to house employees filling 250 jobs. Due to the recent loss of
jobs due to COVID-19, as jobs come back, many will likely be filled by un- or under-employed
residents in the area. Employers hiring for skilled and upper-level positions in particular, however, will
benefit from having additional housing units available to help recruit new workers to the area.
Although the unemployment rate dropped from a high of 9.6% in April to 5.3% in October, it is still
well above the unemployment rate in October 2019 (2.9%) (see Employment section).
As the number of jobs recover, many jobs will be filled by persons living locally who are currently
unemployed. If the unemployment rate drops back to 2.9%, then about 100 currently unemployed
people living in Alamosa County may take jobs in the city as employment recovers. These employees
already have housing in the area.
COVID-19 Employment Recovery
October 2020 labor force in Alamosa County 9,050
# currently unemployed
476
(5.3% unemployment rate)
# unemployed at 2.9% unemployment 262
Difference (available Alamosa County labor pool) 214
% of total Alamosa County labor force working in Alamosa 46%
Local labor pool that is likely to fill jobs in Alamosa 100
Housing units occupied by local labor pool
58
(1.7 employees per employed household)
Source: Local area unemployment statistics (LAUS), Census LEHD, Consultant Team
Williford/WSW/Rees/Continuum 8Units Needed to Help Fill Vacant Jobs This figure of 58 households already living in
Alamosa who will return to the labor pool during
Unfilled jobs 250
the economic recovery is used to adjust the
Jobs per worker 1.1 overall number of units needed to fill vacant jobs
Employees per employed household 1.7 as shown at left.
Housing units needed 130
Local unemployment recovery 58
Adjusted housing units needed 72
Functional Rental Market (5% Vacancy)
The current rental market in the city is not functional because vacancies average less than 3%. When
the vacancy rate is this low, the rental market is near capacity and cannot absorb new residents or
employees moving to the area. This results in several issues:
• Renters have difficulty moving from one Rentals Needed for a Functional Market
unit to another as their circumstances
Renter-occupied units (2020) 2,149
change,
Existing vacant units (2.1%) 46
• New employees struggle to find housing
Total rentals 2,195
when hired, impacting businesses and
the economy, Number of rentals if 5% vacancy rate 2,310
• Rents increase at rates much faster than Difference 115
incomes, New units needed
69
(Difference minus Existing vacant units)
• Renters displaced due to owners selling
Plus Walsh fire replacement units 20
rentals, condemnation, disasters (e.g.,
the recent Walsh fire destroying 20 units) Adjusted housing units needed 89
or other reasons have few or no options, and
• Landlords have little incentive to make repairs and capital investments.
A 5% vacancy level, while still low, provides some choice and availability of units for residents and
employees. To increase the vacancy rate to 5%, approximately 69 additional rental units are needed.
To replace the 20 units lost in the Walsh fire, the need increases to 89 units.
Balanced Ownership Supply (6-month supply)
As of October 2020, there were 18 residences listed for sale on the MLS – about a 2.6-month supply.
For homes priced under $300,000, the supply drops to 1.5-months. A general industry standard is that
when the number of homes available for sale is below a 6-month supply, it is a seller’s market –
meaning that there are more buyers than homes available to purchase, resulting in rising prices. This
trend is currently evident in Alamosa (see Housing Market Conditions).
For-sale Homes Needed for a Balanced Supply Providing more housing ownership
MLS sales (2019) 82 opportunities at prices that residents
Average sales per month (divide by 12) 6.8 can purchase promotes function in the
6-month supply 41 market by allowing renters to move into
MLS listings (Oct. 2020) 18 ownership, new employees to purchase
Difference: homes, growing families to move up in
23
Additional MLS listings needed for 6-month supply housing, and empty-nesters and seniors
Williford/WSW/Rees/Continuum 9to down-size and free up their larger homes. This movement accommodates the housing needs of
residents at various stages of life.
About 23 more homes are needed to generate a 6-month supply of for-sale housing on the MLS. Most
will need to be priced under $300,000 since lower price points are in the shortest supply.
Pending Development Adjustments
As summarized in the Housing Inventory section, 57 rentals are pending construction, River Trece
Subdivision has been approved for 15 more homes for sale and CRHDC builds between 6 to 8 homes
for persons earning 80% AMI or below each year. These projects are poised to address some of the
catch-up rental and ownership market needs. Adjustments to housing need estimates from pending
development are made in the “Summary of Housing Needs” table shown below.
KEEP-UP (FUTURE NEEDS)
Job growth
Due to the COVID pandemic, jobs decreased in Alamosa by about 6% between 2019 and 2020. The
Colorado Demography Office estimates that jobs will mostly recover by 2026, with an average job
growth rate of 1% per year. Alamosa County recovered from the prior recession at an average job
growth rate of 1.5% per year (see Employment section). Estimated needs are presented for both
growth rates.
Estimates are also based on maintaining the current percentage of employees living in the city (39%).
Producing more or less housing than estimated below would be equivalent to either decreasing or
increasing the percentage of employees that commute into the city, respectively.
Finally, the calculation below estimates housing units needed in total to maintain pace with job growth.
This estimate accounts for housing units needed for both employed and unemployed households:
36% of households in the
Housing Units Needed to Accommodate Job Growth: 2020-2026
city do not have an
employed person in the 1% growth 1.5% growth
home. 1 Alamosa jobs 2020 7,600 7,600
As shown (right), an Alamosa jobs 2026 8,045 8,305
estimated 130 to 200 Yearly average growth 1.0% 1.5%
housing units will be New jobs (2020 - 2026) 445 705
needed in the city to
support employees filling Jobs per employee 1.1 1.1
jobs through 2026, or Employees filling jobs 405 640
between 22 to 33 housing
units per year. Employees living in the city (39%) 160 250
Employees per household 1.2 1.2
New housing units needed by 2026 130 200
1
2014-2018 ACS reports that 36% of households do not have an employed person in the home and 30% of households did not
report earnings from a wage, salary or self-employment income. The number of employees per occupied housing unit (which
includes households with employed members and households with zero employed members) is 1.2; the number of employees
per household with at least one employed person is 1.7.
Williford/WSW/Rees/Continuum 10Retiring employees
Employers will need to fill the jobs vacated by retirees in addition to any newly created jobs. Some
retirees will likely leave the area upon retirement; however, when they sell their homes, not all will be
affordable for new workers filling their jobs.
Retiring employees Employers in Alamosa estimate that about 5% of
workers (365 total) will be retiring over the next five
% to retire by 2026 5%
years. About 210 housing units will be needed to
# to retire 365 house the employees filling jobs vacated by
Employees per employed household 1.7 retirees.
New housing units needed 210
SUMMARY OF NEEDS
Based on estimated catch-up and keep-up needs, between 444 to 514 housing units for residents and
employees are needed by 2026, or an average of about 80 to 100 units per year. Over the past 10
years, Alamosa has been adding an average of about 44 units annually. In the Action Planning phase,
policy makers and local stakeholders should consider setting a goal that lands somewhere between
historic production and 100% fulfillment of these needs projections, taking funding, land, and other
local resources into consideration.
The extent to which identified housing needs may be addressed by the market will be influenced by
changes in housing prices over time, the availability of land, developers’ construction of community
housing, and the presence or absence of programs to facilitate more development. These factors will
be an extension of
housing policy, Summary of Housing Needs
resources and
desired direction Low* High*
with respect to Catch-Up
community housing. Unfilled Jobs (3% of jobs)** 72 72
Setting this policy
Functional rental market (5% vacancy rate plus lost
direction will be a 89 89
unit replacement)
goal of the
Balanced for-sale market (6-month inventory) 23 23
development of the
Alamosa Housing Pending development adjustment -80 -80
Action Plan. Total Catch-up Housing Units 104 104
Keep-Up
New jobs (1% to 1.5% avg. growth/year) 130 200
Retiring employees (5% of jobs) 210 210
Total Keep-up Housing Units 340 410
Catch-up and Keep-up through 2026 444 514
*”Low” refers to a 1%/year job growth rate; “high” refers to a 1.5%/year job growth rate
**assumes local unemployment recovery post COVID-19
Williford/WSW/Rees/Continuum 11NEEDS BY OWN/RENT AND INCOME
There is a need for both ownership and rental housing in Alamosa that is available to residents and the
local workforce. If the current ratios are maintained, then 42% of new units should be for ownership
and 58% for rent.
This ratio, however, is somewhat dependent upon desired direction, housing policy, and the economic
feasibility of new projects. Rentals can help new workers and residents get established, while
ownership helps to retain workers and enable residents to build equity, achieve more stable housing
and strengthen community investment.
Summary of Housing Needs by Own/Rent Through 2026
Low High
Units needed through 2026 444 514
Ownership 185 215
Rental 259 299
Ownership housing should be created based on the income distribution of households in Alamosa, as
shown below.
• Prices for locals should range as low as about $160,000 up to about $275,000. This would
provide ownership opportunities for households earning between $40,000 through $65,000
per year (between about 70% and 115% AMI). The current for-sale market is not providing a
sufficient supply of homes in this price range.
• Homes affordable for households earning under $40,000 per year are also undersupplied;
however, producing homes at this price will not occur without substantial subsidies or
programs such as Habitat for Humanity. These households also often have trouble qualifying
for loans and meeting down payment purchase requirements. Rentals are more typical options
at this income level.
• Homes priced over $300,000 are oversupplied when compared to the proportion of local
households that can afford to purchase these homes.
Homeowner Income Distribution Compared to Homes Availability
Owner For-Sale
Household Income Range MAXIMUM
AMI Income Listings
(2-person household) Affordable Price
Distribution (Oct. 2020)
Under 50% $0 to $28,400 $125,200 26% 6%
50.1 - 80% $28,401 to $45,400 $200,400 21% 6%
80.1 - 120% $45,401 to $68,200 $300,600 27% 33%
120.1 - 200% $68,201 to $113,600 $500,900 18% 44%
Over 200% >$113,600 Over $500,900 8% 11%
TOTAL ¯ ¯ 100% 18 listings
NOTE: Shading indicates where there is a shortage of housing supply for residents and employees. Providing ownership priced
under 50% AMI is challenging; rentals are more typical. Homes priced below $300,000 are often in poor repair; better quality
and variety of homes in the 80.1-120% AMI range is needed.
Williford/WSW/Rees/Continuum 12There are very few units available to rent at any price point in the city. More rentals in general are
needed, but in particular:
• Rentals affordable for residents are needed at both the lower income spectrum (Demographics
This section includes the demographic data upon which the housing demand calculations are built,
including: population and household trends, household types, ethnicity and income.
POPULATION AND HOUSEHOLDS
Alamosa has experienced modest population and household growth over the past few decades:
• Alamosa has a current population just under 9,600 and represents about 59% of the county’s
population.
• The population has grown faster in the past 10 years (0.8% per year) than the previous 10
(0.1% per year). The State grew at 1.5% per year over the past decade, almost twice this rate,
and the county grew at 0.5% per year.
• The number of households in Alamosa has also grown since 2000 to about 3,700, increasing
by about 0.7% per year on average, a rate similar to population growth resulting in little
change in household size in the last 10 years.
Alamosa Population, 2000-2020 (est.)
9,580
8,682 8,812
3,248 3,440 3,705
2000 2010 2020 Est.
Population Households
Source: 2000 Census, 2010 Census, Colorado Demography Office, ESRI, Consultant Team
Race and Ethnicity
The percentage of Alamosa’s population that Alamosa Hispanic Population, 2000-2018
identifies as Hispanic or Latino (51%) is
significantly higher than that of the State (22%).
There was a six percentage point increase in the
Hispanic population from 2000 to 2010, although
the percentage has declined slightly since. 47% 49%
53%
Just under half the population identifies as non-
Hispanic (49%), a lower percentage than in 2000.
The percentage of the population identifying as 53% 51%
47%
non-Hispanic white decreased by about 7
percentage points from 2000 to 2010, but has
remained stable since. The non-Hispanic, non- 2000 2010 2018
white population has increased since 2010 and
now makes up about 8% of the city’s population. Hispanic Non-Hispanic
Source: 2000 Census, 2010 Census, 2014-2018 ACS
Williford/WSW/Rees/Continuum 14Alamosa Non-Hispanic Population, 2000-2018
2000 2010 2018
Non-Hispanic White 48.2% 41.5% 41.4%
Non-Hispanic Black 1.1% 1.4% 1.2%
Non-Hispanic Native American/Alaska Native 1.1% 0.9% 2.7%
Non-Hispanic Asian 0.9% 1.1% 1.3%
Non-Hispanic Native Hawaiian/Pacific Islander 0.1% 0.0% 0.6%
Non-Hispanic Other 0.3% 0.2% 0.1%
Non-Hispanic, Two Races 1.6% 1.6% 1.9%
Source: 2000 Census, 2010 Census, 2014-2018 ACS
Age Distribution
The population in Alamosa is very young with a median age of about 28 (State median is almost 37).
Almost one-third (32%) of the city’s population is 18-29 years of age, which is about 6 percentage
points higher than Alamosa County and almost 15 percentage points higher than that of the State. The
University and Junior College student population is the primary reason for this difference.
Alamosa’s age distribution has remained relatively stable over the past two decades. Changes since
2010 include:
• A decline in the under 5 age group and an increase in the 18-29 age group as a percentage of
the population.
• The percentage of the population in their 30’s and 40’s has consistently declined since 2000,
now only making up about 20% of the population. The declining percentage of the population
in prime working years aligns with employer concerns and struggles with finding employees.
(see Employment section).
• Seniors (age 62 and over) represent 14% of the population; the relative size of the senior
population has been increasing since 2000.
Alamosa Age Distribution, 2000-2018
20%
18%
16%
14%
12%
10%
8%
6%
4%
2%
0%
Under 5 5 to 17 18 to 21 22 to 29 30 to 39 40 to 49 50 to 61 62+
years
2000 2010 2018
Source: 2000 Census, 2010 Census, 2014-2018 ACS
Williford/WSW/Rees/Continuum 15Net Migration
The below chart shows net migration by age in Alamosa County between 2000 and 2010. Net
migration is the sum of people moving to the county (in-migration) minus the number leaving the
county (out-migration) by age group. The above data, plus interviews with employers, service
organizations, realtors and property managers in the area support that these migration patterns have
likely continued.
• ASU and TSJC help attract the younger 18 to 24 age group.
• The out-migration of persons ages 25 to 35 is related to the limited professional job
opportunities in the area for this group. The area is not keeping a significant portion of
students from the University and Junior College.
• The relatively neutral shift in persons over 65 indicates that the growth in the senior population
is due mostly to persons aging in place rather than in-migration.
Net Migration by Age, Alamosa County, 2000–2010
600
400
200
Net Migration
0
-200
-400
-600
-800
0 5 10 15 20 25 30 35 40 45 50 55 60 65 70 75 80 85
Age Group
2000 to 2010
Source: Colorado Demography Office
Household Size and Type
The city’s households are increasingly made up of one-person and unrelated people. Again, related to
the University population, only 47% of households in the city are comprised of families, compared to
56% in the county and 64% in the State.
• 40% of households are made up of just one person living alone, a 6-percentage point increase
since 2010,
• Non-family households comprised of unrelated individuals (e.g., roommates) represent 13% of
all households, a 5-point increase since 2010,
Williford/WSW/Rees/Continuum 16• The share of households with children has consistently declined since 2000, now making up
just under one quarter (24%) of all households, and
• Households in the city have 2.4 people on average, yet this differs by tenure. The average size
of owner-occupied units (2.6) is higher than rental units (2.1).
Alamosa Household Distribution by Type, 2000-2018
40%
34% 34%
21% 20%
18% 19%
16% 17%
13% 13% 13%
8% 8%
6% 6% 6% 7%
Couple, no children Couple, with Single parent Living alone Single householder, Other non-family
children households no children households
2000 2010 2018
Sources: 2000 Census, 2010 Census, 2014-2018 ACS, Consultant Team
Almost three-quarters (73%) of occupied homes in Alamosa have only one or two people living in
them, yet only 53% of homes have two bedrooms or fewer, indicating that the existing housing stock is
well suited for larger families or households, but does not provide as much choice for single-person
households, small families, or those wishing to downsize.
Number of People Per Home, 2018 Number of Bedrooms Per Home, 2018
33%
40% 30%
33%
20%
17%
17%
10%
Studio / 2 BR 3 BR 4+ BR
1-person 2-person 3-person 4+ person 1BR
Source: 2014-2018 ACS
HOUSEHOLD INCOME
An understanding of how much money households earn through wages or other income sources is
important to determining the availability and need for housing at various price prints. This section
evaluates income through two common measures: the median income of all households, as reported
Williford/WSW/Rees/Continuum 17by the U.S. Census Bureau’s American Community Survey (ACS), and AMI as reported by the U.S.
Department of Housing and Urban Development (HUD).
The median household income in Alamosa is about $35,000 per year, which is over $4,000 less than
that of the county and half that of the State.
• About 30% of the population lives below the poverty
Median Household Income, 2018
line, defined as the estimated minimum level of income
needed to secure the necessities of life. This rate is over Alamosa City $34,840
twice the rate of the State (14%). Alamosa County $39,191
• Not surprisingly, a much higher percentage of Colorado $68,811
households in the city also receive public assistance Source: 2014-2018 ACS
monies (8%) and food stamps/SNAP assistance (29%)
than in the State (2% and 8%, respectively).
Within the city, there is a wide income disparity between households who own and those who rent.
Households who own have an estimated median household income of just under $50,000, whereas
renter household median income is half that at about $25,700.
The income distribution of households by AMI is shown below. This is important because federal and
state programs that help create or subsidize affordable housing utilize AMI to determine whether
families are eligible for the program.
AMI represents the median family income of an area. This means that the AMI does not incorporate
incomes from non-family single and roommate households, which make up 53% of households in
Alamosa. As a result, the yearly AMI of families in Alamosa County ($56,800, 2-persons) is higher than
the median income of all households ($35,000).
In Alamosa, the largest percentage of households are at the bottom of the income scale. Over 40% of
households have incomes under $28,400; about 70% of these households rent. The high percentage
of renter households is due in part to the student population.
Alamosa Household Income Distribution 2020
Percentage of Percentage of
Household Income Renter Owner Percentage of
AMI Range [1] Households Households Total Households
200% >$113,600 7% 8% 8%
Total #
2,149 1,556 3,705
households -
Source: CHFA, Ribbon Demographics, LLC, Consultant Team
[1] based on a two-person household
Williford/WSW/Rees/Continuum 18HOUSING COST-BURDEN
Cost-burden indicates the extent to which housing costs exceed what Alamosa households can afford.
Households are considered to be cost burdened if their housing payment 2 exceeds 30% of their gross
income. Cost burdened households often have insufficient income left over for other life necessities
including food, clothing, transportation and health care. ACS data shows that rentals are not priced at
levels that are affordable for the majority of residents. In 2019, half of renters were cost-burdened. This
compares to about a third of owners that were cost-burdened.
Cost Burdened Households, 2019
29%
50%
71%
50%
Owners Renters
Pay less than 30% of Income on Housing Cost Burdened
Source: 2015-2019 ACS
2
The US Census defines “housing payment” to include rent and mortgage plus utilities.
Williford/WSW/Rees/Continuum 19Employment
This section provides an overview of the jobs, wages and commuting patterns in Alamosa County and
Alamosa. It also provides an overview of the 2020 Employer Survey and employer and stakeholder
interviews, discussing the extent to which housing or other factors affects the ability for businesses to
recruit and retain employees.
NUMBER OF JOBS
In 2020, there are an estimated 9,797 jobs in Alamosa County, with about 7,600 jobs (78%) located in
Alamosa. Evaluating changes in jobs at the county level since 2008:
• During the prior recession, jobs declined about 3% from the peak in 2008 to the low in 2013.
Jobs recovered by 2015/2016,
• Jobs had been growing an average of 1.5% per year since 2013, reaching 10,470 jobs in 2019,
and
• The Colorado Demography Office estimates that the COVID-driven recession has reduced
jobs by about 6% in 2020 compared to 2019. This was in line with the 2020 Employer Survey,
on which employers in Alamosa County indicated their jobs declined by about 5% on average.
Alamosa County Jobs, 2008-2020
10,600
10,400
10,200
10,000
9,800
9,600
9,400
9,200
9,000
2008 2009 2010 2011 2012 2013 2014 2015 2016 2017 2018 2019 2020
Source: Colorado Demography Office
Looking ahead to 2026, the Colorado Demography Office estimates that jobs will increase about 1%
per year. At this rate, the county will recover to 2019 job levels by 2026. If job recovery happens at the
same pace as following the prior recession, then there will be about 230 more jobs in 2026 than in
2019. A range is provided due to the uncertainty created by the COVID-19 impact and rate of job
recovery.
Williford/WSW/Rees/Continuum 20Alamosa County Jobs, 2019–2026 Projections
Average yearly
2019 2020 2026 growth rate (est.)
DOLA estimated growth 10,470 9,797 10,372 1.0%
Prior growth rate (2013-2019) 10,470 9,797 10,704 1.5%
Source: Colorado Demography Office; Consultant team
Employer survey responses indicate that 31% of Alamosa County employers expect to increase their
jobs over the next five years. The majority (53%) expect to stay about the same.
Employers anticipating growth include tourism support jobs (e.g. food services, accommodations,
retail and services), construction, real estate and finance, and health care. The number of jobs in the
health care sector has been growing in the area since at least 2010.
Expected Job Growth Over the Next Five Years, Alamosa County Employers
Don't know
13%
Stay about the
Increase your
same
number of
53%
employees
31%
Reduce your
number of
employees
3%
Source: 2020 Alamosa/San Luis Valley Employer Survey
TYPES OF JOBS AND WAGES
Wages in Alamosa County have increased about 2.5% per year on average since 2010. The average
wage in the county in 2020 is $40,463, which is 40% lower than the State average ($66,716). Lower
comparative wages make it difficult for many businesses to recruit skilled employees in particular to
the area, such as for education, skilled public service and management positions.
The largest percentage of jobs in the County are in government (including public educational
institutions) (23%) and health care and social assistance (19%). These industries pay average wages
that are slightly higher than the county average.
Williford/WSW/Rees/Continuum 21Jobs in retail (11%), lodging and food services (9%), and agriculture (7%) comprise the next highest
percentage of jobs, all of which pay below-average wages.
Annual Average Jobs (2019) and Wages (First Quarter 2020) by Sector, Alamosa County
25% $90,000
$80,000
20% $70,000
Average Yearly Wage
Percent of Jobs
$60,000
15%
$50,000
$40,000
10%
$30,000
5% $20,000
$10,000
0% $0
2019 Average yearly wage Average County Wage ($40,460)
Source: Colorado Demography Office; Quarterly Census of Employment and Wages (QCEW)
SEASONALITY OF JOBS
The number of jobs in Alamosa County increases from April through October each year. Jobs increase
about 5% between the low employment months of January and February and the highest employment
months of September and October. The extent of this change varies by industry.
• The most significant rise in jobs is seen in September and October, which is primarily due to
agriculture harvesting and processing needs (e.g., potatoes). (See Special Needs Populations
section, Seasonal Agricultural Workers for more information).
• The smaller rise beginning in April is related to seasonal jobs in manufacturing, construction,
tourism service jobs (arts and recreation, accommodation, food services), and also agriculture
(e.g., lettuce and spinach crops).
Williford/WSW/Rees/Continuum 22Alamosa County Jobs by Month, 2015–2019
8,800
8,600
8,400
8,200
8,000
7,800
7,600
7,400
Jan Feb Mar Apr May Jun Jul Aug Sep Oct Nov Dec
2015 2016 2017 2018 2019
Source: Colorado Demography Office; Quarterly Census of Employment and Wages (QCEW)
COMMUTING
Based on the 2020 Employer Survey, about 64% of employees Where Alamosa Employees Live
working in Alamosa reside within Alamosa County. This means
Total jobs 7,600
that about 2,700 employees commute into the city for work
each day from other counties. This includes 14% of employees Live in:
from Rio Grande County and 12% from Conejos County. Some Alamosa County 64%
employers noted that several employees looking to purchase Rio Grande County 14%
homes find options in these counties, where housing prices Conejos County 12%
tend to be lower than in Alamosa. Costilla County 2%
Saguache County 1%
Of employees not living in Alamosa County, employers
Mineral County 0%
estimate that about 40% (1,100 employees) would prefer to
Other 6%
live in the county (nearer to their job) if suitable housing they
Source: 2020 Employer survey, Consultant
could afford was available. team
UNFILLED JOBS AND LOCAL LABOR FORCE
Employers reported that about 3% of jobs in Alamosa are currently unfilled (250 jobs). Employers
stated that the predominate reason for unfilled jobs was due to a lack of applicants and lack of
qualified applicants. A few employers have budget constraints or a temporary hiring freeze so they
cannot yet fill jobs. For others, some positions just became available.
The current unemployment rate has dropped quickly in October 2020 to 5.3% since rising to over 9%
in April and June 2020. This is still well above the 2.9% unemployment reached in October 2019.
Williford/WSW/Rees/Continuum 23Unemployment Rate, Alamosa County, 2020
12.0%
9.6% 9.2%
10.0%
7.4% 7.6%
8.0% 6.1% 5.6% 5.5% 5.3%
6.0% 4.2%
3.9%
2.9% 3.0% 3.1%
4.0%
2.0%
0.0%
Unemployment Rate
Source: Local Area Unemployment Statistics (LAUS)
Despite the recent decline in jobs due to COVID, the number of persons in the labor force has
remained relatively stable in Alamosa County. There are only about 100 fewer members of the labor
force in the county in October 2020 as there were in October 2019. If the unemployment rate returns
to the 2.9% level seen last year, this means that about 260 employees living in the county are available
to fill local jobs as job recovery continues.
Labor Force, Alamosa County, October 2019 and 2020
Unemployment
Time period Labor Force Employed Unemployed rate
Oct. 2019 9,145 8,879 266 2.9%
Oct. 2020 9.050 8,574 476 5.3%
Source: Local Area Unemployment Statistics (LAUS)
Workers per household and number of jobs
held per employee Alamosa County, 2020
Total jobs 9,797
Workers in Alamosa County hold an
Jobs multiply held 760 (7.8%)
average of 1.1 jobs. There is an average of
1.72 employees per household with Jobs per employee 1.1
Source: Colorado Demography Office
earnings and 1.2 employees per household
in total (which includes households that
Alamosa County, 2018
receive and do not receive earnings from a
Employed persons 7,602
job) in the county. About 35% of
Households with earnings 4,419
households in Alamosa County and 36% in
Alamosa have zero workers, compared to Employed persons per employed household 1.72
Source: 2014-2018 ACS
only 22% in the State as a whole.
Alamosa County, 2018
Employed persons 7,602
Total households 6,153
Employed persons per total households 1.24
Source: 2014-2018 ACS
Williford/WSW/Rees/Continuum 24EMPLOYER SURVEY INSIGHT
Key insights gained from employers responding to the 2020 Employer Survey are highlighted below.
“Do you feel that the availability of housing that is affordable for employees in Alamosa County is:”
The most critical problem
in the region
Not a problem 6%
11% One of the more
serious problems
One of the 26%
region's lesser
problems
10%
A moderate problem
47%
Source: 2020 Employer Survey
• On average, employers noted that
employees filling low wage/low skill jobs
“I frequently hear that lack of housing is a
and entry-level professionals have the major milestone for companies to
most difficulty locating satisfactory grow/recruit/relocate here. I frequently
housing. hear that there is a lack of inventory and
• Skilled labor jobs and mid-management also that prices seem inappropriate (high)
positions followed second, with average in comparison with offered salaries.”
difficulty ratings of 2.9 and 2.8, - Local Realtor
respectively.
This is in line with many employer interviews. Employers noted that the current high rents affect lower
wage employees, and the lack of housing choice, nicer rentals and entry-level homeownership affects
entry- to mid-level employees.
When employees are hired can also make a difference for housing availability. It is harder to find
rentals when university students are in town.
Williford/WSW/Rees/Continuum 25Ability to Fill Jobs
The majority of employers in Alamosa have moderate (32%) or significant (28%) difficulty finding and
attracting qualified employees for jobs. Employers in all industries experience challenges.
“How would you rate your ability to find/attract qualified employees for your business or
organization?”
It depends on the
type of job and/or
time of year
10% Significant
Never a problem problem
7% 28%
Slight problem
23%
Moderate problem
32%
Source: 2020 Employer Survey
Employers that have problems filling jobs were asked what types of problems they have experienced.
This includes:
• Unskilled applicants, work ethic/dedication problems and no/few applicants top the list. This
was a recurring theme throughout employer and stakeholder interviews.
• The lower pay scale compared to other parts of the state has affected about 26% of employers.
Competition with the Colorado Springs and front range area for skilled positions makes it
difficult to attract workers from outside the San Luis Valley (Valley). Employees gain experience
in Alamosa then move to higher paying areas after two to five years. Strategies that businesses
have used to help mitigate this issue include:
o Having housing available that new hires can occupy until they can find more permanent
housing. This provides employees time to find homes they like rather than just taking what
they can get. It is also cheaper than paying for hotels. It takes employees an average of 6 to
8 months to locate housing to purchase; up to 2 to 3 months to locate suitable rentals. San
Luis Valley Health and ASU have housing they utilize for this purpose and find it very
helpful.
o Being picky. While waiting for the right fit can mean taking several months, or even two
years, to fill skilled positions, it significantly reduces turnover and improves the quality of
services provided. New hires with connections in the area or desire to live more remotely
are desirable.
o Helping potential hires “do the math.” Wages are lower, but so is the cost of living in
Alamosa compared to other areas.
Williford/WSW/Rees/Continuum 26• Problems such as a lack of child care options and limited transportation options have also
affected the ability to hire and retain employees for a respective 26% and 21% of employers.
• A lack of housing was one of the lesser-experienced issues noted by employers. About 12%
have had difficulty finding or keeping employees due to limited housing options. Employer
interviews noted that housing tends to be more of a problem when recruiting persons from
outside the San Luis Valley.
• “Other” issues noted include the area’s remoteness, lack of reliable air service, workforce
diversity and challenges when positions are seasonal or part time versus year-round.
“In the past year, have you experienced any of the following issues in finding or keeping qualified
employees?”
Unskilled applicants 53%
Work ethic/dedication problems 51%
No/few applicants 42%
Lower pay or benefits compared… 26%
Lack of child care options 26%
Lack of transportation 21%
Drug/substance abuse 21%
Spouse unable to find employment 12%
Lack of housing 12%
Long commute/tired of commuting 5%
Other 9%
0% 10% 20% 30% 40% 50% 60%
Source: 2020 Employer Survey
Employee Housing Challenges
The largest percentage of employers feel that the availability of housing that is affordable for
employees in Alamosa County is a “moderate problem” (47%). Another 26% feel it is “on e of the more
serious problems “and 6% stated it is “the most critical problem.”
“To what extent do your employees have difficulty locating satisfactory housing in the area”
Average rating*
Low wage/low skill jobs 3.4
Entry-level professional 3.0
Skilled labor jobs 2.9
Mid-level/mid-management 2.8
Migratory/seasonal employees 2.7
Upper management 2.3
Source: 2020 Employer Survey
*Rating on a scale from “1 – no problem” to “5 – Major difficulty”
Williford/WSW/Rees/Continuum 27You can also read