Brent Responsible Growth Strategy (RGS): Housing Theme 2018-2038 - May 2018 - Brent Council
←
→
Page content transcription
If your browser does not render page correctly, please read the page content below
Brent Responsible Growth
 Strategy (RGS): Housing
         Theme
       2018-2038

                     May 2018
Contents
Executive Summary .............................................................................................................. 2
Introduction ........................................................................................................................... 5
Baseline Analysis .................................................................................................................. 6
   Housing Demand & Supply................................................................................................ 6
      Population ...................................................................................................................... 9
      Tenure Types and Ownership ........................................................................................ 9
      Open Market ................................................................................................................ 11
      Affordable Housing ...................................................................................................... 16
   Demand Management ..................................................................................................... 20
      Housing Benefit............................................................................................................ 20
      Homelessness ............................................................................................................. 22
      Temporary Accommodation ......................................................................................... 22
      Overcrowding ............................................................................................................... 25
      Rough Sleepers ........................................................................................................... 26
      Housing for Older People ............................................................................................. 27
   Partnership Working ........................................................................................................ 28
      Registered Providers ................................................................................................... 28
      Private Developers – Volume homebuilders................................................................. 29
      Private Rented Sector .................................................................................................. 30
Trends ................................................................................................................................ 33
   Trend 1: Change in demographic structure and household mix ....................................... 33
   Trend 2: Worsening Supply & Demand Imbalance .......................................................... 36
   Trend 3: Increasing Unaffordability .................................................................................. 39
   Trend 4: The need for increased densification ................................................................. 44
   Trend 5: Maximising land use through mixed use development ....................................... 47
   Trend 6: Increased use of Town Centres and High Streets for Housing delivery ............. 49
   Trend 7: Increase of the Private Rented Sector (PRS) .................................................... 51
Responses .......................................................................................................................... 54
   Response 1: Change in Demographic Structure and Household Mix ............................... 54
   Response 2: Demand & Supply Imbalance ..................................................................... 55
   Response 3: Increasing Unaffordability ........................................................................... 56
   Response 4: Densification ............................................................................................... 58
   Response 5: Town Centres, High Streets and Mixed Use Development.......................... 61
   Response 6: Increase of the Private Rented Sector ........................................................ 62
References ......................................................................................................................... 65
Executive Summary
Over the next 20 years delivering enough housing to accommodate a growing
population will continue to be one of the most important and structural issues in Brent.
As London’s population continues to grow, to over 10.8 million between 2018 and
2038, housing delivery will have to accelerate beyond current levels in order to meet
the increased demand. Brent´s population will reach over 400,000 in 2038, which will
have extensive impacts in the borough including increased demand for good quality
affordable housing. Brent Council will have to adapt to a new and changing housing
scenario where lifestyles trends, affordability and tenure will redefine the housing
market, both in the private and public sector.
To understand the future of housing in Brent the report starts with a baseline overview
of current housing provision in the borough considering: tenure, open market,
affordable housing, housing benefit, homelessness, temporary accommodation,
overcrowding, rough sleepers, specialist housing need, partnership working and the
private rented sector. This chapter will also look at key pieces of legislation and policy
initiatives affecting decision makers in Brent. Key findings from this analysis include:
Although Brent has continued to increase its dwelling stock over the last 10 years
(period 2006 - 2016) by 10.5%, its current housing stock does not meet demand.
With an area of 4,324 hectares, the population density in Brent at 72 persons per
hectare (ha) is the highest in Outer London (mean average of 39.4 persons per ha)
and the 14th highest in England and Wales.
In 2016, there was a total of 116,650 dwellings in Brent, the 14th highest in the 33
London boroughs.
The Draft London Plan (2017) sets a new target of 29,150 additional homes to be
delivered in Brent over the period 2019/20 to 2028/29, an average of 2,915 per
annum. This is almost double the 2015 target of 1525 homes per annum.
Whilst Brent has seen a 2.3% increase in average house prices in the year to
February 2018, the overall picture shows a slowdown in the annual growth rate in
London since mid-2016.
Brent Council’s own housing stock consists of 11,378 homes as of February 2018,
comprised of 7,878 rented and 3,500 leasehold properties.
A third of Council stock constitutes bedsit and 1-bed units that make up over half
of all lettings, but under a third of demand. The demand for 3 and 4-bed units,
however, is double the available lettings.
There are around 60 Registered Providers who own stock in the borough, totalling
approximately 17,793 social rented and affordable rented homes.
The majority of the affordable housing stock in Brent is owned and managed by 12
main Registered Providers who are Brent’s principal development partners, the
remaining RPs own fewer than 100 properties.
Since 1997 Registered Provider stock has increased by approximately 108%, a
slightly faster rate than London (which increased by 100% during the same period).
The number of housing benefit claimants in Brent reached its peak in 2012-13 at
38,099, as of March 2018 this number is 34,488, around a 9.5% reduction.
Brent has the highest number of housing benefit claimants in all of the outer London
Boroughs, and has the 2nd highest number of housing benefit claimants in social
rented accommodation.
As of 1st April 2018, 3,632 households are in Bands A-C on the Housing Register
(those considered to be in housing need). In the period from April 2015 to April
2018 there has been an average 6.7% year on year reduction of households on
the Housing Register.
Brent has had one of the largest temporary accommodation portfolios in the
country for many years. As of 31st March 2018, Brent Council reports to have 2,478
households in Temporary Accommodation, a total reduction of around 44% since
2004.
In 2016/17 294 individuals were recorded rough sleeping in Brent, a 39% increase
on figures from 2015/16.
Brent is currently developing and rolling out its New Accommodation for
Independent Living (NAIL) project, which aims to identify develop and acquire
alternative forms of care to residential care for all vulnerable adult groups.
Owner occupation declined from 56% to 44% between 2001 and 2011, while
private rent increased from 20% to 31% in the same period.
As of Q3 2017, Brent had the 12th highest median private rent levels in London,
and the highest median private rent levels in outer London.
Consideration then turns to how housing provision in the borough can evolve in order
to address the challenges and seize the opportunities presented by the following
trends:
1. Change in demographic structure and household mix
2. Worsening supply and demand imbalance
3. Increasing unaffordability
4. The need for increased densification
5. Maximising land use through mixed use development
6. Increased use of Town Centres and High Streets for housing delivery
7. Increase of the private rented sector (PRS)
The implications of these trends include:
Demographic changes will prompt the need for different housing typologies,
increasing the demand for extra care, sheltered housing and leasehold schemes
for the Elderly but also increasing the demand for larger family homes.
Higher housing targets set by the GLA and Brent indicate a need to accelerate
housebuilding to an extent that outpaces historic housing delivery trends. Brent will
require a large proportion of overall housing delivery to be affordable.
Housing demand outweighing supply is having a knock on effect on affordability.
There is a clear trend that housing costs are outstripping wages at high rates. This
is effecting affordability of home ownership, private and social renting, and
reducing mobility between tenures. Increased unaffordability has implications for
levels of homelessness and poverty within the borough.
Given London’s scarce land supply and competing demands for land use, including
demand for new homes to accommodate London’s growing population, it is vital
that higher density is achieved.
Population growth in London demands not only increased housing delivery but also
increased employment space and jobs. Mixed use development, which combines
residential, infrastructure and commercial uses, and closer co-location of these
uses, will need to be utilised across London to make the most efficient use of land.
Due to their centrality and connectivity to the rest of the borough, demand for High
Street and Town Centre housing will continue to grow, and in the context of
declining retail in some areas represents an opportunity to boost both housing
supply and footfall on the high street.
London’s Private Rented Sector (PRS) has doubled in just over a decade and
continues to rise, with private renters projected at 40% of London’s households by
2030. New models of PRS delivery will grow but reliance on PRS in the housing
sector may have future affordability implications for some renters.
The chapter concludes with some potential responses to these trends. Suggestions
are made as to how to accommodate the shift in demographics and housing trends,
to maintain and improve quality of life and adequate housing for residents of Brent into
the future. These include:
Providing specialist accommodation for the most vulnerable, but also options to
accommodate multi-generational households and housing for working
professionals.
Diversifying the housebuilding industry in Brent to deliver the necessary step
change in housing supply by increasing the number of actors on the stage, greater
partnership working through joint ventures with small house builders and Housing
Associations, but also through the Council itself.
Ensuring a mix of tenures in housing delivery to combat unaffordability and to
encourage mobility between tenures, as well as targeted approaches to combat
the implications of unaffordability, including increased awareness of London
Housing Allowance for PRS landlords and support for vulnerable adults at risk of
homelessness.
Looking to more innovative options for housing delivery, through increased
densification in the ‘suburbs’, focusing on the utility of transport links and potential
densification through above or around station development; and encouraging
landowners to consider redeveloping sites that are currently used inefficiently –
these include surface car parks and single-storey low density retail centres and
stores – within Town Centres and High Streets.
Finally, working more closely with private landlords to drive up standards in the
PRS and explore options to improve affordability through Discount Market Rent
products and initiatives such as London Living Rent.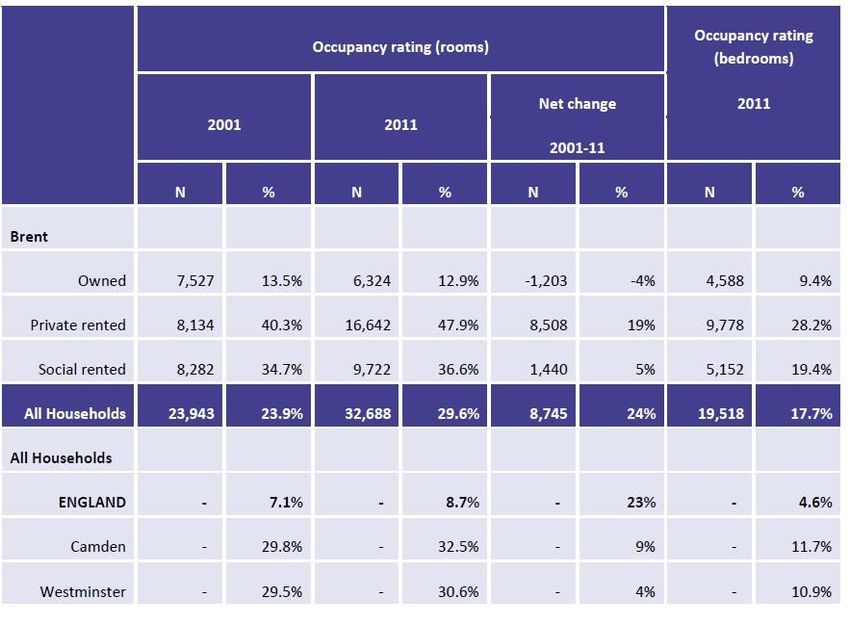
Introduction

Over the next 20 years delivering enough housing to accommodate a growing
population will continue to be one of the most important and structural issues in Brent.
As London’s population continues to grow, to over 10.8 million between 2018 and
2038, housing delivery will have to accelerate beyond current levels in order to meet
the increased demand. Brent´s population will reach over 400,000 in 2038, which will
have extensive impacts in the borough including increased demand for good quality
affordable housing. Brent Council will have to adapt to a new and changing housing
scenario where lifestyles trends, affordability and tenure will redefine the housing
market, both in the private and public sector.

This report outlines the role of housing in contributing to Responsible Growth in Brent
from 2018-2038. It considers how housing provision in the borough will need to evolve
in order to address both the challenges and opportunities presented by the following
trends:

   1.   Change in demographic structure and household mix
   2.   Worsening supply and demand imbalance
   3.   Increasing unaffordability
   4.   The need for increased densification
   5.   Maximising land use through mixed use development
   6.   Increased use of Town Centres and High Streets for housing delivery
   7.   Increase of the private rented sector (PRS)

The report is organised into Baseline, Trends and Reponses. The Baseline section
presents the context which defines the current status of Housing provision in Brent.
By examining both London and Brent, this section looks at changes in tenure types,
prices and affordability; as well as, changes and policy responses in relation to housing
benefit, homelessness, temporary accommodation and specialist housing provision;
and finally, partnership working across the private and social rented sector and with
the housebuilding industry. Second, the Trends section identifies and analyses key
trends and the anticipated challenges and opportunities these will have for the housing
sector. Third, the Responses section presents potential strategies and policy choices
that can address the challenges and create opportunity for Brent and its residents to
prosper in the coming years.
Baseline Analysis

Housing Demand & Supply

House building in the UK has been on a long term downward trend since 1970 (Fig.1).
Housing supply has continued to fail to meet demand despite increases in prices
showing the housing markets unresponsiveness1. Between 1969 and 1979,
permanent dwellings completed decreased by 33%, from 1979 to 1989 there was a
12% decrease, from 1989 to 1999 there was a 17% decrease, and from 1999 to 2009
there was an 18% decrease. Despite an 18% increase in permanent dwellings
completed from 2009 to 2017, supply has still not met demand, and for this reason the
National Planning Policy Framework has specified the need ‘to boost significantly the
supply of housing’.
                                 Figure 1: Permanent dwellings completed, DCLG 1969 – 2017

            400,000

            350,000

            300,000

            250,000

            200,000

            150,000

            100,000

             50,000

                   0
                       1969-70
                                 1971-72
                                           1973-74
                                                     1975-76
                                                               1977-78
                                                                         1979-80
                                                                                   1981-82
                                                                                             1983-84
                                                                                                       1985-86
                                                                                                                 1987-88
                                                                                                                           1989-90
                                                                                                                                     1991-92
                                                                                                                                               1993-94
                                                                                                                                                         1995-96
                                                                                                                                                                   1997-98
                                                                                                                                                                             1999-00
                                                                                                                                                                                       2001-02
                                                                                                                                                                                                 2003-04
                                                                                                                                                                                                           2005-06
                                                                                                                                                                                                                     2007-08
                                                                                                                                                                                                                               2009-10
                                                                                                                                                                                                                                         2011-12
                                                                                                                                                                                                                                                   2013-14
                                                                                                                                                                                                                                                             2015-16

                                                                                                   United Kingdom                                                  England

                                                                   Source: Permanent dwellings completed DCLG: 2018

In London the imbalance between supply and demand is exacerbated by faster
population growth compared to the rest of the UK, as well as scarcity of developable
land2 among other factors. As such for many decades the number of new homes built
in London is far less than the required need (Fig.2). The majority of homes in London
are now built by private developers, moving away from the dominance of Local
Authorities in the 1970s, with a proportion delivered by Housing Associations and other
public sector bodies.

1   Barker, K. (2004) Review of Housing Supply, Delivering Stability: Securing our Future Housing Needs, London: HMSO
2
    Ibid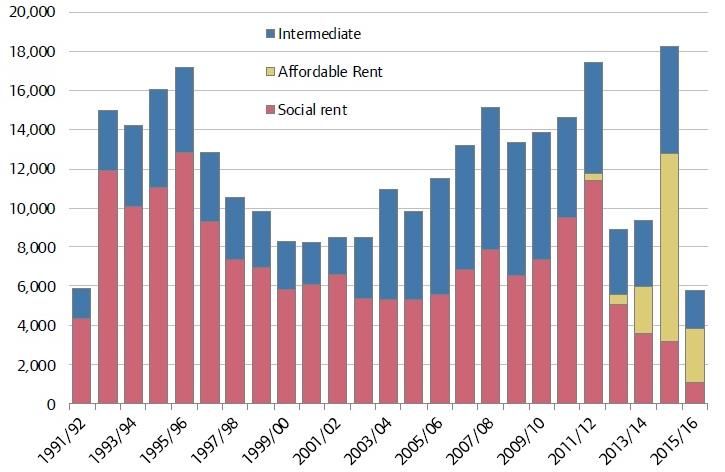
Figure 2: Estimated number of new build homes completed in London by tenure, 1871 – 2016

                                             Source: GLA, Housing in London: 2017

The reliance on this private-led model of delivery has economic constraints. Due to
the limited capacity within the private housebuilding industry, with a small number of
volumetric housebuilders dominating the marketplace, and high costs of developing
large sites, developers seek to recover their investment by increasing density,
reducing the levels of affordable housing and building more slowly to ensure that local
markets are not saturated and house prices do not fall3. As a result, house prices have
been consistently driven up, such that currently around 80% of new build homes are
affordable to only 8% of London households4. At the same time, London continues to
be an attractive place to live and work, meaning the increases in jobs and people have
outpaced the number of homes available (Fig. 3).

       Figure 3: Indexed trend in number of jobs, people and homes in London (1997 = 100)

                                             Source: GLA, Housing in London: 2017

3 Communities and Local Government Committee (2017) Capacity in the homebuilding industry: Tenth report of Session 2016-17, London:
House of Commons
4
  Greater London Authority (2017) London Housing Strategy: Draft for Public Consultation, London: Greater London Authority
London has become more unaffordable than the rest of the UK, with the ratio of median
house price to median gross annual residence-based earnings increasing to 13.24 in
comparison to 5.20 in the North East (the most affordable place in England and Wales)
(Fig.4).

       Figure 4: Median house price to median gross annual earnings ratio 2002-2017
      14.00

      12.00

      10.00

       8.00

       6.00

       4.00

       2.00

       0.00
               2002 2003 2004 2005 2006 2007 2008 2009 2010 2011 2012 2013 2014 2015 2016 2017

                               England           Wales           London            North East

                                  Source: Office for National Statistics: April 2018

Although Brent has continued to increase its dwelling stock over the last 10 years
(period 2006 - 2016) by 10.5%, its current housing stock does not meet its demand
(Fig.5). Moreover, Brent Council has been experiencing important changes in housing
demand and supply since the 2001 Census, mainly in the tenure types and household
sizes due its changing demographic.

         Figure 5: Net additional dwellings total stock estimates, DCLG 2004 - 2016
         1,800                                                                                      118,000
         1,600                                                                                      116,000
         1,400                                                                                      114,000
                                                                                                    112,000
         1,200
                                                                                                    110,000
         1,000
                                                                                                    108,000
              800
                                                                                                    106,000
              600
                                                                                                    104,000
              400                                                                                   102,000
              200                                                                                   100,000
               0                                                                                    98,000

                                 Brent additional per year            Brent total dwellings

                    Source: Total dwellings and net additions to stock per year, DCLG: April 2017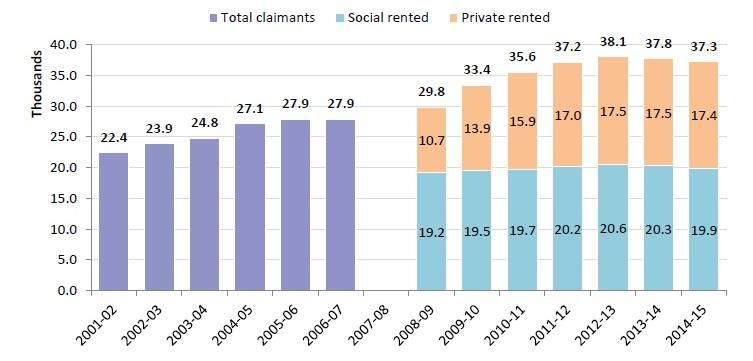
Population

With an area of 4,324 hectares, the population density in Brent at 72 persons per
hectare (ha) is the highest in Outer London (mean average of 39.4 persons per ha)
and the 14th highest in England and Wales. Brent’s population has seen a substantial
increase from 311,215 to 332,6975 in the 2011-2017 period. In 2016, there was a total
of 116,650 dwellings in Brent, the 14th highest in the 33 London boroughs6. Brent’s
Local Plan 2010 projects development of over 9,000 homes between 2017 and 2026
but is currently being updated in line with the draft London Plan (2017). The draft
London Plan (2017) set a new target of 29,150 additional homes to be delivered in
Brent over the period 2019/20 to 2028/29, an average of 2,915 per annum. This is
almost double the 2015 target of 1525 homes per annum.

Since 2011 Brent’s population has kept a relatively young age structure. In 2018, 32%
of Brent’s population comprised people aged 0-24 years, slightly higher than the
London average of 31%, while 12% of Brent’s population comprised people aged 65-
80 years. Brent’s average household size at 2.8 persons per household is the third
highest in London, which affects the nature of the housing demand7.

In 2018, 2.8% of Brent’s population comprised older people aged 81+ years, compared
to 3% of London’s population. This age group can comprise frail elderly persons with
increasingly complex care needs. The population in older age groups (aged 65 years
or above) is projected to increase by a third of total population growth (around 22,000
individuals)8. Having both a young population and an increasing number of people
aged 65 years and over creates challenging and disparate housing requirements in
Brent – to supply both larger family dwellings and specialist care facilities.

Tenure Types and Ownership

The recent trend, starting around 1990, has been from ‘owned’ to ‘rented’, with housing
tenure shifting towards the private rented sector and away from owner occupancy
(either outright or with a mortgage).The share of households that own their homes
outright has been relatively flat over the last two decades and stood at 21% in 2016,
while the share that live in social housing has fallen slowly over the same period,
reaching 23% in 2016. Changes since 2011 have been less dramatic, although the
shares of mortgagors and private renters converged at 28% in 2016 (Fig.6)

5 Brent Council (2013) Brent 2011 Census Profile, London: Brent Council
6 Ministry of Housing, Communities and Local Government (2017) Number of dwellings by tenure and district, England: Table 100, London:
Ministry of Housing, Communities and Local Government. Available at: https://www.gov.uk/government/statistical-data-sets/live-
tables-on-dwelling-stock-including-vacants
7 Office of National Statistics (2011) Census

https://www.ons.gov.uk/peoplepopulationandcommunity/birthsdeathsandmarriages/families/articles/householdsandhouseholdcomp
ositioninenglandandwales/2014-05-29#household-size-comparisons-within-the-united-kingdom
8   GLA Population Projections - Custom Age Tables: Long trend 2017
Figure 6: Annual trend in household tenue, London 1821 – 2016
Source: GLA, Housing in London: 2017
Different affordable housing rented tenure types can be identified in Brent, both in the
public and private sector. We can find tenants under:
Social Rent: by Traditional form of affordable housing owned and managed by Local
Authorities and Registered Housing Providers. Low “formula” or “target” rents based
on house prices and earnings, kept in line with the national rent regime, and made
available on 2-5 year fixed term tenancies alongside lifetime tenancies at around
20%-50% of market rents.
Affordable Rent: Introduced in 2010 under a government grant programme and
subsequently defined in the National Planning Policy Framework in 2012. Owned
and managed by Local Authorities and Registered Housing Providers, and
designed for households in need of social rent housing, but with higher rents at up
to 80% of market levels (inclusive of service charge), although in practice the
average rent charged is around 65% of market rent levels. Generally made
available on 2-5 year fixed term tenancies.
London Affordable Rent: New product, introduced by the Mayor of London under
the most recent grant programme. Lower rents more in line with social rents, but
made available on fixed term tenancies.
London Living Rent: Another new product from the Mayor of London. Despite the
name, this is a rent-to-buy product. Rents are pegged at a proportion of local
earnings to enable households to save. After 10 years the tenant is expected to
either buy the home they are in outright or under shared ownership arrangements,
or move out and buy somewhere else. Discounted Market Rent: Mainly delivered in larger Build-to-Rent (BTR) schemes, held in the private sector and made available under Assured Shorthold Tenancies (ASTs). Rents are set below market levels and inclusive of service charge. Tends to be delivered as an intermediate middle income product, rather than to meet local authority statutory housing duties. With respect to home ownership, as well as conventional home ownership on a Freehold or Leasehold basis (owned outright or with a mortgage), there are a number of low cost home ownership options. These include: Shared Ownership. The buyer purchases a share in a home, usually between 25%- 75%, and pays rent on the remaining share retained by the landlord (usually a housing association but could also be a council or private developer). There is usually an option to buy further shares up to 100% outright ownership, which is known as “stair-casing out”. The purchaser is responsible for repairs and maintenance to the property. Shared / Fixed Equity: this is more unusual and mainly offered by housing associations and councils, for example to existing leaseholders on estate regeneration schemes. The buyer purchase a share as with shared ownership but does not pay rent on the remainder. The landlord will be repaid when the property is sold and share in any uplift in value. Starter Homes: Stalled government First Time Buyer (FTB) scheme drawn up in 2015. Buyer purchases the home at a discount to the full open market value, typically 20% discount, with the additional equity gifted to the buyer on condition the property is not rented out or resold for the first 5 years. Discounted Market Sale: Tend to be delivered in private developments. Buyer purchases the home at a discount to the full open market value, typically 20% discount, with the additional equity held by the local authority. Open Market The Mayor of London’s Housing in London (2017) report suggests that by 2025 private renting will be at the same level as owner occupation (Fig. 6). The continued decline in home ownership in London (and across the UK) stems from changes in lifestyles, with many millennials now choosing to rent, but has its main root in the increasingly unaffordability of housing.
Figure Figure
              7: Decadal
                      8:trend in household
                         Decadal    trend tenures, London 1961-2011,
                                           in household    tenures,with PwC projection
                                                                     London            to 2025
                                                                              1961-2011,     with PwC
                                                  projection to 2025

                                       Source: GLA, Housing in London: 2017

Average house prices in London have grown more than five times from their 1970
level, after adjusting for inflating. The increase has been substantial since the late
1990s, particularly in London, but also evident in the rest of England. House prices
have increased at almost double the rate of average weekly earnings over the same
period, without adjusting for inflation, resulting in increasing unaffordability. (Fig. 9 &
10).

                     Figure 9: Average House Price, All Dwellings 1970 – 2013

               450,000
               400,000
               350,000
               300,000
               250,000
               200,000
               150,000
               100,000
                50,000
                      -
                          1982

                          1998
                          1970
                          1972
                          1974
                          1976
                          1978
                          1980

                          1984
                          1986
                          1988
                          1990
                          1992
                          1994
                          1996

                          2000
                          2002
                          2004
                          2006
                          2008
                          2010
                          2012

                                                    UK          London

           Source: Office for National Statistics, House Price Index, Table 29 Housing Market: October 2015
Figure 10: Average Gross Weekly Earnings, 1970 – 2013
800.0
700.0
600.0
500.0
400.0
300.0
200.0
100.0
0.0
1970
1984
1998
2012
1972
1974
1976
1978
1980
1982
1986
1988
1990
1992
1994
1996
2000
2002
2004
2006
2008
2010
Male Earning Female Earning
Source: Office for National Statistics, New Earnings Survey (NES) time series of Gross Weekly earnings from 1938 to 2017:
2017
The Office for National Statistics (ONS) Housing Summary Measures (Oct 2016)
shows the median house price in London increased by 38% from £300,000 to
£415,125 between 2011 and 2015. Over the same period, median gross annual salary
increased by only 17% from £21,271 to £24,927.
The Land Registry House Price Index (HPI) shows the average property price in Brent
increased by 63% from March 2008 to February 2018, from £300,000 to £486,762
(Fig.11). Over the same period the ratio of median house price to median residence
based earnings has increased by just under 60%, from 9.89 to 15.76.9 Whilst house
prices have always outpaced earnings, in recent years there has been a stark increase
(Fig.12).
9Office for National Statistics (2017) New Earnings Survey (NES) time series of Gross Weekly earnings from 1938 to 2017, London: Office
for National Statistics. Available at:
https://www.ons.gov.uk/employmentandlabourmarket/peopleinwork/earningsandworkinghours/adhocs/006301newearningssurveyn
estimeseriesofgrossweeklyearningsfrom1938to2016Figure 11: Average Price for All Property Types Brent, Mar 2008 – Feb 2018
600000
500000
400000
300000
200000
100000
0
2012-11
2013-03
2013-07
2008-03
2008-07
2008-11
2009-03
2009-07
2009-11
2010-03
2010-07
2010-11
2011-03
2011-07
2011-11
2012-03
2012-07
2013-11
2014-03
2014-07
2014-11
2015-03
2015-07
2015-11
2016-03
2016-07
2016-11
2017-03
2017-07
2017-11
Source: House Price Index, Land Registry: April 2018
Figure 12: Median house price to median gross annual earnings ratio 2002-2017
18.00
16.00
14.00
12.00
10.00
8.00
6.00
4.00
2.00
0.00
Source: Office for National Statistics, 2002 to 2017: April 2018
Post the UK referendum to leave the EU and Stamp Duty Land Tax (SDLT) changes
introduced in 2016, there has been some stagnation in the London property market.
In London, average house prices decreased by 1.0% in the year to February 2018, the
lowest annual growth seen since September 200910. Whilst Brent has seen a 2.3%
increase in average house prices in the year to February 2018, the overall picture
shows a slowdown in the annual growth rate in London since mid-2016 (Fig.13). Over
a longer period, prices in the prime London market have fallen from their 2014 peak
10HM Land Registry (2018) UK House Price Index England: February 2018, London: HM Land Registry Available at:
https://www.gov.uk/government/publications/uk-house-price-index-england-february-2018/uk-house-price-index-england-february-
2018by an average of 6.1%. The prime central London market has been hit harder, with a
decline in price of 13.2%11.
Figure 13: Annual price change for England and London over the past 5 years
Source: HM Land Registry, UK House Price Index England: February 2018
The stagnation in the property market is also reflected in the number of transactions
completed in recent years. March 2016 saw the highest number of property sales,
preceding the introduction of higher SDLT rates on additional properties in April 2016.
HM Revenue and Customs reported the number of residential property transactions
decreased by 1% in the year to February 2018 (Fig.14). Moreover, the Royal Institute
of Chartered Surveyors (RICS) have reported that there has been a continued
decrease in sales as a percentage of surveyors’ stock within London12. All contributing
to a weak and uncertain outlook for the property market in London.
Figure 14: Total UK Residential Property Transactions, Sep 2016 – Feb 2018
Source: HM Revenue and Customs, UK Property Transactions Count: March 2018
11Savills PLC (2017) Spotlight: Prime London & Country, ‘Mind the gap’, London: Savills PLC
12London Datastore (2018) London Housing Market Report, London: London Datastore. Available at:
https://data.london.gov.uk/housingmarket/Affordable Housing
Figure 15: Affordable housing delivery in London, 1991/92 to 2015/16
Source: GLA, Housing in London: 2017
As housing prices continue to increase in all of London, access to housing and home
ownership has become limited to many of its residents. For this reason there is
continued pressure on government and local authorities to provide accessible and
affordable housing.
Brent Council Housing Stock
Brent Council’s own housing stock is consists of 11,378 homes as of February 2018,
comprised of 7,878 rented and 3,500 leasehold properties13. Most of the housing stock
is located in the south-east region of the borough and is comprised of flats on small
and medium-sized estates (Fig 16).
13
Brent Council (2018) HRA Business Plan: Draft, London: Brent CouncilFigure 16: Housing Estates in Brent
Source: GIS, Brent Council: 2018
Brent Council acts as a landlord under tenancy and leasehold agreements, its main
responsibilities is to provide housing and management services. The Council’s
relationship with its tenants and leaseholders is therefore a different one from that with
other borough residents, as it is primarily a contractual one under which these
households pay rent or service charges in exchange for specific services. From April
2002 until October 2017, Brent Council delegated these responsibilities to Brent
Housing Partnership (BHP). A review of the Council Housing Management options
came to the decision to bring the management of council properties back in house.
Average occupancy for tenanted and leasehold properties is 3.3 and 4.8 persons
respectively, with the latter in part reflecting the extent of private letting of leasehold
properties, giving a total of around 43,000 residents or over 1 in 8 of Brent’s population.
Around a third of tenants are over 60 years old. 4% of tenants have a disability and
8% have a vulnerability. There is a marked difference between the balance of lettings
available and the profile of demand by bed-size. A third of Council stock constitutes
bedsit and 1-bed units and make up over half of all lettings, but under a third of
demand. The demand for 3 and 4-bed units, however, is double the available lettings14.
There has not been considerable growth in social housing stock in Brent due to loss
through Right to Buy and estate regeneration.
14
IbidRegistered Provider Housing Stock
There are around 60 Registered Providers who own stock in the borough, totalling
approximately 17,793 social rented and affordable rented homes, to which the Council
has nomination rights and can discharge its statutory housing duties. The number of
active registered providers (RPs) in Brent varies, either because new players move
into the borough or, more commonly, because of mergers. The majority of the stock
in Brent is owned and managed by 12 main RPs who are Brent’s principal
development partners, the remaining RPs own fewer than 100 properties. The 12 main
RPs in Brent are Catalyst, Peabody (who have recently merged with Family Mosaic),
Notting Hill Genesis (another recent merger), Home Group, Hyde, L&Q, Network,
Metropolitan, Octavia and Origin. Registered Providers stock is concentrated in the
south of the borough, predominantly in areas with the highest levels of deprivation
such as Harlesden, Kensal Green and Willesden Green. Registered Providers have
strategic importance in Brent as a key asset to supplying required social housing
properties. Since 1997 Registered Provider stock has increased by approximately
108%, a faster rate than London (having increased by circa 100% during the same
period) (Fig.18).
Figure 17: Distribution of Registered Social Housing Providers in Brent
Source: GIS, Brent Council: 2018Figure 18: Registered Social Landlord Housing Stock, Brent, 1997 – 2017
20,000
18,000
Number of Self-Contained units 16,000
14,000
12,000
10,000
8,000
6,000
4,000
2,000
0
2003
1997
1998
1999
2000
2001
2002
2004
2005
2006
2007
2008
2009
2010
2011
2012
2013
2014
2015
2016
2017
Source: Department for Communities and Local Government, Table 115: 2018Demand Management
One of the most fundamental issues and the biggest responsibility of the council relies
on its ability to manage the housing stock, especially of individuals living in social
housing and residents in housing need. Problems of affordability in the private sale
and rental markets continue to worsen and, in the case of the latter, have been
compounded by welfare reform and restrictions on Housing Benefit. Homelessness
applications and acceptances have grown across London, with a particular growth in
evictions from the private rented sector (PRS)15.The growth of the PRS, while making
an important contribution to meeting housing demand, is concurrently a source of
demand pressure, through evictions and service pressures, as the council responds
to the need to raise standards and improve management. Moreover, there continues
to be a growing need for specialist housing for individuals aged 65 years and over.
These issues will be considered below.
Housing Benefit
The number of housing benefit claimants in Brent reached its peak in 2012-13 at
38,099 (Fig. 19), as of March 2018 this number is 34,488, around a 9.5% reduction.
Whilst the average annual growth from 2001-02 to 2006-07 was 1,100 families, from
2006-07 onwards this increased around 1,700 families each year on average16. The
increase in this period in housing benefit claimants, in particular those living in private
rented housing, coincides with the increases observed on the housing register in
Brent. It is likely that many households applying for housing benefit would have also
registered their interest in affordable housing.
:
Figure 19: Number of claimants in receipt of housing benefit in Brent by
tenure, DWP
Source: Department for Work and Pensions from London Borough of Brent SHMA: 2016
15 Brent Council (2016) Scrutiny Committee: Housing Pressures in Brent, London: Brent Council
16
Opinion Research Services (2016) London Borough of Brent Strategic Housing Market Assessment: Report of Findings, London: s.n.The information relating to tenure of housing benefit claimants improved in 2008-09.
It is clear to see that whilst the large majority of claimants are in social rented
accommodation, there has been a rapid increase in the number of benefit claimants
in PRS. The number of claimants in social rented housing increased from around
19,200 to 20,600 over the period 2008-09 to 2012-13 – a 7% increase per annum; in
contrast the number of claimants in private rented accommodation increased from
10,700 to 17,500 in the same period – a 65% increase per annum17.
As of February 2018, 18,118 housing benefit claimants were in social rented
accommodation in comparison to 16,572 in private rented sector. Brent has the
highest number of housing benefit claimants in all of the outer London Boroughs, and
has the 2nd highest number of housing benefit claimants in social rented
accommodation (Fig.20).
Figure 20: Outer London Borough comparison of Housing Benefit claimants by tenure,
February 2018
35,000
30,000
25,000
20,000
15,000
10,000
5,000
0
All HB claimants Social Private
Rented Sector Rented Sector
Source: Department for Work and Pensions, Table 2 Housing Benefit claimants by Local Authority by Tenure: May 2018
The number of housing benefit claimants has continued to decline from the peak in
2013 to March 2018 – now being around 34,488 (Fig.21). What the number of housing
benefit claimants does not show is the number of individuals in affordable
accommodation who are not in receipt of housing benefit but cannot afford market
rents and therefore have an unmet need for affordable housing. The Strategic Housing
Market Assessment (SHMA) outlines individuals who have an unmet need for
affordable housing include those who are suffering from homelessness, those who are
in temporary accommodation, and those who are in the reasonable preference
17
Ibidcategory on the housing register. In total the SHMA for Brent identifies there is
currently 6,694 households that are in affordable housing need that are unable to
afford their own housing18. Further detail on individuals suffering from homelessness,
individuals in Temporary Accommodation and overcrowding in Brent considered
below.
Figure 21: Number of claimants in receipt of housing benefit in Brent, Jan 2013 – Mar 18
Number of housing benefit claimants, Brent - Jan 13 to Mar 18
39,000
38,000
37,000
36,000
35,000
34,000
33,000
32,000
Source: Department for Work and Pensions, Housing Benefit Caseload Table 1 Jan 13 – Nov 17: February 2018 and Brent
Council Data, Dec 17 – Mar 18: May 2018
Homelessness
The failure to provide new housing supply across all tenures has exacerbated
affordability problems in the private sale and rental markets. Structural factors like
welfare reforms and lack of affordable housing contribute to households becoming, or
being considered, homeless. There are also a number of personal causes such as
poor physical and mental health or family breakdown. The legal definition of
homelessness does not just incorporate individuals who are sleeping rough but also
those who are at risk of losing their home or those who are at risk or violence and
cannot continue to live in their current resident amongst other reasons. Brent’s
Housing Register monitors local housing need and all applicants seeking social
housing in Brent must apply through its Housing Register. As of 1st April 2018, 3,632
households are in Bands A-C on the Housing Register (those considered to be in
housing need). In the period from April 2015 to April 2018 there has been an average
reduction of 6.7% year on year, with a 19% total reduction. Of those currently on the
housing register the majority (around 70%) are accepted as homeless with
overcrowding and requiring elderly specialist accommodation the next most common
causes (around 9% each respectively).
Temporary Accommodation
As of 31 March 2018, Brent Council reports to have 2,478 households in Temporary
Accommodation (TA)19. Brent has had one of the largest temporary accommodation
18 Ibid
19
Brent Council (2018) Business Objects Report, Community Wellbeing, London: Brent Councilportfolios in the country for many years. At its peak, Brent had almost 1 in 25
households living in temporary accommodation20. Nevertheless, there has been
downward trend in the number of households in TA. In 2004/05 4,453 households
were in some form of TA, by 2010/11 this had reduced to 3,019 households, and now
at the lowest in the last twenty year period at 2,478 – a total reduction of around 44%
over the 14 year period (Fig.22 & Fig.23).
Figure 22: Number of households in Temporary Accommodation, 2004 - 2017
5,000
4,500
4,000
3,500
3,000
2,500
2,000
1,500
1,000
500
0
04/05 05/06 06/07 07/08 08/09 09/10 10/11 11/12 12/13 13/14 14/15 15/16 16/17
Source: MHCLG 2018. Live Table 783: Local authorities' action under the homelessness provisions of the 1985 and 1996
Housing Acts
Figure 23: Number of households in Temporary Accommodation and Total Accepted as
homeless and in priority need by quarter, 2014 – 2017
4,000
3,500
Number of Households
3,000
2,500
2,000
1,500
1,000
500
0
Q2 Q3 Q4 Q1 Q2 Q3 Q4 Q1 Q2 Q3 Q4 Q1 Q2 Q3 Q4
2014 2014 2014 2015 2015 2015 2015 2016 2016 2016 2016 2017 2017 2017 2017
Temporary Accommodation Total accepted as homeless and in priority need
Source: MHCLG 2018. Live Table 792a: Local authorities' action under the homelessness provisions of the 1985 and 1996
Housing Acts
20Local Government Association (2017) Council innovation and learning in: Housing our Homeless Households, London: Local Government
AssociationSecuring Temporary Accommodation has become much harder in recent years across London and in Brent there was rise in the use of B&B accommodation to a maximum of 285 households in October 2014, as well as self-contained hotel annexes and self- contained nightly paid private rented units21. Since then Brent has been successful in reducing the number of households in B&B and other unsuitable and high cost TA accommodation with only 29 households in B&B in March 2017. Whilst this number has now increased to 51 as of 31st March 2018, it goes against the wider London trend. Brent has reduced the number of households in B&B TA and others through retaining one of the highest numbers of housing association leased properties of any council in England and maintaining a good relationship with housing associations such as Genesis, Network and Shepherds Bush that manage these properties; and devoting 80% of social lettings to homeless households in TA2223. Brent Council is committed to reducing the overall number of households in TA and the 2016 Temporary Accommodation Reform Plan introduced a programme called ‘Find Your Home’, which was launched in August 2016, to prevent homelessness and thus the need for TA by intervening early when households are threatened with homelessness. The Housing Options team provide information and resources to affected households so they can access affordable PRS accommodation within the borough. The ‘Find Your Home’ makes use of the power provided by The Localism Act 2011 by making an offer of suitable accommodation in the PRS to end the homelessness duty, thus breaking the link between homelessness and direct access to social housing24.The ‘Find Your Home’ programme is for those threatened with homelessness and helps households identify a suitable property that is affordable in line with households benefit income and Local Housing Allowance (LHA) rent. In 2016- 17, 415 households were prevented from becoming homeless, 296 of which were attributable to the ‘Find Your Home Programme’, by Q3 2017-18 this had increased to 943 and 517 households respectively25. A major barrier to the success of the programme is the affordability of accommodation, due to the average market rent in Brent being significantly higher than the Local Housing Allowance rate combined with the Government’s Welfare Reform that caps the total amount of benefits a single or two parent family can receive at £442 p/w, which reduces the housing benefit entitlement received. Another measure introduced in the TA Reform Plan was for the council to acquire a large portfolio of Private Rented Sector (PRS) accommodation, which would be professionally managed and in which costs could be protected against rental inflation26. i4B Holdings Limited was created in 2016 to facilitate the delivery of the options within TA Reform Plan as an ‘arm’s length’ company for Brent Council. Initially the company was set up with a loan of £1 million to fund the acquisition and subsequent management of a target portfolio of 300 properties in and around Brent27. In 2017 Cabinet agreed i4B would provide services to the Council up to 2021 for a contract value of £2.3 million. As of 2 January 2018, i4B had delivered 21 Ibid 22 Local Government Association (2017) Council innovation and learning in: Housing our Homeless Households, London: Local Government Association 23 Brent Council (2016) Temporary Accommodation Reform Plan Annexe 1, London: Brent Council 24 Brent Council (2018) Housing Scrutiny Committee: Find Your Home Progress Report, London: Brent Council 25 Ibid 26 Brent Council (2016) Temporary Accommodation Reform Plan Annexe 1, London: Brent Council 27 Brent Council (2016) Cabinet Report: Establishing a wholly owned Investment Company, London: Brent Council
251 properties either wholly purchased (86), in conveyancing (84) or approved by
the PRS panel and under negotiation (81) – 133 of these properties are located in
Brent. Further investment of £116 million was allocated to i4B in February 2018 to
secure 300 additional properties by 202128.
Overcrowding

In the 10 year period between 2001 and 2011 Census, overcrowding increased
substantially. In Brent, there was an increase of 8,745 overcrowded units, from 23,943
to 32,68829. The percentage of overcrowded households has also increased from
23.9% to 29.6% in the same year period.

                 Figure 24: Proportion of overcrowded households 2011 for Brent 2001-2011

                                              Source: UK Census of Population, LBB SHMA

Over the past 10-years, when considered by tenure, overcrowding has decreased by
1,203 households in the owner occupied sector, increased by 1,440 households in the
social rented sector, with the largest increase in the private rented sector, from 8,134
to 16,642, a growth of 8,508 households. (Fig.24). The percentage of overcrowded
households in the private rented sector has also had the biggest increase from 40.3%

28   i4B Holdings Ltd (2018) Business Plan 2018/19 and forward investment proposals 2018-2023, London: i4B Holdings Ltd

29   Brent Council (2013) Brent 2011 Census Profile, London: Brent Council
to 47.9%.The number of sharing households increased from 1,151 to 1,471 over the
10-year period 2001-11 an increase of 320 households (28%).
Rough Sleepers
From 2010 to 2018 rough sleeping in England increased by 169% and is most severe
in London. Welfare reforms to housing benefit and local housing allowance have been
said to contribute to the rise in the number of rough sleepers amongst an increase in
the number of non-UK nationals who are unable to access benefits30. The effects of
rough sleeping is dangerous and damaging to both physical and mental health,
moreover long periods of rough sleeping increases risks of being trapped in the streets
thus becoming a target and vulnerable victim to crime, developing alcohol and drug
dependency or even death. A study by Crisis in 2016 found 30% of rough sleepers
had been assaulted within the last 12 months with 56% receiving some form of verbal
abuse31.
In 2016/17 294 individuals were recorded rough sleeping in Brent. A 39% increase on
figures from 2015/16. This included a 50% increase in the number of ‘stock’ rough
sleepers (People who were also seen rough sleeping in 2015/16) and a 22% increase
in the number of ‘flow’ rough sleepers (people who had never been seen rough
sleeping prior to 2016/17) (Fig.25). The majority of rough sleepers in Brent in 2016/17
were seen sleeping rough only on one occasion and were mainly distributed in the
wards of Northwick Park and Stonebridge (Fig.26)32.
Figure 25: Number of people seen rough sleeping: Flow, stock, returner model, Brent 2013 –
2017
400
350
300
250
200 300
208
265
150
170
100
44
50 36
29 22 42
0 13 23 20
2013/14 2014/15 2015/16 2016/17
Returner Stock Flow Total
Source: CHAIN Annual Report – Brent Borough Profile: 2016/17
30 House of Commons Library (2018) Briefing Paper: Rough Sleeping (England), London: House of Commons Library
31 Sanders, B. & Albanese, F. (2016) ‘It’s no life at all’ Rough sleepers’ experiences of violence and abuse of the streets of England and
Wales, London: Crisis
32
Greater London Authority (2017) CHAIN Annual Report: Brent April 2016 – March 2017, London: Greater London AuthorityFigure 26: Bedded down street contacts by area
Source: CHAIN Annual Report – Brent Borough Profile 2016/17
In order to prevent homelessness and help rough sleepers, Brent Council is working
closely with St Mungo’s to deliver an outreach programme called Brent Outreach.
Nonetheless, many rough sleepers are not aware of the support provided by the
council.
Housing for Older People
Following the 2012 report Housing Our Ageing Population report (HAPPI2), it was
established that specialist housing units were required to accommodate the ageing
population. The specialist housing requirements were modelled using the Housing LIN
methodology (2012)43. The Housing LIN methodology forecasts future population and
then applies a benchmark need for particular housing types per thousand people aged
75+. This defines specialist provision as mainstream (including adapted and
wheelchair homes), specialised housing (including Extra Care and sheltered housing),
and Care Homes (including both Registered Nursing and Registered Care Homes).
Brent’s current Older Person Housing stock shows that there are around 1,500 units33.
33
Opinion Research Services (2016) London Borough of Brent Strategic Housing Market Assessment: Report of Findings, London: s.n.NAIL Project Brent is currently developing and rolling out its New Accommodation for Independent Living (NAIL) project, which aims to identify develop and acquire alternative forms of care to residential care for all vulnerable adult groups in Brent. The rationale behind NAIL is that it is preferable for elderly people to stay in their communities, rather than moving into residential care. Residential care is also very costly to the borough and the new forms of care explored in the NAIL project could be more cost-efficient, while providing for a higher quality of life, by encouraging independent living and more bespoke and personalised care packages.34 In 2017 it was estimated that NAIL would provide an average weekly saving of £332 per person, compared to accommodation provided in a care setting, and more recent operational figures indicate an average saving of £250 per person. 35 The project uses knowledge from both Housing and Adult Social Care, with the aim of developing sustainable care plans. Whilst Adult Social Care officers have a strong understanding of the requirements of people who need accommodation and support, Housing colleagues have a stronger understanding of the regulations, processes and potential issues around building or converting accommodation, and Planning colleagues bring their expertise and input around planning processes and ensuring development is sustainable. Long-term development plans are forecast to meet the NAIL Programme’s long-term targets, however an increased number of short term units are required to provide a more balanced and sustainable savings profile and meet Adult Social Care’s current accommodation requirements. To mitigate this, there was an acquisition of approximately 80 units (16 houses) and support on a number of leasing arrangements for the NAIL scheme this In March 201836. Partnership Working Brent council works with different partners such as housing associations, developers and registered providers. This is to make sure that the council gets an agreed level of nomination rights to housing association properties, monitor the cost and progress of development within the borough and to make sure in the case of housing association that they keep rents affordable by managing development costs. Registered Providers Registered Providers (RPs) are integral in Brent for providing both existing social housing stock, as well as delivering new affordable dwellings. Registered Providers (RPs) are the primary source of affordable housing, whether grant funded or secured through S106 agreements. Across London RPs are becoming integral to housing 34Brent Council (2016) Community and Wellbeing Scrutiny Committee: Update on New Accommodation for Independent Living (NAIL) project, London: Brent Council 35 Brent Council (2017) Cabinet Report: NAIL Programme Accommodation and Financial Mitigation Plan, London: Brent Council 36 Ibid
delivery with the GLA entering into strategic partnerships with a number of G15 RPs,
with partnerships already agreed with L&Q, Genesis, Clarion, Network, Notting Hill,
Optivo and Peabody – a number of which the Council has strong relationships with37.
Through these strategic partnerships the GLA offer favourable grant rates to
associations that are willing to build at least 60% affordable housing on new
developments – L&Q signed the first partnership agreement last year to build
12,000 affordable homes using £400m of GLA grant 38. Moreover, 55% of the
£3.5 billion allocated by the GLA to deliver 90,000 units by 2021 has been given to
RPs and Councils39. Brent is mirroring the GLAs development of relationships with
RPs with a view to capture of as much investment in housing as possible. The Council
has the opportunity to attract more inward investment by developing Joint Ventures
with RPs particularly if the RP is a strategic partner of the GLA40.

Private Developers – Volume homebuilders

The current London Plan has established the importance of partnerships with private
developers in order to meet current and future housing demand 41. A core task is
securing new housing of the highest quality and protecting and enhancing residential
neighbourhoods. The homebuilding sector is dominated by the volume developers,
with a quarter of all new homes in 2015 being built by the three largest companies
(Persimmon, Taylor-Wimpey and Barratt) 42 and the ten largest firms accounting for
60% of all new private homes43 . This contrasts to past trends where small builders
had a much larger proportion. In 1988 small builders were responsible for 4 in 10 new
build homes but have just 12% of the market share now. The increased demand for
delivery of large scale housing schemes has meant building opportunities are out of
reach of small building companies – from 2006 to 2016 the average permissioned
housing scheme has increased in size by 17%44. The larger housebuilders can only
(and only want to) build so much. As such the new London Plan (2017) has set targets
to increase the number of small sites (less than 0.25 hectares in size) identified for
development. The ten year target for Brent is 10,230 – annualised this is 1023 new
homes. The London Plan (2017) identifies these targets will also help revive the role
of small and medium-sized developers in delivering new homes in London45. To
complement this the Mayor launched his ‘Small Sites, Small Builders’ programme in
February 2018 in partnership with Transport for London (TFL). The programme aims
to make small plots of publicly-owned land more accessible to London’s small and
medium-sized builders with TFL bringing forward ten of its small sites for development,

37 Brent Council (2018) CMT Report: Housing Supply and Affordability, London: Brent Council
38 Mayor of London, London Assembly (2017) Mayor strikes landmark deal for 20,000 new homes, (Published 6th April 2017) Available at:
https://www.london.gov.uk/press-releases/mayoral/mayor-strikes-landmark-deal-for-20000-new-homes
39 Greater London Authority (2018) The Greater London Authority Consolidated Budget and Component Budgets for 2018-19, London:

Greater London Authority
40 Brent Council (2018) CMT Report: Housing Supply and Affordability, London: Brent Council
41 Greater London Authority (2017) The London Plan: The spatial development strategy for Greater London, Draft for public consultation,

London: Greater London Authority
42 Department for Communities and Local Government (2017) Fixing our broke housing market, London: Department for Communities and

Local Government
43 Ibid
44 Home Builders Federation (2017) Reversing the decline of small housebuilders, London: Home Builders Federation
45 Greater London Authority (2017) The London Plan: The spatial development strategy for Greater London, Draft for public consultation,

London: Greater London Authority
You can also read