City of Avondale City of Avondale 2020 2024 Draft Consolidated Plan - Avondale Library
←
→
Page content transcription
If your browser does not render page correctly, please read the page content below
City of Avondale   City of Avondale
                   2020‐2024 Draft
                   Consolidated Plan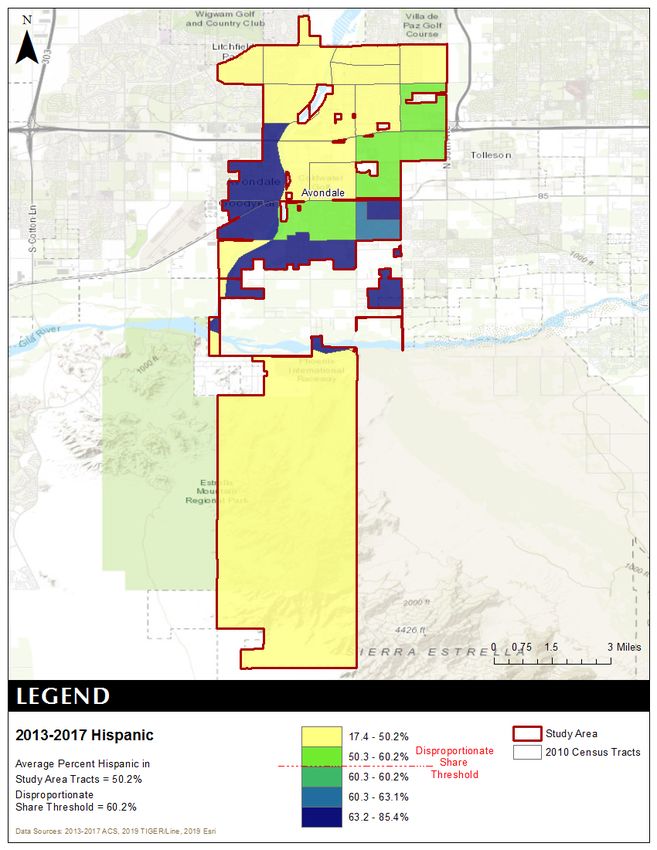
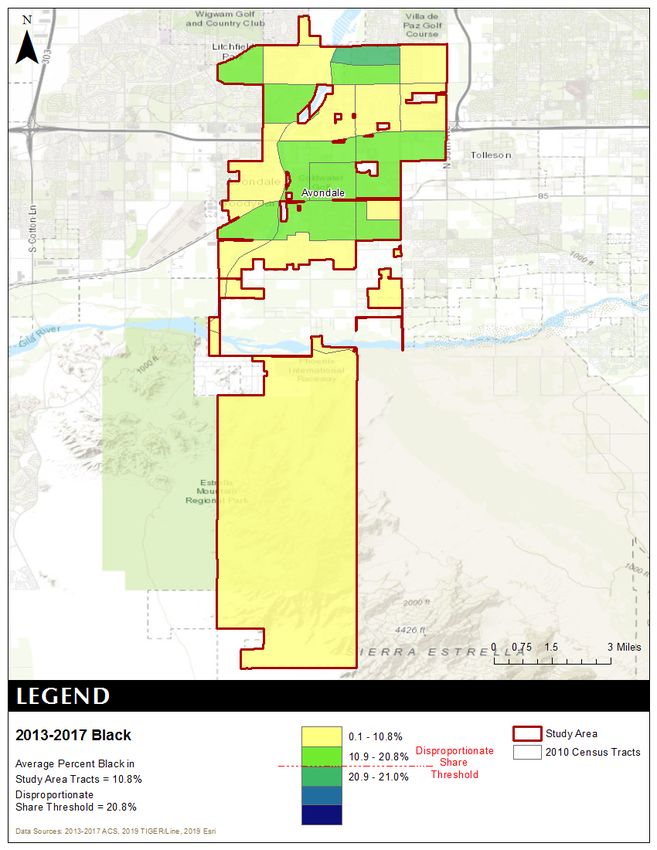
TABLE OF CONTENTS

EXECUTIVE SUMMARY                                                                                           1
   ES‐05 Executive Summary – 24 CFR 91.200(c), 91.220(b)                                                    1

THE PROCESS                                                                                                5
    PR‐05 Lead & Responsible Agencies ‐ 91.200(b)                                                          5
    PR‐10 Consultation ‐ 91.100, 91.110, 91.200(b), 91.300(b), 91.215(l) and 91.315(l)                     6
    PR‐15 Citizen Participation ‐ 91.105, 91.115, 91.200(c) and 91.300(c)                                  9

NEEDS ASSESSMENT                                                                                          13
   NA‐05 Overview                                                                                         13
   NA‐50 Non‐Housing Community Development Needs ‐ 91.415, 91.215 (f)                                     19

HOUSING MARKET ANALYSIS                                                              21
   MA‐05 Overview                                                                    21
   MA‐45 Non‐Housing Community Development Assets ‐ 91.410, 91.210(f)               24
   MA‐50 Needs and Market Analysis Discussion                                       33
   MA‐60 Broadband Needs of Housing occupied by Low‐ and Moderate‐Income Households ‐
   91.210(a)(4), 91.310(a)(2)                                                       37
   MA‐65 Hazard Mitigation ‐ 91.210(a)(5), 91.310(a)(3)                             38

STRATEGIC PLAN                                                                                           40
   SP‐05 Overview                                                                                        40
   SP‐10 Geographic Priorities ‐ 91.415, 91.215(a)(1)                                                    42
   SP‐25 Priority Needs ‐ 91.415, 91.215(a)(2)                                                           44
   SP‐35 Anticipated Resources ‐ 91.420(b), 91.215(a)(4), 91.220(c) (1,2)                                48
   SP‐40 Institutional Delivery Structure ‐ 91.415, 91.215(k)                                            50
   SP‐45 Goals ‐ 91.415, 91.215(a)(4)                                                                    52
   SP‐65 Lead‐based Paint Hazards ‐ 91.415, 91.215(i)                                                    56
   SP‐70 Anti‐Poverty Strategy ‐ 91.415, 91.215(j)                                                       57
   SP‐80 Monitoring ‐ 91.230                                                                             59

2020 ANNUAL ACTION PLAN                                                                                  61
   AP‐15 Expected Resources ‐ 91.420(b), 91.220(c) (1,2)                                                 61
   AP‐20 Annual Goals                                                                                    63
   AP‐35 Projects ‐ 91.420, 91.220(d)                                                                    66
   AP‐38 Project Summary                                                                                 67
   AP‐50 Geographic Distribution ‐ 91.420, 91.220(f)                                                     73
   AP‐85 Other Actions ‐ 91.420, 91.220(k)                                                               74
   Program Specific Requirements                                                                         76

APPENDICES                                                                                                77
   A. Low‐Mod Map                                                                                         77

City of Avondale                                   1                                     Updated Draft Report
Consolidated Plan                                                                               April 16, 2020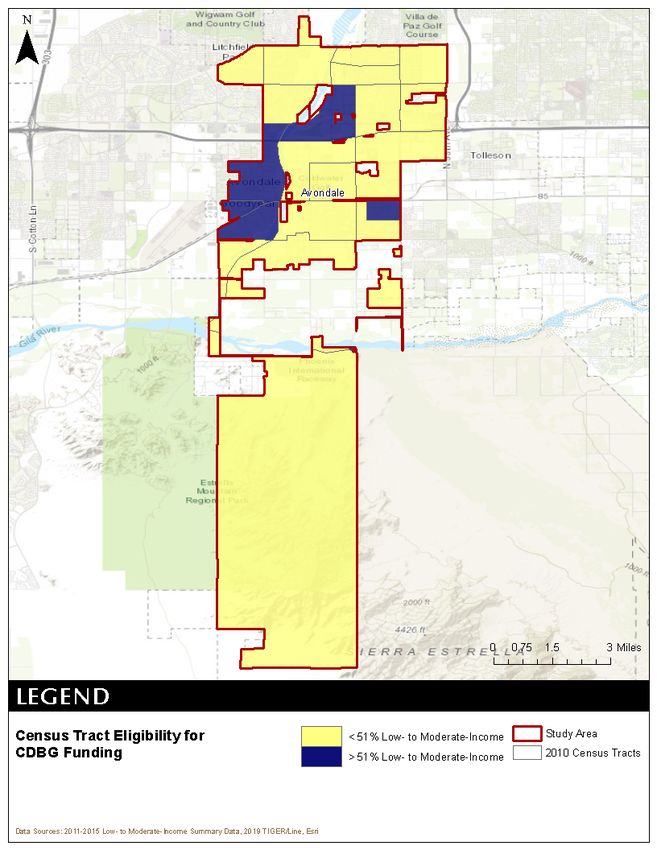
B. Public Input Data                        78

City of Avondale            2   Updated Draft Report
Consolidated Plan                      April 16, 2020
Executive Summary
ES‐05 EXECUTIVE SUMMARY – 24 CFR 91.200(C), 91.220(B)
Introduction

In 1994, the U.S. Department of Housing and Urban Development (HUD) issued new rules
consolidating the planning, application, reporting and citizen participation processes to the
Community Development Block Grants (CDBG). The new single‐planning process was intended to
more comprehensively fulfill three basic goals: to provide decent housing, to provide a suitable living
environment and to expand economic opportunities. It was termed the Consolidated Plan for Housing
and Community Development.

The Consolidated Plan is designed to be a collaborative process whereby a community establishes a
unified vision for housing and community development actions. It offers entitlement communities the
opportunity to shape these housing and community development programs into effective,
coordinated neighborhood and community development strategies. It also allows for strategic
planning and citizen participation to occur in a comprehensive context, thereby reducing duplication
of effort.

The City of Avondale follows HUD’s guidelines for citizen and community involvement and oversees
citizen participation requirements that accompany the Consolidated Plan.

The City of Avondale has prepared this Consolidated Plan to meet the guidelines as set forth by HUD
and is broken into five sections: The Process, Needs Assessment, Market Analysis, Strategic Plan, and
Annual Action Plan.

The City of Avondale also receives HOME funds through the Maricopa HOME Consortium. The goals
and objectives of this program are included in the Maricopa HOME Consortium 2020‐2024
Consolidated Plan.

Summary of the objectives and outcomes identified in the Plan Needs Assessment Overview

The goals of the CDBG program are to provide decent housing, a suitable living environment, and
economic opportunities for low‐moderate income residents. The City of Avondale strives to
accomplish these goals by maximizing and effectively utilizing all available funding resources to
conduct housing and community development activities. These goals are further explained as follows:

•       Providing decent housing means assisting those at risk of homelessness, helping homeless
persons obtain appropriate housing; preserving the affordable housing stock; increasing availability of
permanent housing that is affordable to low and moderate‐income persons without discrimination;
and increasing the supply of supportive housing.

•      Providing a suitable living environment entails improving the safety and livability of
neighborhoods; increasing access to quality facilities and services; and reducing the isolation of
income groups within an area through integration of low‐income housing opportunities.

•     Expanding economic opportunities involves creating jobs that are accessible to low‐ and
moderate‐income persons; making down payment and closing cost assistance available for low‐ and

City of Avondale                                   1                                  Updated Draft Report
Consolidated Plan                                                                            April 16, 2020
moderate‐income persons; promoting long term economic and social viability; and empowering low‐
income persons to achieve self‐sufficiency.
Evaluation of past performance
The City of Avondale’s evaluation of its past performance has been completed in a thorough
Consolidated Annual Performance and Evaluation Report (CAPER). These documents state the
objectives and outcomes identified in each year’s Annual Action Plan and include an evaluation of past
performance through measurable goals and objectives compared to actual performance. These
documents can be found on the City’s website at:
https://www.avondaleaz.gov/government/departments/neighborhood‐family‐services/housing‐and‐
community‐development/community‐development‐block‐grant‐cdbg/plans‐and‐reports
The City has accomplished a number of activities in the 2015‐2019 Consolidated Planning period. As of
the 2018 CAPER, these include:
Homeowner housing rehabilitation for 58 housing units
Assisted five businesses with loan guarantee and technical assistance in the Western
Avenue Historic Corridor
Completed one facade improvement project
Fair Housing activities benefiting 250 persons
Reduction of lead based‐paint hazards through homeowner housing rehabilitation for
three households
Replaced outdated infrastructure in LMI areas benefiting 950 households
Supported public service programs benefiting 78 households
Summary of citizen participation process and consultation process
A variety of public outreach and citizen participation methods were used to develop this Consolidated
Plan and Annual Action Plan. The 2019 Housing and Community Development survey was used to help
establish priorities for the City of Avondale by gathering feedback on the level of need for housing and
community development categories. A public meeting and a public hearing was held prior to the
release of the draft plan to garner feedback on preliminary findings. The Plan was released for public
review and public hearings were held to offer residents and stakeholders the opportunity to comment
on the Consolidated Plan.
Summary of public comments
Comments made during the public review meetings are summarized below:
Need for help for people to retain housing/need for affordable housing
Job development and training programs
Need for more youth program/awareness of current programs for teens
Support for local businesses/ more jobs in the area
Need for outreach and education of available services
City of Avondale 2 Updated Draft Report
Consolidated Plan April 16, 2020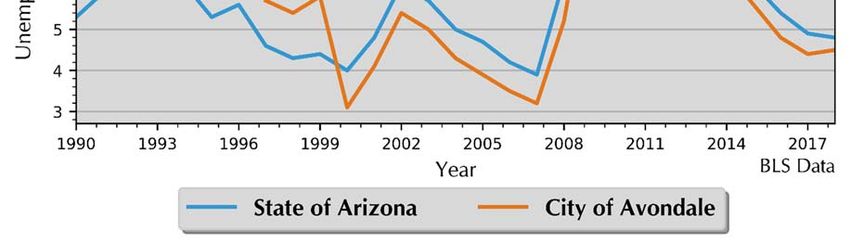
a. Need for more affordable senior housing
b. Possible jobs that offer tuition reimbursement
c. Lack of community involvement
Summary of comments or views not accepted and the reasons for not accepting them
Not applicable.
Summary
The Needs Assessment and Market Analysis, which has been guided by the Housing and Community
Development Survey and public input, identified six (6) priority needs. These are described below:
Affordable Housing: The City has identified a high priority need to preserve and
maintain affordable housing choices in the City. As 32.4 percent of Avondale
households face cost burdens, the need for affordable housing options in the City
remains high. In addition, maintaining the current housing stock, including addressing
lead‐based paint hazards is a high priority for the City.
Public Infrastructure and Facilities: The City recognizes the need for public
infrastructure and public facilities throughout the City in order to provide for and
maintain a safe and decent environment for its citizens.
Special Needs Populations: There are a number of special needs populations in the City
that need continued services and support. These include, but aren’t limited to the
elderly, veterans, youth, and persons with disabilities. This also includes low to
moderate income households with public service needs.
Economic Opportunities: The City has identified Economic Opportunity activities as a
high priority need within the City.
Fair Housing: The City continues to place a high priority on affirmatively furthering fair
housing in the City.
Homelessness: Homelessness continues to be prevalent in the community and region‐
wide. The City recognizes the need to address at‐risk households and homeless
persons in the community.
These Priority Needs are addressed with the following Goals:
Preserve and Expand Affordable Housing Inventory
The City will preserve and expand affordable housing choices in the City through its
Owner/Occupied Housing Rehabilitation Program and first‐time home buyer down payment
assistance. The City will provide these programs with both CDBG and HOME funds.
City of Avondale 3 Updated Draft Report
Consolidated Plan April 16, 2020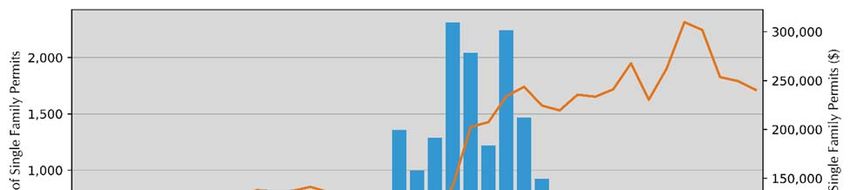
Fund Necessary Public Infrastructure and Facilities

          The City will fund vital public infrastructure and/or public facility improvements to benefit low
          to moderate income households in the City.

Support Vital Community Services

          The City will fund projects that provide public services to special needs and low to moderate
          income households in the community.

Encourage Business Development and Growth

          The City will undertake a broad approach to assisting businesses, including providing technical
          assistance to local businesses, sponsoring local events that support businesses in the target
          areas, completing training events and providing financing for commercial rehabilitation (i.e.
          facade improvements), as well as streetscape and other beautification projects that enhance
          the aesthetic and increase economic activity.

Promote Fair Housing in Avondale

          The City will undertake activities to affirmatively further fair housing in Avondale.

Support Efforts to Prevent Homelessness

          The City will fund prevention efforts for households in danger of experiencing homelessness,
          as well as provide assistance in obtaining housing for homeless persons.

Reduce Residential Lead‐Based Hazards

          In combination with the City’s goal to preserve housing stock, the City will adhere to HUD Lead
          Safe Housing Rule 24 CFR Part 35 in the conduct of rehabilitation activities, and provide
          information to housing recipients as well as the general public about the hazards of lead based
          paint.

City of Avondale                                      4                                    Updated Draft Report
Consolidated Plan                                                                                 April 16, 2020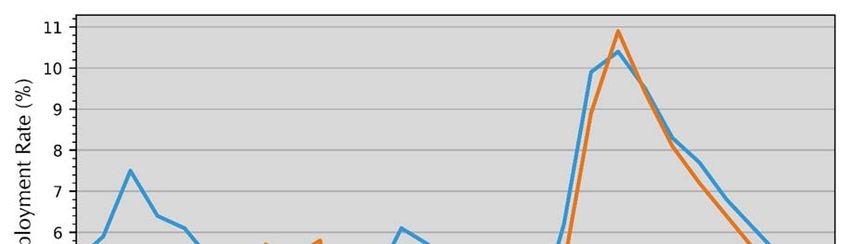
The Process
PR‐05 LEAD & RESPONSIBLE AGENCIES ‐ 91.200(B)
Describe agency/entity responsible for preparing the Consolidated Plan and those
responsible for administration of each grant program and funding source

The following are the agencies/entities responsible for preparing the Consolidated Plan and those
responsible for administration of each grant program and funding source.

             Agency Role               Name                              Department/Agency
                                                                    Neighborhood & Family Services
        CDBG Administrator           Avondale
                                                                             Department
                                    Table 1– Responsible Agencies

Narrative

The Housing and Community Development Division within the City's Neighborhood and Family
Services Department is responsible for all facets of compliance with the City's CDBG program.

Consolidated Plan Public Contact Information

Marsha D. Chavez, MM
Housing & Community Development Manager
Neighborhood & Family Services, City of Avondale
Avondale Community Center
1007 S. 3rd Street
Avondale, AZ 85323
623.333.2726
mchavez@avondaleaz.gov

City of Avondale                                   5                                    Updated Draft Report
Consolidated Plan                                                                              April 16, 2020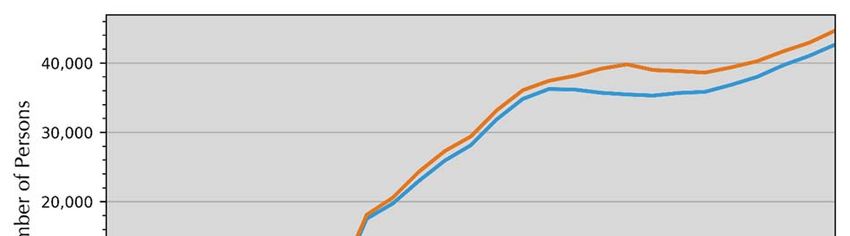
The Process                                                                                  City of Avondale

PR‐10 CONSULTATION ‐ 91.100, 91.110, 91.200(B), 91.300(B), 91.215(L) AND 91.315(L)
Introduction

The City’s Neighborhood & Family Services Department collaborates with approximately 60 service
providers to identify gaps in services provided to Avondale residents. The City places a high emphasis
on identifying these gaps in order to research and partner with agencies to provide resources and
services in these unmet areas. The Family Services Division staff assists with achieving goals outlined
in the City's Consolidated and Annual Action Plans by partnering with outside agencies to offer free
seminars and workshops on various topics as well as producing a Community Resource Guide that
shares information with citizens seeking assistance with various needs. Furthermore, comments and
input from service providers, regarding goals and projects identified in the City's Consolidated and
Annual Action Plans, are encouraged throughout the year.

Provide a concise summary of the jurisdiction’s activities to enhance coordination between
public and assisted housing providers and private and governmental health, mental health
and service agencies (91.215(I)).
The City of Avondale maintains partnerships with a variety of external agencies and groups to
implement Consolidated Plan goals. Most notably, the Care1st Avondale Resource Center (the Center)
is a centralized hub for a variety of human services agencies to provide assistance to low and moderate
income residents throughout southwest Maricopa County. The Center provides a range of services
through several providers and funders, including: Helping Families in Need (enrollment/renewal
assistance for AHCCCS healthcare, Healthcare Marketplace/Affordable Care Act, KidsCare, nutrition
assistance‐food stamps, and cash assistance); Community Action Program (rental and utility
assistance); Adelante Healthcare (Women, Infant and Children–WIC, a USDA nutrition program);
Sojourner Center (domestic violence awareness, safety planning and shelter referrals); Goodwill of
Central Arizona (job referrals, employment and basic computer skills training); Lutheran Social
Services/Interfaith Homeless Emergency Lodging Program‐IHELP (shelter services for adults); Phoenix
Rescue Mission (homeless shelter programs for adults and families); Central Arizona Shelter Services‐
CASS (homeless shelter intake and resources); New Life Center (domestic violence support groups);
Area Agency on Aging (support for the senior community through resources and referrals); Father
Matters (family law resources and support); Maricopa County Juvenile Probation Department (youth
life skills and parenting classes); Trellis (first time homebuyer education); International Rescue
Committee (citizenship test prep classes and immigration document preparation); Avondale Family
Education and Resource Program/First Things First (developmental, hearing and vision screenings for
children birth to five years of age, car seat safety education/distribution, parenting workshops/classes,
early literacy programs, resource referral and information); Association for Supportive Child Care‐AZ
Kith and Kin Project (training for family friend and neighbor caregivers of young children); Maricopa
County Department of Public Health/First Teeth First (free dental screenings, fluoride varnishing and
oral health education for children, birth to five, and expecting women); Child & Family
Resources/Building Bright Futures (in‐home intervention services for children, 0 to 5 years); Southwest
Human Development (Raising A Reader early literacy development and Common Sense Parenting
workshops for families with children, 0 to 5 years); Avondale Fire Department (CPR & First Aid
certification classes); Arizona Learning Institute/Valley of the Sun United Way (Readiness Basket ‐ 14‐
week early childhood parenting classes); Arizona Priority Education and Counseling (court‐mandated
parenting classes); Southwest Families Advocacy Center (parent & child sexual abuse prevention
workshops); Arizona Science Center (Science, Technology , Engineering and Math activities for young

City of Avondale                                   6                                    Updated Draft Report
Consolidated Plan                                                                               April 16, 2020
The Process                                                                               City of Avondale

children); Maricopa County Human Services Department (Weatherization Program intake and
coordination); St. Mary’s Food Bank Alliance (Kids Café –free Summer lunch program for kids up to 18
years old); A New Leaf – Volunteer Income Tax Assistance Program/VITA (free income tax preparation
services); Catholic Charities/West Side Head Start (recruitment and enrollment services); Military &
Veteran Success Center‐West Valley (free services and resources for transitioning military members,
veterans and their dependents); Rio Salado Community College (English as a Second Language‐ESL
and GED classes)

Describe coordination with the Continuum of Care and efforts to address the needs of
homeless persons (particularly chronically homeless individuals and families, families with
children, veterans, and unaccompanied youth) and persons at risk of homelessness
The City of Avondale does not participate in the Continuum of Care initiative, but participates in the
Annual Homeless Count through the Maricopa Association of Governments, as well as operates a
number of programs at the Care1st Avondale Resource Center that prevent homelessness or assist
those who are currently homeless. The City also partners with the First Southern Baptist Church and
Lutheran Social Services in the implementation of an IHelp program. Started in January, 2017 the
program has expanded to cover nearly all days of the month, with seven churches providing overnight
shelter. Currently, the program can accommodate fifteen people (including families), and is working
to expand capacity. Lutheran Social Services provides case management services at the Resource
Center, where participants can also access other services provided by the City and its other partners.
The City is looking to increase the level of engagement with staff at this time.

Describe consultation with the Continuum(s) of Care that serves the jurisdiction's area in
determining how to allocate ESG funds, develop performance standards and evaluate
outcomes, and develop funding, policies and procedures for the administration of HMIS
The City of Avondale does not receive ESG funds.

Describe Agencies, groups, organizations and others who participated in the process and
describe the jurisdictions consultations with housing, social service agencies and other
entities

                     Table 2 – Agencies, groups, organizations who participated

Identify any Agency Types not consulted and provide rationale for not consulting

The City made every attempt to be inclusive in its outreach efforts.

City of Avondale                                   7                                 Updated Draft Report
Consolidated Plan                                                                            April 16, 2020
The Process City of Avondale
Other local/regional/state/federal planning efforts considered when preparing the Plan
Name of Plan Lead Organization How do the goals of your Strategic Plan overlap with
the goals of each plan?
Continuum of Maricopa Association The City of Avondale’s goals are aligned with MAG’s
Care of Governments (MAG) overarching objectives.
Maricopa County As a member of the Maricopa County HOME
Maricopa HOME
Human Services Consortium, the City's allocated HOME Program funding
Consortium
Department is used to achieve goals set by the larger Consortium.
Table 2– Other local / regional / federal planning efforts
Describe cooperation and coordination with other public entities, including the State and
any adjacent units of general local government, in the implementation of the Consolidated
Plan (91.215(l))
The City works closely within the region as part of the Maricopa County Consortium, and the Maricopa
County Continuum of Care (CoC) through the Maricopa Association of Governments (MAG). These
efforts allow for increased cooperation and consultation with neighboring jurisdictions, as well as
collaborative regional efforts.
City of Avondale 8 Updated Draft Report
Consolidated Plan April 16, 2020The Process
City of Avondale
PR‐15 CITIZEN PARTICIPATION ‐ 91.105, 91.115, 91.200(C) AND 91.300(C)
Summary of citizen participation process/Efforts made to broaden citizen participation
Summarize citizen participation process and how it impacted goal‐setting
During the development of the City’s 2020‐2024 Consolidated Plan, the City undertook a variety of
public outreach methods to gather public input and comment. These comments were a part of the
Needs Assessment and Market Analysis, and ultimately helped shape the outcome of the Plan’s Five
Year Goals and Objectives. These outreach efforts included the 2019 Housing and Community
Development Survey, an input meeting, and two public hearings. The survey was available in both
English and Spanish.
Citizen Participation Outreach
City of Avondale 9 Updated Draft Report
Consolidated Plan
April 16, 2020The Process
City of Avondale
Summary
of
Summary of comment URL (If
Sort Mode of Target of Summary of
response/atten s not applicab
Order Outreach Outreach Comments received
dance accepted le)
and
reasons
1 Internet Minorities A total of 10 The results are Not
outreach Non‐English surveys were available as part of the applicable.
Speaking ‐ Specify received Needs Assessment
other language: throughout the and Market Analysis.
Spanish City. A complete set of
Persons with responses is available
disabilities in the Appendix.
Non‐
targeted/broad
community
2 Public Non‐ A public input Comments from this Not
Meeting targeted/broad meeting was held meeting included the applicable.
community in November at need for outreach and
City Hall education, senior
housing, and job
training.
3 Public Non‐ A public hearing Comments from this Not
Hearing targeted/broad was held in meeting included the applicable
community February in need for housing
Stakeholders conjunction with assistance for
the City’s domestic violence
Neighborhood & victims, homeless
Family Services housing assistance,
Commission and questions about
Meeting funding allocations for
each goal.
4 Public Non‐ A public meeting
Meeting targeted/broad was held during
community the public review
Stakeholders period in April
5 Public Non‐ A virtual public
Hearing targeted/broad hearing was held
community in May
Stakeholders
Table 3– Citizen Participation Outreach
City of Avondale 10 Updated Draft Report
Consolidated Plan
April 16, 2020The Process
City of Avondale
Criteria and Process for Amendments to Consolidated Plan and
Annual Plan
Should Avondale cause one of the following items to occur, an
amendment to their Consolidated Plan or Annual Action Plan would be
required:
a. To make a substantial change in the allocation priorities or methods of distribution
delineated in the plans. “Substantial” in this context is defined as:
* Changes in any method of distribution for HOME and CDBG resources that will
alter the manner in which funds are allocated to individual projects, entities or activities
identified in the Annual Action Plan by at least 20% of any annual Entitlement or
Consortium allocation, subject to other program requirements in the CRF as applicable;
and/or;
* Changes made to funding priorities in the Consolidated Plan over time when not
undertaken through annual submission requirements stipulated by HUD; and/or;
* Project deletions or changes made in allocation priorities or methods of
distribution that have the effect of changing the funding level of individual CDBG
projects within an eligible activity identified in its Annual Action Plan by more than 20%
of an entitlement jurisdiction’s annual funding level, subject to other program
requirements in the CFR as applicable. Any new eligible activity funded with CDBG and
not already identified in an Annual Action Plan, as well as significant changes in the use
of CDBG funds from one eligible activity to another, in an amount greater than 20% of
the annual CDBG allocation.
b. To carry out an eligible activity, using funds from any program covered by the
Consolidated Plans (including program income), not previously described in the Annual
Action Plans.
c. To substantially change the purpose, scope, location, or beneficiaries of an activity.
Changes that are made to projects to be funded in the Consolidated Plan over time
when not undertaken through Annual Action Plan submission requirements stipulated
by HUD.
City of Avondale 11 Updated Draft Report
Consolidated Plan
April 16, 2020The Process
City of Avondale
Should “substantial” amendments be made to any aspect of the Consolidated Plan treated
herein after its formal adoption, Avondale will undertake the following: [refer to
91.105(b)(2)(iv) and (b)(6)].
d. In the instance of Avondale, inform affected units of local government.
e. Provide reasonable public notice of the proposed amendment(s) in applicable
newspaper/s of general circulation to enable review and comment by the public for at
least 30 days unless otherwise covered by a waiver due to a pandemic or other similar
situation, as authorized by HUD.
f. Conduct a public hearing on the subject of the proposed amendment during the
comment period which shall include the following items:
i. The amount of CDBG and HOME resources anticipated to be made
available within affected member jurisdictions on a fiscal year basis, and
the eligible range of activities that may be undertaken concerning such
federal programs.
ii. The amount of CDBG and HOME resources anticipated to benefit
income qualified persons residing within affected member jurisdictions
on a fiscal year basis.
iii. Plans by affected Avondale to minimize the displacement of persons
from the intended uses of CDBG and HOME resources anticipated to be
invested during any given fiscal year.
iv. Perspectives on priorities and housing and community development
needs in Avondale.
v. Other aspects of the Consolidated Plan as applicable.
g. Submit such amendment(s) to City Council for approval.
h. Upon the termination of the comment period, periodically notify HUD of any
amendments executed, citizen comments received and the response(s) by affected
Consortium members to such comment(s).
City of Avondale 12 Updated Draft Report
Consolidated Plan
April 16, 2020Needs Assessment
NA‐05 OVERVIEW
Needs Assessment Overview
Population Estimates
Table NA‐05.1 shows the population for the City of Avondale. As can be seen, the population in City of
Avondale increased from 76,238 persons in 2010 to 85,835 person in 2018, or by 12.6 percent. This
mirrors the growth that Maricopa County is experiencing, as one of the fastest growing counties in
the United States.
Table NA-05.1
Population Estimates
City of Avondale
Census Population Estimates
Year Population Percent Yearly Change
2000 36,075 .
2001 41,224 14.3%
2002 45,311 9.9%
2003 49,315 8.8%
2004 53,594 8.7%
2005 58,410 9.0%
2006 62,996 7.9%
2007 66,991 6.3%
2008 70,795 5.7%
2009 74,055 4.6%
2010 76,238 2.9%
2011 77,280 1.4%
2012 78,736 1.9%
2013 79,778 1.3%
2014 80,772 1.2%
2015 81,976 1.5%
2016 83,347 1.7%
2017 84,807 1.8%
2018 85,835 1.2%
Population by race and ethnicity through 2017 in shown in Table NA‐05.2. The white population
represented 71.4 percent of the population in 2017, compared with black populations accounting for
10.8 percent of the population in 2017. Hispanic households represented 50.2 percent of the
population in 2017.
City of Avondale 13 Updated Draft Report
Consolidated Plan April 16, 2020Needs Assessment City of Avondale
Table NA-05.2
Population by Race and Ethnicity
City of Avondale
2010 Census & 2017 Five-Year ACS
2010 Census 2017 Five-Year ACS
Race
Population % of Total Population % of Total
White 44,272 58.1% 58,235 71.4%
Black 7,102 9.3% 8,805 10.8%
American Indian 1,264 1.7% 1,344 1.6%
Asian 2,684 3.5% 2,877 3.5%
Native Hawaiian/ Pacific Islander 274 0.4% 152 0.2%
Other 17,238 22.6% 7,239 8.9%
Two or More Races 3,404 4.5% 2,938 3.6%
Total 76,238 100.0% 81,590 100.0%
Non-Hispanic 37,898 49.7% 40,661 49.8%
Hispanic 38,340 50.3% 40,929 50.2%
Disability
Disability by age, as estimated by the 2017 ACS, is shown in Table NA‐05.3. The disability rate for
females was 9.7 percent, compared to 10.2 percent for males. The disability rate grew precipitously
higher with age, with 53.6 percent of those over 75 experiencing a disability.
Table NA-05.3
Disability by Age
City of Avondale
2017 Five-Year ACS Data
Male Female Total
Age Disabled Disability Disabled Disability Disabled Disability
Population Rate Population Rate Population Rate
Under 5 60 1.9% 35 1.1% 95 1.5%
5 to 17 477 5.6% 236 2.6% 713 4.1%
18 to 34 814 7.4% 455 4.3% 1,269 5.9%
35 to 64 1,478 10.3% 2,052 13.3% 3,530 11.8%
65 to 74 755 37.6% 638 32.3% 1,393 35.0%
75 or Older 464 61.4% 601 48.8% 1,065 53.6%
Total 4,048 10.2% 4,017 9.7% 8,065 9.9%
The number of disabilities by type, as estimated by the 2017 ACS, is shown in Table NA‐05.4. Some 5.2
percent have an ambulatory disability, 4.4 percent have an independent living disability, and 2.3
percent have a self‐care disability.
Table NA-05.4
Total Disabilities Tallied: Aged 5 and Older
City of Avondale
2017 Five-Year ACS
Population with Percent with
Disability Type
Disability Disability
Hearing disability 2,409 3.0%
Vision disability 1,848 2.3%
Cognitive disability 3,226 4.3%
Ambulatory disability 3,861 5.2%
Self-Care disability 1,725 2.3%
Independent living disability 2,499 4.4%
City of Avondale 14 Updated Draft Report
Consolidated Plan April 16, 2020Needs Assessment City of Avondale
Household Income and Poverty
Households by income for the 2010 and 2017 5‐year ACS are shown in Table NA‐05.5. Households
earning more than 100,000 dollars per year represented 19.8 percent of households in 2017, compared
to 21.8 percent in 2010. Meanwhile, households earning less than 15,000 dollars accounted for 10.6
percent of households in 2017, compared to 9.9 percent in 2000.
Table NA-05.5
Households by Income
City of Avondale
2010 & 2017 Five-Year ACS Data
2010 Five-Year ACS 2017 Five-Year ACS
Income
Households % of Total Households % of Total
Less than $15,000 2,129 9.9% 2,653 10.6%
$15,000 to $19,999 650 3.0% 839 3.3%
$20,000 to $24,999 793 3.7% 1,018 4.1%
$25,000 to $34,999 1,924 9.0% 2,796 11.1%
$35,000 to $49,999 3,204 15.0% 3,471 13.8%
$50,000 to $74,999 4,699 22.0% 5,893 23.5%
$75,000 to $99,999 3,343 15.6% 3,441 13.7%
$100,000 or More 4,660 21.8% 4,966 19.8%
Total 21,402 100.0% 25,077 100.0%
Meanwhile, the City is also seeing a growth in poverty. The rate of poverty for City of Avondale is
shown in Table NA‐05.6. In 2017, there were an estimated 13,264 persons living in poverty. This
represented a 16.3 percent poverty rate, compared to 13.8 percent poverty in 2000. In 2017, some 10.9
percent of those in poverty were under age 6, and 5.7 percent were 65 or older. This is in comparison
to the poverty rates of neighboring cities of 23.3 percent in Tolleson, 9.7 percent in Litchfield Park, and
8.7 percent in Goodyear.
Table NA-05.6
Poverty by Age
City of Avondale
2000 Census SF3 & 2017 Five-Year ACS Data
2000 Census 2017 Five-Year ACS
Age
Persons in Poverty % of Total Persons in Poverty % of Total
Under 6 752 15.3% 1,451 10.9%
6 to 17 1,394 28.4% 3,724 28.1%
18 to 64 2,457 50.1% 7,336 55.3%
65 or Older 302 6.2% 753 5.7%
Total 4,905 100.0% 13,264 100.0%
Poverty Rate 13.8% . 16.3% .
Housing Problems
Households are considered to have housing problems if they have one (1) of more of the four (4)
problems.
1. Housing unit lacks complete kitchen facilities;
2. Housing unit lacks complete plumbing facilities;
3. Household is overcrowded; and/or
City of Avondale 15 Updated Draft Report
Consolidated Plan April 16, 2020Needs Assessment City of Avondale
4. Household is cost burdened.
Overcrowding is defined as having from 1.1 to 1.5 people per room per residence, with severe
overcrowding defined as having more than 1.5 people per room. Households with overcrowding are
shown in Table NA‐05.7. In 2017, an estimated 4.5 percent of households were overcrowded, and an
additional 1.6 percent were severely overcrowded.
Table NA-05.7
Overcrowding and Severe Overcrowding
City of Avondale
2010 & 2017 Five-Year ACS Data
No Overcrowding Overcrowding Severe Overcrowding
Data Source Total
Households % of Total Households % of Total Households % of Total
Owner
2010 Five-Year ACS 13,167 95.3% 493 3.6% 162 1.2% 13,822
2017 Five-Year ACS 13,138 96.3% 416 3.0% 89 0.7% 13,643
Renter
2010 Five-Year ACS 7,153 94.4% 316 4.2% 111 1.5% 7,580
2017 Five-Year ACS 10,404 91.0% 708 6.2% 322 2.8% 11,434
Total
2010 Five-Year ACS 20,320 94.9% 809 3.8% 273 1.3% 21,402
2017 Five-Year ACS 23,542 93.9% 1,124 4.5% 411 1.6% 25,077
Incomplete plumbing and kitchen facilities are another indicator of potential housing problems.
According to the Census Bureau, a housing unit is classified as lacking complete plumbing facilities
when any of the following are not present: piped hot and cold water, a flush toilet, and a bathtub or
shower. Likewise, a unit is categorized as deficient when any of the following are missing from the
kitchen: a sink with piped hot and cold water, a range or cook top and oven, and a refrigerator.
There were a total of 61 households with incomplete plumbing facilities in 2017, representing 0.2
percent of households in City of Avondale. This is compared to 1.0 percent of households lacking
complete plumbing facilities in 2010.
Table NA-05.8
Households with Incomplete Plumbing Facilities
City of Avondale
2010 and 2017 Five-Year ACS Data
Households 2010 Five-Year ACS 2017 Five-Year ACS
With Complete Plumbing Facilities 21,185 25,016
Lacking Complete Plumbing Facilities 217 61
Total Households 21,402 25,077
Percent Lacking 1.0% 0.2%
There were 109 households lacking complete kitchen facilities in 2017, compared to 237 households in
2010. This was a change from 1.1 percent of households in 2010 to 0.4 percent in 2017.
City of Avondale 16 Updated Draft Report
Consolidated Plan April 16, 2020Needs Assessment City of Avondale
Table NA-05.9
Households with Incomplete Kitchen Facilities
City of Avondale
2010 and 2017 Five-Year ACS Data
2017 Five-Year
Households 2010 Five-Year ACS
ACS
With Complete Kitchen Facilities 21,165 24,968
Lacking Complete Kitchen Facilities 237 109
Total Households 21,402 25,077
Percent Lacking 1.1% 0.4%
Cost burden is defined as gross housing costs that range from 30 to 50 percent of gross household
income; severe cost burden is defined as gross housing costs that exceed 50 percent of gross
household income. For homeowners, gross housing costs include property taxes, insurance, energy
payments, water and sewer service, and refuse collection. If the homeowner has a mortgage, the
determination also includes principal and interest payments on the mortgage loan. For renters, this
figure represents monthly rent and selected electricity and natural gas energy charges.
In City of Avondale 19.5 percent of households had a cost burden and 14.7 percent had a severe cost
burden. Some 26.6 percent of renters were cost burdened, and 20.0 percent were severely cost
burdened. Owner‐occupied households without a mortgage had a cost burden rate of 3.4 percent and
a severe cost burden rate of 6.4 percent. Owner occupied households with a mortgage had a cost
burden rate of 16.3 percent, and severe cost burden at 11.3 percent.
Table NA-05.10
Cost Burden and Severe Cost Burden by Tenure
City of Avondale
2010 & 2017 Five-Year ACS Data
Less Than 30% 31%-50% Above 50% Not Computed
Data Source Total
Households % of Total Households % of Total Households % of Total Households % of Total
Owner With a Mortgage
2010 Five-Year ACS 6,764 58.2% 3,166 27.3% 1,637 14.1% 47 0.4% 11,614
2017 Five-Year ACS 7,718 71.4% 1,758 16.3% 1,219 11.3% 109 1.0% 10,804
Owner Without a Mortgage
2010 Five-Year ACS 1,808 81.9% 166 7.5% 232 10.5% 2 0.1% 2,208
2017 Five-Year ACS 2,501 88.1% 96 3.4% 182 6.4% 60 2.1% 2,839
Renter
2010 Five-Year ACS 3,717 49.0% 1,928 25.4% 1,609 21.2% 326 4.3% 7,580
2017 Five-Year ACS 5,491 48.0% 3,042 26.6% 2,283 20.0% 618 5.4% 11,434
Total
2010 Five-Year ACS 12,289 57.4% 5,260 24.6% 3,478 16.3% 375 1.8% 21,402
2017 Five-Year ACS 15,710 62.6% 4,896 19.5% 3,684 14.7% 787 3.1% 25,077
Homelessness
The City of Avondale is part of the Maricopa Regional Continuum of Care (CoC), which operates in
Maricopa County. This CoC is a collaborative of service providers. The Point in Time (PIT) count for
the Maricopa County CoC has increased from 5,702 in 2016 to 6,614 in 2019. However, there are
limitations to the PIT, especially when capturing unsheltered populations. Service providers have
City of Avondale 17 Updated Draft Report
Consolidated Plan April 16, 2020Needs Assessment City of Avondale
indicated that they are noticing a growth in the homeless population countywide. In Avondale, the
unsheltered homeless count did not increase during this time, from 37 in 2016 to 35 in 2019.
Table NA-05.11
Homeless Persons
Maricopa County HOME Consortium
Point-in-Time Counts
2016 2017 2018 2019
Unsheltered City of Avondale 37 27 13 35
Unsheltered Maricopa County 1,646 2,059 2,618 3,188
Total Homeless Count 5,702 5,605 6,298 6,614
City of Avondale 18 Updated Draft Report
Consolidated Plan April 16, 2020Needs Assessment City of Avondale
NA‐50 NON‐HOUSING COMMUNITY DEVELOPMENT NEEDS ‐ 91.415, 91.215 (F)
Describe the jurisdiction’s need for Public Facilities:
The 2019 Housing and Community Development Needs survey found that the highest rated needs
were for senior centers, childcare facilities, and facilities for abused and neglected children.
Table NA-50.1
Providing a Suitable Living Environment
City of Avondale
Housing and Community Development Survey
Question No Need Low Need Medium Need High Need Don’t Know Missing Total
Pease rate the need for the following COMMUNITY and PUBLIC FACILITIES activities in your community:
Youth Centers 0 1 2 1 2 4 10
Community Centers 0 1 2 1 2 4 10
Childcare facilities 0 0 1 2 3 4 10
Parks and recreational centers 0 1 3 1 0 5 10
Senior center 0 0 2 2 2 4 10
Healthcare facilities 1 1 1 1 1 5 10
Residential treatment centers 0 1 1 1 2 5 10
Public buildings with improved accessibility 1 2 0 1 2 4 10
Homeless shelters 1 0 1 1 3 4 10
Fire Stations/equipment 1 1 1 1 2 4 10
Facilities for persons living with AIDS 1 1 0 1 3 4 10
Facilities for abused/neglected children 0 0 2 2 1 5 10
How were these needs determined?
These needs were determined using the 2019 Housing and Community Development needs survey.
Describe the jurisdiction’s need for Public Improvements:
The most highly rated needs, according to the HCD survey, were bicycle and walking paths, tree
planting, street and road improvements, and sidewalk improvements.
Table NA-50.2
Providing a Suitable Living Environment
City of Avondale
Housing and Community Development Survey
Question No Need Low Need Medium Need High Need Don’t Know Missing Total
Pease rate the need for the following INFRASTRUCTURE activities in your community:
Street and Road improvements 0 3 1 2 0 4 10
Sidewalk improvements 0 3 1 2 0 4 10
Drinking Water system capacity
0 2 1 1 2 4 10
improvements
Drinking Water quality improvements 1 1 2 1 1 4 10
Sewer system improvements 1 1 1 1 2 4 10
Solid waste facility improvements 1 1 1 1 2 4 10
Storm sewer system improvements 1 1 1 1 2 4 10
Flood drainage improvements 0 1 1 1 3 4 10
Bridge improvements 1 2 1 1 1 4 10
Bicycle and walking paths 1 1 1 3 0 4 10
Tree Planting 0 2 2 2 0 4 10
Other 1 1 0 1 0 7 10
City of Avondale 19 Updated Draft Report
Consolidated Plan April 16, 2020Needs Assessment City of Avondale
How were these needs determined?
These needs were determined using the 2019 Housing and Community Development needs survey.
Describe the jurisdiction’s need for Public Services:
The highest rated needs included youth services, transportation services, and mental health/chemical
dependency services.
Table NA-50.3
Providing a Suitable Living Environment
City of Avondale
Housing and Community Development Survey
Question No Need Low Need Medium Need High Need Don’t Know Missing Total
Pease rate the need for the following HUMAN and PUBLIC SERVICES activities in your community:
Homelessness services 0 2 0 2 1 5 10
Youth services 0 0 1 3 1 5 10
Senior services 0 0 1 2 2 5 10
Transportation services 0 1 0 3 1 5 10
Healthcare services 1 2 0 1 1 5 10
Childcare services 0 0 1 2 2 5 10
Fair Housing activities 0 1 2 1 1 5 10
Tenant/Landlord counseling 0 1 1 2 1 5 10
Home-buyer education 0 0 2 2 2 4 10
Crime awareness education 0 1 4 1 0 4 10
Mitigation of lead-based paint hazards 0 2 0 1 2 5 10
Mitigation of radon hazards 0 2 0 1 2 5 10
Mitigation of asbestos hazards 0 2 0 1 2 5 10
Employment services 0 0 2 2 1 5 10
Mental health/chemical dependency services 0 0 1 3 1 5 10
Substance abuse services 0 0 2 2 1 5 10
Services for victims of domestic violence 0 0 2 2 1 5 10
Food banks 0 1 1 2 1 5 10
Other 2 0 0 1 1 6 10
How were these needs determined?
These needs were determined using the 2019 Housing and Community Development needs survey.
City of Avondale 20 Updated Draft Report
Consolidated Plan April 16, 2020Housing Market Analysis
MA‐05 OVERVIEW
Housing Market Analysis Overview:
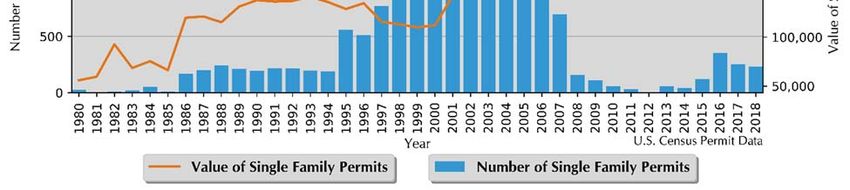
The Census Bureau reports building permit authorizations and “per unit” valuation of building permits
by city annually. Single‐family construction usually represents most residential development in the
county. Single‐family building permit authorizations in Avondale decreased from 252 authorizations in
2017 to 232 in 2018.
The real value of single‐family building permits decreased from 249,581 dollars in 2017 to 240,520
dollars in 2018. This compares to an increase in permit value statewide, with values rising from 259,218
dollars in 2017 to 259,708 dollars in 2018.
Diagram MA-05.1
Single-Family Permits
City of Avondale
Census Bureau Data, 1980–2017
City of Avondale 21 Updated Draft Report
Consolidated Plan April 16, 2020Housing Market Analysis City of Avondale
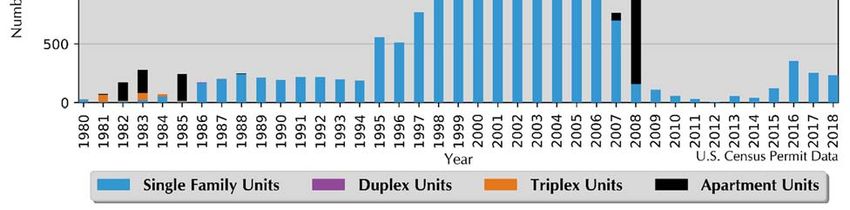
Diagram MA-05.2
Total Permits by Unit Type
City of Avondale
Census Bureau Data, 1980–2017
Table MA‐05.1 below shows housing units by type in 2010 and 2017. In 2010, there were 24,294 housing
units, compared with 27,057 in 2017. Single‐family units accounted for 77.4 percent of units in 2017,
compared to 79.2 in 2010. Apartment units accounted for 16.2 percent in 2017, compared to 11.4
percent in 2010.
Table MA-05.1
Housing Units by Type
City of Avondale
2010 & 2017 Five-Year ACS Data
2010 Five-Year ACS 2017 Five-Year ACS
Unit Type
Units % of Total Units % of Total
Single-Family 19,246 79.2% 20,941 77.4%
Duplex 228 0.9% 174 0.6%
Tri- or Four-Plex 699 2.9% 710 2.6%
Apartment 2,769 11.4% 4,391 16.2%
Mobile Home 1,336 5.5% 816 3.0%
Boat, RV, Van, Etc. 16 0.1% 25 0.1%
Total 24,294 100.0% 27,057 100.0%
City of Avondale 22 Updated Draft Report
Consolidated Plan April 16, 2020Housing Market Analysis City of Avondale
Table MA‐05.2 shows housing units by tenure from 2010 to 2017. By 2017, there were 27,057 housing
units. An estimated 54.4 percent were owner‐occupied, and 7.3 percent were vacant.
Table MA-05.2
Housing Units by Tenure
City of Avondale
2010 Census & 2017 Five-Year ACS Data
2010 Census 2017 Five-Year ACS
Tenure
Units % of Total Units % of Total
Occupied Housing Units 23,386 86.6% 25,077 92.7%
Owner-Occupied 14,382 61.5% 13,643 54.4%
Renter-Occupied 9,004 38.5% 11,434 45.6%
Vacant Housing Units 3,615 13.4% 1,980 7.3%
Total Housing Units 27,001 100.0% 27,057 100.0%
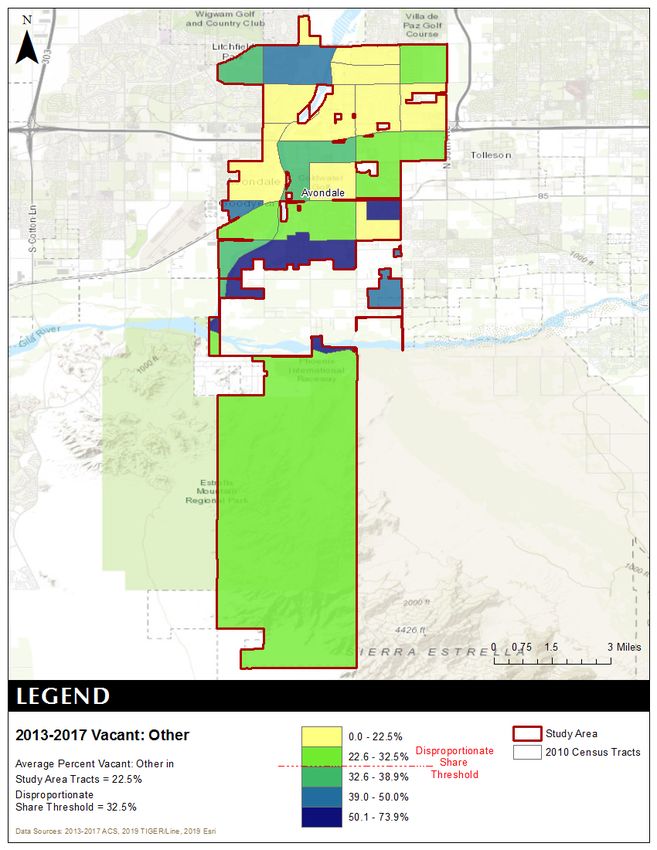
The disposition of vacant units between 2010 and 2017 are shown in Table MA‐05.3. By 2017, for rent
units accounted for 28.2 percent of vacant units, while for sale units accounted for 17.6 percent.
“Other” vacant units accounted for 22.5 percent of vacant units, representing a total of 445 “other”
vacant units.
Table MA-05.3
Disposition of Vacant Housing Units
City of Avondale
2010 Census & 2017 Five-Year ACS Data
2010 Census 2017 Five-Year ACS
Disposition
Units % of Total Units % of Total
For Rent 1,726 47.7% 559 28.2%
For Sale 842 23.3% 349 17.6%
Rented Not Occupied 89 2.5% 112 5.7%
Sold Not Occupied 94 2.6% 51 2.6%
For Seasonal, Recreational, or Occasional Use 205 5.7% 464 23.4%
For Migrant Workers 1 0% 0 0%
Other Vacant 658 18.2% 445 22.5%
Total 3,615 100.0% 1,980 100.0%
City of Avondale 23 Updated Draft Report
Consolidated Plan April 16, 2020Housing Market Analysis City of Avondale
MA‐45 NON‐HOUSING COMMUNITY DEVELOPMENT ASSETS ‐ 91.410, 91.210(F)
Introduction
The following section describes the economic atmosphere in the City of Avondale. This section utilizes,
along with other sources, Bureau of Economic Analysis (BEA) and Bureau of Labor Statistics (BLS)
data. BLS data can be calculated down to the city level, and therefore, is shown in this section to
represent the City of Avondale. BEA data is only available at the County level and reflects the entirety
of Maricopa County.
Economic Development Market Analysis
Business Activity in Avondale
Business by Sector Number of Number of Share of Share of Jobs less
Workers Jobs Workers Jobs Workers
% % %
Agriculture, Mining, Oil & Gas Extraction 461 16 1 0 ‐1
Arts, Entertainment, Accommodations 3,948 1,904 13 19 6
Construction 1,808 447 6 4 ‐1
Education and Health Care Services 5,096 1,056 16 10 ‐6
Finance, Insurance, and Real Estate 2,426 325 8 3 ‐4
Information 598 395 2 4 2
Manufacturing 2,429 43 8 0 ‐7
Other Services 936 247 3 2 ‐1
Professional, Scientific, Management
Services 1,923 230 6 2 ‐4
Public Administration 0 0 0 0 0
Retail Trade 5,071 4,314 16 43 27
Transportation and Warehousing 1,773 163 6 2 ‐4
Wholesale Trade 1,732 315 5 3 ‐2
Total 28,201 9,455 ‐‐ ‐‐ ‐‐
Table 4 ‐ Business Activity
Data 2011‐2015 ACS (Workers), 2015 Longitudinal Employer‐Household Dynamics (Jobs)
Source:
Labor Force in Avondale
Total Population in the Civilian Labor Force 39,025
Civilian Employed Population 16 years and over 35,745
Unemployment Rate 8.40
Unemployment Rate for Ages 16‐24 23.94
Unemployment Rate for Ages 25‐65 4.80
Table 5 ‐ Labor Force
Data Source: 2011‐2015 ACS
City of Avondale 24 Updated Draft Report
Consolidated Plan April 16, 2020Housing Market Analysis City of Avondale
Occupations by Sector in Avondale
Management, business and financial 6,140
Farming, fisheries and forestry occupations 2,405
Service 3,660
Sales and office 10,790
Construction, extraction, maintenance and repair 3,405
Production, transportation and material moving 2,810
Table 6 – Occupations by Sector
Data Source: 2011‐2015 ACS
Table ma‐45.1 shows the labor force statistics for City of Avondale from 1990 to the present. Over the
entire series the lowest unemployment rate occurred in 1990.0 with a rate of 0 percent. The highest
level of unemployment occurred during 2010.0 rising to a rate of 10.9 percent. This compared to a
statewide low of 3.9 in 2007.0 and statewide high of 10.4 percent in 2010.0. Over the last year, the
unemployment rate in City of Avondale increased from 4.4 percent in 2017 to 4.5 percent in 2018, which
compared to a statewide decrease to 4.8 percent.
Diagram MA‐45.1 shows the employment and labor force for City of Avondale. The difference between
the two lines represents the number of unemployed persons. In the most recent year, employment
stood at 41,037 persons, with the labor force reaching 42,934, indicating there were a total of 1,897
unemployed persons.
Diagram MA‐45.2 shows the unemployment rate for both the State and City of Avondale. During the
1990’s the average rate for City of Avondale was 5.6 percent, which compared to 5.5 percent
statewide. Between 2000 and 2010 the unemployment rate had an average of 4.8 percent, which
compared to 5.5 percent statewide. Since 2010, the average unemployment rate was 6.7 percent. Over
the course of the entire period the City of Avondale had an average unemployment rate that lower
than the State, 5.9 percent for City of Avondale, versus 6.1 statewide.
City of Avondale 25 Updated Draft Report
Consolidated Plan April 16, 2020Housing Market Analysis City of Avondale
Table MA-45.1
Labor Force Statistics
City of Avondale
1990 - 2018 BLS Data
City of Avondale
Statewide
Year Unemployment
Unemployment Employment Labor Force Unemployment Rate
Rate
1990 0 0 0 0% 5.3%
1991 0 0 0 0% 5.9%
1992 0 0 0 0% 7.5%
1993 0 0 0 0% 6.4%
1994 0 0 0 0% 6.1%
1995 0 0 0 0% 5.3%
1996 0 0 0 0% 5.6%
1997 490 8,174 8,664 5.7% 4.6%
1998 486 8,556 9,042 5.4% 4.3%
1999 545 8,877 9,422 5.8% 4.4%
2000 568 17,547 18,115 3.1% 4.0%
2001 839 19,740 20,579 4.1% 4.8%
2002 1,323 22,986 24,309 5.4% 6.1%
2003 1,377 25,929 27,306 5.0% 5.7%
2004 1,269 28,149 29,418 4.3% 5.0%
2005 1,304 31,895 33,199 3.9% 4.7%
2006 1,255 34,832 36,087 3.5% 4.2%
2007 1,183 36,257 37,440 3.2% 3.9%
2008 1,994 36,172 38,166 5.2% 6.2%
2009 3,470 35,712 39,182 8.9% 9.9%
2010 4,341 35,468 39,809 10.9% 10.4%
2011 3,682 35,311 38,993 9.4% 9.5%
2012 3,145 35,686 38,831 8.1% 8.3%
2013 2,774 35,851 38,625 7.2% 7.7%
2014 2,516 36,860 39,376 6.4% 6.8%
2015 2,257 38,012 40,269 5.6% 6.1%
2016 2,006 39,685 41,691 4.8% 5.4%
2017 1,897 41,037 42,934 4.4% 4.9%
2018 2,014 42,674 44,688 4.5% 4.8%
City of Avondale 26 Updated Draft Report
Consolidated Plan April 16, 2020Housing Market Analysis City of Avondale
Diagram MA-45.1
Employment and Labor Force
City of Avondale
1990 – 2017 BLS Data
Diagram MA-45.2
Annual Unemployment Rate
City of Avondale
1990 – 2017 BLS Data
City of Avondale 27 Updated Draft Report
Consolidated Plan April 16, 2020Housing Market Analysis City of Avondale
Travel Time in Avondale
Travel Time Number Percentage
< 30 Minutes 19,685 58%
30‐59 Minutes 11,860 35%
60 or More Minutes 2,605 8%
Total 34,150 100%
Table 7 ‐ Travel Time
Data Source: 2011‐2015 ACS
Education in Avondale:
Educational Attainment by Employment Status (Population 16 and Older)
Educational Attainment In Labor Force
Civilian Employed Unemployed Not in Labor
Force
Less than high school graduate 4,570 505 2,645
High school graduate (includes
equivalency) 7,190 465 2,455
Some college or Associate's degree 11,285 580 2,295
Bachelor's degree or higher 6,640 385 894
Table 8 ‐ Educational Attainment by Employment Status
Data Source: 2011‐2015 ACS
Educational Attainment by Age in Avondale
Age
18–24 yrs 25–34 yrs 35–44 yrs 45–65 yrs 65+ yrs
Less than 9th grade 175 470 820 1,690 1,380
9th to 12th grade, no diploma 1,320 1,645 1,390 1,705 420
High school graduate, GED, or
alternative 2,870 3,385 2,690 4,070 1,250
Some college, no degree 3,885 3,730 3,380 3,810 1,130
Associate's degree 395 1,185 760 1,420 430
Bachelor's degree 380 1,845 1,510 2,110 400
Graduate or professional degree 15 460 765 1,279 260
Table 9 ‐ Educational Attainment by Age
Data Source: 2011‐2015 ACS
City of Avondale 28 Updated Draft Report
Consolidated Plan April 16, 2020Housing Market Analysis City of Avondale
Educational Attainment – Median Earnings in the Past 12 Months in Avondale
Educational Attainment Median Earnings in the Past 12 Months
Less than high school graduate 24,119
High school graduate (includes equivalency) 30,271
Some college or Associate's degree 35,580
Bachelor's degree 44,515
Graduate or professional degree 59,201
Table 10 – Median Earnings in the Past 12 Months
Data Source: 2011‐2015 ACS
Education and Employment
Education and employment data, as estimated by the 2017 ACS, is presented in Table MA‐45.2. In 2017,
some 38,463 persons were employed and 2,475 were unemployed. This totaled a labor force of 40,938
persons. The unemployment rate for City of Avondale was estimated to be 6.0 percent in 2017.
Table MA-45.2
Employment, Labor Force and Unemployment
City of Avondale
2017 Five-Year ACS Data
Employment Status 2017 Five-Year ACS
Employed 38,463
Unemployed 2,475
Labor Force 40,938
Unemployment Rate 6.0%
In 2017, 85.4 percent of households in City of Avondale had a high school education or greater.
Table MA-45.3
High School or Greater Education
City of Avondale
2017 Five-Year ACS Data
Education Level Households
High School or Greater 21,414
Total Households 25,077
Percent High School or Above 85.4%
As seen in Table MA‐45.4, some 27.9 percent of the population had a high school diploma or
equivalent, another 38.2 percent have some college, 11.2 percent have a Bachelor’s Degree, and 4.9
percent of the population had a graduate or professional degree.
City of Avondale 29 Updated Draft Report
Consolidated Plan April 16, 2020Housing Market Analysis City of Avondale
Table MA-45.4
Educational Attainment
City of Avondale
2017 Five-Year ACS Data
Education Level Population Percent
Less Than High School 10,240 17.7%
High School or Equivalent 16,113 27.9%
Some College or Associates Degree 22,085 38.2%
Bachelor’s Degree 6,478 11.2%
Graduate or Professional Degree 2,846 4.9%
Total Population Above 18 years 57,762 100.0%
Based on the Business Activity table above, what are the major employment sectors within
your jurisdiction?
The Bureau of Economic Analysis (B.E.A.) produces regional economic accounts, which provide a
consistent framework for analyzing and comparing individual state and local area economies. Table
MA‐45.5, shows the total employment by industry for Maricopa County. The most recent estimates
show the health care and social assistance industry was the largest employer in Maricopa County, with
employment reaching 285,335 jobs in 2017. Between 2016 and 2017 the construction industry saw the
largest percentage increase, rising by 6.6 percent to 147,553 jobs.
Table MA-45.5
Employment by Industry
Maricopa County
BEA Table CA25 Data
%
NAICS Categories 2010 2011 2012 2013 2014 2015 2016 2017 Change
16-17
Farm earnings 6,325 6,210 6,630 6,898 6,621 7,193 7,658 6,856 -10.5
Forestry, fishing, related activities,
2,538 2,571 2,607 2,578 2,716 2,787 2,793 2,655 -4.9
and other
Mining 6,350 5,775 8,249 8,168 7,785 8,059 8,319 8,688 4.4
Utilities 8,191 8,032 8,083 7,945 7,869 8,055 8,525 8,787 3.1
Construction 109,587 111,017 117,433 123,362 125,323 129,080 138,363 147,553 6.6
Manufacturing 112,512 115,157 119,528 120,849 121,743 123,669 124,997 128,557 2.8
Wholesale trade 87,969 88,762 89,233 89,772 89,952 90,357 86,597 87,655 1.2
Retail trade 236,686 239,618 241,515 243,400 256,830 266,428 270,138 274,023 1.4
Transportation and warehousing 64,324 67,828 70,823 71,886 75,352 85,409 97,365 101,602 4.4
Information 34,552 34,991 36,443 40,360 42,534 43,034 43,375 43,093 -0.7
Finance and insurance 156,637 169,057 170,820 177,359 177,294 186,890 197,245 208,932 5.9
Real estate and rental and leasing 140,165 144,203 141,900 143,449 147,475 150,088 153,578 157,950 2.8
Professional and technical services 147,914 149,206 150,249 155,781 159,770 166,665 173,861 178,610 2.7
Management of companies and enterprises 25,173 25,196 26,772 29,045 30,650 33,054 36,879 37,093 0.6
Administrative and waste services 188,442 193,957 199,619 212,434 217,994 223,834 232,544 234,475 0.8
Educational services 51,118 52,665 54,086 53,783 56,084 59,358 59,742 60,455 1.2
Health care and social assistance 221,117 228,897 236,434 242,939 249,923 262,824 273,735 285,335 4.2
Arts, entertainment, and recreation 45,043 45,842 47,743 48,967 52,827 53,544 55,516 57,962 4.4
Accommodation and food services 153,423 158,612 162,123 169,643 176,428 183,883 190,031 196,341 3.3
Other services, except public
104,807 111,370 114,135 116,830 121,754 127,497 127,840 128,737 0.7
administration
Government and government enterprises 226,010 222,445 221,881 223,755 225,523 227,453 228,431 230,948 1.1
Total 2,128,883 2,181,411 2,226,306 2,289,203 2,352,447 2,439,161 2,517,532 2,586,307 2.7
City of Avondale 30 Updated Draft Report
Consolidated Plan April 16, 2020Housing Market Analysis City of Avondale
Describe the workforce and infrastructure needs of the business community:
The Housing and Community Development Survey found that the highest rated needs are for fostering
businesses with higher paying jobs, provision of job training, and provision of job re‐training. These
are shown in Table MA‐45.6.
Table MA-45.6
Enhancing Economic Opportunities
City of Avondale
Housing and Community Development Survey
Question No Need Low Need Medium Need High Need Don’t Know Missing Total
Pease rate the need for the following BUSINESS and ECONOMIC DEVELOPMENT activities in your community:
Attraction of new businesses 0 1 1 3 0 5 10
Retention of existing businesses 0 1 0 4 0 5 10
Expansion of existing businesses 0 1 1 3 0 5 10
Provision of job training 0 1 0 4 0 5 10
Provision of job re-training, such as
0 1 0 4 0 5 10
after plant or other closures
Foster businesses with higher paying
0 0 1 4 0 5 10
jobs
Enhancement of businesses
0 0 0 3 2 5 10
infrastructure
Provision of working capital for
0 0 1 2 2 5 10
businesses
Provision of technical assistance for
0 0 0 3 2 5 10
businesses
Development of business incubators 0 0 2 1 2 5 10
Development of business parks 0 1 1 1 2 5 10
Describe any major changes that may have an economic impact, such as planned local or
regional public or private sector investments or initiatives that have affected or may affect
job and business growth opportunities during the planning period. Describe any needs for
workforce development, business support or infrastructure these changes may create.
A team of City staff is working on a plan – the Historic Avondale Specific Plan – focusing on economic
development steps, land use and zoning, marketing and branding, and revitalization. The three
historic areas contain the City’s greatest concentration of older commercial buildings and residential
homes. These well‐established areas have opportunities for neighborhood identification, new
development of commercial, employment, and residential, as well as improvements for outdoor
spaces and lighting and blight removal.
How do the skills and education of the current workforce correspond to employment
opportunities in the jurisdiction?
The Housing and Community Development survey found a high level of need for job training and re‐
training in Avondale. In addition, 27.9 percent of the population had a high school diploma or equivalent,
another 38.2 percent have some college, 11.2 percent have a Bachelor’s Degree, and 4.9 percent of the
population had a graduate or professional degree. Public comment during the public input meeting
suggested that the City needs additional job training programs.
City of Avondale 31 Updated Draft Report
Consolidated Plan April 16, 2020You can also read