333 NEEDS ASSESSEMENT - City of San Leandro
←
→
Page content transcription
If your browser does not render page correctly, please read the page content below

CHAPTER THREE

                               3
                NEEDS ASSESSEMENT
CHAPTER

                                                                                                              3
                                                                    NEEDS ASSESSMENT

introduction
The purpose of the Needs Assessment is to describe
demographic, housing, and economic conditions in San
Leandro so that the City’s housing policies and actions
reflect local needs. The Needs Assessment includes
data on population, household characteristics, income
and employment, special needs groups, housing stock
characteristics, building condition, and housing values.
As appropriate, it presents this data side by side with
data from Alameda County and other communities to
facilitate an understanding of the city’s characteristics
relative to the region. Consistent with State law, this
chapter also includes a discussion of subsidized units
at risk of converting to market-rate rents, a discussion
                                                            This is an increase of 3,020 residents (3.8 percent) since
of residential energy conservation, and an evaluation
                                                            the decennial census of April 1, 2000.
of the needs of homeless and extremely low income
households.                                                 The city’s average annual growth rate has slowed since
                                                            the 1990s. During that decade, San Leandro grew at a
The starting point for this Needs Assessment is the 2003
                                                            rate of 1.6 percent a year, whereas growth since 2000
San Leandro Housing Element. Data from that Element
                                                            has been about 0.4 percent a year. While the city out-
has been updated to 2008 or 2009 where more current
                                                            paced Alameda County’s 1.2 percent annual growth in
sources are available. Because both the 2003 Element
                                                            the 1990s, it has lagged the County’s 0.7 percent annual
and the 2009 Element were prepared during the 2000-
                                                            growth rate since 2000.
2010 interval, the US decennial census of 2000 remains
the baseline for most information in this document.         As Table 3-1 indicates, San Leandro’s population grew
Other data sources, such as the American Community          rapidly during the 1950s, leveled off during the 1960s
Survey, the California Department of Finance, the City      and then declined during the 1970s. After a relatively
of San Leandro, and real estate data tracking services,     stable period in the 1980s, new housing construction
have been used and are referenced in the text.              and rising household sizes resulted in a 16.4 percent
                                                            increase during the 1990s. Since 2000, the growth rate
demographics                                                has returned to levels comparable to the 1980s.

Growth Rate                                                 Information on projected population growth from 2009
                                                            to 2030 is included later in this chapter.
The State Department of Finance indicates that San
Leandro’s population as of January 1, 2009 was 82,472.

                                                                 SAN LEANDRO HOUSING ELEMENT APRIL 2010              3-1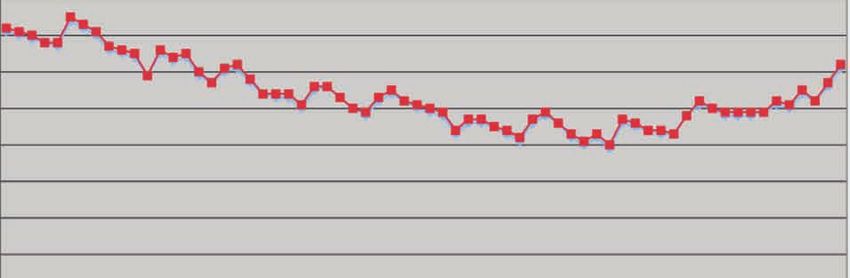
NE EDS ASSESSMENT

      TABLE 3-1: POPULATION CHANGE IN SAN LEANDRO AND ALAMEDA COUNTY, 1950-2009

                                      1950            1960          1970           1980                  1990              2000     2009*
       City of San Leandro           27,542          65,962        68,698          63,952            68,223              79,452     82,472
                 % Change                    --      139.5%          4.1%          -7.0%                 6.7%            16.4%        3.8%
          Alameda County           740,315          908,209      1,071,446    1,105,379           1,279,812          1,462,700    1,556,700
                 % Change                    --       22.7%         18.0%            3.0%            15.5%               14.6%        6.4%
                  Bay Area       2,681,322         3,638,939     4,630,576    5,179.793           6,020,147          6,930,600    7,375,700
                 % Change                    --       35.7%         27.2%          11.9%             16.2%               15.1%        6.4%
      (*) percent change is for 9-year period, not 10-year period.
      Source: US Census, 1950-2000, California Department of Finance, 2009

      CHART 3-1: SAN LEANDRO HOUSEHOLD TYPE, 2000
                                                                                               Other
                                                                                              families

                                                                             10%

                          Householders                  28%
                           living alone
                                                                                                            Married with
                                                                                            21%           children under 18

                                                      7%
                 Unrelated individuals, no
                     children present
                                                           8%
                                                                               26%
                             Single parents with
                                                                                                    Married, no children
                              children under 18
                                                                                                         under 18

      Source: US Census, 2000

      Household Type                                                         Based on the 2000 Census, about 65 percent (19,817)
                                                                             of San Leandro’s households were families, defined by
      According to 2009 data from the California
                                                                             the Census as “a householder and one or more other
      Department of Finance, 99 percent of San Leandro’s
                                                                             persons living in the same household who are related to
      residents live in individual households while 1 percent
                                                                             the householder by birth, marriage, or adoption.” San
      (827 residents) live in group quarters. The number of
                                                                             Leandro’s 10,825 “non-family” households included
      residents in group quarters has remained stable since
                                                                             persons living alone and unrelated individuals sharing
      the 2000 Census. Although the total is relatively small,
                                                                             a home with no children present. The percentage of
      there were three times as many residents in group quar-
                                                                             households that are families is the same as in Alameda
      ters in 2000 as there were in 1990. This is primarily
                                                                             County as a whole.
      due to the development of senior care facilities in the
      city during the 1990s.                                                 Chart 3-1 provides additional detail on the types of
                                                                             households in San Leandro. In 2000, about 21 percent
      The 2000 Census counted 30,642 households in the
                                                                             of the city’s households consisted of a married couple
      city, with 78,625 persons. In 2009, the Department of
                                                                             with children under 18 living at home. While this
      Finance estimated the current number of households at
                                                                             figure is low compared to the county as a whole, it rep-
      31,270, an increase of 2.0 percent. Household popula-
                                                                             resents an increase since 1990, when just 17 percent of
      tion in 2009 is estimated to be 81,645.

3-2    SAN LEANDRO HOUSING ELEMENT APRIL 2010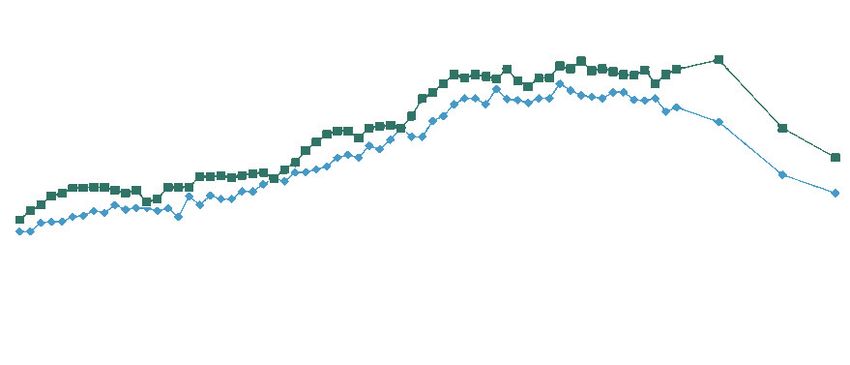
N EEDS A S S E S S ME N T

the city’s households were married with children. The           TABLE 3-2: HOUSEHOLD SIZE IN SAN LEANDRO AND
number of empty nester households in San Leandro                ALAMEDA COUNTY, 1960-2009
declined (from 9,937 in 1990 to 8,028 in 2000) as a                  Year           San Leandro        Alameda County
new generation of young families moved in.                           1960                      3.28                      N/A
                                                                     1970                      2.81                      2.84
In 2000, about 6 percent of the city’s households
                                                                     1980                      2.34                      2.53
(1,828) consisted of single mothers with children
                                                                     1990                      2.33                      2.59
under 18 and about 2 percent (577) consisted of single
                                                                     2000                      2.57                      2.71
fathers with children under 18. These percentages did
not change substantially between 1990 and 2000. San                  2009                      2.61                      2.75
Leandro’s non-family households included 8,745 per-             Source: US Census, 1960-2000, California Department of
                                                                Finance, 2009
sons living alone and 2,080 households with unrelated
persons living together.

The American Community Survey (ACS) provides
some indication of how the mix of households in San                THE AMERICAN COMMUNITY SURVEY
Leandro may have changed since 2000 (see sidebar).                 The American Community Survey (ACS) was initiated
The data suggests a slight increase in the number of               in the 1990s to provide a means of estimating
                                                                   the characteristics of the population on a more
single parent households.
                                                                   regular basis than the decennial census. The ACS is
ACS data for 2006 indicates that 21.4 percent of the               designed to replace the Census “long form” with an
                                                                   annual survey, with results that can be extrapolated
city’s households consisted of married couples with
                                                                   to the population at large. Since 2003, annual ACS
children under 18—virtually the same percentage as                 reports have been produced for all counties and
in 2000. The percentage of married couples with no                 cities with 65,000 people or more.
children at home was estimated at 24.7 percent, down
                                                                   The Census long form is currently administered to
about one percentage point since 2000. The percentage
                                                                   1 in 6 American households every 10 years and
of single parent households was estimated at around 11             includes detailed demographic, household, and
percent, which is three percentage points higher than              employment questions. The ACS is distributed to
2000. The percentage of householders living alone                  a smaller sample size—totaling about 3 million
remained the same at 28 percent, while the percentage              households nationwide. Thus, the findings for smaller
of unrelated individuals living together with no chil-             cities like San Leandro may be less reliable than the
dren declined by about one percentage point.                       decennial census. Each ACS statistic is presented
                                                                   with an estimated margin of error. The margins
Household Size                                                     range from 10 percent to as high as 50 percent of
                                                                   the figure listed.
In 2009, average household size in San Leandro is esti-
                                                                   Data from the ACS is cited throughout this Needs
mated to be 2.61.* This is a slight increase from 2000,
                                                                   Assessment, but is usually qualified with a disclaimer
when the Census reported average household size in
                                                                   about accuracy. The data provides some indication
the city to be 2.57.                                               of trends, but may overstate (or understate) the
                                                                   magnitude of change.
The change over the last eight years continues a trend
that began about two decades ago. In 1990, average
household size was 2.33. At that time, average house-
hold size in the County as a whole was 2.59. As Table
3-2 indicates, the gap between the city and the county
has narrowed in the last 18 years.

*The 2.61 figure is based on California Department of Finance
data for January 1, 2009. The American Community Survey
estimated household size at 2.78, but that figure appears too
high based on City and State records.

                                                                      SAN LEANDRO HOUSING ELEMENT APRIL 2010                     3-3
NE EDS ASSESSMENT
Age city’s residents. By 2000, this percentage declined to 16
percent. According to the American Community Survey,
Table 3-3 indicates age distribution in San Leandro in
the percentage has declined even further and was just
1990 and 2000 and presents the rate of growth for each
11.5 percent by 2006. Although the ACS figure is almost
age cohort listed. The table also shows data from the
certainly overstated, the data does point out an important
American Community Survey for 2006.
trend. The generation that settled the city during the
In 2000, the median age in the city was 37.7. Although post-war era is now in their 80s and 90s and has a high
this was still higher than the county median of 34.5, it rate of mortality. Younger families with children have
represents a decline from 1990 when the median age been moving into the city in growing numbers since
was 38.1. Chart 3-2 compares the age distribution in 1990, and continue to do so today. San Leandro is a very
San Leandro with Alameda County as a whole. different city today than it was in 1990.
The city experienced remarkable growth in its youth Between 1990 and 2000, the fastest growing age cohort
population during the 1990s, with a 36 percent increase was the so-called baby boomer generation (persons born
between 1990 and 2000. Based on American Community between 1946 and 1963). The number of persons in this
Survey (ACS) data, the percentage of San Leandro cohort increased by 57 percent during the 1990s, almost
residents who are 19 or younger has continued to increase four times the rate of growth for the general population.
since 2000. The percent of total residents in this cohort The American Community Survey indicates continued
grew from 20.9 percent of the population in 1990 to 24.3 growth of the baby boomer cohort since 2000. The ACS
percent in 2000. The ACS indicates that 25.9 percent of indicates that 22.1 percent of the city’s residents are now
the city’s residents were 19 or under in 2006. between 45 and 59, up from 18.3 percent in 2000.
By contrast, the city has seen a decrease in the per- The changes in age distribution have important impli-
centage of its residents over 65. This counters the trend cations for housing needs. The baby boom generation,
elsewhere in Alameda County and in the state and now representing almost one-quarter of the city’s
nation. In 1990, seniors represented 19.1 percent of the residents, is approaching retirement age. The “bulge”
TABLE 3-3: AGE DISTRIBUTION OF SAN LEANDRO RESIDENTS: 1990, 2000 AND 2006
Estimated
’90-’00 2006 % of total
Age Group 1990 % of total 2000 % of total change (ACS)*
Under 5 3,948 5.8% 5,032 6.3% 27.4% 7.6%
Age 5-9 3,908 5.7% 5,274 6.6% 34.9% 7.3%
Age 10-14 3,242 4.8% 4,661 5.9% 43.7% 4.9%
Age 15-19 3,163 4.6% 4,397 5.5% 39.0% 6.0%
Age 20-24 4,223 6.2% 4,504 5.7% 6.6% 7.4%
Age 25-34 12,374 18.1% 12,076 15.2% -2.5% 12.4%
Age 35-44 10.312 15.1% 13,334 16.8% 29.3% 16.6%
Age 45-54 6,907 10.1% 10,857 13.7% 57.1% 16.4%
Age 55-64 7,133 10.4% 6,629 8.4% -7.6% 9.7%
Age 65-74 7,848 11.5% 5,845 7.4% -25.5% 5.3%
Age 75-84 4,023 5.9% 5,096 6.4% 26.6% 4.3%
Age 85+ 1,142 1.7% 1,747 2.2% 52.9% 1.9%
Total 68,223 100.0% 79,452 100.0% 16.5% 100.0%
Median Age 38.1 37.7
Source: US Census, 1990 and 2000. American Community Survey, 2008
(*) American Community Survey is based on a sample and has a relatively high margin of error
3-4 SAN LEANDRO HOUSING ELEMENT APRIL 2010N EEDS A S S E S S ME N T
in the city’s age distribution will advance to the 60 residents form families, the city will also require
to 74 age cohort during the coming decade, creating housing that is suitable for young adults with children.
an increasing need for active retirement housing and
independent senior living facilities in the city. As Ethnicity and Linguistic Isolation
life expectancies increase, the city will continue to Over the last 30 years, San Leandro has become one
have a growing number of frail elderly residents who of the most diverse cities in Alameda County. The
require skilled nursing and assisted living facilities. percentage of Asian and African-American residents
San Leandro will also experience a surge in demand increased from 11.4 percent of the city’s population
for rental apartments and affordable housing as the in 1990 to 32.8 percent in 2000. The percentage of
city’s teens and young adults mature. The number of residents of Hispanic origin increased from 15.2
residents in the 25-34 age cohort is likely to increase percent of the city’s population to 20 percent in 2000.
substantially during the next 10 years. As these The American Community Survey indicates that these
trends continued through 2007. At that time, ACS sam-
CHART 3-2: AGE DISTRIBUTION OF RESIDENTS IN pling for San Leandro indicated that 29.2 percent of the
SAN LEANDRO AND ALAMEDA COUNTY, 2000 city’s residents were Asian, 11.8 percent were African-
Over 65 American, and 26.7 percent were Hispanic.* About 45
percent of San Leandro’s Asian residents are Chinese,
Under 19
25 percent are Filipino, 9 percent are Vietnamese, and
55-64 16% the remainder are other Asian nationalities. In addi-
24%
8%
tion, the ACS reported that 3.1 percent of the city’s
residents were multi-racial and 0.4 percent were Native
American. The ACS further reported that in 2006, 31.5
percent of San Leandro’s residents were foreign-born.
14%
45-54 In some respects, San Leandro’s demographics are a
21% mirror image of the Bay Area. No one ethnic group
17% 20-34 constitutes a majority. Non-hispanic white residents,
historically a majority in San Leandro, constitute about
35-44 35 to 40 percent of the city’s population today. As the
SAN LEANDRO city’s population has become more diverse, so have its
businesses, social services, and cultural institutions.
Cultural changes have affected housing conditions and
Over 65 housing needs.
Under 19 In 1990, the Census reported that 25 percent of the
55-64 10%
city’s residents spoke a language other than English at
27%
8%
home, and that 5 percent did not speak English well or
at all. By 2000, 39 percent of the city’s residents spoke
a non-English language at home and 9 percent did not
14% speak English well or at all. Data from the ACS indi-
45-54
cates that in 2006, 11.6 percent of the city’s households
were “linguistically isolated,” meaning they lacked a
24% member who was fluent in English. About 40 percent
17% 20-34
of these households spoke Spanish and about 45 per-
cent spoke Chinese or another Asian language.
35-44
ALAMEDA COUNTY *These categories are not mutually exclusive, as some Hispanic
Source: US Census 2000 residents may also be Asian or African-American.
SAN LEANDRO HOUSING ELEMENT APRIL 2010 3-5NE EDS ASSESSMENT
Given the growing number of non-English households owner households. Average household size was 2.36
in the city, it is essential that information on housing for renters and 2.70 for owners. The Census also found
programs is made available in multiple languages. that 90 percent of all owner-occupied households
Housing programs and other social services must be were headed by someone over 34. By contrast, 34
sensitive to cultural differences and the needs of the percent of all renter-occupied households were headed
different ethnic groups living in the city. by someone under 34. Moreover, one-third of San
Leandro’s owner-occupied households were headed
Tenure by someone over 65—and 20 percent were headed by
The 2000 Census indicated that 39.4 percent of San someone over 75. Although many of these households
Leandro’s households were renters and 60.6 percent own their homes outright, the relatively high percent-
were owners (see Table 3-4). The percentage of renters ages suggest the need for programs providing home
declined from 41.4 percent in 1990, primarily because maintenance and upkeep assistance for seniors.
almost all of the housing added during the 1990s
In 2000, 91 percent of San Leandro’s owner-occupant
was owner-occupied. This reversed the trend of the
households lived in single family homes, with most
1970s and 1980s, when rental apartment construction
of the remainder living in mobile homes. By contrast,
outpaced single family home construction. Since 2000,
most renters lived in buildings of 5 units or larger.
the trend toward increased ownership housing has con-
About 30 percent of the city’s renter households lived
tinued. According to the American Community Survey,
in single family homes. These statistics remained
38.9 percent of the city’s households were renters in
constant between 1990 and 2000. Table 3-5 indicates
2006, and 61.1 percent were owners.
tenure by unit type as of 2000.
The 2000 Census indicated that renter households
tended to be smaller, younger, and less affluent than
TABLE 3-4: HOUSING TENURE IN SAN LEANDRO, 1980-2006
Year Renters % Renters Owners % Owners
1980 10,249 37.7% 16,955 62.3%
1990 12,084 41.5% 17,044 58.5%
2000 12,073 39.4% 18,569 60.6%
2006 (*) 38.9% (*) 61.1%
Source: US Census, 1980-2000. American Community Survey, 2008
(*) American Community Survey raw numbers not cited here, as totals provided by ACS exceed the known
total of households in the city. However, percentages are given to provide a benchmark for comparison.
TABLE 3-5: OCCUPIED HOUSING UNITS BY TENURE AND UNIT TYPE, 2000
Total Housing Percent of Total
Type of Unit Owner-Occupied Renter-Occupied Units Occupied by Owners
Single Family 16,873 3,666 20,539 82.1
Multi-Family, 2-4 unit 349 1,833 2,182 16.0
Multi-Family, 5+ units 557 6,461 7,018 7.9
Mobile Homes 714 73 787 90.7
Other 84 6 90 93.3
Total 18,577 12,039 30,616 60.6
Source: 2000 Census
3-6 SAN LEANDRO HOUSING ELEMENT APRIL 2010N EEDS A S S E S S ME N T
Conclusions 2000. Median family income in San Leandro in 2000
was $60,266, reflecting the higher income-earning
San Leandro experienced significant demographic
potential of double income households relative to all
change between 1990 and 2000, and these changes
households. Still, the city lagged the county, which had
have continued to reshape the city since 2000. As the
a median household income of $65,857.
city’s population has become more diverse, its housing
needs have become more complex. The most compel- The American Community Survey reported that San
ling change is the increasing number of foreign-born Leandro’s median household income was $60,959
households in the city—from 17 percent in 1990 to in 2006, which is a 19 percent increase over 2000.
an estimated 32 percent in 2006. The trends suggest Income increased at a slightly faster pace than the Bay
a growing need for housing services for non-English Area consumer price index, which saw a 17 percent
speaking households, as well as housing types which increase between 2000 and 2006. Relative to adjacent
recognize the needs of specific immigrant groups (such communities, San Leandro’s income is comparable to
as extended families). Hayward and San Lorenzo, higher than Oakland, and
lower than Castro Valley and Alameda. San Leandro
Other notable demographic changes include an
has historically had a reputation as a “blue collar”
increase in household size and number of children,
community with a large number of moderate-income
suggesting a need for more three- and four-bedroom
working families. While the nature of the workforce
units for larger families. Although the percentage (and
has changed, the city continues to have a large number
even the absolute number) of seniors in San Leandro
of middle-income households and relatively small
has declined since 1990, the need for senior housing
numbers of households at the upper and lower ends of
continues to be high. The need for senior housing will
the income spectrum.
grow significantly as the city’s large number of baby
boomers reach retirement. Demographic data also Table 3-6 indicates that 19.7 percent of the city’s
suggests a high need for affordable rental housing for households were earning less than $25,000 a year
young adults and families—this will be a fast-growing in 2000—over 52 percent of these households were
age cohort in the coming years, and the housing market seniors. According to the American Community
is currently not keeping pace. Survey, about 20 percent of San Leandro’s households
continued to have incomes under $25,000 as of 2006,
despite the rise in median income for the city as a
income and housing affordability whole. The 2000 Census reported that 6.4 percent of
San Leandro’s residents were below the US poverty
Income
level in 1999. The incidence of poverty was higher
In 1990, the median household income in San Leandro among seniors over 75 (7.3 percent), children (8.0
was $35,851, which was $1,863 below the countywide percent), and single mother households (15.3 percent).
median. The lower median was attributable in part to Data for 2006 available from the American Community
the city’s relatively large senior population, many of Survey indicates the city’s poverty rate has declined
whom were retired and living on fixed incomes. In to 5.5 percent, although the rate for certain groups—
1990, over 30 percent of San Leandro’s households namely, single mothers—went up to 17.7 percent. The
had incomes below $25,000 and about half of these margin of error for the ACS data is high, however.
households were headed by someone over 65.
In 1999, 2.7 percent of the city’s households received
By 2000, the median household income had increased public assistance and 27.6 percent received social secu-
to $51,081, which was $4,865 less the countywide rity income. According to the American Community
median. Despite the 42 percent growth in household Survey, the percentage of households on public
income, the city lagged the county in income growth. assistance has gone up slightly since 2000 while the
Much of the income growth during this period was percentage receiving social security income has gone
offset by inflation; the consumer price index for the down slightly.
Bay Area increased by 37 percent between 1990 and
SAN LEANDRO HOUSING ELEMENT APRIL 2010 3-7NE EDS ASSESSMENT
TABLE 3-6: NUMBER OF SAN LEANDRO HOUSEHOLDS BY INCOME GROUP, 1990, 2000, 2006
1990 2000 2006(*)
Number of Percentage of Number of Percentage of Percentage of
Category Households Households Households Households Households
Less than $9,999 2,836 9.7% 1,703 5.6% 4.2%
$10,000-$14,999 1,971 6.8% 1,363 4.5% 4.0%
$15,000-$24,999 4,690 16.1% 2,965 9.7% 12.0%
$25,000-$34,999 4,718 16.2% 3,531 11.5% 8.5%
$35,000-$49,999 6,152 21.1% 5,263 17.2% 14.2%
$50,000-$74,999 5,834 20.0% 7,200 23.5% 18.7%
$75,000-$99,000 1,842 6.3% 4,008 13.1% 14.8%
Over $100,000 1,056 3.6% 4,563 14.9% 23.6%
Total 29,099 100.0% 30,596 100.0% 100.0%
Source: US Census, 1990-2000, American Community Survey, 2006
(*) 2006 American Community Survey Data is based on a relatively small sample size, extrapolated to a larger number of
households than exists in San Leandro. The margin of error for this data is relatively high.
TABLE 3-7: HUD ANNUAL INCOME LIMITS FOR THE OAKLAND-FREMONT METROPOLITAN AREA, 2009
Income Number Of Persons Per Family
Category 1 2 3 4 5 6 7 8
ExtremelyN EEDS A S S E S S ME N T
percentage of lower-income households is higher than years later—the median price had risen to $334,000,
the regional percentage. Federal housing programs do an 81 percent increase. Chart 3-3 displays median
not take this differential into effect, and apply the same price data for San Leandro from January 2002 to May
income standards to all cities in the county. 2008 based on monthly sales data from the California
Association of Realtors. The chart also shows median
Local Housing Costs home price data for Alameda County as a whole.
Home prices and rents in San Leandro have fluctuated Between January 2002 and the peak of the market
at dramatic rates, as they have throughout the Bay Area four years later in April 2006, the median price of a
as a whole. The city experienced a rapid run-up in San Leandro home rose 77 percent. By April 2006,
home prices between 1998 and 2000, continued price the median had reached $575,000—more than double
inflation (although at a slower rate) through 2006, and the value calculated six years earlier during the U.S.
then a steep decline in 2007 and 2008. Census. The increase in housing value was comparable
to the county as a whole, where a 75 percent increase
In January 1998, the California Association of Realtors occurred between January 2002 and April 2006.
reported that the median price of a San Leandro home
was $184,500. By December 2001—less than four
CHART 3-3: MEDIAN HOME SALES PRICE: SAN LEANDRO AND ALAMEDA COUNTY, 2002-2008
May 02
May 03
May 04
May 05
May 06
May 07
May 08
Sept 03
Sept 04
Sept 05
Sept 06
Sept 07
Sep 02
Jan 02
Jan 03
Jan 04
Jan 05
Jan 06
Jan 07
Jan 08
$700,000
$600,000
$500,000
$400,000
$300,000
$200,000
$100,000
San Leandro Alameda County
Source: California Association of Realtors, 2008
SAN LEANDRO HOUSING ELEMENT APRIL 2010 3-9NE EDS ASSESSMENT
TABLE 3-8: SUMMARY OF FOR-SALE HOUSING PRICES IN SAN LEANDRO, JUNE 2008
Individual
Condos/ Single Family
Mobile Homes Townhomes Detached 2-6 Plex Buildings
Number of Listings 15 73 362 52
Lowest Price $19,000 $130,000 $190,000 $294,900 (2 unit)
Highest Price $149,999 $498,000 $1,195,000 $949,950 (4 unit)
Median Price $44,950 $269,900 $409,000 $539,950
Source: Realtor.com, Barry J Miller, AICP, 2008
Prices began declining in late 2006. The decline $150,000. Mobile homes are an important affordable
continued through 2007 and into 2008. In June 2008, housing resource in San Leandro, particularly for the
the median sales price for San Leandro was $390,000. city’s seniors.
Prices in the city fell 8 percent between June 2006 and
June 2007 and by 24 percent between June 2007 and Additional sales data was collected from the San
June 2008. The median sales price in June 2008 was Francisco Chronicle. In August 2008, the median
the same the as it was in October 2003. The decline price of the 33 San Leandro homes listed for sale was
was parallel to a countywide decline, where median $404,000. Prices ranged from $190,000 to $1,175,000.
price dropped from $613,000 in June 2006 to $450,000
Home prices in new for-sale developments are generally
in June 2008. Data from the California Association of
higher than resales. For example, prices for new three-
Realtors shows the price slide continued between June
bedroom townhomes in Cherry Glen (off of Washington
2008 and January 2009, with the median sale price in
Street) and Cherry Park Square (on MacArthur
the city dropping to $319,000.
Boulevard) are in the mid-$400,000s. Comparable units
Realtor.com, an internet data base of homes for sale, in older developments were over $100,000 less, although
found 515 listings in San Leandro in August 2008. these units lack the amenities of the newer homes.
A summary of the search results for San Leandro Resale homes in newer developments like Cherrywood
addresses is shown in Table 3-8.* The number of and Heron Bay tend to be more expensive than homes of
properties for sale has increased dramatically in the comparable size in older neighborhoods like Washington
city since 2001, when the same website listed just Manor or Marina Faire.
120 properties. In August 2008, Realtor.com San
In 2008, San Leandro was more affordable than the
Leandro listings included 362 single family homes, 73
Bay Area as a whole; its median home price is about 20
townhomes or condos, 52 duplex/triplex/fourplex type
percent less than the region’s. Among Alameda County
buildings, 15 mobile homes, and one 21-unit apart-
cities, Oakland, Hayward, and Emeryville had lower
ment building. The single family homes ranged from a
median prices. Homes in Berkeley and Pleasanton
2-bedroom, 1-bath 960 square foot house for $190,000
were almost twice as expensive as San Leandro, while
to a 5-bedroom, 4-bath home 3,400 square foot house
Fremont and Alameda prices are about 40 percent
for $1,195,000. The condos and townhomes ranged
higher. Relative to the unincorporated area, San
from to a 1-bedroom, 1-bath unit for $130,000 to a
Leandro prices are 8 percent higher than San Lorenzo
3-bedroom, 2.5-bath unit for $498,000.
and 20 percent lower than Castro Valley.
The most affordable owner-occupied units in San
Rents in San Leandro have fluctuated over the last
Leandro are mobile homes. There were 15 available
decade, but the changes have been less volatile than the
for sale in August 2008, ranging from about $20,000 to
for-sale market. In 2000, the Census reported a median
gross monthly rent of $873, an increase of 43 percent
*This is based on all properties with San Leandro addresses, over 1990. This includes all rental units in the city,
and thus includes several properties in unincorporated Ashland
including those that have been occupied for many years
and Hillcrest Knolls (Alameda County) to the southeast of the
City limits. without substantial rent increases (nearly 700 units in
3-10 SAN LEANDRO HOUSING ELEMENT APRIL 2010N EEDS A S S E S S ME N T
TABLE 3-9: PROFILE OF RENTAL HOUSING LISTINGS IN Housing Affordability and Overpayment
SAN LEANDRO, AUGUST 20085
The US Department of Housing and Urban
Advertised
Development has defined “affordable” housing as
Monthly
housing which requires no more than 30 percent of a
Unit Type Rents
household’s gross monthly income, including the cost
Studio apartment $599-$940
of rent or mortgage payments, homeowner’s fees, and
1-bedroom, 1-bath apartment $850-$1,250
utilities. For instance, the “affordable” rent for a two
2-bedroom, 1 bath apartment $1,095-$1,475
person household with an annual income of $40,000
2-bedroom, 2 bath “luxury” apartment $1,395-$1,550 would be $1,000 a month (including utilities). That
3-bedroom, 2 bath house $1,700-$1,800 household would be defined as “overpaying” for
4-bedroom, 3 bath “luxury” house $2,800 housing if their monthly rent exceeded $1,000.
Source: Craigslist “Housing for Rent” ads for San
Leandro, week of August 4, 2008 Table 3-10 provides 2000 Census data on overpayment
in San Leandro. The table indicates that 32.2 percent of
all San Leandro households paid more than 30 percent
the city were being rented at less than $500 a month in
of their income on housing in 1999, with renters more
2000).
heavily impacted than homeowners. More than 38 per-
There was a significant increase in the median rent cent of all renters paid in excess of 30 percent of their
between 1999 and 2001. In December 2001, the incomes on housing. The percentage of “overpaying”
median rent for vacant advertised units was $1,250. renters remained about the same from 1990 to 1999,
The median for apartments was $1,095, while the while the percentage of “overpaying” owners increased
median for single family homes was $1,495. Rents from 22 to 28 percent. However, the incidence of over-
declined by 10 percent in 2002 and remained relatively payment is still lower in San Leandro than in Alameda
flat through 2003 and 2004. A slight increase occurred County as a whole, where 40.5 percent of renters and
in 2005 and 2006 and by 2007, rents were back to their 30.6 percent of owners were overpaying in 1999.
2001 levels. Between 2007 and 2008, rents increased
Current data from the American Community Survey
by approximately 5 percent.
(ACS) indicates that the percentage of overpaying
Based on a survey of 38 apartments and 14 houses renters in San Leandro was 50 percent in 2006, although
advertised for rent in San Leandro in August 2008, the margin of error for this statistic is high. The ACS
the median rent is now $1,272. The median rent for also reported that 36 percent of San Leandro hom-
a house is $1,725, while the median for apartments eowners paid more than 30 percent of their incomes on
is $1,185. Table 3-9 summarizes typical rents in San housing in 2006—when homeowners without mortgages
Leandro in August 2008. are factored out, the percentage rises to 50.9 percent.
TABLE 3-10: OVERPAYMENT FOR HOUSING IN SAN LEANDRO, 1999
Percentage of Percent Estimated Percent
Income Spent on of Total 2006 % of of Total Estimated 2006
Housing Costs Renters (1999) Total (ACS) Owners (1999) % of Total (ACS)
Less than 25 percent 5,422 45.1% 38.9% 9,925 60.6% 48.3%
25-29 percent 1,492 12.4% 8.5% 1,720 10.5% 10.9%
30-34 percent 1,121 9.3% 10.0% 1,276 7.8% 8.6%
35 percent or more 3,478 29.0% 37.5% 3,273 20.0% 31.6%
Not computed 485 4.0% 3.8% 179 1.1% 0.6%
Total 11,988 100.0% 100.0% 16,373 100.0% 100.0%
Source: 2000 Census, American Community Survey (ACS) - 2006
SAN LEANDRO HOUSING ELEMENT APRIL 2010 3-11NE EDS ASSESSMENT
The high percentage is not surprising, given that 2006 costs, they may still have a difficult time with home
was the peak of the housing market. According to the repair and maintenance expenses, as well as property
ACS, the median monthly housing cost for homeowners taxes and utility bills.
with mortgages was $2,154.
Measuring the “Affordability Gap” for Rent-
Lower income households are more likely to overpay ers and Owners in San Leandro
for housing than other households. In San Leandro, this Table 3-11 indicates the upper limit of affordable
is particularly true for lower-income renters. In 1999, monthly housing payments for households of one
about 80 percent of the 5,047 renter households with to eight persons in Alameda County in 2001 using
incomes less than $35,000 paid more than 30 percent of HUD’s definitions. “Affordable” housing for a family
their incomes on housing. The American Community of four earning $66,250 a year would be $1,656 a
Survey suggests that this percentage rose to 85 percent month. Assuming $100 to $150 a month for utilities,
by 2006, although there are fewer renters earning less this would equate to a monthly rent payment of about
than $35,000 than there were six years earlier. $1,500. Comparing Table 3-9 and Table 3-11 indicates
The incidence of overpayment is smaller among lower- a significant gap between “affordable” rents and
income homeowners than it is among renters, but it “market” rents for lower-income households in San
is still substantial. In 1999, 45 percent of the city’s Leandro. The following examples indicate the depth of
homeowners with incomes of less than $35,000 paid this gap:
30 percent or more of their incomes on housing. Even • A single mother in San Leandro with an income of
in the $35,000 to $50,000 income bracket, 48 percent $28,000 a year would need to spend 55 percent of her
of the homeowners spent more than 30 percent of income to live in a typical two-bedroom apartment
their incomes on housing. The number of overpaying or 45 percent of her income to live in a typical one-
households grew dramatically between 1999 and 2006. bedroom apartment.
The ACS data indicates that by 2006, 55 percent of all
homeowners earning less than $50,000 were paying • A family of four (including two working parents and
more than 30 percent of their incomes on housing. two school aged children) with a combined income
of $52,000 a year would need to spend 40 percent
Despite the run-up in housing costs, there are still a of their income to rent a typical 3-bedroom, 2-bath
substantial number of San Leandro homeowners with house in San Leandro.
low housing costs. In 2000, more than half of the
• A senior citizen on a fixed income of $14,000 a year
households in the $20,000-$35,000 income bracket
would need to spend 60 percent of his income to live
spent less than 20 percent of their annual incomes on
in a typical studio apartment.
housing. These are primarily elderly residents living in
homes with mortgages that have been paid off. In fact, Comparing 2008 to 2001 (when rent data for the
31 percent of San Leandro‘s homeowners had paid last Housing Element was collected) leads to some
their mortgage off completely in 1999, compared to 20 interesting conclusions. On the positive side, income
percent in Alameda County as a whole. Although these has increased faster than rent, making San Leandro
households are not burdened by high monthly housing
TABLE 3-11: MAXIMUM AFFORDABLE MONTHLY HOUSING COST IN ALAMEDA COUNTY, 2009 (INCLUDING UTILITIES)
Number of Persons in Household
1 2 3 4 5 6 7 8
Extremely Low $469 $536 $603 $670 $724 $778 $831 $885
Very Low $781 $893 $1,005 $1,116 $1,205 $1,295 $1,384 $1,474
Low $1,159 $1,325 $1,490 $1,656 $1,789 $1,921 $2,054 $2,186
Moderate $1,875 $2,143 $2,411 $2,679 $2,893 $3,108 $3,321 $3,536
Source: Barry J Miller, AICP 2009
3-12 SAN LEANDRO HOUSING ELEMENT APRIL 2010N EEDS A S S E S S ME N T
somewhat more affordable today than it was seven rate mortgages made to higher risk borrowers. The
years ago. While median income increased by over long-term trend of rising home prices encouraged
20 percent during this period, median rent increased borrowers to assume such mortgages, believing they
by just 2 percent. Using HUD standards, the market- would gain equity in appreciating properties and
rate rent for a two-bedroom apartment (around refinance at more favorable rates later. Refinancing
$1,200-$1,300) would be affordable to a two-person became more difficult once prices started to drop,
low-income household, and the market-rate rent for a and repayment became more difficult when the initial
one-bedroom apartment (around $900-$1100) would period of low interest rates ended.
be affordable to a three-person very low income
household (although that household could then be In the Bay Area, the rise in foreclosures has led to eco-
overcrowded). nomic hardship for many households. It has resulted in
a slow down in housing construction, a loss of equity
On the negative side, the city continues to be unafford- for homeowners, and the displacement of a significant
able to renters earning less than 50 percent of the area number of renters living in properties owned by third
median income (very low and extremely low income parties. In the past two years, sales volumes have
households). In a recent survey of properties advertised dropped, financing has become more difficult to obtain,
for rent on a popular real estate website (craigslist.org), and the inventory of unsold homes has increased.
there were no one-bedroom apartments renting for less The state and federal governments are taking steps
than $850 a month, and there were no two-bedroom to address the crisis, including mortgage assistance
apartments renting for less than $1,095 a month. programs, reducing loan principals, and applying new
Moreover, the supply of large rental units in the city rules to mortgage lenders.
remains small. Of the 52 properties listed in the survey
above, only nine were three bedrooms or more. The Despite falling property values since 2006, San
median rent for a three-bedroom house was $1,800, Leandro has weathered the sub-prime crisis better than
which is not affordable to a four- or even five-person many other cities in the East Bay. Sales volumes in the
low-income household. city during the highest-risk years (2005-2006) were
comparatively low, in part because there were no large
For prospective homeowners, the situation has gotten for-sale developments constructed in the city during
worse since 2001—although the city is significantly these years. The last major (100+-unit) development in
more affordable today than it was at the peak of the the city was Cherrywood, and it was largely completed
market in 2006. In today’s market, most moderate- and sold by 2004. The crisis has had a more significant
income households could not afford the median-priced impact on cities such as Tracy and Antioch, where
San Leandro home. Assuming a 10 percent downpay- thousands of new units came on line at high prices
ment, a 6.5 percent interest rate, and a 30-year term, during 2005 and 2006.
the monthly payment on such a home would be $2,218.
Once property taxes and homeowners insurance are Nonetheless, the city has seen a dramatic rise in
added, the monthly payment increases to over $2,700. foreclosures since 2006. In August 2008, the website
Such a payment would only be considered “affordable” foreclosureradar.com reported 719 distressed properties
to a household with an annual income of $97,200 or in San Leandro, including 117 homes being auctioned,
more. This payment would be beyond the means of most 238 bank-owned homes, and 364 homes in “pre-
moderate-income households with four persons or less. foreclosure.” Although this inventory includes homes
in unincorporated Ashland with San Leandro addresses,
Subprime Mortgage Crisis in San Leandro it still represents a significant percentage of San
Leandro’s owner-occupied housing stock. Based on
The number of foreclosures in the United States tripled
web-based real estate data, it is estimated that between
between the first quarter of 2007 and the second quarter
2 and 3 percent of San Leandro’s owner-occupied units
of 2008. Several factors contributed to the problem,
are in foreclosure or pre-foreclosure at this time. (See
including declining home values in many markets, and
Chapter 5, “Constraints,” for additional information on
a growing number of sub-prime loans and adjustable
foreclosures in San Leandro.)
SAN LEANDRO HOUSING ELEMENT APRIL 2010 3-13NE EDS ASSESSMENT
Conclusions retail trade, while another 4.8 percent were employed
in wholesale trade. There were more than 5,400
The housing market in San Leandro has seen both
residents—or 14.3 percent of the city’s labor force—
positive and negative changes in the last seven years.
employed in manufacturing. About 6 percent of the
For renters, the city is somewhat more affordable today
city’s residents were employed in construction and 8
than it was seven years ago, although the inventory of
percent were employed in transportation and ware-
rental units remains very tight—especially for large
housing. The remaining 5 percent of the city’s residents
families. For owners, the city became increasingly
were employed in public administration (including
unaffordable between 2001 and 2006, shutting more
schools and City government).
moderate-income families out of the for-sale market.
Affordability has improved dramatically since 2006 The 2006 American Community Survey does not
as prices have come down, but with a downside in the include published data on the number of residents in
form of lost equity and an increased rate of foreclosure each occupation due to the small sample size for San
for buyers who entered the market after 2004. Leandro. However, it did report a 2006 estimated
median wage of $44,255 for the city’s employed
residents.
employment
When the last Housing Element was prepared in
Employment in a community can affect the demand
2001-2002, the unemployment rate in the city was
for housing and the type of housing that is needed.
about 5 percent. This was a sharp increase from mid-
In 2000, there were about 38,000 employed residents
2000 (before the dot-com “crash”), when it was just
in San Leandro. About half of the city’s residents
2.6 percent. After 2002, unemployment in the city
were employed in service industries, including 16.5
continued to rise, reaching over 7 percent in 2003.
percent in health, education, and social services; 10.8
The rate declined through 2006, when it fell below 5
percent in professional services; 5 percent in food and
percent. Since 2007, the unemployment rate has risen
hospitality services; and 16.5 percent in finance, insur-
slightly again, reaching 6.1 percent in June 2008. Chart
ance, real estate, information, and other services. Some
3-4 shows unemployment in San Leandro and Alameda
11.6 percent of the city’s residents were employed in
CHART 3-4: UNEMPLOYMENT IN SAN LEANDRO AND ALAMEDA COUNTY, 2002-2008
2003 2004 2005 2006 2007 2008
8
7
Unemployment Rate
6
5
4
3
2
1
San Leandro Alameda County
3-14 SAN LEANDRO HOUSING ELEMENT APRIL 2010N EEDS A S S E S S ME N T
County between 2002 and 2008. More recent data
from California EDD shows that unemployment rose
dramatically in 2008-2009, reaching 10.6 percent in
San Leandro in May 2009.
Periods of rising unemployment can translate to
economic hardship for households and an increased
risk of foreclosure, overcrowding, and homelessness.
While the city’s unemployment rate is below the
state average, a significant number of households are
affected by job and income loss in any given year.
The narrative above focuses on the characteristics of
San Leandro’s labor force. Another aspect of employ-
ment relates to the actual jobs located within the city.
The Association of Bay Area Governments Projections
2007 indicates that there were 44,370 jobs in San
Leandro in 2000 and 41,650 jobs in 2005. The loss of
2,700 jobs in the city over five years is largely attribut-
able to the downturn in the tech and e-commerce
sectors, as well as the continued loss of manufacturing
jobs. San Leandro is expected to recover some of these in San Leandro. This is considered an optimal balance
jobs by 2010, when employment is projected to be by Bay Area standards. However, many of the jobs in
43,540. Interpolating between 2005 and 2010, employ- the city are not filled by San Leandro residents. Many
ment in 2008 is estimated at 42,780. low wage jobs, in particular, are filled by workers who
commute long distances from communities as far away
San Leandro continues to have a relatively large
as San Joaquin and Stanislaus Counties.
industrial base, with nearly 8,000 manufacturing jobs in
2002. Among the city’s major industries are food manu- At the same time, local employees are competing for
facturing (1,650 jobs) and fabricated metal products housing in San Leandro with persons working in higher
(1,255 jobs). The city also has about 5,500 wholesale priced housing markets such as San Jose and San
trade jobs and 1,000 repair and maintenance jobs. Many Francisco. Market-rate housing on the Peninsula and in
of the city’s jobs are in relatively low wage sectors. the South Bay is even more expensive than it is in San
For example, San Leandro has nearly 6,000 retail sales Leandro, causing demand to spill into the East Bay and
jobs and 2,400 accommodation and food service jobs. other more affordable areas.
However, it also supports a growing number of jobs in
higher wage sectors, such as information technology The most commonly used indicator of jobs-housing
(1,435 jobs); professional, scientific and technical ser- balance in a community is the ratio of jobs to house-
vices (1,460 jobs), and health care (3,300 jobs). holds. In 2000, there were 1.52 jobs per household in
the nine-county Bay Area compared to 1.45 jobs per
The ratio between jobs and households in a city is household in San Leandro. Between 2000 and 2008,
an important indicator of housing needs. Ideally, the Bay Area experienced a net loss of jobs, even as it
the number of jobs and employed residents should gained more than 180,000 households. By 2008, there
be balanced, since this reduces commute costs and were roughly 1.36 jobs per household in the region.
provides more money for housing and other expenses. In San Leandro, the ratio also fell to 1.36 jobs per
Of course, there are many other benefits—better air household.* Although San Leandro lost jobs between
quality, less congestion, and greater productivity as
fewer hours are spent on the highways. In 2008, there
*Figures are based on interpolation of ABAG Projections 2007
were about 39,000 employed residents and 43,000 jobs
data for 2005 and 2010.
SAN LEANDRO HOUSING ELEMENT APRIL 2010 3-15NE EDS ASSESSMENT
TABLE 3-12: EMPLOYMENT TRENDS, 2000-2015
San Leandro Alameda County
2008 – 2008 –
2008 2015 % 2008 2015 %
2000 (est)* 2015 increase 2000 (est)* 2015 increase
Agriculture/Mining 130 120 130 8.3% 1,940 1,770 1,940 9.6%
Manufacturing/ 15,380 13,600 14,270 4.9% 194,120 176,590 188,770 6.9%
Wholesale/Transportation
Retail 7,560 7,350 8,040 9.4% 83,900 84,710 94,960 12.1%
Financial/Professional 6,530 6,610 7,200 8.9% 144,870 153,140 170,620 11.4%
Services
Health/Ed/Recreation 9,760 10,130 11,250 11.1% 218,420 233,830 263,240 12.6%
Other 5,010 4,970 5,300 6.7% 106,910 110,980 121,130 9.1%
Total Jobs 44,370 42,780 46,190 8.0% 750,160 761,020 840,660 10.5%
Ratio of Jobs:Households 1.45 1.36 1.43 -- 1.43 1.37 1.43 --
Ratio of Jobs:Employed 1.14 1.10 1.10 -- -- -- -- --
Residents
*2008 figures are interpolated by taking 60 percent of the difference between 2005 and 2010 from ABAG’s data. 2008 figures probably
exceed actual employment, due to economic downturn.
Source: ABAG, Projections 2007. Barry Miller, AICP 2008
2000 and 2005, it actually fared better than the region Creating a true balance between jobs and housing will
as a whole. require two courses of action—first, producing housing
at a rate that keeps pace with projected job growth, and
Looking forward, ABAG projects that San Leandro second, producing more rental housing and affordable
will add 2,650 jobs between 2010 and 2015 while ownership housing (including condominiums) so that
adding 550 households. This will cause the jobs- those who work in the city can afford to live in the city.
housing balance to shift more heavily toward
employment, potentially creating a situation where
more workers commute in than commute out.
special housing needs
Maintaining the existing jobs-housing balance would
require producing more housing during this period. As Several types of households have been identified by
long as job growth outpaces housing growth, vacancy the state of California as having special housing needs.
rates in the city are likely to remain low. Such households have a harder time than most finding
suitable housing within the community. Special needs
Table 3-12 indicates historic and projected employment populations in the state include seniors, persons with
in San Leandro and Alameda County between 2000 disabilities, large low-income families, single mothers,
and 2015. farmworkers, extremely low income households, and
the homeless. Although the 2000 Census is now eight
Conclusions years old, it still provides an indication of the presence
San Leandro has a favorable jobs-housing balance. of such groups within San Leandro. Additional data
However, like many Bay Area communities, it has a from the American Community Survey and other local
housing stock that is unaffordable to many of those sources is provided below.
who work in the community—leading to long com-
mutes for many local workers. While the city offers Seniors
many good entry-level and mid-level employment San Leandro has historically had a higher percentage
opportunities, these jobs still do not pay the wages of seniors than Alameda County as a whole. In 2000,
necessary to afford the median priced home in the city. the percentage of residents over 65 in the city was
3-16 SAN LEANDRO HOUSING ELEMENT APRIL 2010N EEDS A S S E S S ME N T
60 percent higher than the countywide average. The that a single parent can work. For those single parents
2000 Census reported that 57 percent of San Leandro’s who work full-time, child care expenses may consume
seniors had incomes of $35,000 or less, while 8 percent a large share of take home pay. Both of these factors
had incomes of $100,000 or more. Some 68 percent of limit the amount of disposable income available for
San Leandro’s senior renters spent more than 30 per- housing.
cent of their annual incomes on housing. More recent
(2006) data from the American Community Survey In 2000, there were over 1,800 single mothers with
suggests that about 57 percent of San Leandro’s seniors children under 18 in San Leandro, representing 6 per-
still have incomes below $35,000, despite the rise in cent of the city’s households. By 2006, the American
the consumer price index. Community Survey estimated that there were 2,500
single mother households in San Leandro with children
Many of the city’s senior households find it difficult under 18, although this statistic has a very high margin
to make monthly mortgage or rent payments on fixed of error. Nearly half of these households were esti-
or limited incomes. Others may find the day-to-day mated as having at least one child under 6 years old.
costs of home maintenance and improvements to be
prohibitively expensive, or may be cost-burdened by Census data indicates that single mother households
property taxes. are more likely to live below the poverty line than
other households with children. There were 350 single
In 2000, nearly 3,400 of the city’s 12,700 senior resi- mother households below the poverty line in 1999,
dents lived alone. Although the American Community representing 40 percent of all San Leandro households
Survey estimates that this number had declined to in poverty. The median income for single mothers
about 3,000 residents by 2006, it is still quite large. The was $34,606, compared to $60,266 for all families.
statistics suggest a possible demand for shared housing These families would benefit not only from affordable
programs in the city, creating a potential source of housing, but also from affordable child care and job
income for lower-income senior homeowners as well training and career development programs.
as a housing resource for lower- income senior renters.
Large Families
In 2000, 2.2 percent of San Leandro’s residents
For the past 45 years, average family size in San
(1,747 people) were over 85, the highest percentage
Leandro has been smaller than the County as a whole.
in Alameda County. There were more than 5,000 resi-
However, the number of “large” families (five persons
dents between the ages of 75 and 84. The demand for
or more) is on the rise. Large families are more likely
affordable assisted living and congregate care facilities
to experience overcrowding and may have less dispos-
remains high. In 2000, the Census reported that 471
able income available for housing due to the larger
San Leandro residents lived in nursing homes. As the
number of dependents and other household expenses.
baby boom generation enters their retirement years
This is particularly true for lower-income renters. As
(particularly during the period from 2010-2025), the
noted earlier, most of the city’s rental housing stock
demand for active senior housing in the city is likely to
consists of one and two-bedroom apartments and is not
surge. Condominiums, in-law units, and amenity-rich
well suited for large families.
multi-family apartments for those “downsizing” from
single family homes will be in high-demand. There will In 1990, there were 2,216 households in San Leandro
continue to be a high demand for skilled nursing facili- with five or more persons, representing about 7.6
ties as life expectancies increase and the population percent of all households in the city. By 2000, there
ages. were 3,527 households with five or more persons, a 60
percent increase. Of these households, 1,551 contained
Single Parent Households six persons or more—this was more than double the
Single parent households, particularly single female- number in 1990. About 32 percent of the city’s large
headed households, tend to have a higher need for family households were renters, many in two-bedroom
affordable housing than the general population. Child units.
care responsibilities may limit the number of hours
SAN LEANDRO HOUSING ELEMENT APRIL 2010 3-17NE EDS ASSESSMENT
TABLE 3-13: PERSONS WITH DISABILITIES, 2000 AND 2006*
All Persons 16 and Over Working Age (16-64)
2000 2006 ACS 2000 2006 ACS %
Census % of total % of total Census % of total of total
Total Persons 62,954 -- -- 50,818 -- --
Persons with any disability 15,832 25.1% 12.5% 10,916 21.5%
Types of disabilities reported:**
Sensory 2,738 4.3% 3.7% 883 1.7% 1.6%
Physical 6,103 9.7% 9.0% 3,007 5.9% 5.2%
Mental 2,831 4.5% 3.9% 1,681 3.3% 2.7%
Self-care 1,851 2.9% 3.6% 835 1.6% 1.4%
Go-Outside-Home 7,102 11.3% 3.5% 4,566 8.9% 1.1%
* Table includes civilian, non-institutionalized population only; disabilities and practical limitations include non-temporary physical
and mental health conditions.
** Some persons reported more than one disability, so these figures should not be aggregated.
Source: 2000 Census, 2006 American Community Survey
According to the American Community Survey, 11.7 elderly persons and can result in financial hardship for
percent of the city’s households had five or more families who bear the cost of support.
persons in 2006, and half of these households had six
or more persons. However, the ACS reported that only In 2008, the American Community Survey published
20 percent of these households were renters. If the more recent data on the city’s disabled population (rep-
data is correct, it suggests that a growing share of San resenting conditions as of 2006). This data is somewhat
Leandro’s large families are buying homes rather than inconsistent with the 2000 Census, as it indicates that
renting apartments. Some of the change may be attrib- only 12.5 percent of the city’s residents over 16 have
utable to the growing number of extended families a disability. It also indicates a substantially smaller
(particularly families from Asian and Latin American percentage of residents with a “go outside of home”
countries with grandparents, parents, and children in disability. The drop from 2000 is probably due to ACS
the same residence) buying homes in the city. sampling methods rather than a material change in
demographics. Data from the ACS is included in Table
Persons with Disabilities 3-13 for comparison to the 2000 Census.
Disabled persons may require housing with specific San Leandro has a number of housing projects specifi-
physical attributes, such as wheelchair ramps, elevators, cally developed to meet the needs of persons with
and proximity to transit and social services. Many dis- disabilities. Fuller Lodge (2141 Bancroft) is a 26-unit
abled households have limited income for housing, either rental housing complex for the developmentally
because they are unable to work or because they have sig- disabled. A second phase (Fuller Gardens) with 16
nificant health and medical expenses. Table 3-13 presents additional units was added in 2004 at 2390 East
census data on the disabled population in San Leandro. 14th Street. Luella Fuller Group Home (342 West
Joaquin) is a 6-person group home for persons with
In 2000, about one in every four San Leandro residents
developmental disabilities. The city is also home to a
over 16 indicated a disability of some kind on their
number of service providers meeting the needs of the
census forms. More than 7,000 San Leandrans indicated
disabled community, including the Deaf Counseling
that their disability impaired them from going outside
and Advocacy Referral Agency (DCARA). Support
their homes. About 30 percent of the residents reporting
services, including housing services and independent
a disability were over 65. Some of these residents lived
living workshops, are also provided through the Center
in skilled nursing and residential care facilities. The cost
for Independent Living in Berkeley, and other advo-
of skilled nursing is beyond the means of many disabled
cacy groups for the disabled throughout the East Bay.
3-18 SAN LEANDRO HOUSING ELEMENT APRIL 2010You can also read