Leeds City Region Housing Market Areas - Newcastle University
←
→
Page content transcription
If your browser does not render page correctly, please read the page content below

Leeds City Region Housing Market Areas

Prepared for:
West Yorkshire Combined Authority

October 2016

Mike Coombes, David Bradley and
Colin Wymer (together with Nathaniel
Lichfield & Partners, who undertook
the consultations)
Angel
a Abbott, Liz Corry, Wendy Holland, W
RR2016/11
CURDS (Centre for Urban & Regional Development Studies)
                                                        www.ncl.ac.uk/curds.

                                      Leeds City Region Housing Market Areas

                                                  Final Report July 2016

Contents

           Executive Summary                                                             2
  1        Overview                                                                      5
  2        Methods                                                                       6
  3        Data                                                                          8
  4        Visualisation                                                                 9
  5        NHPAU                                                                        14
  6        Results                                                                      19
  7        Synthesis                                                                    32
  8        Consultation                                                                 35
  9        Conclusions                                                                  40
              Annex 1 Consultation with Local Planning Authorities                      43
              Annex 2 Consultation with Registered Providers                            52
              Annex 3 Consultation with Developers & Agents                             60
              Annex 4 Key to place name abbreviations used on the conventional maps     86
              Annex 5 Glossary and acknowledgements, plus end notes                     87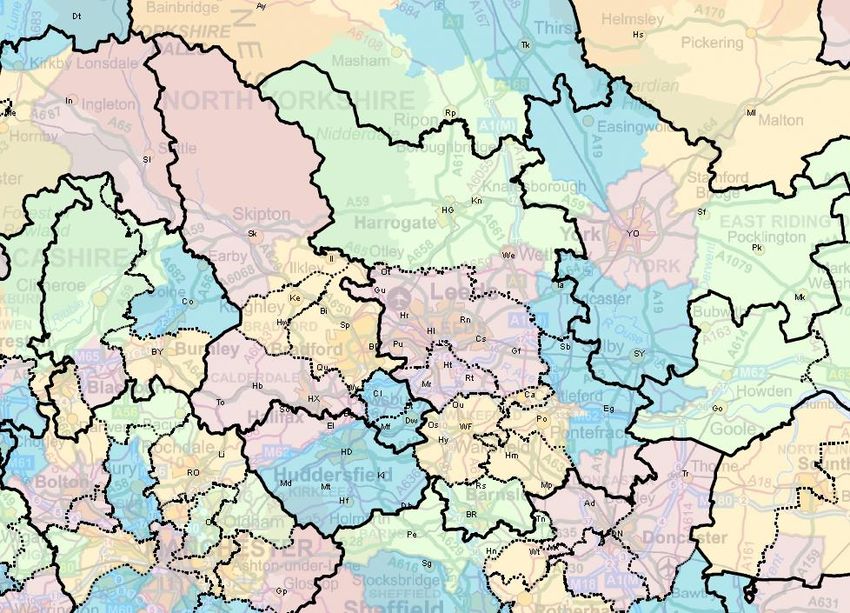
2
Executive Summary
ES1 This is the draft Final Report from a research study commissioned by the Leeds City Region Enterprise Partnership and the West Yorkshire
Combined Authority. The study has been undertaken by the Centre for Urban and Regional Development Studies (CURDS), in conjunction with
Nathaniel Litchfield & Partners. The core task for the study was to undertake new analyses defining Housing Market Areas (HMAs) with data from the
2011 Census, updating the National Housing & Planning Advisory Unit (NHPAU) HMA definitions produced by CURDS using the 2001 Census.
ES2 National planning guidance requires local planning authorities to understand the geography of the housing market, and imposes a Duty to Co-operate
where the HMAs span several Plan boundaries and so raise strategic issues. Additional momentum has been given to the study by the March 2016
report of the Local Plan Expert Group which recommended that the NHPAU HMAs should be updated with data from the 2011 Census.
ES3 CURDS methods which defined NHPAU HMAs gained broad ‘buy-in’ at a workshop with stakeholders. After the analyses were completed the results
were summarised in a briefing document which provided the basis for a comprehensive consultation stage of the study. Annexes to this report show
the coverage of the consultation, from three different interest groups as well as all the local planning authorities, and also summarise the responses.
ES4 The results of updating the ‘best practice’ NHPAU HMA definitions indicate a reassuringly gradual evolution of the boundaries produced for NHPAU,
rather than a radical change which would not only be implausible but also unhelpful, given the use of NHPAU HMAs in the current planning evidence
bases of local authorities (LAs). It is equally important that a clear majority of the varied respondents within the study consultation process boundaries
saw the new 2011-based HMA boundaries as a recognisable depiction of housing market realities.
ES5 The following points cover the key implications of the findings from the study in terms of the housing market geography of the Leeds City Region
(LCR), and in particular the major agreements or differences between the new results and the NHPAU HMAs.
2 Strategic HMAs cover the whole of W.Yorkshire as before, but the Leeds HMA ‘gains’ some areas from the one including Bradford
Leeds ‘loses’ the bulk of the Barnsley LA which had been in its NHPAU Strategic HMA, but it has ‘gained’ the northern part of Harrogate LA
York’s 2011-based Strategic HMA is larger than its NHPAU equivalent because it extends into Ryedale LA
Calderdale is a single Local HMA (it was split by NHPAU’s Strategic HMAs and therefore also by the Local HMAs which fit within them)
Bradford LA is always split into 3 Local HMAs, though with some variation in boundaries either side of Keighley
N.Kirklees is separate from Huddersfield in all the results except for the Strategic HMA; within this area, Local HMAs are very variable
Wakefield LA in all results except for the Strategic HMA is split into 4 Local HMAs
NHPAU’s Leeds Local HMAs north-south split is not replicated with the 2011 data analysis
ES6 The analyses included several variations on the method used to update the NHPAU HMAs, thereby providing a ‘sensitivity test’ of the main results.
More importantly still, synthesising the evidence in these different sets of results to reveal which boundaries are persistent has also identified which
LAs in the LCR tend to be in the same HMA: these are the LAs between which there is the most pressing need to deliver the Duty to Co-operate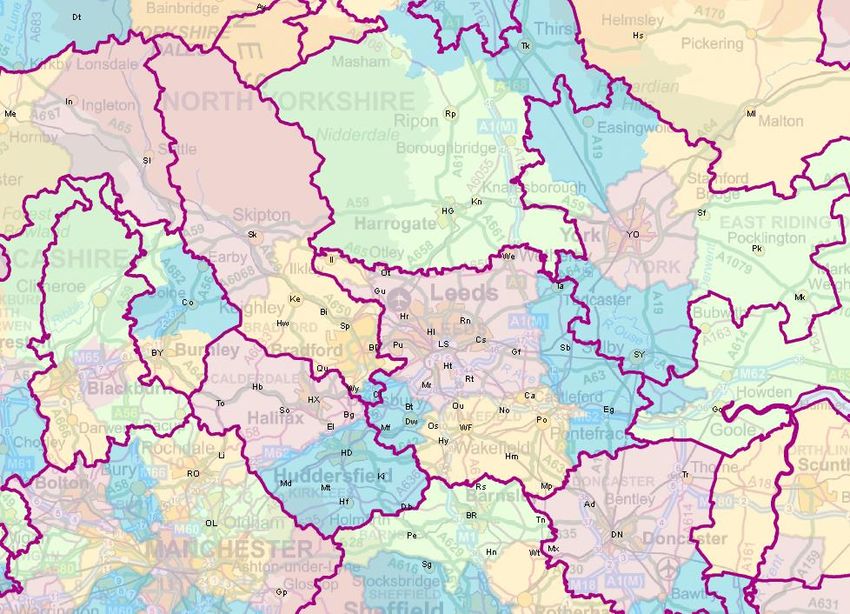
3

Map showing the synthesis of the main sets of 2011-based HMAs, indicating the strength of their evidence that pairs of adjacent areas are in different HMAs

NB: On this map, where the analysis found strong housing market links between two areas there is no boundary shown. Areas with some links are shown with a pecked
       or broken line to show a ‘permeable’ housing market boundary. Where clear housing market separation was evidenced by few housing market links between areas,
       a solid line is shown.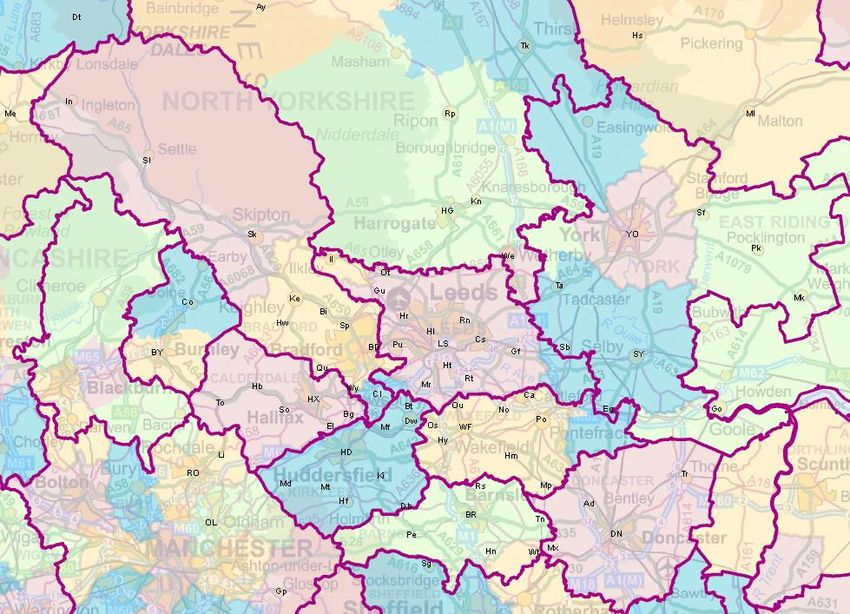
4
ES7 Where there is a more robust boundary between two areas, there is less urgency in the Duty to Co-operate. The following points summarise what this
synthesis suggests about the strength of the links across – or by contrast the impermeability of – the boundaries of LCR local planning authorities.
Most of the Pennines form an impermeable boundary (apart from areas in west Craven linking to the northern part of Lancashire)
York has stronger links to the more northerly N.Yorkshire LAs than does Harrogate; Craven has no strong links to these areas
Selby LA has no robust boundaries splitting it from HMAs centred on York and on Leeds (or to eastern Wakefield LA, when this is a separate HMA)
W.Yorkshire’s boundary with S.Yorkshire is almost impermeable (suggesting that the 2001 links with Barnsley had moderated by 2011)
Bradford has strong HMA links with Craven
Leeds’ northern boundary with Harrogate LA is less permeable; Wetherby’s allocation is volatile
Leeds:Bradford is a mostly impermeable boundary, but the links to Leeds have strengthened since 2001for the Wharfedale part of Bradford LA
Bradford:Calderdale is a more impermeable boundary than it was in 2001
Kirklees:Calderdale is a largely impermeable boundary
Kirklees:Bradford is a highly permeable boundary, especially in the area round Cleckheaton
Kirklees:Leeds is a permeable boundary, especially in the area round Batley
Kirklees:Wakefield is a mostly impermeable boundary, except in their similar involvement in the wider Strategic reach of Leeds
Leeds:Wakefield is a mostly impermeable boundary, except in relation to the wider Strategic reach of Leeds
ES8 The findings of the study will be a key component of the work being undertaken by LCR and will help guide future plan making and planning for
housing at a city region level. The study provides the most up-to-date possible evidence on the HMAs across and within LCR, and highlights the
spatial relationships where there are wider implications of future planning decisions. The study results should not change the current plan-making
process in LCR, but they provide contextual evidence of relevance for the updating of Local Plans.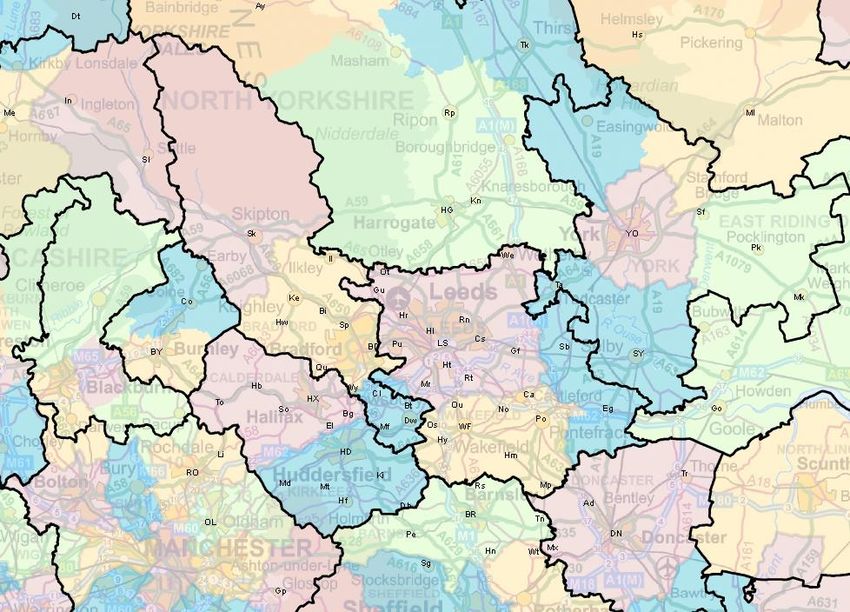
5

 1    Overview

1.1   This is the draft Final Report from a research study commissioned by the Leeds City Region Enterprise Partnership and the West Yorkshire
      Combined Authority. The study has been undertaken by the Centre for Urban and Regional Development Studies (CURDS), in conjunction with
      Nathaniel Litchfield & Partners.
1.2   The background to the study is the requirement in national planning policy for Development Plans to include evidence of an understanding of the
      geography of the housing market in the Plan area plus the Plan areas which are adjacent. This requirement is reinforced by the Duty to Co-operate
      where housing market areas (HMAs) cross Plan boundaries and so raise strategic issues. Additional momentum was given to the study by the
      March 2016 report of the Local Plan Expert Group (LPEG)i which has recommended the updating of the national study of housing market geography
      for the National Housing & Planning Advisory Unit (NHPAU): this study had in 2010 published HMAs defined with 2001 Census data by CURDS.
      The definition methods devised by CURDS sought to comprehensively implement the guidanceii from the Government on the definition of HMAs,
      which cites the relevance of both commuting and migration data, and also the ‘model’ provided by the definition of Travel-to-Work Areas (TTWAs).
1.3   The study was commissioned in autumn 2015 following the release of the relevant data from the 2011 Census. It has taken the form of a detailed
      quantitative analysis, followed by testing of the results through inputs from the city region and neighbouring local authorities (LAs), plus consultation
      with a wider stakeholder group. The resulting output can sit alongside the local evidence which individual authorities hold, and will inform future plan
      making in the city region. Outputs from the study will also inform emerging city region wide strategies and policy frameworks.
1.4   Leeds City Region (LCR) encompasses all the West Yorkshire LAs, plus the 3 adjacent North Yorkshire LAs, as well as Barnsley Metropolitan LA
      and also York Unitary LA. The analyses use 2011 Census data to update the sets of HMA CURDS defined for NHPAU with data from the 2001 Census.
      It also synthesizes results from a range of analyses to identify where HMAs persistently span across LA boundaries due to substantial ‘cross-border’
      commuting and migration flows. It is these situations within the region where housing pressure is most likely to ‘leak’ across the boundaries of LAs,
      and so the Duty to Co-operate is most relevant.
6

 2    Methods

                                                                                                                                                         iii
2.1   The methods of analysis here use the innovative CURDS software which had defined the HMAs in the research for the now-defunct NHPAU .
      Adoption of the CURDS approach to defining HMAs in this study is based on the fact that the NHPAU HMAs are widely seen as the ‘state-of-the-art’
      HMA definitions in the UK. This approach to defining HMAs has been endorsed by the LPEG recommendations to Government which identifies the
      need to update the NHPAU analysis to identify a consistent set of HMAs across all of England, thereby providing the spatial framework within which
      LAs would be required to work in undertaking the objective assessment of housing need. LPEG’s recommendations also assert that where HMAs
      span across LA boundaries there should be Duty-to-Co-operate discussions on how and where housing needs will be met within that wider HMA.
2.2   The basic form of analysis used here was developed by CURDS in defining TTWAs, which are the official British definition of local labour market areas
      (nb. the method is currently being promoted by Eurostat as the labour market area definition method for the whole of Europe). Some further method
      developments in the NHPAU study made possible the first nationally consistent analyses of both commuting and migration flows at a small area scale
      (which in this case means using LA wards as ‘building block areas’). The procedure involves a huge number of small area groupings, building up a final
      map that is close to being optimal in maximising the number of areas which meet the set criteria.
2.3   The criteria for the analyses require the defined HMAs to meet set levels of population size and the self-containment of flows (whether these flows are
      of commuting or migration). There is also a limited trade-off between the two key requirements, so that large areas can be slightly less self-contained.
      It is important to note that the size and self-containment levels set for the analyses are not ‘given’ but have to be chosen, with the choice being made
      to ensure that the results meet the needs of that analysis. The choice made here was to replicate the criteria used in the analyses for NHPAU, so that
      the basic results represent an updating of those results to reflect the new data from the 2011 Census. Some additional analyses were also carried out,
      so that a synthesis of the different results can indicate which HMA boundaries are ‘sensitive’ to one particular set of criteria, and which are a recurring
      feature across many sets of results. If two adjacent Local Planning Authorities (LPAs) are found by numerous different analyses to be within the same HMA
      then there will be a strong case for them to work together under the rubric of the Duty to Co-operate. This analysis strategy was presented to stake-holders
      at an early stage of the study and agreed to be the appropriate approach here.
2.4   The study applied three alternative versions of the CURDS method of analysis which utilises evidence from both commuting and migration datasets.
      The underlying strategy here is to repeat the analyses carried out for NHPAU, but using recently released Census 2011 flow data (nb. the next section
      of this Report outlines the limitations to this ‘replication’ due to data availability). The three alternative analysis are listed below and then shown in the
      same sequence (left-to-right) in the flow chart which follows (Figure 1).
      >      Strategic HMAs are defined based on commuting flows, and then within these a set of Local HMAs is identified using migration flows if
             sufficiently localised (ie. self-contained) migration patterns exist within a Strategic HMAs
      >      Single-tier HMAs are defined by first analysing commuting flows; these local labour market areas are the starting point in analysing migration
             flows and if they are not sufficiently self-contained they are split up and their constituent wards re-allocated to create the Single-tier HMAs.
      >      An alternative way to create Single-tier HMAs substitutes TTWAs for the analysis of commuting flows (because they are based on the analysis
             of commuting flows) and then groups these – without any dismembering – if they are not sufficiently in terms of self-contained migration flows.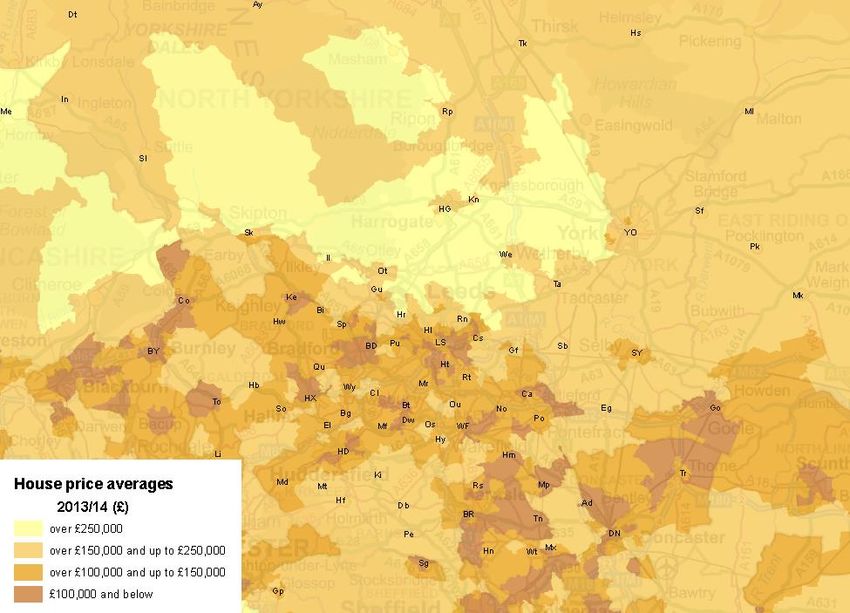
7

2.5      The first two approaches are those reported at the site www.ncl.ac.uk/curds/research/defining/NHPAU.htm, the third approach was an option reviewed
         in the research for NHPAU but not used in its published results (it is used here to provide further sensitivity testing of the results of the main methods).
         It should be noted that in the NHPAU research there was a subsequent step which involved a ‘best-fit’ to whole LAs of some of the results; that step
         has not been replicated here, and so the new results are compared to the NHPAU boundaries prior to any best-fit (ie. the ones still at the ward scale).
         The research for NHPAU also experimented with including house price analyses in the definition of HMAs, but this extra step only had an effect on the
         results in a few remote rural areas such as north Devon and so was not considered to be relevant to general purpose definitions.

 Figure 1:      Flow chart of the three methods used to define alternative sets of HMAs

             2-tier HMAs                                                      Single-tier HMAs

                  ↓                                             ↓                                            ↓
  analyse commuting with 77.5%                  analyse commuting with 72.5%                      best-fit 2011 wards into
            MINs-c:                                     MINs-c: step 1                             2011TTWAs, creating
        Upper tier HMAs                                                                                ‘2011TTWA’s

                  ↓                                             ↓                                            ↓
      50% migration MINs-c areas                  55% migration MINs-c areas                      55% migration MINs-c
        within upper tier areas:                   starting with step 1 areas:                       areas between
           Lower tier HMAs                              Single-tier HMAs                              '2011TTWA's:
                                                                                              Alternative Single-tier HMAs

  within here means each upper                   starting with here means the                    between here means the
     tier is treated as a separate              step 1 areas are input as whole              '2001TTWAs' are input as if they
 analysis: one consequence can                      proto HMAs: they can be                     were zones: they cannot be
 be that the whole upper tier area              disaggregated and their zones                 disaggregated so if any fail the
 fails the migration % MINs-c, so                  re- allocated if they fail the            migration % MINs-c they have to
  it is necessary to set a lower %                     migration % MINs-c                           be grouped whole

[nb. the references to “% MIN s-c” simplify the process because there are in fact four criteria in the algorithm, however the minimum self-containment level
tends to be the most important in determining the results]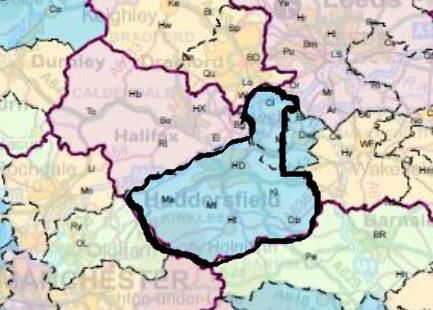
8

3     Data

3.1   The implementation of these analyses of 2001 data depended on algorithms CURDS had developed, so the software was available for this research
      usind data from the Census 2011. However the relevant datasets for 2011 are not identical to those from 2001. It is not knowable whether these data
      differences alone materially alter the results; what has been done here is to get a ‘feel’ of this sensitivity is to see what how far the results from each
      type of analysis change depending on the decision over the age of migrants in the analyses. The following is a list of the identified changes between
      the migration and commuting flow ward-level datasets from the two Censuses.
       >     There have been changes to ward boundaries in some areas.
       >     The commuting dataset for 2011 is limited to England & Wales whereas the analyses for NHPAU covered the whole of Britain (but any effects
             of this limitation will be localised to areas near Scotland, and so are very unlikely to have a significant impact on the results reported here ).
       >     The commuting dataset for 2011 excludes those working at home and also those who use their home as their base to work from.
       >     Migration datasets for 2011 are person counts (cf. 2001’s dataset on Household Reference Persons which was used in the study for NHPAU).
       >     The analyses for NHPAU included some on specific tenure groups, but migration data for such analyses is unavailable from the 2011 Census.
       >     The migration analyses for NHPAU excluded people aged under 25: here the basic analyses are of all persons, with analyses excluding the
             under 25s provided as a sensitivity test on those results.
3.2   It should be recognised that that the 2011 data will reflect substantive changes to housing markets over the period since 200.In particular there has
      been strong growth in private renting, which is associated with longer distance migration, but any effect of this change on HMA boundaries may have
      been countered by the 2011 Census being taken in a recession, because that would have tended to reduce longer distance moves.
3.3   Where the new analyses produce a different HMA boundary to that which was part of the results produced from analysing 2001 data for the NHPAU,
      it is not possible to identify how far this is due to changes in data definitions and how far to changes to the strengths of commuting and migration
      flows in each direction between the areas concerned.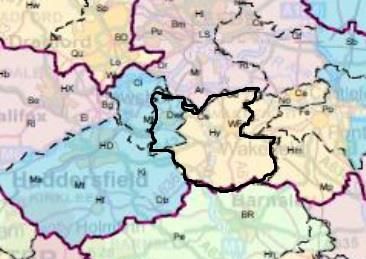
9

4     Visualisation

4.1   Numerous sets of HMA boundaries are presented here, because it is by collating different sets of boundaries that it is possible to identify which persist
      and which are specific to very few analysis. Adjacent areas whose level of interaction is low will tend to have a boundary between them in most maps.
      Minor differences of alignment are not important here: the aim is to identify which LAs are persistently linked by the HMA boundaries because this
      will be a reflection of strong commuting and/or migration flow patterns which will need to be considered through the Duty to Co-operate. It is to help
      identify such pairs of LAs that two types of map are presented below.
      >      There are conventional maps showing the HMAs as the top ‘layer’ in the familiar boundary form (nb.the boundaries are ‘pecked’ if they are
             Local HMAs set within the upper-tier of Strategic HMAs); LAs provide the background, and the four-colour system demarcates them.
      >      There are also schematic ‘maps’ that generalise into rectangular ‘tiles’ localities either in, or adjacent to, the city region; here again the HMA
             boundaries are lines and the area colouring demarcates LAs.
4.2   Map 1 is first a ‘master’ version of the conventional type of map, with an ‘underlay’ of topographic detailiv to help orientation. On this map type, as well
      as the colouring to individuate the LAs, there are 2 character identifiers of selected localities: Annex 5 provides a ‘look-up’ between these identifiers
      and the full place names.
4.3   The same places are also shown – but with full names – on the schematic map type which is illustrated by Map 2. This type of map replicates the
      colouring of local authority areas. On this one map only there are also names of those LAs whose name does not appear as one of the place names:
      for example the name “CALDERDALE” is shown on this map, whereas on other maps this LA is identifiable as the set of ‘tiles’ of the same colour
      which include Halifax and the five other named places within its area, such as Todmorden.
10 Map 1: Master map of the Leeds City Region and the surrounding areas
11

Map 2:   Template for the generalised ‘tile’ maps which can highlight substantive differences between different sets of HMAs
12

4.4   As context for the HMA boundaries in the rest of this Report, it is valuable to summarise the 2013/14 average house price geographyv of the LCR:
      Map 3 shows this at the scale of Middle-layer Super Output Area. It is very clear that the higher price areas are limited to the more rural areas to the
      north of the LCR, extending from the western fringes of York to the southern Yorkshire Dales as well as Ribble Valley (Lancashire). In direct contrast,
      the lowest price areas are concentrated in inner areas of former textile towns and cities, plus much of the former coalfield to the south of the LCR.

 Map 3:      Average 2013/14 house prices in Middle-layer Super Output Areas (£)
13 4.5 Map 4 shows house price change over 7 years to 2013/14. This pattern is complex, but suggests the urban-rural price divide widened in these years. Map 4 Middle-layer Super Output Area average house price change 2006/07 – 2013/14 (%)
14

5     NHPAU

5.1   The key reference point here is the set of HMAs defined with 2001 data for NHPAU (see end note 1). Maps 5 & 6 show in the two cartographic formats
      used here the 2001-based 2-tier HMAs: note that these are the original ward-scale boundaries from the analysis, and not those best-fit to whole LAs.
      Both maps use continuous lines as boundaries for upper tier Strategic HMAs, and broken (‘pecked’) boundaries for lower tier Local HMAs. (It is not
      feasible to show here the full extent of the HMAs covering some parts of Barnsley LA because these extend to Sheffield and areas further south still.)
15 Map 5: NHPAU 2001-based 2-tier HMAs
16

Map 6:   NHPAU 2001-based 2-tier HMAs (generalised version)
17

5.2      Maps 7 & 8 similarly show in both cartographic formats the Single-tier set of 2001-based HMAs produced for NHPAU: note that further details of these
         HMAs are also at the source cited in end note 1. (Once again the HMA which includes Barnsley LA extends south of Sheffield so is not shown in full).

Map 7:          NHPAU 2001-based Single-tier HMAs
18 Map 8: NHPAU 2001-based Single-tier HMAs (generalised version)
19
6 Results
6.1 With the previous section of the report setting the context for the research by mapping the 2001-based NHPAU HMA boundaries in the LCR, this section
now provides the sets of results produced with the new 2011 data specifically for this study. The first aim is, so far as possible, to directly ‘update’ both the
2-tier and the Single-tier sets of HMAs. The main similarities and differences between the 2001-based and the 2011-based results will then be described,
although it is relevant to reiterate here the points made in section 3 about the enforced limitations of such an ‘updating’ which arise due to differences
between the datasets from the two Censuses.
6.2 It is important to keep in mind when reviewing these results that HMA boundaries are the result of analysing flows of two kinds (commuting and migration),
in both directions, between each of the very many small areas in the datasets. This means that it would take an intensive study of all these millions of flows,
from two different Censuses, before a robust hypothesis could be put forward as to just why any one 2011-based boundary between two places differed
from the equivalent 2001-based set of HMAs. To give an example: two previously separate HMAs becoming a single HMA may not always be because the
flows between them – of whichever kind – have increased, but even if they have does this apply to the flows in both directions? It is also possible that the
flows between them stayed fairly similar, but in one or both of them the internal flows have declined, which will equally reduce its level of self-containment.
These and other flow changes can cause the HMA boundaries to change, while each of these changes may in turn be the result of a range of more familiar
planning-related ‘real world’ changes such as new house building, change in the work available in certain localities, or major transport improvements.
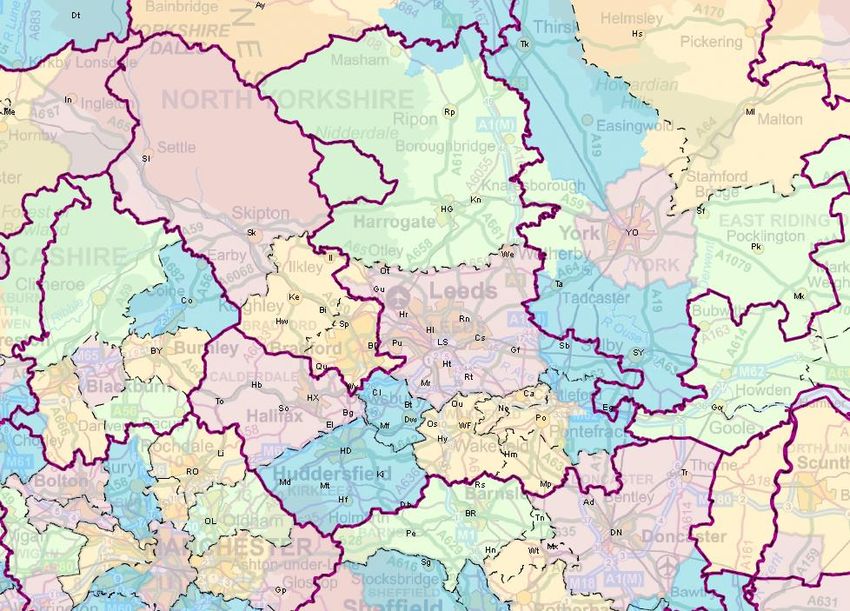
6.3 Map 9 shows the 2011-based 2-tier HMAs (nb. whereas the 2001 migration dataset only covered people aged 25(+), this dataset covers all migrants).
To help distinguish the 2011-based results from the 2001-based NHPAU HMAs shown earlier, here the boundaries are shown in purple instead of black.
Map 10 shows the same boundaries in the generalised format which puts the focus on the way the HMAs group or separate the main settlements,
helping to focus attention on more substantive similarities or differences between different sets of boundaries. (Map 9 is unable to show the full extent
of the Strategic HMA which includes Barnsley LA because it extends south of Sheffield; Map 9 also omits some outlying areas of the York HMAs
which have very small populations.)20 Map 9: 2011-based 2-tier HMAs
21

Map 10:   2011-based 2-tier HMAs (generalised version)
22

6.4   The upper tier is defined by analysing commuting data, so these boundaries remain unchanged when the 2011-based analyses shift to using the
      migration dataset which only cover migrants aged 25(+), so as to more closely replicate the lower tier boundaries defined with 2001 data for NHPAU.
      To first highlight these upper tier Strategic HMAs, which remain unchanged in both sets of 2011-based 2-tier HMAs, Map 11 shows them separately.

Map 11:      2011-based Strategic HMAs (generalised version)
23
6.5 Maps 12 and 13 now show the set of 2-tier HMAs in which the lower tier of Local HMAs was defined by only analysing data on migrants aged 25(+).
(Map 12 is unable to show the full extent of the Strategic HMA which includes Barnsley LA because it extends south of Sheffield; Map 12 also omits
some outlying areas of the York HMAs which have very small populations.)
Map 12: 2011-based 2-tier HMAs but with only the migration of people aged 25(+) used to define the Local HMAs24
Map 13: 2011-based 2-tier HMAs but with only the migration of people aged 25(+) used to define the Local HMAs (generalised version)
6A Updating Strategic HMAs
6A.1 The principal starting point in comparing the 2011-based results with those produced for NHPAU is to consider only the upper tier or Strategic HMAs,
not least because the two sets of 2011-based boundaries are the same at this level (ie. whether or not the migration dataset includes the under 25s).25
Box 1 lists the key points from this comparison.
Box 1: Comparison of the Strategic HMAs based on 2011 data with those from 2001 (NHPAU)
1.1 Both sets of boundaries show that just 2 Strategic HMAs cover the whole of W.Yorkshire
1.2 Bradford is now smaller: Leeds ‘gains’ from it all parts of Calderdale & Kirklees plus part of Wharfedale within the Bradford LA
1.3 Leeds ‘loses’ the bulk of Barnsley LA which was in its NHPAU Strategic HMA, while it ‘gains’ Tadcaster plus the northern part of Harrogate LA
to encompass Ripon
1.4 York’s 2011-based Strategic HMA is larger than its NHPAU equivalent as it extends into Ryedale LA
1.5 Craven LA is still split between Bradford and a link into Lancashire, but the boundary has shifted with Settle now in the former rather than the latter
6B Updating Local HMAs
6B.1 It is rather more complicated to consider change at the level of the lower-tier (Local) HMAs. This is partly because of the difference between the sets
of results obtained using 2011 data depending on whether the under 25s were included in the migration data. It is also the case that the smaller size
of the Local HMAs makes it more likely that there is ‘turbulence’ in their definitions. Box 2 lists key points from the comparison of the Local HMAs
using the different datasets.
Box 2: Comparison of the lower-tier (Local) HMAs based on 2011 data with those from 2001 (NHPAU)
2.1 Bradford LA is always split into 3 Local HMAs, although with varying boundaries either side of Keighley
2.2 Calderdale is a single Local HMA in both 2011 sets of results (whereas it was split by NHPAU’s Strategic HMA)
2.3 N.Kirklees is separate from Huddersfield in all the results; within this area, Local HMAs are variable
2.4 Wakefield LA in all results is split into 4 Local HMAs: Castleford | Pontefract | Hemsworth | Wakefield
2.5 NHPAU’s Leeds Local HMAs split the LA north-south but this is not replicated with the 2011 dataset which is similarly limited to 25(+) migrants because
these results have Leeds as a single Local HMA; the dataset which covers all migrants splits off a new Local HMA in the east of the LA (nb. it also
replicates the NHPAU Local HMA allocation of Wetherby separately from the rest of Leeds LA, grouping it with Harrogate)
2.6 The fact that York’s 2011-based Strategic HMAs is larger than its NHPAU equivalent results in it having a split at the Local level which replicates the
NHPAU Strategic HMAs' separation of York from most of Ryedale LA26
6C Single-tier HMAs
6C.1 The other analyses of 2011 datasets are to create Single-tier HMAs with one or other of the two methods described in section 2: either the one used
to produce the NHPAU Single-tier HMAs, or the method which defines what are here termed Alternative Single-tier HMAs. Both of these methods
involve the analysis first of commuting data and then migration data, and it is noteworthy that for each method the same boundaries are produced
whether the migration dataset includes those aged under 25s, or excludes them. As a result, it is only necessary here to show one set of boundaries
for each method, because for neither method is the boundaries it produces here sensitive to the change in migration data. Maps 14 & 15 show the
Single-tier HMAs, defined in the same way as NHPAU Single-tier HMAs, in both map formats. (Map 14 is unable to show the full extent of the HMA
which includes Barnsley LA because it extends south of Sheffield.)27 Map 14: 2011-based Single-tier HMAs
28

Map 15:   2011-based Single-tier HMAs (generalised version)
29

6C.2   Maps 16 & 17 show the Alternative Single-tier HMAs, in both map formats. These boundaries were produced by the third method set out in section 2,
       with which all the HMAs are whole TTWAs (after they have been grouped where this is necessary to ensure they are self-contained in terms of migration).
       In most of the LCR each of these HMAs is a single TTWA, but in more rural areas the TTWAs are more likely to have been grouped to create the HMAs.

Map 16:       2011-based Alternative Single-tier HMAs
30 Map 17: 2011-based Alternative Single-tier HMAs (generalised version)
31

6C.3   Assessing change to Single-tier HMAs due to using 2011 data would focus narrowly on a comparison between NHPAU Single-tier HMAs and the first
       set of Single-tier HMAs presented above. In fact all these analyses have been carried out essentially to identify which HMA boundaries are persistent
       (rather than being sensitive to the detailed of one particular version of the analysis method). The motivation here is to identify boundaries which are
       'robust' in that they appear in several different sets of results. Any boundary which, by contrast, only appears one or two of the sets of results cannot
       be seen as strong evidence that the areas on either side of it are so distinctly separate housing markets that there is no need for the respective LAs
       to observe the Duty to Co-operate. The need for several plausible sets of results, as input to this sensitivity testing, made it valuable to produce these
       Alternative Single-tier HMAs. Box 3 lists the main points from the comparison of the 2001-based NHPAU Single-tier HMAs with those defined by both
       the methods which have been applied to the data for 2011.

 Box 3: Comparison of the Single-tier & Alternative Single-tier HMAs based on 2011 data with those for NHPAU
 3.1   The set of 2011 Single-tier HMAs defined in the same way as the NHPAU Single-tier HMAs has similarly partitioned all W.Yorkshire into just 3 HMAs,
       whereas the Alternative Single-tier HMAs find a separate Single-tier HMA which exactly matches Calderdale LA, and another closely matching
       Wakefield LA
 3.2   There is also similarity between the NHPAU Single-tier HMAs and both the 2011-based sets of Single-tier HMAs that cover Harrogate and also York,
       while for Barnsley the link to Sheffield is broken in the Alternative Single-tier HMAs
 3.3   As with the Strategic HMAs, both types of 2011-based Leeds Single-tier HMAs ‘gained’ areas in N.Kirklees and the Wharfedale part of Bradford LA
       from the 2001-based NHPAU Bradford Single-tier HMA
 3.4   N.Kirklees is linked with Huddersfield in the Alternative Single-tier HMAs (due to the TTWA boundary here)
 3.5   Wetherby is grouped with Harrogate in the Alternative Single-tier HMAs (due to the TTWA boundary here)
 3.6   The TTWA basis of the Alternative Single-tier HMAs prevents any of Craven LA linking with Lancashire.
32
7 Synthesis
7.1 Although a degree of focus has been placed on stability between the NHPAU 2001-based results and those from the analyses of datasets from 2011,
it was probably inevitable that more of the commentary relates to differences than to similarities. It is important to caution against interpreting any
apparent emphasis on change since 2001 as confirming a natural tendency for local knowledge of physical and economic change to prompt a belief
that there was a high degree of flux in the boundaries of HMAs. From a more analytical perspective, the results can be interpreted as show a higher
level of stability than might have been expected, not least given the notable differences identified earlier between the datasets from the two Censuses.
7.2 For this study “Have boundaries changed much?” is not in fact the most relevant question, because it is the answer to the question “Where do the
boundaries change least?” which will provide the more useful information. This is because boundaries which are persistent across several different
analyses can be seen to be separating areas which are not strongly linked by housing market pressures. This then implies that the LPAs on either
side of such boundaries are less obliged to co-operate with their SHMAs because housing provision on one side of the boundary is unlikely to resolve
unmet in the adjacent HMA, and investment in major sites in one Plan area is unlikely to impact upon the delivery of sites in the adjacent area.
7.3 Answering the question “Where do the boundaries change least?” requires a synthesis of the results from several sets of boundaries. To some extent
of course, the results will depend on the choice of boundaries to include in this synthesis. Here the synthesis excludes all 2001-based NHPAU HMAs;
it places slightly more weight on the 2-tier set of 2011-based HMAs by including both tiers as separate boundary sets (including both lower tier sets,
which are the only results here which differed depending on whether the migration data analysed had included the under 25s). The following list
specifies the 5 sets of boundaries included in this synthesis.
> 2011-based upper-tier Strategic HMAs, whether or not migrants under 25 are included (Map 11)
> 2011-based lower-tier Local HMAs, where migrants under 25 are included (Map 10)
> 2011-based lower-tier Local HMAs, where migrants under 25 are not included (Map 13)
> 2011-based Single-tier HMAs, whether or not migrants under 25 are included (Map 15)
> 2011-based Alternative Single-tier HMAs, whether or not migrants under 25 are included (Map 17)
7.4 Given that there are 5 sets of HMA boundaries included in the synthesis, a boundary between two adjacent localities will be present a minimum of 0
and a maximum of 5 times in the input HMAs. In the terms of Geographic Information Systems, each such boundary set is a ‘layer’ and the synthesis
then counts the number of such ‘layers’ in which the same boundary appears. At this point it becomes particularly valuable that each boundary set has
been simplified into the ‘tile’ format here, because it enables the synthesis to focus on substantial similarities or differences across the boundary sets,
rather than being distracted by any minor differences in alignment at the level of individual wards.
7.5 Map 18 provides this synthesis of the 5 sets of HMA boundaries listed above. The differing ‘weights’ of the boundaries between each pair of ‘tiles’
shows how often across the 5 HMA maps that pair of areas were in different HMAs. If they were in different HMAs on either all or 4 of the 5 maps then
there is a full line boundary between them; if they were in different HMAs on only 3 of the 5 (ie. still the majority) then a ‘pecked’ boundary is shown.33
Map 18: Synthesis from the main sets of 2011-based HMAs, indicating the strength of their evidence that pairs of adjacent areas are in different HMAs
7.6 The earlier comparisons of each set of 2011-based HMAs with their equivalent NHPAU set are now set aside, because the following description
only considers the 2011-based results as synthesised in Map 18. The aim here is to interpret this evidence about these 5 sets of results in terms34
of the ‘robustness’ of each potential HMA boundary between adjacent areas, as indicated by the repeated presence of a boundary between a pair
of areas. This interpretation of the analysis can be illustrated by the example of the Wharfedale area of Bradford LA (immediately south of Ilkley).
The separation of this area from all other parts of Bradford LA is the one case of a robust boundary within one of the W.Yorkshire LAs. A less robust
boundary separates this area from Ilkley. A boundary of similarly moderate strength separates N.Kirklees from the rest of that LA, which includes
the areas around Huddersfield. Box 4 summarises the robustness – as HMA boundaries – of the LA boundaries within West Yorkshire, and then
Box 5 provides the equivalent analysis of the LA boundaries relevant to the LCR which are external to West Yorkshire.
Box 4: Assessment of the boundaries between West Yorkshire LAs in terms of their robustness as boundaries of 2011-based HMAs
4.1 Leeds:Bradford is a robust boundary except in the Wharfedale part of Bradford LA
4.2 Bradford:Calderdale is a robust boundary (unlike in 2001)
4.3 Kirklees:Calderdale is a robust boundary, apart from some upper-tier/single-tier HMAs
4.4 Kirklees:Bradford is a highly permeable boundary, especially in the area round Cleckheaton
4.5 Kirklees:Leeds is a permeable boundary, especially in the area round Batley
4.6 Kirklees:Wakefield is a robust boundary, apart from their shared Strategic HMA links to Leeds (nb. this also applies to Calderdale:Leeds)
4.7 Leeds:Wakefield is a moderately robust boundary
Box 5: Assessment of the LCR boundaries external to West Yorkshire LAs in terms of their robustness as boundaries of 2011-based HMAs
5.1 Most of the Pennines form a robust – perhaps almost impermeable – set of HMA boundaries to the west of the LCR (the exception is western
Craven linking to Lancashire)
5.2 York has stronger links to northern N.Yorkshire LAs than does Harrogate; Craven has none at all
5.3 W.Yorkshire’s eastern boundary is crossed by many links between Pontefract and areas in Selby LA
5.4 Selby LA is always split (mostly either between HMAs centred on York or areas which also cover parts of Wakefield LA)
5.5 W.Yorkshire’s boundary with S.Yorkshire is largely robust (unlike the 2001-based analyses for NHPAU that had Barnsley linked to W.Yorkshire)
5.6 Bradford has strong upper-tier/single-tier HMA links with N.Yorkshire, with its links being to Craven
5.7 Leeds’ northern boundary with N.Yorkshire is rather stronger, although the allocation of Wetherby on some analyses is with Harrogate LA)35
8 Consultation
8.1 Early in the study a methodology workshop with stakeholders gained broad ‘buy-in’ to the methodology proposed for the method of defining HMAs.
After the analyses were completed the results were summarised in a briefing document and this was sent to stakeholders in the full consultation
stage of the study. This section of the report first describes the consultation process, then outlines the findings, and finally indicates their implications.
Annexes 1 to 3 provide further information on the consultees and their responses (nb. as is customary, these summaries of responses have not been
sent to the respondents for them to check, a step which would not have been possible within the schedule of the study in any case).
8A The consultation process
8A.1 LCR local authorities and neighbouring LAs had been engaged at an early stage of the project through an initial workshop, which laid the groundwork
for the detailed consultation reported in Annex 1. LPA officers attended a workshop presenting results on February 22nd, and a summary report was
circulated to strategic planning officers across the LCR and its neighbouring LPAs and city regions.
8A.2 Additional consultation efforts were directed at Developers, Agents and Registered Providers (RPs) active across the LCR. Contact details were
sought from LPA strategic planning contacts, these were supplemented by contacts identified through NLP's regional office in Leeds.
8A.3 In order to maximise the value of the consultation, a range of questions were developed (in conjunction with the client) and circulated to all contacts
prior to the telephone discussions. The questions which formed the basis of the discussions with LPAs are included in Annex 1. Table 1 presents the
number of discussions which were undertaken, and indicates which of the Annexes includes a basic outline of each of the individual responses.
Table 1 Achieved Consultation
LPAs Registered Providers Developers & Agents
Number consulted: 8 7 18
Detailed feedback in: Annex 1 Annex 2 Annex 3
8B Consultation Findings
8B.1 This section is structured to follow the questions which informed the discussions, and highlights differences between different categories of consultee.36
Alignment of the CURDS analysis with local knowledge, and concerns with the analysis in respect of current LPA Local Plan evidence base
8B.2 Overall the majority of LPAs felt that the CURDS analysis reflected their local understanding of housing market areas. The following issues were
raised by LPAs in respect of the analysis and the boundaries identified.
Barnsley felt that the change in the upper-tier boundary (putting it with Sheffield rather than Leeds) exaggerated any change in the strength of the
relationship between itself and Wakefield; Sheffield were also keen to understand the change, feeling that it could be due to the geographic proximity
of the northern parts of Sheffield to the economic centres in the southern parts of Barnsley
Wakefield also felt that the change to the boundary between Wakefield and Barnsley was surprising and that future changes and investment will
result in greater interaction between the two areas
Harrogate felt that the change to its boundary with Leeds which highlighted the strength of the cross-boundary relationship around Wetherby does not
align with their recent Strategic Housing Market Assessment (SHMA) which suggests it is a self-contained housing market
One of the changes identified by Leeds was the inclusion of the Menston area of Bradford within its areas of local interaction: this had not been
identified as part of the HMA within the Leeds SHMA; however they acknowledged that the SHMA was undertaken with 2001 travel-to-work data
Bradford felt that additional analysis was required beyond this study to understand the links with adjacent LAs in more detail
8B.2 Developer and Agent observations regarding the HMAs identified the following points.
There are strong relationships between Leeds and Bradford, and Ilkley was specifically mentioned on a number of occasions as a settlement which
should be included within the Leeds HMA
Huddersfield and Halifax were suggested to be linked to both Leeds and Manchester, driven by the transport links
The view on the boundary between Leeds and Harrogate was that there is considerable movement across it
Some respondents felt that more of the Selby area is linked to Leeds rather than York
In terms of the Local HMAs, some agents and developers suggested Leeds should be split into 3 areas covering firstly south Leeds (with its heavy
proportion of social housing), the city centre (favoured by young professionals) and the northern/north-western areas including Ilkley (with high cost
family housing, some in more rural settings)
8B.3 RPs’ observations were that the geography of the affordable rented market is difficult to relate to the HMAs identified in the analyses, largely because
of the very local catchment area for stock (up to 4 miles), with the majority of tenants having local ties to family and friends. Most of the local house
moves involve up- or down-sizing, or relocating to a better neighbourhood. Two respondents mentioned the need to look at separating Bradford’s
local market into four areas rather than two: the central city, Airedale, Wharfedale and the villages.
Drivers of links to neighbouring LPAs including understanding of short/long term trends
8B.4 The feedback from LPAs emphasised that the primary drivers of links between local authority areas were economic, and the result of access to the
job opportunities in adjacent areas, plus the infrastructure links which facilitate movement around and across LCR. The majority felt that these were
long term trends which were widely understood across LCR.
8B.5 The majority of Developers and Agents highlighted that infrastructure investments across the LCR have driven changes within the housing market.37
The consequence of this has been an extension of commuting areas, in particular from Leeds northwards to Harrogate LA, westwards to Bradford,
eastwards to Selby and York. Developers and Agents also identified the land supply issues/constraints in Leeds as a key driver which led Developers
to look elsewhere, with the identified locations being particularly driven by infrastructure.
8B.6 RPs identified the key short term driver of stock availability, and of stock types, rather than geographic or economic drivers. Demand has driven the
development of family housing.
Identification of possible changes in the future
8B.7 A number of LPAs highlighted future infrastructure, and economic and housing investments, which could potentially influence linkages in the future.
Barnsley has economic aspirations involving significant levels of job creation which is hoped will help retain out-commuters
Greater links are expected from Leeds through to Sheffield driven by the rail corridor; Barnsley and Wakefield both identified this investment as one
which would strengthen the links between their areas
East Riding felt that the rail infrastructure investments between Manchester and Leeds could shape markets in the future
Kirklees has aspirations for significant growth around Dewsbury/Batley through the North Kirklees Growth Zone, and this could result in changed
commuting patterns through the economic opportunities created
Selby highlighted their ambition to meet the leisure needs of residents; while not changing commuting patterns linking Selby to Leeds, it is hoped this
would develop the leisure economy and retain residents at the weekends and in the evenings
Wakefield identified investment at Meadowhall in relation to HS2 as a driver of greater links south to Sheffield through infrastructure improvements
Bradford mentioned investment around new transport infrastructure (eg. a station at Appleby Bridge) changing local commuting patterns
8B.8 Developers and Agents felt that once the Allocations DPD was established for Leeds and that additional land was identified for residential
development then Leeds would again become a strong focus for housing delivery, reducing the current drivers which have led to new housing being
displaced to other areas. The strength of Leeds should not be underestimated in terms of future drivers, while a few respondents also mentioned the
influence of Manchester to the west of the LCR, perhaps related to the Northern Powerhouse economic impact and Northern PowerHouse Rail.
8B.9 The impact of Welfare Reform was identified by RPs as a key future driver in terms of demand for stock and the expected change in demand for
certain types of stock, and in particular how they will meet the needs of single person households. A number of RPs highlighted the economic viability
of developing stock across the LCR due to the cost and the rents which can be achieved. Together with the Government's focus on helping people
onto the property market, this will shift demand towards shared ownership and rent-to-buy. RPs do not expect these changes to impact on the HMAs
identified here, as current demand will influence future investment decisions.
Dialogues with neighbouring LPAs
8B.10 LPAs within the LCR viewed the established links in respect of strategic planning as effectively facilitating discussions under the Duty-to-Co-operate.
8B.11 Developers and Agents identified 3 LPAs needing to increase joint working with Leeds: these were Bradford, Wakefield, Harrogate. In addition some
Developers and Agents felt Leeds also needed greater links with Selby and Calderdale. Developers and Agents were generally more critical of the38
relationships between LPAs and questioned how effective discussions had been to date in respect of dealing with key issues and addressing the
Duty-to-Co-operate. Developers and Agents felt that in those areas where greater links were needed, there was a need for joint housing policies,
particularly in relation to site allocation and land release, and infrastructure investments and improvements. Developers and Agents were generally
questioning how far individual LPAs could meet their own housing needs.
How the study will be used
8B.12 The majority of LPAs identified that they would use the study as part of their evidence base, although some were still considering how they would use
the results. None of the LPAs questioned the methodology or integrity of the study but some highlighted differences between the new results and the
NHPAU research in the existing evidence base as raising issues which they would consider further.
Merit of undertaking future evidence based studies at a more strategic level, including the consideration of an appropriate boundary for any future studies
8B.5 There was a marked split in response to these issues from LPAs. LPAs located within the LCR could see merit in undertaking further studies at this
geographic level, although this came with caution as to the purpose of any further studies. The majority of LPAs confirmed that any study undertaken
should add value, and there were concerns over evidence which may undermine progress with the development of Local Plans in the short term.
LPAs from outside the LCR did not have a strong view on additional studies. A number stated that there would potentially be merit in further studies
and highlighted that the LCR boundary would be a sensible boundary given that it provided a broader geographic understanding of the context for
their local areas. However this might need to extend even further, given the links to other parts of Yorkshire. Leeds LPA felt that additional strategic
studies may become important as part of devolution.
8C Summary Implications
8C.1 Most of the LPAs have been re-assured to see that their Local Plan evidence base was aligned to the CURDS analysis results. Some local issues
warrant further research into key drivers, particularly between LPAs where the strength of relationships identified seemed to have changed, with the
possibility that different HMAs need to be identified as a consequence. These cases included:
Barnsley and Wakefield,
Kirklees and Leeds,
Barnsley and Sheffield,
Leeds and Bradford, particularly the area around Wharfedale,
Leeds and Harrogate, particularly around Wetherby.
8C.2 A much stronger view from Developers and Agents was that some of the identified HMAs may need to change to identify boundaries which reflect the39
functioning of the housing markets of interest to them (nb. these are essentially limited to private sector housing markets).This illustrates the different
market perspectives and drivers identified by private developers which are important to keep in mind when considering their responses, but as noted
in section 2 the current available data does not allow the definition of tenure-specific HMAs.
8C.3 The analysis of the housing market geography in LCR is seen as timely, especially given the recommendations by LPEG (mentioned in the opening
section of this report) which make particular reference of the importance of updating analyses to identify HMAs for the purposes of undertaking local
objective assessments of need and so ensure that future housing needs are met within and across HMAs. The motivation of LPEG was the need for
a speeding up the Local Plan process and for improvements to a number of elements in the plan making process, notably the effective delivery of the
Duty-to-Co-operate. This study puts the LCR in a good position, should the recommendations become part of national planning policy and guidance.
Even if all of the recommendations identified by LPEG are not endorsed by Government, the need for a robust evidence base for LPAs will remain
and this study will make a valuable contribution across the LCR.
8C.4 Given that the Housing and Planning Act (12 May 2016) enables combined authorities to take over the preparation of local plans from LPAs in their
respective area should they prove too slow in bringing a plan forward, this research ensures the West Yorkshire Combined Authority and its LPA
partners will be on the front foot in responding to national planning legislation. Given the number of LPAs in the West Yorkshire Combined Authority,
it is crucial that these new powers for the Combined Authority are used in ways which enable collaboration and genuine partnership working where
decision-making is undertaken by consensus. If one of the Combined Authority’s member authorities fall behind in preparing a local plan, the other
members of the Combined Authority should work with it to overcome the problems faced. The engagement efforts in this study should ensure that the
LAs can feel a sense of ownership.
8C.5 By leading on this analysis the West Yorkshire Combined Authority is boosting its strategic planning role as enabler and facilitator in supporting LPAs
in reaching agreement on strategic matters. The analysis also provides the underpinning evidence to support the Combined Authority in its drawing
up of a strategic framework for the sub-region. The strategic planning framework for the West Yorkshire Combined Authority would in effect then
underpin the local plans for its constituent LPAs in addressing issues of housing delivery.40
9 Conclusions
9.1 This research study has undertaken innovative analyses of the housing market geography of Leeds City Region. The motivation for the research was
the need to enhance the evidence base for Local Plans, as well as to guide the spatial framework for undertaking objective assessments of need
which can ensure housing needs are met within HMAs. The study also aimed to identify those pairs of LPAs whose shared boundaries are straddled
by the defined HMAs as a result of the strong commuting and/or migration flows between their areas. In these cases the Duty-to-Co-operate of the
LAs concerned is particularly important so as to ensure housing needs are met and the need to release strategic land for development is understood.
9.2 During the course of the study the initiative of LCR in commissioning the study was, in effect, positively endorsed by the published recommendations
to the Government of the LPEG, whose proposed changes are aimed at speeding up the Local Plan delivery process (an outcome which is a priority
for the Government). The recommendations emphasise the importance of updated and consistently defined housing market areas, both for the local
calculation of levels of unmet need, and also to plan the delivery of housing within the identified HMAs. This would require LPAs where unmet needs
were identified to highlight through submitted plans how these needs would be met elsewhere, and to work to achieve this. This is linked to ensuring
that the Duty to Co-operate is fulfilled in practice, which will impact directly on those authorities linked by the geography of HMAs.
9.3 Another new development which endorses the need for this research into the most recent evidence on housing market geography is the new
prospectus published in April 2016 by the Homes & Communities Agency (“Shared ownership and affordable housing programme 2016 to 2021”).
This prospectus states that future developments by RPs should be more market driven, with shared ownership and rent-to-buy developments
concentrated in areas of lower risk.
9.4 With this report LCR has gained evidence to enable it to meet the LPEG recommendations for improved delivery of Local Plans. The study research
has updated the ‘best practice’ definitions of HMAs which were developed for NHPAU, and has identified LPAs in the LCR between which there is the
most pressing need to deliver the Duty to Co-operate so as to meet unmet housing need. It is very valuable that the analyses of data from the 2011
Census produced results which show a reassuringly gradual evolution of the HMA boundaries produced for NHPAU. To have changed them radically
would be implausible because commuting and migration change slowly; it would also have been unhelpful, given the use of NHPAU HMAs in current
LA evidence bases. It is also noteworthy that the 2011-based HMA boundaries have been widely seen as a recognisable depiction of housing market
realities by respondents in the study consultation process. The following paragraphs review first the key of the findings from the study in terms of the
housing market geography of the LCR, and second the implications of these in terms of the Duty to Co-operate.
9.5 The 2011-based result are not greatly different to those from the NHPAU project in most areas. Where they do differ, it is important to keep in mind
that the boundaries are the result of a computer algorithm seeking to ‘balance’ the relative significance of the varied strength of commuting and
migration flows that criss-cross the region. It is inevitable that in some areas this is a finely balanced calculation, one which may tip slightly over time
with the result being that the boundaries in that area become quite different when the underlying flows have shifted only slightly, and in diverse ways.
It is for this reason that this study has undertaken several slightly varied analyses, to avoid placing too much reliance on a single set of boundaries.
This approach provides sensitivity testing of the results, with a synthesis then drawn from several sets of results so as to focus on robust findings.
9.6 The 2011-based main findings on LCR HMA geography are summarised below, noting any key differences to those in the results for NHPAU.You can also read