WATER 2019 MARKET INTELLIGENCE REPORT - GREENCAPE
←
→
Page content transcription
If your browser does not render page correctly, please read the page content below
Water

  2019
  Market Intelligence Report

Water: Market Intelligence Report 2019   i
ii Water: Market Intelligence Report 2019
GreenCape
GreenCape is a non-profit organisation that works at the interface of
business, government and academia to identify and remove barriers to
economically viable green economy infrastructure solutions. Working in
developing countries, GreenCape catalyses the replication and large-scale
uptake of these solutions to enable each country and its citizens to prosper.
Acknowledgements
We thank Jane Reddick and Raldo Kruger for the time and effort that
they have put into compiling this market intelligence report. We also thank
Gaylor Montmasson-Clair for his feedback on draft versions of the report.
Disclaimer
While every attempt has been made to ensure that the information
published in this report is accurate, no responsibility is accepted for
any loss or damage to any person or entity relying on any of the
information contained in this report.
Copyright © GreenCape 2019
This document may be downloaded at no charge from www.greencape.co.za.
All rights reserved.
Subscribe to receive e-mail alerts or GreenCape news, events and publications
by registering as a member on our website: www.greencape.co.za
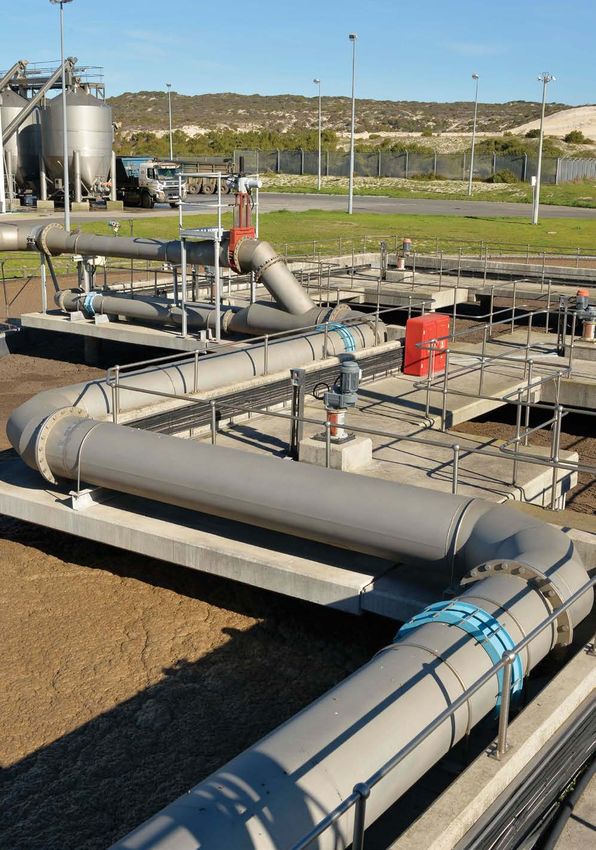
Cover image courtesy of Jane Reddick
18 Roeland Street, Cape Town, 8001, South Africa
Authors: Jane Reddick and Raldo Kruger
Editorial and review: Salome Bronkhorst, Lauren Basson, Claire Pengelly
and Nicholas Fordyce
Images: GreenCape, Western Cape Department of Agriculture,
City of Cape Town and Bruce Sutherland
Layout and design: Tamlin Lockhart Art Direction
Water: Market Intelligence Report 2019 iii
Contents

Executive summary                                                                                         1
What’s new?		                                                                                             3
1. Introduction and purpose                                                                               5
2. Sector overview                                                                                        7
   2.1. South African context                                                                             7
   2.2. Western Cape context                                                                              9
		      2.2.1. Western Cape Water Supply System                                                         10
		      2.2.2. Long-term planning                                                                        12
3. Policies and regulations                                                                              17
   3.1. National legislation                                                                             17
		      3.1.1. The National Water Act                                                                    17
		      3.1.2. The National Building Regulations and Building Standards Act                              18
		      3.1.3. National Environmental Management: Waste Act                                              18
		      3.1.4. Other key national legislation and standards                                              18
   3.2. Municipal by-laws and tariffs                                                                    19
		      3.2.1. Water restrictions                                                                        19
		      3.2.2. Water tariffs                                                                             19
		      3.2.3. Alternative water use                                                                    23
   3.3. Municipal procurement                                                                           24
		      3.3.1. City of Cape Town procurement                                                            25
		      3.3.2. Procurement in emergency situations                                                      25
4. Opportunities and barriers                                                                           27
   4.1. Industrial and commercial markets                                                               28
		      4.1.1. Market overview                                                                          28
		 4.1.2. Opportunities                                                                                 35
		      4.1.3. Drivers and risks                                                                        36
		 4.1.4. Barriers                                                                                      38
   4.2. Residential market                                                                              39
		      4.2.1. Market overview                                                                          39
		 4.2.2. Opportunities                                                                                 40
		      4.2.3. Drivers and risks                                                                         41
		      4.2.4. Barriers                                                                                 42
   4.3. New property developments                                                                       42
		      4.3.1. Market overview                                                                          42
		 4.3.2. Opportunities                                                                                 44
		      4.3.3. Drivers                                                                                  44
		      4.3.4. Barriers and risks                                                                       45
   4.4. Municipal market                                                                                45
		      4.4.1. Market overview                                                                          45
		      4.4.2. Opportunities                                                                            46
		      4.4.3. Drivers                                                                                  48
		      4.4.4. Barriers and risks                                                                       48
5. Funding and incentives                                                                                51
6. The Western Cape: Africa’s growing greentech hub                                                     53
7. GreenCape’s support to businesses and investors                                                      57
8. References                                                                                            61

iv                                                                    Water: Market Intelligence Report 2019

List of figures

Figure 1:
Water sources in South Africa                                                                       7
Figure 2:
Water use in South Africa by sector                                                                 7
Figure 3:
The gap between existing water supply and projected demand by 2030 in South
African catchment areas                                                                             8
Figure 4:
Water Management Areas in South Africa (Western Cape outlined in black)                             9
Figure 5:
Drought status of Western Cape municipalities (accessed in October 2018)                           10
Figure 6:
Municipalities supplied by the Western Cape Water Supply System (WCWSS)                            11
Figure 7:
Overview of WCWSS allocations by type                                                              11
Figure 8:
Historical water stored (thin line) and projected future storage (thick line) in the six largest
dams in the WCWSS, assuming 2015 demand and 2016-2017 rainfall                                     12
Figure 9:
Projected urban and agricultural supply deficit in the Berg water management area                  13
Figure 10:
The projected value of future water supply deficits in the Berg water management area.             14
Figure 11:
WCWSS planning scenario reconciliation of supply and demand                                        15
Figure 12:
Maximum groundwater abstraction rates permitted under the General Authorisation for
Taking and Storing Water (2016)                                                                    18
Figure 13:
Comparison of monthly household water costs for 15 kl/month in 2018/19 across various metros       22
Figure 14:
Comparison of monthly costs for commercial and industrial businesses for 20 kl/day in
2018/19 across various metros                                                                      23
Figure 15:
Commercial water use in Cape Town (top 300 users), based on annual average daily demand
as of March 2018                                                                                   29
Figure 16:
Breakdown of the annual average daily demand (as of March 2018) by commercial property
type for the top 300 commercial consumers, collectively using 16 600 kl/day (16.6 MLD)             30
Figure 17:
Industrial water use in Cape Town (top 300 users), based on annual average daily demand
as of March 2018                                                                                   30
Figure 18:
Breakdown of the annual average daily demand (as of March 2018) by industrial property type
for the top 100 industrial consumers, collectively using ~14 800 kl/day (14.8 MLD)                 31
Figure 19:
Indicative sectoral breakdown of the top 10 water users in selected WC local municipalities        32
Figure 20:
Sectoral breakdown of the top 80% of industrial water users in selected SA metros, based
on volume consumed                                                                                 33

Water: Market Intelligence Report 2019                                                              v
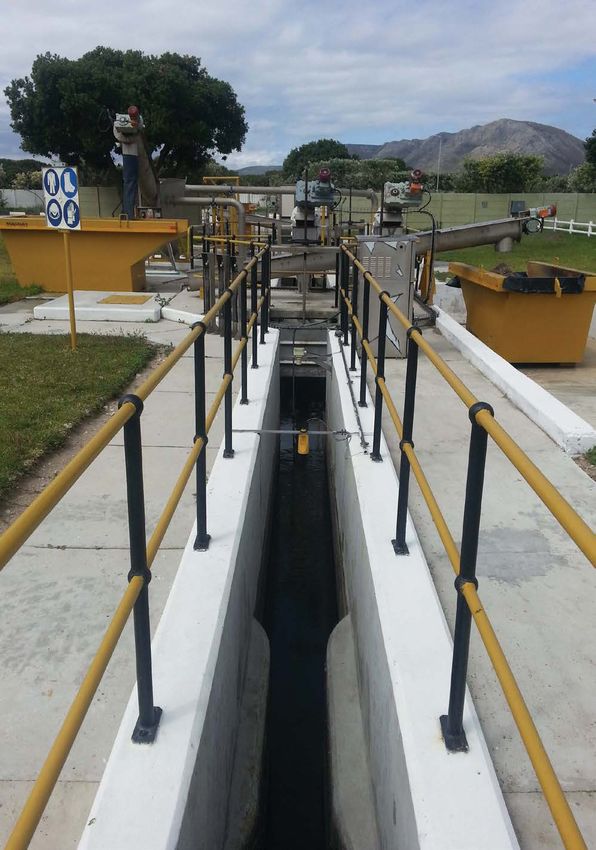
Figure 21:
Gross Fixed Capital Formation of selected sectors in SA (ZAR million)                                     34
Figure 22:
Water management solutions implemented by the businesses surveyed                                         35
Figure 23:
CoCT commercial and industrial water tariffs (R/kl, real) and their associated restriction levels          37
Figure 24:
Quarterly costs and revenues for water by municipalities in South Africa, seasonally adjusted
(R million)		                                                                                             39
Figure 25:
Household water usage by quintile in Cape Town (kl/day)                                                    41
Figure 26:
Estimated spend on wet services in new buildings completed in 2018 in SA                                  42
Figure 27:
Largest municipal contributors to the value of buildings completed in 2016                                43
Figure 28:
Value of buildings completed in metros and large municipalities in 2018 by building type.                 44
Figure 29:
Proposed water augmentation interventions by WC district municipality                                      47
Figure 30:
GreenCape’s focus areas                                                                                   58

vi                                                                      Water: Market Intelligence Report 2019
List of tables

Table 1:
Required and available public sector funding for water services infrastructure in 2017          9
Table 2:
Water tariffs for selected metros (minimum restriction levels in place) for FY 2018/19         20
Table 3:
Sanitation tariffs for selected metros (minimum restriction levels in place) for FY 2018/19    21
Table 4:
Percentage of water used that is assumed to be discharged to sewer                             21
Table 5:
Summary of market opportunities                                                                28
Table 6:
Capital cost of solutions and savings for a medium-sized manufacturing facility in Cape Town   38
Table 7:
Household ownership of selected water consuming/storing assets (2015)                          40
Table 8:
CoCT’s committed new water programme over 10 years and provisional costs                       46
Table 9:
CoCT’s planned adaptable new water programme                                                   47
Table 10:
Overview of non-revenue water in South Africa                                                  48

Water: Market Intelligence Report 2019                                                         vii
List of abbreviations
              and acronyms
AADD		        Annual Average Daily Demand
B-BBEE        Broad-based Black Economic Empowerment
BOT		         Build-Operate-Transfer
C&I		         Commercial and Industrial
CCCI		        Cape Chamber of Commerce and Industry
CoCT		        City of Cape Town
CSAG		        Climate System Analysis Group
DEADP		       Department of Environmental Affairs and Development Planning
DLG		         Department of Local Government (Western Cape Government)
DWA		         Department of Water Affairs (now DWS)
DWAF		        Department of Water Affairs and Forestry (now DWS)
DWS		         Department of Water and Sanitation
EME		         Exempted Micro Enterprise
GA			         General Authorisation
GDP		         Gross Domestic Product
GTAC		        Government Technical Advisory Centre
GVA		         Gross Value Add
ILI			        Infrastructure Leakage Index
MFMA		        Municipal Finance Management Act No. 56 of 2003
MIR		         Market Intelligence Report
MLD		         Megalitres (million litres) per day
NBR		         National Building Regulations
NRW		         Non-Revenue Water
NWA		         National Water Act
PPP		         Public Private Partnership
QSE		         Qualifying Small Business Enterprise
RFQ		         Request for Quotation
SANS		        South African National Standard:
SIV		         System input volume
VAT		         Value Added Tax
WCWDM         Water Conservation and Water Demand Management
WCWSS         Western Cape Water Supply System
WC		          Western Cape
WCG		         Western Cape Government
WEF		         World Economic Forum
WMA		         Water Management Area
WRC		         Water Research Commission
WUL		         Water Use Licence
WWF		         World Wide Fund for Nature
WWTW		        Waste Water Treatment Works

Conversions:
1 Megalitre = 1 million litres = 1 000 000 litres = 1 000 kl = 1 000 m3

viii                                                                      Water: Market Intelligence Report 2019
Executive summary
This market intelligence report (MIR) is aimed at investors interested in the South
African urban water sector, with particular emphasis on the Western Cape region.

Water scarcity has been a key driver for            Based on population and economic growth
investment in the Western Cape water sector due     projections, South Africa could have a 17% gap
to severe drought conditions and expected           between supply and demand by 2030. Not all
longer-term water constraints in the region. This   areas will be equally affected, with severe
year’s report draws on market demand trends         shortages expected in key industrial areas, e.g.
observed during the drought, and looks at the       Gauteng, Mpumalanga, KwaZulu-Natal, and the
emerging longer-term investment opportunities       Western Cape.
linked to water scarcity. The report focuses on
insights relating to the four key urban water       In the Berg River management area (which
markets in South Africa:                            includes Cape Town), the future water supply
                                                    deficit is projected to cost the region more than
■   Commercial and industrial businesses            R146 billion and almost 650 000 jobs per year by
■   Residential                                     2040 if no new water resources are developed.
■   New property developments                       Overcoming water scarcity is clearly a major
■   Municipalities                                  challenge in South Africa. At the same time,
                                                    it represents substantial opportunities for
                                                    investors and businesses in the water sector,
                                                    as summarised below.

Water: Market Intelligence Report 2019                                                                  1
Summary of market opportunities

    Market                     Market size                 Main                        Key market
                               indicators                  opportunities               segments
    Industrial &               ■   R14bn spent on          ■   Metering &              ■   SA industrial market:
    commercial                     municipal water &           monitoring                  food & beverages
    (Section 4.1)                  sanitation services     ■   Water efficient             sector gross fixed
                                   in SA (2018)                technologies                capital formation
                                                           ■   Reuse and                   ~R14bn by 2021
                                                               alternative water
                                                               treatment systems
                                                           ■   Brine management
                                                               solutions

    Residential                ■   7.4m households         ■   Water efficient         ■   3.5m households in
    (Section 4.2)                  collectively spent          devices                     SA earning >R200k
                                   R22bn on municipal      ■   Alternative water           per annum
                                   water & sanitation          systems
                                   services in SA (2018)

    New property               ■   R2.1bn spent on wet     ■   Metering &              ■   City of Cape Town,
    developments                   services (2018)             monitoring                  Tshwane and
    (Section 4.3)              ■   No. of green            ■   Water efficient             Johannesburg:
                                   buildings certified         technologies                ~50% of the private
                                   increased from 4        ■   Reuse and alternative       sector market
                                   (2010) to ~100 (2018)       water treatment
                                                               systems

    Municipal                  SA's largest water          ■   Water augmentation      Metros and large
    (Section 4.4)              market:                         (e.g. wastewater        municipalities, e.g.:
                               ■  R30bn p.a. water             reuse & desalination)   ■ Cape Town’s R5.8bn
                                  & sanitation             ■   Non-revenue water         (417MLD) new water
                                  infrastructure               reduction (R6.3bn         programme
                                  budget (2017)                p.a. in lost revenue    ■ eThekwini’s planned
                               ■  Further R17bn p.a.           in SA)                    385 MLD reuse and
                                  needed                                                 desalination PPPs

The following are some of the key drivers and              While the municipal sector represents the largest
risks to these opportunities:                              opportunity for investors, there are a few
                                                           barriers specific to this market. They relate to
■    As the risk of water scarcity increases, the          access to funding, capacity constraints,
     demand for water solutions increases.                 procurement processes, and cost recovery.
     Conversely, demand drops during periods
     of improved water security.                           Overall, there are good prospects in the Western
■    Water tariffs affect the business case for            Cape, and more widely in South Africa, for
     investment in water technologies, and in              investment in technologies that would advance
     some cases are too low to drive demand.               resilience to drought and adaptation to longer-
     However, future tariffs are likely to maintain        term water scarcity.
     an upward trend.

2                                                                            Water: Market Intelligence Report 2019
What’s new? Readers of last year’s MIR are encouraged to read this year’s report in full, as the market intelligence has been updated substantially. The 2018 report focused on the various water technology investment opportunities opened up by the recent drought in the Western Cape. This year’s report draws on market demand trends observed during the drought, and looks at emerging longer-term investment opportunities linked to water scarcity in South Africa. The report focuses on insights relating to the four key urban water markets: commercial and industrial businesses, households, new property developments, and municipalities. Water: Market Intelligence Report 2019 3
© Bruce Sutherland

4   Water: Market Intelligence Report 2019
1
    Introduction and purpose
    This market intelligence report (MIR) has been compiled by GreenCape’s Water
    Sector Desk. It is aimed at investors interested in the South African urban water
             sector, with particular emphasis on the Western Cape region.

Water scarcity has been a key driver for             barriers (Section 4). The final sections focus on
investment in the Western Cape water sector          finance and incentives (Section 5), gives an
due to severe drought conditions and expected        overview of the Western Cape as Africa’s growing
longer-term water constraints in the region.         greentech hub (Section 6), and explain
This year’s report focuses on water technology       GreenCape’s work within the green economy
investment opportunities linked to water scarcity    (Section 7).
within the four key urban water markets in
South Africa: commercial and industrial              While the report focuses on urban water use,
businesses, households, new property                 there is a strong link between agricultural and
developments, and municipalities.                    urban water use, particularly in water-
                                                     constrained contexts. For investment
The report provides a sector overview (Section 2),   opportunities in the agricultural sector, including
which outlines the issue of water scarcity in both   technology opportunities for improved water
the South African and Western Cape context.          efficiency, please consult the 2018 and 2019
This is followed by an overview of policies and      Agriculture Market Intelligence Reports1, as well
regulations (Section 3) that are relevant to water   as the GreenAgri2 portal.
technology investment opportunities and

    © City of Cape Town

1
    www.greencape.co.za/market-intelligence/
2
    www.greenagri.org.za/

Water: Market Intelligence Report 2019                                                                 5
© Bruce Sutherland 6 Water: Market Intelligence Report 2019
2
                         Sector overview
       Water scarcity is a major challenge in South Africa that also represents a
       substantial opportunity for investors and businesses in the water sector.

2.1. South African context                                           Current water usage is ~15-16 billion kl/year, and
The ‘water crises’ challenge was ranked by                           in many water supply systems water usage
the World Economic Forum (WEF) as the third                          exceeds the reliable yield (DWS 2017a). This
highest risk for doing business in South Africa in                   essentially means that whilst water supply
2017, and is also one of the top risks globally (WEF                 sources can meet this increased usage, supply
2017). South Africa is ranked as the 30th driest                     assurance drops to below 98%, i.e. the annual
country in the world. It is a highly water-stressed                  probability of supply failure increases to above
country, with extreme climate and rainfall                           2%. As shown in Figure 2, agriculture is the largest
fluctuations (WRI 2015). Despite being a water-                      water use sector (62%), followed by municipalities
scarce country, consumption is around 233 litres/                    (27%), which include residential, commercial, and
capita/day (l/c/d), compared to the international                    industrial users supplied by municipalities (DWS
benchmark of around 180 l/c/d (DWS 2017a)3.                          2017a). (Note: The relative proportion of municipal
South Africa has a reliable yield (i.e. supply from                  and agricultural use differs between provinces
current infrastructure) of around 15 billion kl/year                 and municipalities, depending on settlement
(at 98% assurance of supply – or 2% annual                           patterns and local economy).
probability of supply failure), of which the
majority is from surface water (68%) and return
flows that support surface water (13%), as
shown in Figure 1 (DWS 2017a).

68+13+6 62+27+32
                                     68%       SURFACE WATER                                                62%      AGRICULTURE
                                      13%      RETURN FLOWS                                                 27%      MUNICIPAL
                                      13%      GROUNDWATER                                                           (3% rural,
                                       6%      OTHERS                                                                24% urban)
                                               (seawater/                                                    3%      MINING
                                               brackish water                                                3%      INDUSTRY
                                               desalination)                                                 3%      AFFORESTATION
                                                                                                             2%      ENERGY

Figure 1: Water sources in South Africa                              Figure 2: Water use in South Africa
                                                                     by sector

3
  These figures are based on the system input volume divided by the population served. The system input volume includes commercial
and industrial demand, and water losses through infrastructure leaks.

Water: Market Intelligence Report 2019                                                                                               7
Based on population and economic growth
projections, water demand in South Africa is SA’s water demand is expected to
estimated to be 17.7 billion m3 in 2030. This means
exceed supply by 17% by 2030. Over
that South Africa could have a 17% gap between
supply and demand by 2030 (2030 WRG 2009). the next ten years ~R90 billion per
Not all areas will be equally affected, as shown in year will be needed for water and
Figure 3 (McKinsey and Company 2010), with sanitation infrastructure to keep up
severe shortages expected in key industrial with the growing demand.
areas, e.g. Gauteng, Mpumalanga, KwaZulu-
Natal, and the Western Cape.
Size of gap
Surplus
Moderate (0 to -20%)
Luvuvhu
Severe (-20% to -80%)
Limpopo and Letaba
Crocodile Olifants
(West) and
Inkomati
Marica
! Johannesburg
Lower Vaal Upper Vaal
Middle Vaal Usutu to
Mhlathuze
Thukela
Mvoti to
Lower Orange Upper Orange Umzimkulu ! eThekwini
(Durban)
Olifants/ Mzimvubu to
Doorn Keiskamma
Fish to
Keiskamma
Berg Gouritz
Cape Town !
Breede
N
0 30 60 120 180 240
Kilometers
Figure 3: The gap between existing water supply and projected demand by 2030 in South African
catchment areas
In order to address water scarcity and provide population and economic growth. However, with a
reliable water and sanitation to all people, budgeted funding of only R56.6 billion in 2017,
businesses, and industries in South Africa, it is there are significant shortfalls in available
estimated that ~R90 billion per year of funding for infrastructure within the public sector
investment is needed in water and sanitation (i.e. R33.3 billion in 2017), as shown in Table 1 (DWS
infrastructure over the next 10 years (DWS 2017a). 2017a). This represents a significant opportunity
This includes refurbishing and upgrading existing for investors, as outlined in Section 4.4.
infrastructure, and new infrastructure to support
8 Water: Market Intelligence Report 2019Table 1: Required and available public sector funding for water services
infrastructure in 2017
Water Services Infrastructure Elements Required funding Budgeted funding
(R bn) (R bn)
Municipal water infrastructure 27.8 17.1
Regional bulk (potable) infrastructure 10.1 7.4
Regional bulk (non-potable) infrastructure 7.0 4.0
Water resources infrastructure 25.5 14.9
Total water infrastructure 70.4 43.4
Sanitation infrastructure 19.5 13.2
Total water services infrastructure 89.9 56.6
Funding shortfall (2017) 33.3 37%
2.2. Western Cape context
The Western Cape Province, in the south-west corner of South Africa, falls predominantly within two
water management areas (WMAs), the Breede-Gouritz and the Berg-Olifants (Figure 4). Irrigation to
support agriculture constitutes the main water use in these two WMAs, followed by urban water use.
Western Cape Province
Limpopo
Olifants
Inkomathi
Usuthu
Johannesburg
Vaal
Pongolo
Mzimkulu
Orange eThekwini
(Durban)
Mzimvubu-
Berg Tsitsikamma
Olifants
Breede
Cape Town Gouritz !
N
0 30 60 120 180 240
Kilometers
Figure 4: Water Management Areas in South Africa (Western Cape outlined in black)
Water: Market Intelligence Report 2019 9The province has been affected by the recent 2.2.1. Western Cape Water
drought, and water scarcity continues to pose Supply System
a significant challenge in many parts of the The Western Cape Water Supply System
province. The Western Cape Government (WCWSS), which supplies water to several
regularly assesses the risk level of each municipalities within the Berg-Olifants WMA,
municipality. For more up-to-date information, is one of the most important supply systems
please consult the Western Cape Government in the country. It supplies water to a region that
website4, which provides the risk status of towns produces 84% of the province’s gross domestic
and municipalities in the province, as shown product (GDP) and approximately 11% of national
in Figure 5 (accessed in October 2018). GDP (Quantec 2017).
Western Cape Towns Water Security Map Legend
!
( Low
!
( Medium
!
( High
High Risk: Water Demand and Availability under
threat that requires urgent interventions in resource
development and infrastructure establishment.
Medium Risk: Water Demand and Availability under
restriction due to lack of assurance of supply and/or
lack of infrastructure and/or exceeding lawful allocation.
Low Risk: Water Demand and Availability not at risk
Lutzville
!
(
Vredendal
!
(
Klawer
!
(
Murraysburg
!
(
Lamberts Bay
!
(
Graafwater !
( !
(
Clanwilliam Wuppertal
!
( Beaufort West
!
(
Redelinghuys Citrusdal
!
( !
(
Merweville
±
Dwarskersbos Eendekuil
Stompneus Bay !
( !
( !
(
!
(!
( Velddrift !
( Leeu-Gamka
Paternoster !
( !
( Aurora Prince ! (
!
(
Louwville Vredenburg Piketberg Albert
!
(
!
( !
( Road
Saldanha
!
( !
( Langebaanweg Porterville !
(
!Langebaan
Jacobsbaai ( !
(
!
( ( Hopefield
!
Churchhaven ! Moorreesburg !
( ( Matjiesfontein !
( Prince Albert
Gouda Tulbagh !
( Laingsburg !
(
Yzerfontein ( !
! ( Touwsrivier
!
( Riebeek-Kasteel
!
(! Wolseley !
(
Darling !
( ( !
(
Riebeek-Wes !
( !
( Ceres De Doorns Ladismith De Rust
!
( !
( Calitzdorp
Malmesbury Hermon !
( !
( Oudtshoorn
!
(
Wellington Worcester Zoar ! (
!
(
Volmoed ! (
Dysselsdorp Uniondale
!
( !
( !
( !
(
Paarl Van Wyksdorp Haarlem
!
(
Klapmuts Robertson !
( !
( 1 : 3 000 000
!
(
!
( !
( ( Ashton
! Barrydale Karatara
Cape Town Stellenbosch McGregor Bonnievale Ruitersbos
!
(
!
( !
( !
( George !
( Plettenberg
!
Pniel
( Franschhoek !
( !
( Suurbraak Herbertsdale !
( Groot !( Sedgefield Wittedrif Data Source:
!
( Buffelsjagrivier !
( !
( ( Bay ! (
Villiersdorp !(!Bereaville
(!
( !
( !( Heidelberg !
(
Brandwag !
( ! ! !
(
( Brakrivier Wilderness ( Knysna !
! !
( Natures Dept of Water and Sanitation
Genadendal Greyton Swellendam !
( ( Riversdale
! Mossel Bay
( Klein
Valley
Grabouw ! !
( Riviersonderend ( Slangrivier
! !
( Dept of Local Government
( Albertinia ! Dana Bay !
( !
( Brakrivier
Botrivier !
( ( Caledon Klipdale
! Malgas
( Dept of Agriculture
Betty's Bay !
(
!
( Protem !
( Stilbaai !
(
!
( !
( Onrus Witsand !
( Vlees Bay
Hawston !
(Fisherhaven
!!
( ! Napier !
(
( ( !
(
Vermont Hermanus !
(
De Kelders ! Elim ( Bredasdorp
!
(
! Gans Bay !
(
(
(!
!( Arniston
Franskraal ! ( !
(
Strand Pearly Beach
L'Agulhas
(!
!(
Struis Bay Source: Esri, DigitalGlobe, GeoEye, Earthstar Geographics, CNES/Airbus DS, USDA, USGS,
AeroGRID, IGN, and the GIS User Community
Figure 5: Drought status of Western Cape municipalities (accessed in October 2018)
4
https://www.westerncape.gov.za/general-publication/latest-western-cape-dam-levels
10 Water: Market Intelligence Report 2019Figure 6: Municipalities supplied by the Western Cape Water Supply System (WCWSS)
As shown in Figure 6, the WCWSS is a complex, In 2014/15 (pre-drought) the total annual
interlinked system of dams, pipelines, and consumption within the WCWSS was estimated
distribution networks. The system supplies to be 547 million kl (m3). The total water
water to CoCT, West Coast District Municipality allocation for the system is 609 million m3 per
(which supplies water to Swartland, Saldanha year, which is allocated to various end users
Bay, and Bergrivier local municipalities), (Figure 7).
Stellenbosch Local Municipality, and certain
agricultural users.
Mm3/YEAR
358 URBAN: CITY OF CAPE TOWN
216 AGRICULTURAL (CAPPED)
23 URBAN: WEST COAST
4 URBAN: OVERBERG WATER
3 URBAN: STELLENBOSCH
2 URBAN: DRAKENSTEIN
2 URBAN: PIKETBERG
2 OTHER
Figure 7: Overview of WCWSS allocations by type
Water: Market Intelligence Report 2019 11Approximately two-thirds of the allocation is The drought, which is linked to below-average
for urban use (including residential, commercial, rainfall, particularly in 2016 and 2017, has placed
and industrial use), and the remainder is additional strain on the WCWSS. In March 2017 and
allocated for irrigation, which is used in the April 2018 the WCWSS dams reached their lowest
summer months (DWS 2015). Even without making levels in recorded history (~20% of capacity),
provision for the ecological reserve, the total narrowly avoiding the need for extreme water
allocations exceed the revised system yield of rationing. By the end of the 2018 hydrological year
545 million kl per year (DWS 2018). There are no (31 October 2018), the WCWSS dam levels had
further opportunities to build additional large recovered to ~75%. Future projections indicate that
dams to augment the supply (DWS 2015). even if demand returns to 2015 (pre-drought) levels
Consequently, even prior to the drought, the and rainfall remains at 2016-2017 levels (lowest in
system was considered to be constrained. recorded history), the dams are unlikely to fail to
meet demand before the end of 2020 (Figure 9,
CSAG 2018).
1 000k
dam storage [million litres]
750k
500k
250k
0
2008 2010 2012 2014 2016 2018 2020
Year
Most recent value on: 30 Oct 2018 Data: City of Cape Town, Figure: © Climate System
Analysis Group, University of Cape Town
Figure 8: Historical water stored (thin line) and projected future storage (thick line) in the six
largest dams in the WCWSS, assuming 2015 demand and 2016-2017 rainfall5
2.2.2. Long-term planning
The climate projections for the Western Cape
indicate a warming trend as well as projected Water scarcity will continue to be
drying in many areas, with longer time periods a challenge for the Western Cape,
between increasingly intense rainfall events and presents a ‘new normal’ of
(DEADP 2014). It also remains to be seen whether which government, business, and
the drought represents a ‘step-change’ in the
citizens have to be aware.
rainfall patterns (such as was experienced by
Perth in the 1970s), or whether the decrease in
average annual rainfall will occur gradually.
5
To model various scenarios, visit: http://cip.csag.uct.ac.za/monitoring/bigsix.html
12 Water: Market Intelligence Report 2019Population and economic growth will place an per year by 2040. As shown in Figure 10
additional burden on water supply systems, (GreenCape analysis), the supply deficit in 2025
which in turn will have a negative impact on the will be most keenly felt in the agricultural sector,
province and consequently the country’s accounting for 87% of the total deficit. However,
economy, and particularly the contribution of the this picture changes dramatically by 2040, with
agricultural sector 6. Water scarcity will continue an almost even split between the supply deficit of
to be a challenge for the Western Cape, and the urban and agricultural requirements, driven
presents a ‘new normal’ of which government, largely by population growth in the City of Cape
business, and citizens have to be aware. Town. This future water supply deficit is projected
to cost the region more than R146 billion and
In the Berg water management area (which almost 650 000 jobs per year by 2040 if no new
includes areas supplied by the WCWSS), water water resources are developed (Figure 11)
demand is expected to grow by 45% by 2040 due (GreenCape analysis). The opportunity costs for
to population increases and climate change CoCT, at R100 billion per year, far outstrip any
(GreenCape analysis). Barring any additional other municipality; therefore it represents a key
allocations or augmentation schemes, the water market for investment in the region.
supply deficit is forecast to be ~300 million kl (m3)
180
160
140
120
million m3 per year
100
80
60
40
20
0
2025 2025 2040 2040
Urban Agricultural Urban Agricultural
deficit deficit deficit deficit
Bergrivier Drakenstein Stellenbosch Witzenberg
Cape Town Saldanha Bay Swartland
Figure 9: Projected urban and agricultural supply deficit in the Berg water management area
6
The GVA of agriculture in the Western Cape is ~R19 billion (22% of South Africa’s agricultural GVA) and export revenues exceed R40
billion per year. Around 216 000 people are employed in primary agriculture and 250 000 in agri-processing in the province (Jacobs 2017).
Water: Market Intelligence Report 2019 13Planned water augmentation projects for the WCWSS.
160000
140000
120000
100000
2015 R millions
80000
60000
40000
20000
0
Value of 2025 Value of Value of 2040 Value of
Urban deficit 2025 Agriculture Urban deficit 2040 Agriculture
deficit deficit
Bergrivier Drakenstein Stellenbosch Witzenberg
Cape Town Saldanha Bay Swartland
Figure 10: The projected value of future water supply deficits in the Berg water management area.
In order to address future water constraints, demand projections under different scenarios
reconciliation studies are conducted to reconcile (Scenario 1 being applicable to the graph). Solid
the gap between future demand and supply. The fills show the planned water supply interventions,
WCWSS reconciliation strategy study was along with their height (or stacked thickness)
completed in 2007, and annual status updates indicating the estimated yields for the different
are produced by DWS. interventions. These interventions include potable
water reuse (from wastewater treatment plants),
The draft annual update for 2018 compares groundwater development (new resources and
several future water balance assessment artificial recharge), and large-scale permanent
scenarios. Figure 11 presents the scenario seawater desalination. In this regard, long-term
considered to be the most realistic base scenario plans have been in place for several years, but
without additional water conservation and many of the planned projects are now being
demand management interventions, and brought forward and re-assessed in light of the
assumes a projected 2% p.a. growth rate in water drought. Section 4.4.2 outlines in more detail
demand (DWS 2018). Dashed lines show water some of the planned projects for the WCWSS.
14 Water: Market Intelligence Report 2019Water Requirements (million m3/a)
Figure 11: WCWSS planning scenario reconciliation of supply and demand
(A larger version of this figure is available on request)
© Bruce Sutherland
Water: Market Intelligence Report 2019 15© Bruce Sutherland 16 Water: Market Intelligence Report 2019
3
       Policies and regulations
                  This section provides an overview of the regulatory environment
                                     in the urban water sector7.

3.1. National legislation                                                     Schedule 1 of the NWA are allowed to use
                                                                              groundwater on their properties for reasonable
3.1.1. The National Water Act7                                                domestic use without a licence8. Businesses that
The National Water Act, Act No 36 of 1998 (NWA)                               want to use groundwater must either register the
regulates and protects water resources (including                             use(s) under a general authorisation (GA) with
surface water and groundwater) and has                                        DWS (which typically takes a few weeks), or must
effectively transferred all water ownership to the                            apply for a water use licence with DWS (which
state. Water is a national competence, and the                                takes up to 300 working days). In order to qualify
primary responsible authority is the Department                               for GA registration, the user must comply with all
of Water and Sanitation (DWS).                                                the conditions listed in the relevant GA. For
                                                                              example, in the case of the GA for the Taking and
The NWA regulates 11 different ‘uses’ of water,                               Storing of Water (published 2 September 2016),
such as taking water from a resource, storing                                 one of the conditions limits the volume of water
water, and discharging waste or effluent into a                               that can be abstracted per year. Figure 13 shows
water resource. It is particularly relevant to                                the maximum groundwater abstraction rates for
alternative water supply projects, including                                  the Western Cape for this GA9.
ground water use. Residents who fall under

                                                                                                                               © GreenCape

7
    The section does not comprehensively cover all relevant legislation; it highlights key information that may be useful to potential investors.
8
    Municipalities may still require registration of boreholes or well points – see Section 3.2.3.
9
  In addition to these limits, no more than 40 000 m3 may be taken in terms of the general authorisation per year on a property, regardless
of location.

Water: Market Intelligence Report 2019                                                                                                              17
Figure 12: Maximum groundwater abstraction rates permitted under the General Authorisation
for Taking and Storing Water (2016)
Seawater desalination does not require 3.1.3. National Environmental
permission from DWS for abstraction, provided it Management: Waste Act
is not located in an estuary or river mouth. Under the national norms and standards for
Similarly, discharge of brine to the ocean does disposal of waste to landfill, from August 2019
not require permission from DWS. However, a liquids can no longer be sent to landfill in SA.
coastal water discharge permit is required from From 2021 this will also apply to brine or waste
the Oceans and Coasts Branch10 of the with a high salt content (>5%) and a leachable
Department of Environmental Affairs. concentration for total dissolved solids of more
than 100 000 mg/l.
3.1.2. The National Building Regulations
and Building Standards Act 3.1.4. Other key national legislation and
In terms of design and construction, water standards
systems must be consistent with the National Other key national laws and regulations that may
Building Regulations (NBRs) under the National be relevant to projects in the water sector include:
Building Regulations and Building Standards Act,
Act 103 of 1977, which governs all building and ■ Water Services Act, Act 108 of 1997 (relevant to
construction work in South Africa. At present, the the regulation of water and sanitation services
NBRs do not include provisions relating to water provided by municipalities);
efficiency or alternative water supply; however, ■ South African National Standard for Drinking
the Department of Trade and Industry (dti) has Water (SANS 241: 2015);
initiated the process to include these aspects. It is ■ National Environmental Management Act, Act
unclear how long this process will take, but draft 107 of 1998 (relevant to environmental
water efficiency standards are being developed authorisations); and
that will be released for public comment in 2019. ■ Industrial Policy Action Plan (highlights water
and sanitation as a key sectoral focus area).
10
www.environment.gov.za/branches/oceans_coast
18 Water: Market Intelligence Report 2019It should be noted that during emergency the maximum discharge limits for various water
situations (e.g. disasters due to drought) certain quality parameters, and the requirement for an
authorisations can be fast-tracked or are no industrial discharge permit. Wastewater that
longer required. exceeds the water quality limits may incur
surcharges, or denial of a permit to discharge
Further information can be obtained from the to sewer.
responsible authorities.
3.2.1. Water restrictions
3.2. Municipal by-laws The national Department of Water and Sanitation
and tariffs (DWS) is responsible for imposing restrictions on
Municipalities have the constitutional different user categories in catchments facing
competence to enact laws (known as by-laws) water supply constraints. Municipalities then
in respect of water and sanitation services. pass these restrictions on to their water users.
Restriction levels impose volume limits, time
The Department of Water Affairs and Forestry limitations, and bans on certain types of water
(DWAF), as it was known at the time, developed use in order to decrease demand during periods
model water services by-laws for municipalities. of water insecurity. Restriction levels and their
The model by-laws included provisions to requirements vary from municipality to
empower municipalities to prevent wasteful use municipality. Most municipalities have up to five
of water, impose water restrictions, require large restriction levels – the higher the restriction level,
users to submit annual water audits, and specify the greater the limitations imposed. Water
standards relating to the quality of fittings. The restrictions are currently in place in most of the
by-laws contained general clauses relating to municipalities in the Western Cape. Up-to-date
water efficiency, but left the specifics to the information can be found on the Western Cape
municipality to decide. Several municipalities Government website11. Refer to the 2018 Water
have developed water by-laws based on these Market Intelligence Report12 for an overview of
model by-laws. how water restrictions have progressed in CoCT.
Municipal by-laws also include provisions relating 3.2.2. Water tariffs
to the discharge of wastewater and industrial Municipalities either purchase untreated raw
effluent to sewer. Such provisions may include water taken directly from dams, springs, rivers
© City of Cape Town
11
www.westerncape.gov.za/general-publication/latest-western-cape-dam-levels
12
https://www.greencape.co.za/market-intelligence/
Water: Market Intelligence Report 2019 19and boreholes, or purchase bulk water that is Municipalities generally use a rising block
usually treated to a potable standard from bulk (stepped) tariff structure, where R/kl tariffs
water providers, e.g. Water Boards. The CoCT and increase as usage increases. However, in some
other municipalities in the WCWSS purchase raw cases a fixed volumetric rate (R/kl) applies, e.g.
water from DWS-owned dams and then treat the CoCT’s commercial and industrial water and
water in municipality-owned facilities. In 2015/16, sanitation tariffs. In addition, the tariffs are often
raw water charges (which include water linked to restriction levels, with tariffs increasing
management and infrastructure charges, and a as restrictions increase. Table 2 and Table 3
water research fund levy) averaged R1.98/kl outline the water and sanitation tariffs (excluding
nationally (DWS 2017a). The bulk water tariffs fixed charges and surcharges) for various metros
averaged R7.44/kl, varying from R4.18/kl to R15.86/ under minimum restriction levels13. CoCT’s tariffs
kl. The tariff would depend on various factors, for Level 5 (L5) restrictions are included for
such as the availability of water, water quality comparison with their Level 1 (L1, minimum
and distance of distribution (DWS 2017a). restrictions) tariffs. Sanitation charges are often
based on an assumed discharge rate that is
Municipalities then distribute potable water to linked to water consumption. For example, in
their consumers and charge a retail tariff. Cape Town the residential sewage volumes are
Revenue from water sales accounts for around by default assumed to be 70% of the water
13% of municipal operating revenue (DWS 2017a). consumed. Table 4 outlines the default
percentages applied in each metro. For the
Each municipality is responsible for setting its latest tariffs, refer to the metro websites.
own tariffs, in terms of which it may differentiate
between users. In general, most municipalities
have separate tariffs for residential, commercial
and industrial water users, and will provide a free
basic allowance of water to indigent households.
In South Africa, around 56% of households do not
pay for water and sanitation services (in 2015),
because they are either unable (indigent) or
unwilling to do so (StatsSA 2016a).
Table 2: Water tariffs for selected metros (minimum restriction levels in place) for FY 2018/19
Cape Town L1 Cape Town L5 eThekwini Tshwane L1 Ekurhuleni Johannesburg
Monthly R/kl Monthly R/kl Monthly R/kl Monthly R/kl Monthly R/kl Monthly R/kl
use (kl) use (kl) use (kl) use (kl) use (kl) use (kl)
Step 1 0-6 12.85 0-6 21.19 0-6 18.63 0-6 10.55 0-6 10.21 0-6 8.28
Step 2 6-10.5 17.13 6-10.5 34.43 6-25 22.01 7-12 15.05 7-15 16.82 6-10 8.79
Step 3 10.5-35 22.78 10.5-35 52.39 25-30 29.30 13-18 19.77 16-30 20.60 10-15 15.00
Residential
Step 4 >35 39.39 >35 300.00 30-45 45.21 19-24 22.87 31-45 25.63 15-20 21.83
Step 5 >45 49.73 25-30 26.14 >45 31.60 20-30 29.98
Step 6 31-42 28.25 30-40 33.22
Step 7 43-72 30.23 40-50 42.42
Step 8 >72 32.37 >50 45.19
Step 1 0- 22.28 0-5000 22.06 0-200 38.39
Commercial
& Industrial
100000
Step 2 Not Not Not 10001- 21.14 5001- 22.41 >200 40.49
22.78 37.50 29.12
stepped stepped stepped 100000 25000
Step 3 >100000 19.70 >25000 23.38
13
The residential tariffs are for non-indigent, single dwelling houses (post-paid). The sanitation charges exclude any industrial effluent
surcharges if effluent exceeds discharge limits. Sanitation charges apply to an assumed sewage discharge volume that is linked to water
consumption, as shown in Table 4.
20 Water: Market Intelligence Report 2019Table 3: Sanitation tariffs for selected metros (minimum restriction levels in place) for FY 2018/19
Cape Town L1 Cape Town L5 eThekwini Tshwane Ekurhuleni Johannesburg
Monthly R/kl of Monthly R/kl of Monthly R/kl of Monthly R/kl of Monthly R/kl of Property R (Res)
water sewage water sewage water sewage water sewage water sewage size (m2) or R/kl
use (kl) use (kl) use (kl) use (kl) use (kl) (C&I)
Step 1 0-6 11.29 0-6 16.93 0-6 3.25 0-6 7.46 0-6 14.68 0-300 194.67
Step 2 6-10.5 15.05 6-10.5 30.25 6-25 5.41 7-12 10.07 7-15 11.74 301-1000 378.95
Step 3 10.5-35 20.47 10.5-35 45.15 25-30 10.35 13-18 12.97 16-30 4.99 1001- 573.29
Residential
2000
Step 4 >35 34.62 >35 108.09 30-45 16.08 19-24 12.97 31-45 4.59 >2000 826.02
Step 5 >45 17.94 25-30 12.97 >45 3.13
Step 6 31-42 12.97
Step 7 43-72 12.97
Step 8 >72 12.97
Step 1 0-5000 9.21
Commercial
& Industrial
Step 2 Not Not Not Not 5001- 4.90 Not
20.47 30.29 8.21 8.31 28.70
stepped stepped stepped stepped 25000 stepped
Step 3 >25000 3.19
Table 4: Percentage of water used that is assumed to be discharged to sewer
Cape Town L1 Cape Town L5 eThekwini Tshwane L1 Ekurhuleni Johannesburg
Monthly % Monthly % Monthly % Monthly % Monthly %
use (kl) use (kl) use (kl) use (kl) use (kl)
Step 1 0-6 95% 0-6 98%
Step 2 6-25 75% 7-12 90%
Step 3 25-30 75% 13-18 75%
Residential
Fixed (post-paid)
Step 4 Not Not 30-45 65% 19-24 60% Not 100%
70% 70%
Step 5 stepped stepped >45 60% 25-30 52% stepped (TBC)
Step 6 31-42 10%
Step 7 43-72 1%
Step 8 >72 1%
C&I Not 95% 95% 90% 80% 100% (TBC) 100% (TBC)
stepped
Water: Market Intelligence Report 2019 21Figure 13 (GreenCape analysis) compares the cost to households for 15 kl of water per month under
CoCT’s Level 1 (L1, minimum restrictions) and Level 5 (L5) restriction tariffs. The figure also compares
these costs to those in other metros in SA.
1200
1000
R/month spend (ex VAT)
800
600
400
200
0
Cape Town L5 Cape Town L1 Ekurhuleni Johannesburg eThekwini Tshwane L1
Volume-based water charges Volume-based sanitation costs Fixed charges
Additional fixed costs for properties >300m2 (costs dependent on size)
Figure 13: Comparison of monthly household water costs for 15 kl/month in 2018/19 across
various metros14
© City of Cape Town
14
The residential tariffs are for non-indigent, single dwelling houses (post-paid). With the exception of CoCT’s Level 5 (L5) tariffs, the tariffs
are for the minimum level of restrictions.
22 Water: Market Intelligence Report 2019Figure 14 (GreenCape analysis) compares the cost to commercial and industrial companies for 20 kl of
water per day, across various metros.
45000
40000
35000
R/month spend (ex VAT)
30000
25000
20000
15000
10000
5000
0
Johannesburg Cape Town L5 Cape Town L1 eThekwini Ekurhuleni – Commercial Tshwane
Volume-based water charges Volume-based sanitation costs Fixed charges
Figure 14: Comparison of monthly costs for commercial and industrial businesses for 20 kl/day in
2018/19 across various metros15
The tariffs are also linked to the principle of cost 15 3.2.3. Alternative water use
recovery of water provision. As municipalities In order to address the absence of national
diversify their water supplies to include more standards for the installation of alternative water
expensive water sources, such as seawater systems (such as greywater, rainwater and
desalination, the additional costs will have groundwater systems), CoCT has developed
to be recovered through increased tariffs.
Consequently, water tariffs are set to continue
to increase in the future. Figure 23 shows that
As municipalities diversify water
CoCT’s water tariffs are on an upward trend,
and their planned water augmentation projects supplies, including more expensive
(Table 8) will likely drive further tariff increases. water sources such as desalinated
CoCT’s future water tariffs are expected to seawater, these additional costs
become more predicable over the next 2-3 years. will have to be recovered through
rising tariffs.
15
Surcharges, e.g. industrial effluent surcharges if effluent exceeds discharge limits, are excluded. With the exception of CoCT’s Level 5
(L5) tariffs, the tariffs are for the minimum level of restrictions.
Water: Market Intelligence Report 2019 23© GreenCape
summary installation guidelines16. The guidelines The CoCT Water Amendment By-law also
outline the required measures to protect the requires that all new developments install
municipal supply and the water users within water-saving measures or alternative water
the property, in line with the CoCT’s Water systems, as well as sub-metering of multi-
Amendment By-law 2018. They also highlight unit properties.
that approvals are required from the CoCT
for all plumbing installations for alternative 3.3. Municipal procurement
water systems. Municipal procurement is regulated by the
Municipal Finance Management Act No. 56
The Water Amendment By-law stipulates that of 2003 (MFMA) and its regulations, including
only municipal potable water can be used for the Municipal Supply Chain Management
drinking, ablution and culinary purposes. Regulations (2005). These regulations specify
However, businesses and residential the minimum requirements, but municipalities
developments can use alternative water are allowed to apply stricter standards.
for these purposes if they enter into a contract National Treasury also sets further
requirements. The MFMA outlines the
competitive procurement processes, and
unsolicited bids are not encouraged.
All new developments in Cape Town
are required to implement water As stipulated by National Treasury (2017), for
projects worth more than R30 000, but less than
savings measures or alternative
R50 million (incl. VAT), the price contributes 80
water systems, as well as sub- points of the total score and the Broad-based
metering in multi-unit properties. Black Economic Empowerment (B-BBEE)17 status
contributes 20 points. For projects above R50
million, the price contributes 90 points and
B-BBEE status 10.
with CoCT to become a Water Services
Intermediary. The contract outlines various Municipalities can also specify prequalification
conditions that must be adhered to, including criteria to limit the competition to certain groups.
water quality monitoring and compliance. These groups include companies with higher
16
http://cct.gov.za/bC2nV
17
More information on B-BBEE and procurement can be found here: www.greencape.co.za/assets/Uploads/
Wesgro-B-BBEE-Info-Sheet-2018.pdf
24 Water: Market Intelligence Report 2019B-BBEE scores, exempted micro enterprises 3.3.2. Procurement in emergency
(EMEs18) and qualifying small enterprises (QSEs)19. situations
Section 55(2) of the Disaster Management Act
3.3.1. City of Cape Town procurement (2002) states that ‘if a local state of disaster has
Companies wishing to do business with CoCT must been declared…the municipal council concerned
first register with the City’s supplier database and may…make by-laws or issue directions, or
the national Central Supplier Database (CSD). authorise the issue of directions, concerning…
For goods and services less than R200 000, emergency procurement procedures’. These
CoCT publishes Requests for Quotations (RFQs) powers may be exercised only to the extent that
on its procurement portal20. Companies must it is necessary for the purpose of assisting and
first register as a supplier and then register protecting the public, providing relief to the
on the portal. public, protecting property, preventing or
combating disruption, or dealing with the
For goods and services exceeding R200 000 (VAT destructive and other effects of the disaster.
included), a formal bidding (tender) process is
required. Companies must be registered as a
supplier and registered on the tender portal21 New Technology Platform
where tenders are advertised. Tenders are also CoCT has set up a New Technology
advertised in local newspapers. For tenders Platform to gain an understanding of
valued at more than R10 million there is a more innovative water technologies in the market.
extensive process, including additional It gives companies the opportunity to
documentation requirements. present their products and services to
government in a fair manner. For information
For more information on the procurement on how to submit information to the
processes, please visit the CoCT website22. The list committee, please contact
of tenders received by the City, and their prices, Water.NewTechnology@capetown.gov.za.
can be viewed here23.
© Western Cape Department of Agriculture
18
Enterprises with an annual turnover of less than R10 million, or recently formed or incorporated entities that have been in operation for
less than one year.
19
A business with an annual turnover of more than R10 million but less than R50 million.
20
http://web1.capetown.gov.za/web1/procurementportal
21
http://web1.capetown.gov.za/web1/TenderPortal
22
https://goo.gl/zAjjhj
23
http://www.capetown.gov.za/Work%20and%20business/Doing-business-with-the-city/Tenders-RFQs-and-supply/Tenders-received
Water: Market Intelligence Report 2019 25© GreenCape 26 Water: Market Intelligence Report 2019
4
                 Opportunities and
                     barriers
    Water scarcity is a major challenge in South Africa that also represents a
  substantial opportunity for investors and businesses in the urban water sector.

In this section, investment opportunities and        distribution or procurement channels for water
associated drivers and risks are discussed in        technologies and service providers are fairly
relation to the four key urban water markets in      distinct between the markets. Investors and
South Africa: i.e. commercial and industrial         water technology providers interested in specific
(Section 4.1), residential (Section 4.2), new        market segments can find the relevant
property developments (Section 4.3), and             information on each of these markets in the
municipalities (Section 4.4).                        summary table (Table 5), and detailed analysis
                                                     in the sections below.
While there is some overlap in the technologies
that target these markets, the realisable market     The focus of the market information is on
opportunities are predominantly determined by        the Western Cape, but where readily available,
policies and regulations, and the cost of water in   information for elsewhere in the country
each market segment. Furthermore, the                 is provided.

 © Bruce Sutherland

Water: Market Intelligence Report 2019                                                                27
Table 5: Summary of market opportunities
Market Market size Main Key market
indicators opportunities segments
Industrial & ■ R14bn spent on ■ Metering & ■ SA industrial market:
commercial municipal water & monitoring food & beverages
(Section 4.1) sanitation services ■ Water efficient sector gross fixed
in SA (2018) technologies capital formation
■ Reuse and ~R14bn by 2021
alternative water
treatment systems
■ Brine management
solutions
Residential ■ 7.4m households ■ Water efficient ■ 3.5m households in
(Section 4.2) collectively spent devices SA earning >R200k
R22bn on municipal ■ Alternative water per annum
water & sanitation systems
services in SA (2018)
New property ■ R2.1bn spent on wet ■ Metering & ■ City of Cape Town,
developments services (2018) monitoring Tshwane and
(Section 4.3) ■ No. of green ■ Water efficient Johannesburg:
buildings certified technologies ~50% of the private
increased from 4 ■ Reuse and alternative sector market
(2010) to ~100 (2018) water treatment
systems
Municipal SA's largest water ■ Water augmentation Metros and large
(Section 4.4) market: (e.g. wastewater municipalities, e.g.:
■ R30bn p.a. water reuse & desalination) ■ Cape Town’s R5.8bn
& sanitation ■ Non-revenue water (417MLD) new water
infrastructure reduction (R6.3bn programme
budget (2017) p.a. in lost revenue ■ eThekwini’s planned
■ Further R17bn p.a. in SA) 385 MLD reuse and
needed desalination PPPs
4.1. Industrial and commercial across Southern Africa, many of which face
markets significant water challenges (see Section 2). This
section highlights some of the market demand
4.1.1. Market overview trends observed during the drought, which
Commercial and industrial (C&I) businesses provide valuable insights into investment
reliant on municipal water and sanitation opportunities in the rest of South Africa.
services in SA collectively spent an estimated R14
billion on these services in 2018. This represents In the City of Cape Town, commercial water use
an opportunity for investors and technology averaged ~2.1 million kl/month before the drought
providers to offer solutions to offset these costs, (July 2015) and by February 2018 had dropped by
and to de-risk supply. ~10% to ~1.9 million kl/month. Industrial water use
dropped by 30% over this period, from ~800,000
The recent drought opened up the C&I market in kl/month to ~500,000 kl/month (CoCT 2018a). In
the Western Cape. While there is continued 2018, commercial and industrial businesses in
demand for innovative solutions in the province, Cape Town spent an estimated R2.5 billion on
the broader opportunities lie in other metros municipal water and sanitation charges,
28 Water: Market Intelligence Report 2019compared to ~R1 billion in 2015 (GreenCape analysis, CoCT data). Commercial companies
analysis)24. Future annual costs (under AADDs range between ~18 and 600 kl/day, and
minimum restriction levels), are likely to fall the combined usage is ~16 600 kl/day (16.6 MLD),
in-between these two values, as new water which is ~25% of the total water consumed by all
augmentation projects will increase tariffs commercial users in the City. The majority of the
above pre-drought levels. 300 largest commercial users use less than 80 kl/
day, with only 43 sites using more than this. These
Figure 15 shows a breakdown of the 300 largest 43 sites account for ~7 500 kl/day (7.5 MLD) or
commercial water consumers in Cape Town, ~11% of the total commercial water demand in
based on annual average daily demand (AADD) Cape Town.
during the drought, as of March 2018 (GreenCape
200
185
180
160
No. of commercial water users
140
120
100
80
60
47
40
25
20 18
10
5 5 5
0
(18-20) (20-50) (50-80) (80-110) (110-140) (140-170) (170-200) >200
Average Annual Daily Demand (kl/day)
Figure 15: Commercial water use in Cape Town (top 300 users), based on annual average daily
demand as of March 2018
Figure 16 shows a breakdown by property type of the annual average daily demand of the 300 largest
commercial water users in Cape Town (GreenCape analysis, CoCT data). The numbers show the number
of sites that fall under the relevant property type. Note that some of the properties in the warehouse/
workshop category might be considered industrial businesses, but have been classified as commercial
water users by CoCT.
24
These costs only relate to volumetric charges (R/kl including VAT) paid for water and sanitation in the course of the year. They exclude
all other water and sanitation charges, such as wastewater surcharges and fixed charges. It was assumed that sanitation volumes are
calculated as 95% of water consumed onsite, which is the default for businesses in CoCT. It was assumed that the C&I water usage re-
mained at the February 2018 consumption levels throughout 2018, and the July 2015 levels throughout 2015.
Water: Market Intelligence Report 2019 29You can also read