SUSTAINABLE AGRICULTURE 2019 MARKET INTELLIGENCE REPORT - GREENCAPE
←
→
Page content transcription
If your browser does not render page correctly, please read the page content below
Sustainable Agriculture

  2019
  Market Intelligence Report

Sustainable Agriculture: Market Intelligence Report 2019   i
ii Sustainable Agriculture: Market Intelligence Report 2019
GreenCape
GreenCape is a non-profit organisation that works at the interface of
business, government and academia to identify and remove barriers to
economically viable green economy infrastructure solutions. Working in
developing countries, GreenCape catalyses the replication and large-scale
uptake of these solutions to enable each country and its citizens to prosper.

Acknowledgements
We thank Inge Kuschke (lead author), Adila Cassim and Catherine Pineo for
the time and effort that went into compiling this market intelligence report.

Disclaimer
While every attempt was made to ensure that the information
published in this report is accurate, no responsibility is accepted
for any loss or damage to any person or entity relying on any of the
information contained in this report.

Copyright © GreenCape 2019

This document may be downloaded at no charge from
www.greencape.co.za. All rights reserved.

Subscribe to receive e-mail alerts or GreenCape news, events
and publications by registering as a member on our website:
www.greencape.co.za

Cover image courtesy of: Western Cape Department of Agriculture

18 Roeland Street, Cape Town, 8001, South Africa

Authors:                Inge Kuschke and Adila Cassim
Editorial and review:   Cathy Pineo, Salomé Bronkhorst and Nicholas Fordyce
Images:                 GreenCape, Western Cape Department of Agriculture
                        and Catherine Pineo
Layout and design:      Tamlin Lockhart Art Direction

Sustainable Agriculture: Market Intelligence Report 2019                        iii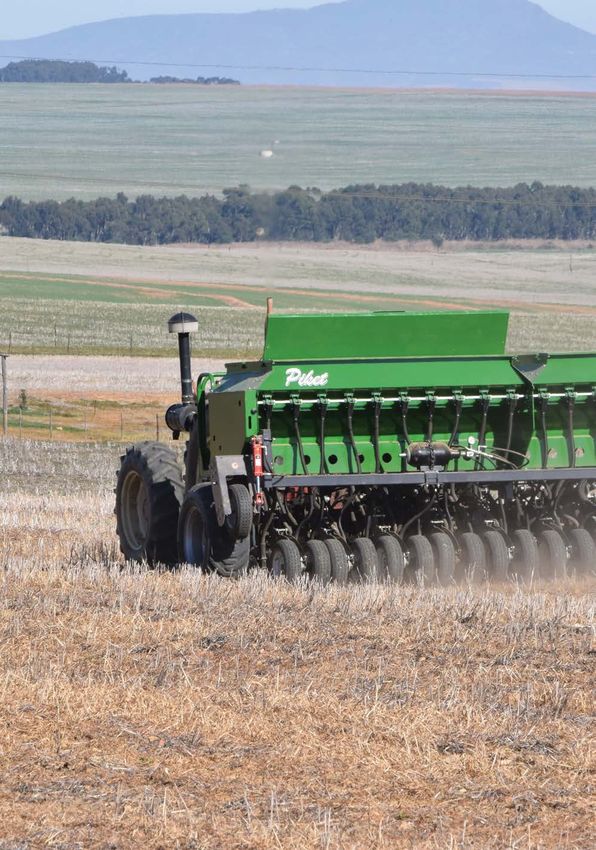
Contents

Executive summary                                                                                             1
What’s new?                                                                                                  3
1. Introduction and purpose                                                                                  4
2. Sector overview                                                                                           6
   2.1. Physical geography and climate                                                                       6
		      2.1.1. Western Cape agriculture                                                                      6
   2.2. Overview of the agricultural economy                                                                  7
		      2.2.1. South African agriculture                                                                      7
		      2.2.2. Western Cape agriculture                                                                      9
   2.3. Key players                                                                                          11
   2.4. Drivers of sustainable technologies and approaches in agriculture                                   12
3. Policies and regulations                                                                                 14
   3.1. South Africa’s agricultural policies and regulations                                                14
   3.2. Water                                                                                               15
		      3.2.1. Water policy updates for agriculture                                                         15
		      3.2.2. Water policy impacts and implications                                                        15
		      3.2.3. Other water rights updates                                                                   15
   3.3. Carbon tax                                                                                          16
   3.4. Integrated Resource Plan                                                                            16
   3.5. Land reform                                                                                         16
		      3.5.1. Land reform policy updates                                                                   16
   3.6. Conservation agriculture updates                                                                    19
		      3.6.1. Policy impacts and implications                                                              19
   3.7. Climate smart agriculture                                                                           19
		      3.7.1. Climate smart agriculture policy updates                                                     19
		      3.7.2. Policy impacts and implications                                                             20
4. Opportunities and barriers                                                                              22
   4.1. Market updates for 2019                                                                            23
   4.2. Precision agriculture: Using remote sensing technologies for resource efficient farming            27
		 4.2.1. Overview                                                                                         27
		      4.2.2. Market size                                                                                 28
		      4.2.3. Local market players providing agricultural remote sensing services                         33
		      4.2.4. Barriers and risks                                                                          33
   4.3. Undercover farming                                                                                 33
		 4.3.1. Overview                                                                                         33
		      4.3.2. Market size                                                                                 35
		      4.3.3. Barriers and risks                                                                          35
5. Funding and Incentives                                                                                  40
   5.1. General database web page                                                                          40
		      5.1.1 Green finance database                                                                       40
		      5.1.2 Government funding and incentive database                                                    40
		      5.1.3 Finfind database                                                                             40
		      5.1.4 AlliedCrowds database                                                                        40
6. The Western Cape: Africa’s growing greentech hub                                                        42
7. GreenCape’s support to businesses and investors                                                         46
8. References                                                                                              50

iv                                                     Sustainable Agriculture: Market Intelligence Report 2019
List of figures

Figure 1:
South African agricultural regions                                                      6
Figure 2:
Proportion of agricultural commodities produced in the WC                                7
Figure 3:
South African GDP from agriculture (ZAR million per quarter)                             8
Figure 4:
Change in irrigation system for wine production in South Africa                         9
Figure 5:
Fruit and wine value of exports in the WC                                               10
Figure 6:
Opportunities highlighted in the 2019 Agricultural MIR                                  22
Figure 7:
Solar PV currently installed in Western Cape agriculture (in green) and the predicted
uptake (in red). GreenCape analysis (2018).                                             24
Figure 8:
Aspects of precision agriculture and smart farming                                      27
Figure 9:
Uptake of FruitLook use expressed as hectares ordered over time                         32
Figure 10:
Undercover farming and its various forms                                                34
Figure 11:
GreenCape’s focus areas                                                                 47

Sustainable Agriculture: Market Intelligence Report 2019                                 v
List of tables

Table 1:
Key role players in agriculture                                                                           11
Table 2:
Key policies and legislation                                                                              14
Table 3:
Market update for renewable energy                                                                        23
Table 4:
Market update for conservation agriculture                                                               26
Table 5:
Estimated value of bespoke services in remote sensing (SA)                                               30
Table 6:
Potential savings (ZAR/ha/season) using remote sensing to improve water efficiency                        32
Table 7:
Global market uptake of selected UF components                                                           35
Table 8:
UF market uptake in the Western Cape                                                                     36

vi                                                   Sustainable Agriculture: Market Intelligence Report 2019
List of acronyms and
               abbreviations
Agtech		      Agricultural technology
APAP		        Agricultural Policy and Action Plan
CA			         Conservation Agriculture
CO2eq		       Carbon Dioxide Equivalent
CSA		         Climate Smart Agriculture
DAFF		        Department of Agriculture, Forestry and Fisheries
DEA		         Department of Environmental Affairs
DWS		         Department of Water and Sanitation
FAO		         Food and Agriculture Organisation
GDP		         Gross Domestic Product
GFT		         Gravel-Flow Technique
GHG		         Greenhouse Gas
Ha			         Hectare
ICT		         Information and Communications Technology
IGDP		        Integrated Growth and Development Plan
IRP		         Integrated Resource Plan
kWh		         Kilowatt hour
LRAD		        Land Redistribution for Agricultural Development
MWp		         Megawatt peak
NDC		         Nationally Determined Contribution
NDP		         National Development Plan
NEMA		        National Environmental Management Act
NGP		         New Growth Path
PA			         Precision agriculture
PLAS		        Proactive Land Acquisition Strategy
ROC		         Remote Operating Certificate
RPAS		        Remotely Piloted Aircraft Systems
SA			         South Africa
SN			         Shade netting
SPLAG		       Settlement Production Land Acquisition Grant
SSEG		        Small-scale embedded generation
UF			         Undercover farming
UN			         United Nations
WC		          Western Cape
WCDoA         Western Cape Department of Agriculture
WCWSS         Western Cape Water Supply System
WMA		         Water Management Area
WUA		         Water Use Association
WWF		         Worldwide Fund for Nature

Exchange rate used
1 USD = R13.20 (avg Jan – Nov 2018)

Sustainable Agriculture: Market Intelligence Report 2019          vii
Executive summary
The South African and Western Cape agriculture sectors offer numerous
opportunities for investors, agricultural and green technology manufacturers,
service providers, distributors, and others in the value chain.
Although agriculture contributes a relatively for companies offering bespoke services in
small share (2.5%) to the total gross domestic aerial-data analytics for farmers. The current
product (GDP) in South Africa (SA), it is important conservative market estimate (from revenue
in providing employment and earning foreign from bespoke services for one company) is
exchange. When taking into account the whole R11 million per season for two commodities
agricultural value chain, the sector is estimated (macadamias and citrus). The estimated
to contribute about 12% to the national GDP. potential value of bespoke services, based
on hectares under high-value export fruit
Water scarcity due to drought, declining rainfall production is R131 million. There are further
and/or an over demand for water, is the key driver opportunities for software developers,
for the uptake of agricultural technology (agtech) and manufacturers and sellers of remote
in SA. SA is ranked as the 30th driest country in sensing hardware.
the world, making water a key constraint to
agricultural development. Although this is an emerging opportunity in
SA, there has been significant uptake
The Western Cape (WC) province of SA overseas. The global agriculture drones
experienced one of the worst droughts on record market for remote-sensing tech and services
from 2014/15 to 2017/18, which resulted in water was ~USD 670 million (R8.8 billion) in 2015, and
restrictions and large economic losses. Despite it is predicted to grow at a compound annual
this, there has been an expansion in land use growth rate (CAGR) of 18.5% to 38% from 2018
under high-value export crops. In the Western to 2023.
Cape, from 2013 to 2017, there was growth in the
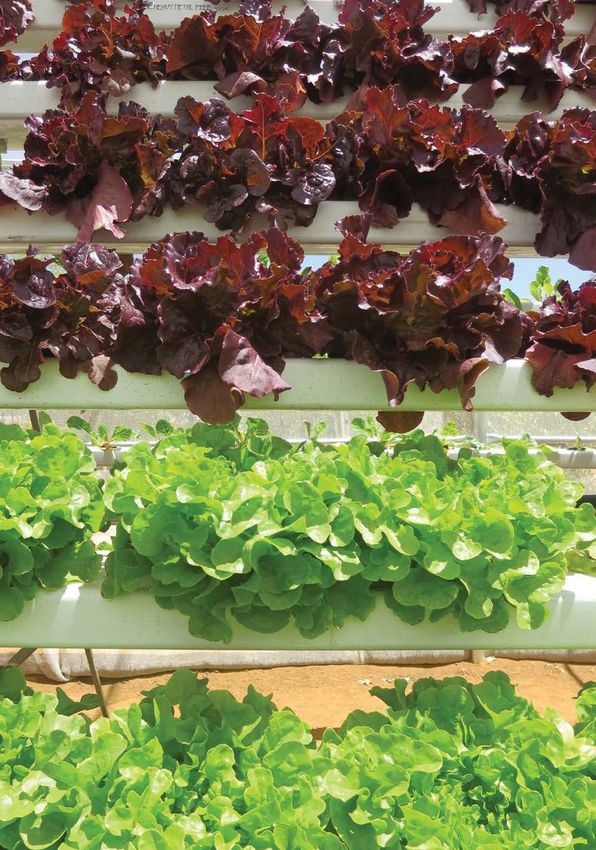
production areas of citrus (35%), berries (33%), ■ Undercover farming (UF): There has been
sub-tropical fruits (21%), and nuts (79%). rapid market growth in low-tech UF
infrastructure, with a 171% increase in
This is an important trend, particularly when production area under shade netting and a
coupled with growing water scarcity. International 55% increase in tunnel structures recorded in
market pressure for low carbon, environmentally- the WC over the last five years. The potential
friendly products is an increasingly important market for low-tech UF is estimated at R38
driver for the uptake of practices and technologies billion in SA, with R1.4 billion in the WC. The
that also reduce the use of chemical inputs and market for medium- to high-tech systems
carbon dioxide emissions. (e.g. hydroponics and indoor farming) is worth
more than ~R1 billion in SA. UF provides
Given this shift, there are emerging investment numerous opportunities for suppliers and
opportunities in: remote sensing technologies manufacturers of UF components, as well as
for precision agriculture applications (driven consultants, especially in high-tech UF.
specifically to improve water efficiency and
climate adaption); undercover farming (UF), which ■ Energy: The market for RE in agriculture in SA
includes low-tech infrastructure such as shade is estimated to be 60 MW — a market of
netting and higher-tech controlled environment between R630 million and R960 million.
agriculture systems; and well-established
investment opportunities in renewable energy ■ Conservation agriculture (CA): Between 15%
(RE) and conservation agriculture. and 20% of commercial grain farmers and 5% of
smallholder farmers have adopted conservation
■ Remote sensing applications for precision agriculture practices; thus there is considerable
agriculture: There are emerging opportunities scope for scale-up and market growth of
1 Sustainable Agriculture: Market Intelligence Report 2019
associated equipment and services. The                 ■   Climate change, forcing the sector to adopt
    WC has the highest adoption of CA with ~70%                more sustainable practices to increase its
    of grain farmers practising reduced tillage.               resilience. Climate change also exacerbates
    The main agtech opportunity in CA is the                   water scarcity through increasing evaporation
    manufacturing and sale of no-till machinery,               and occurrences of droughts.
    which is mostly imported into SA. The estimated        ■   Detrimental environmental effects
    market size for no-till machinery in SA ranges             associated with conventional (i.e. traditional)
    from R136 million to R747 million.                         inputs and practices, specifically pollution
                                                               and soil degradation, leading to lower
The main drivers of these opportunities are:                   production yields, loss of arable land and
                                                               reduced resilience.
■   Rising input costs for energy (particularly            ■   Decreasing costs of greentech, such as
    electricity and diesel), fertiliser and pesticides.        solar panels.
■   Increasing awareness of available sustainable          ■   Scarce natural resources (particularly arable
    practices and technologies, as well as                     land and water) that are primarily affected by
    their benefits.                                            climate and farming practices.

                                                                 © Western Cape Department of Agriculture

Sustainable Agriculture: Market Intelligence Report 2019                                                     2
What’s new?
This 2019 Sustainable Agriculture Market Intelligence Report (MIR) discusses the economic impacts of
external factors on the sector, particularly the Western Cape drought (2015 – 2018). The drought,
characterised by significant decreases in rainfall over three years, again emphasised that water is a key
constraint to agricultural development. The report further highlights that water scarcity (through
drought, declining rainfall, and over-demand) is one of the biggest drivers for investment in sustainable
agricultural technology and practices.

The MIR further investigates flyover data obtained from the Western Cape Department of Agriculture
(WCDoA) to identify trends in production and infrastructure investment from 2013 to 2018. Key
developments discussed include the growth in production area for:

■   high-value export crops such as berries, fruits and nuts; and
■   undercover farming.

The growth in UF interlinks with the expansion of production for high-value fruit and an increasing
demand for sustainable solutions to comply with export market regulations and consumer preferences.

The MIR also discusses the market growth for remote-sensing applications (drone and satellite
imagery) in precision agriculture in SA, as well as updates on key sustainability opportunities in the
sector, namely RE and conservation agriculture.

For new readers, we advise that you first read the 2017 and 2018 Agriculture MIRs for an in-depth
understanding of the opportunity areas.

3                                                        Sustainable Agriculture: Market Intelligence Report 2019
1
    Introduction and purpose
    This MIR has been compiled by GreenCape’s Agriculture Sector Desk. It highlights
     opportunities for greening agriculture production and is written for investors –
     particularly new entrants to South Africa or the sustainable agriculture sector.

GreenCape partnered with the WCDoA in 2014 to                               The main focus is on remote-sensing
support the development of sustainable and                                  applications for precision agriculture (PA)
competitive agricultural value chains. This is                              and UF. Updates are also provided for two
achieved in part through the uptake of                                      areas explored in detail in the 2018 MIR: RE
agricultural technology (agtech1) and sustainable                           and conservation agriculture.
production practices, and has been driven by
raising awareness of the benefits of agtech                                 In what follows, there is a sector overview
uptake (i.e. driving demand within agriculture)                             (Section 2) that provides a national and
and highlighting opportunities for agtech                                   provincial economic overview of agriculture
manufacturers and service providers (i.e.                                   with the focus on macro-economic trends and
supporting supply to agriculture).                                          key players. This is followed by an overview of
                                                                            policies and regulations (Section 3) that guide
This MIR provides updates on key issues and                                 and affect investors in the agriculture sector.
opportunities identified in previous MIRs, and                              Key opportunities, trends and barriers are
highlights new opportunities related to                                     highlighted (Section 4). The final sections provide
technologies and practices that:                                            information on available finance and incentives
                                                                            (Section 5), present the case for the Western
■     increase input resource efficiency in                                 Cape as Africa’s emerging greentech hub
      primary production;                                                   (Section 6), and explain GreenCape’s work
■     benefit the environment, primarily by                                 in the green economy (Section 7).
      conserving resources, and reducing negative
      impacts such as soil degradation and pollution;                       For assistance, or if you have any questions
■     increase resilience to climate change; and                            after reading this MIR, please contact the
■     have the potential to attract international                           agriculture team at +27 21 811 0250 by email
      investment.                                                           at agri@greencape.co.za.

1
    Agtech is the use of technology for farming that is developed to improve efficiency and profitability.

Sustainable Agriculture: Market Intelligence Report 2019                                                                      4
© Western Cape Department of Agriculture 5 Sustainable Agriculture: Market Intelligence Report 2019
2
                      Sector overview
             This section provides an overview of the South African and
       Western Cape agricultural sectors. It includes an overview of the sector’s
        structure, macro-economic trends, key players, and drivers of green
                       technology and practices in agriculture.

2.1. Physical geography and climate
South Africa has a wide range of agro-climatic regions as shown in Figure 1 (FAO 2010). Climatic regions
include Mediterranean, subtropical and semi-desert, enabling the production of a wide range of
agricultural commodities.

Figure 1: South African agricultural regions

2.1.1. Western Cape agriculture
Fruit dominates agricultural production in the
                                                           There has been an exponential
WC (see Figure 2), of which a large percentage is
considered high value and destined for export              rise in the WC in the production
markets. The WCDoA’s Flyover Project, which                of high-value crops between 2013
serves as a regional agricultural census, shows a          and 2018, in citrus, berries, tropical
clear trend toward the increased production of             fruits, and nuts.
high-value export crops from 2013/14 to 2017/18.
Growth in production area can be seen for citrus
(35%), berries (33%), sub-tropical fruits (21%), and
nuts (79%).

Sustainable Agriculture: Market Intelligence Report 2019                                               6
40+27+1296
50+42+71
40% APPLES, PEARS &
PEACHES
28% WINES
12% TABLE GRAPES
9% POTATOES & ONIONS
6% CITRUS
6% OTHER VEGETABLES
50% HORTICULTURE
42% ANIMALS
7% FIELD CROPS
1% OTHER
Figure 2: Proportion of agricultural commodities produced in the Western Cape
This is an important trend in terms of sustainable Agriculture contributes a relatively small share to
agriculture, as international market pressure the total GDP (2.5%), but is important in providing
for low-carbon, environmentally-friendly employment and earning foreign exchange.
products is an increasingly important driver for However, when taking into account the whole
the uptake of practices and technologies that agricultural value chain, the sector is estimated
reduce the use of chemicals, and a product’s to contribute about 12% of the national GDP
carbon and water footprint. Technologies and (DAFF 2013).
practices to achieve this are discussed in detail
in Section 4 of this report. The agriculture sector has been affected by
various external factors, predominantly adverse
2.2. Overview of the climatic conditions, putting pressure on its output
agricultural economy performance. Figure 3 (StatsSA 2018) shows
This section provides an overview of the quarterly performance of the agricultural sector
agricultural economy in SA and the WC, with a over the past three years. Drought conditions in
focus on the sector’s economic contribution, 2015 across all major grain-producing areas in
export trends, and the effect of the recent the country affected the sector’s output, as
drought on agricultural output. shown in the figure. This national drought was
2.2.1. South African agriculture
South Africa is a semi-arid country, ranked as the
Water scarcity due to drought,
30th driest country in world, making water a key
constraint to agricultural development. Water
declining rainfall and over-demand
scarcity (drought, declining rainfall and over- for water is one of the biggest
demand for water) is one of the biggest drivers drivers for investment in
for investment in sustainable practices and sustainable practices and agtech.
agtech. Water scarcity as a driver is discussed in
Section 2.4.
7 Sustainable Agriculture: Market Intelligence Report 2019followed by one of the worst droughts on record again contracted in the first and second quarter
in the WC, lasting three years. of 2018. This was the result of significant losses
due to the WC drought in the 2017/18 season, hail
As shown in Figure 3, agricultural GDP in SA damage in Mpumalanga, and a delayed harvest
recovered as summer rainfall production areas in the summer-crop growing areas due to the late
recovered from drought in the 2016/17 season, but start to the season.
90 000
80 000
70 000
60 000
ZAR million
50 000
40 000
30 000
20 000
10 000
0
_3
_4
_1
_2
_3
_4
_1
_2
_3
_4
_1
_2
_3
15
15
16
16
16
16
17
17
17
17
18
18
18
20
20
20
20
20
20
20
20
20
20
20
20
20
Figure 3: South African GDP from agriculture (ZAR million per quarter)
The agriculture sector was the main contributor
to overall GDP decline for SA in the second
quarter of 2018, where agriculture output shrank “Higher air temperatures and lower
by 22.2% and decreased GDP by 0.08 percentage rainfall will have a huge negative
points. The decline in agriculture’s contribution impact on the sustainability of
may have been larger considering the wider viticulture, particularly in terms of
value chain, as agriculture is interconnected with
water supply. The dilemma will be
the rest of the economy. A large portion of
agricultural output is used as intermediary aggravated if lower rainfall
productions in other sectors, e.g. food and reduces the available irrigation
beverages. The sector bounced back in the third resources. Furthermore, climate
quarter and recorded a 6.5% rise. The South change will most probably result in
African GDP as a whole also showed growth of
reduced irrigation water
2.2% in this quarter.
allocations and increased water
The persistent drought conditions over the past tariffs.” Myburgh, 2018.
several years have highlighted the need for
increased resource efficiency, especially for
relevant water efficiency technologies that are
cost-effective. This is important as: ■ climate change will lead to a drier climate in
the winter rainfall region; and
■ climate change models predict that extreme ■ population increase will lead to increased
weather events such as droughts and floods competition for water resources.
will occur more frequently in the future;
Sustainable Agriculture: Market Intelligence Report 2019 870 000,00
60 000,00
50 000,00
Area (HA)
40 000,00
30 000,00
20 000,00
10 000,00
0,00
01
83
99
85
93
89
95
09
87
03
05
97
07
91
13
15
11
20
20
19
19
20
20
19
19
19
19
19
19
19
20
20
20
20
Drip Dryland
Flood Micro
Sprinkle
Figure 4: Change in irrigation system for wine production in South Africa
Agriculture will need to adapt to this ‘new normal’ ■ Improving water efficiency: This in turn
and is increasingly investing in water-efficient addresses the detrimental effects of over-
technologies. Figure 4 (SAWIS 2018), for instance, irrigation such as increased salinity and
shows an increase in the uptake of more topsoil losses.
resource-efficient technologies over time,
specifically drip irrigation, a system that uses less 2.2.2. Western Cape agriculture
water than other systems by applying water The Western Cape agricultural sector operates
directly to the root zone of the plant. It also in a unique climate compared to the rest of the
provides water at slower rates than other country. This Mediterranean winter-rainfall
systems, minimising evaporation losses. region produces fruits and wines that are mainly
destined for export markets. The province’s
Investing in water-efficient agtech has various agricultural value contributes 23% to SA’s total
benefits, including: agricultural GDP.
■ Decreasing energy inputs: On irrigated farms, Agricultural value chains play a significant role
energy costs are high because of the energy in contributing to the provincial economy by
used to pump irrigation water. With rising generating foreign reserve income and
energy costs in SA, investing in water-efficient employment. Although the WC agricultural
technology is important for the financial sector’s contribution to the WC economy is ~4%,
sustainability of farms. Furthermore, it
decreases the farms’ CO2 emissions, which are
expected to play a significant role in export
markets and carbon taxes.
■ Decreasing the farmer’s risk related to water The fastest growing export
uncertainty. Population increases and climate sector in 2017 in the Western
change mean increased competition for water Cape was agriculture, increasing
resources. Water trade-offs are becoming
by 15.2% from 2016.
more customary, making water allocation to
the agricultural sector increasingly uncertain.
9 Sustainable Agriculture: Market Intelligence Report 2019when including upstream and downstream sector in 2017 in the Western Cape was
linkages it increases to ~9.4% (Quantec, 2017). agriculture, increasing by 15.2% compared to 2016.
Agriculture and agro-processing are responsible Figure 5 (Quantec 2018) shows the export
for 18% of all formal employment opportunities in value and growth of key commodities from the
the province. The WC dominates much of SA’s Western Cape. This growth coincides with
agricultural export production by providing increases in the production of high-value
high-value products such as wine grapes and commodities discussed earlier.
fruit (e.g. apples). The fastest growing export
40
35
Export Value in Rand (Bilions)
30
25
20
15
10
5
0
2001 2002 2003 2004 2005 2006 2007 2008 2009 2010 2011 2012 2013 2014 2015 2016 2017
Citrus Pome Fruit Bulk Wine Other Fruit and Wine
Grapes Bottled Wine Stone Fruit
Figure 5: Fruit and wine value of exports in the Western Cape
Western Cape drought
The WC is recovering from a severe drought, Despite this, water scarcity will continue
with the winter rainfall season of 2017 delivering to drive the uptake of agtech, especially as:
the lowest rainfall since 1933. The drought in
2017/18 resulted in overall agriculture losses of ■ it is estimated that rainfall in the WC
R5.9 billion and 30 000 jobs. will decrease by 30% by 2050; and
■ the WC population is predicted to rise
However, water systems are showing signs by 30% over the next 15 years, which
of recovery after better rainfall in 2018. WC dam will increase pressure on water resources
levels were 64.1% at the end of the 2018 (Roux 2018).
hydrological cycle (31 October) compared to
35% the previous year. Furthermore, the For more information on the water sector,
Department of Water and Sanitation see GreenCape’s 2019 Water MIR. For
(DWS) announced that it would decrease detailed analysis of production areas and
agriculture water restrictions from 60% to climate change trends in the WC, see
10% in the Western Cape Water Supply SmartAgri’s publications.
System (WCWSS) at the end of November 2018.
Sustainable Agriculture: Market Intelligence Report 2019 102.3. Key players ■ Technology suppliers are found across the
As shown in Table 1, key players in the agriculture value chain, from inputs, production,
sector can be divided into six broad categories: harvesting processing, logistics, and waste
producers, research/academia, input suppliers, processing (bio-digesters and composters).
technology suppliers, industry associations and ■ Industry associations are involved in all
labour organisations. SA’s national Department aspects of the value chain. They support
of Agriculture, Forestry and Fisheries (DAFF), farmers and provide them with relevant and
governs the whole industry. reliable information regarding regulations,
logistics, cultivar development, etc. They also
■ Producers/farmers produce commodities and do or support research in various fields,
in most cases do their own harvesting, storage, including soil, water, production practices
and transport. and cultivars.
■ Research institutions like universities ■ Labour organisations provide support for
investigate all aspects of the value chain. employees in the agricultural sector by
■ Input suppliers produce inputs such as fertiliser, assisting them in attaining the best possible
seeds, pesticides, packaging, and machinery. financial and social position in all employment
Suppliers of green technology such as positions along the entire value chain.
conservation agriculture equipment, and solar
PV manufacturers also belong to this category. Table 1 shows a simplified value chain with key
role players involved.
Table 1: Key role players in agriculture
R&D Inputs Production Harvesting Storage Transport Processing Wholesale, Waste
retail &
exports
Government
Producer
Research institutions
Input
suppliers
Technology suppliers
Industry associations
Labour organisations
Key role-players for various agtech opportunities will be discussed in detail in Section 4.
11 Sustainable Agriculture: Market Intelligence Report 20192.4. Drivers of sustainable ■ Climate change, forcing the sector to adopt more
technologies and approaches sustainable practices to increase its resilience.
in agriculture Climate change also exacerbates water scarcity
The key drivers of green technology and through increasing evaporation and occurrences
innovation in the sector are: of droughts.
■ Market pressure through increasing consumer
■ Rising input costs for energy (particularly demand for sustainable products driving stricter
electricity and diesel), fertiliser and pesticides. regulations, particularly for chemical usage.
■ Scarce natural resources (particularly arable land ■ Decreasing costs of cleantech such as solar panels.
and water) that are primarily affected by climate ■ Increasing awareness of available sustainable
and farming practices. practices and technologies, as well as their benefits.
■ Detrimental environmental effects associated
with conventional (i.e. traditional) inputs and These drivers are discussed in more detail in the
practices, specifically pollution and soil 2017 Agricultural MIR2.
degradation, leading to lower production yields,
loss of arable land, and reduced resilience.
© Western Cape Department of Agriculture
2
https://bit.ly/2QvQu5X
Sustainable Agriculture: Market Intelligence Report 2019 12© Western Cape Department of Agriculture 13 Sustainable Agriculture: Market Intelligence Report 2019
3
    Policies and regulations
     South Africa has an extensive and robust range of policies and regulations
                    governing the country’s agricultural sector.

The agricultural policy framework endeavours                  responsible for overseeing and supporting the
to create a sustainable agriculture sector that               development of the agricultural sector in South
is dynamic in regulatory approach for a                       Africa. Support by the DAFF and DEA is guided
greener economy.                                               by the vision of a sustainable agricultural sector
                                                              that addresses agricultural policy distortions
3.1. South Africa’s agricultural                               of the past, with reformative policies that create
policies and regulations                                      an enabling agricultural sector for the future.
The Department of Agriculture, Forestry and                   South Africa’s agricultural sector is governed
Fisheries (DAFF) and the Department of                        by a suite of key policies and legislation outlined
Environmental Affairs (DEA) are national entities             in Table 2 below.

Table 2: Key policies and legislation

 Name of policy                          Key objectives
 The National Development Plan           ■   Elimination of poverty
 2030 (NDP 2012)                         ■   Reduction of inequality
                                         ■   Highlighting the importance of agriculture to the green economy

 The Strategic Plan for the              ■   Provides an effective framework to address various challenges
 Department of Agriculture,                  facing the sector
 Forestry, and Fisheries (DAFF 2015)     ■   Sets targets for the departmental programmes from 2015/16 to
                                             2019/20
                                         ■   Focuses on advancing food security, job creation, economic growth
                                             and transformation of the sector through innovative, inclusive and
                                             sustainable policies, legislation and programmes

 The Agriculture Integrated Growth       ■   Plans to develop equitable, productive, competitive, profitable and
 and Development Plan (IGDP 2012)            sustainable agriculture, forestry and fisheries sectors
                                         ■   Emphasises that the sector needs to benefit all South Africans

 The Agricultural Policy Action Plan     ■   A programmatic response to key policy documents, including the
 (APAP 2014)                                 National Development Plan (NDP) and the New Growth Path (NGP)

 The National Environmental              ■   NEMA is the overarching legislative framework for environmental
 Management Act 107 of 1998                  governance. Core values are reflected through the following
 (NEMA 1998)                                 principles:
                                             – Environmental management must place people and their needs at
                                               the forefront of its concern, and serve their physical,
                                               psychological, developmental, cultural and social interests equitably
                                             – Development must be environmentally, socially and economically
                                               sustainable

Sustainable Agriculture: Market Intelligence Report 2019                                                           14
A comprehensive list of key policies and compared to the previous five years. All water
regulations influencing the agricultural sector users were instructed to install electronic water
can be found on the GreenAgri portal under the measurement devices to monitor water usage,
Action Plans and Policies section3. storage and abstraction rates, and submit such
records to the DWS on a weekly basis.
This section of the MIR provides an overview of
policy updates and implications for agriculture in In some regions, the DWS restricted non-
sectors and policy areas such as water, carbon compliant farming irrigation boards with regard
tax, land reform, the Integrated Resource Plan, to the volume of groundwater they were allowed
conservation agriculture, and climate smart to abstract. In addition, the Western Cape
agriculture. Provincial Head was authorised to discontinue
WCWSS dam releases to agricultural bulk water
3.2. Water user associations, irrigation boards, or individual
The regulatory landscape of the water sector users under conditions of overconsumption. By
in 2018 was predominantly influenced by February 2018, irrigation boards and water use
the prolonged drought experienced across associations (WUA) were likewise required to
the country. The policy updates were install water measuring devices to monitor water
characterised by the need for agricultural usage and submit measurement records to
water users to subsequently reduce their Provincial Heads of the DWS.
water consumption, monitor their water
usage, and comply with metering installation 3.2.2. Water policy impacts
enforcements and reporting requirements and implications
specified by the National Department of Water Agricultural water users had to comply and
and Sanitation (DWS). adapt to the new sets of regulations issued
by the DWS due to the severity of the drought,
3.2.1. Water policy updates particularly within the WC. Although substantial
for agriculture restriction rates were enforced, agricultural users
There were two main updates within the reduced their water usage, adapted to producing
water policy arena that influenced the crops with higher return rates, and introduced
agricultural sector: water-efficiency technologies to monitor usage.
A key element of accountability was evident
General water use restrictions from the DWS transferring decision-making
In December 2017, the DWS introduced a 50% to directives to the Western Cape Provincial Head
60% reduction measure on all agricultural water in controlling dam release rates, and in holding
use within the Breede-Gouritz and Berg-Olifants irrigation boards and WUAs responsible for
Water Management Areas (WMA). In addition, the water metering, monitoring and reporting.
DWS implemented restrictions on releases from
the Berg River, Voëlvlei and Theewaterskloof 3.2.3. Other water rights updates
dams. By January 2018, the DWS declared that Producers on the West Coast, an area hard hit
water restrictions would only be relaxed if the by the WC drought, have won a landmark court
Western Cape Water Supply System (WCWSS) case concerning water rights that will have
reached a total of 85% by 01 November 2018. consequences for SA agriculture.
By this date, the system had recovered in
capacity by 73.64%. Therefore, in December 2018 The Western Cape High Court ruled on 26
the DWS decided to reduce but maintain water October 2018 that it was lawful for the Lower
restrictions, which resulted in a 10% restriction Berg Irrigation Board to approve applications for
for agricultural water usage. the temporary transfer of water rights from one
farm to another4. The transfer of water rights
Groundwater restrictions and water between farmers (with properties in the same
use measurement vicinity) had always been allowed through
During January 2018, the DWS curtailed irrigation boards prior to January 2018, when
groundwater abstraction rates within the Breede- DWS notified irrigation boards that they no
Gouritz and Berg-Olifants WMAs by 60% longer had the authority to do so. Many farmers,
3
http://www.greenagri.org.za/
4
Read more about the court case at https://goo.gl/E7GKGf
15 Sustainable Agriculture: Market Intelligence Report 2019especially in times of drought, cannot function association to agriculture, e.g. logistics and inputs.
without water rights.
Although implementation of the carbon tax bill is
The effect of the judgment is that irrigation set to introduce a financial expense, the policy
boards around the country will be empowered should incentivise the transition to climate smart
once more to take decisions regarding water use. agricultural practices as an alternative.
3.3. Carbon tax 3.4. Integrated Resource Plan
The Carbon Tax Bill was tabled by the Minister of In August 2018, the Minister of Energy published
Finance before the National Assembly during the the draft Integrated Resource Plan 2018 for public
Medium Term Budget Policy Statement in comments. Interested persons and organisations
November 2018. The Minister announced a were invited to submit written comments on the
postponement of the carbon tax implementation draft IRP to the Director-General of the
from 01 January 2019 to 01 June 2019. This Department of Energy within 60 days of the
amendment was determined through business publication date, i.e. in the period September-
and labour feedback obtained during hearings in October 2018, before a final version would be
2018 convened by the Parliamentary Standing adopted by Cabinet. RE will be the key focus over
Committee on Finance. At the publication stage the next decade, and plans to expand SA’s
of this MIR, the State President is set to sign and nuclear capabilities are off the table for now.
promulgate the Bill.
Ultimately, a policy push for RE will be beneficial
Apart from the postponement of the carbon tax for greening SA agriculture.
implementation date, the greenhouse gas (GHG)
emission taxation phase measures remain in For more information on this policy, please see
place. Agriculture, forestry (plantations and GreenCape’s Renewable Energy MIR5.
natural forests under 100 ha), and other land use
and waste sectors will be exempt from direct 3.5. Land reform
GHG emission taxation during Phase 1 (2020 to South Africa adopted the White Paper on South
2022), but will be taxed indirectly for fuel and African Land Policy in 1997 to address the
energy usage. historical discriminatory injustices in land
dispossession during colonialism and apartheid,
which transpired into inequalities in land
ownership and land use. The White Paper was
one of the earliest pieces of democratic
Agriculture, forestry, and other legislation to emphasise the need for sustainable
land use and waste sectors will use of land. It also introduced the three
be exempt from direct GHG fundamental components of land reform as
emission taxation during restitution, redistribution, and tenure reform.
Phase 1 (2020 to 2022), but will Various policies have since been introduced by
the State to support successful land reform
be taxed indirectly for fuel and
transitions. These include the Land Redistribution
energy usage. for Agricultural Development (LRAD) programme,
the Proactive Land Acquisition Strategy (PLAS),
and the Settlement Production Land Acquisition
Grant (SPLAG).
Post-2022 emission taxation measures are
somewhat uncertain. However, agriculture, forestry 3.5.1. Land reform policy updates
and other land use sectors exceeding emissions of There have been some key updates within the
100 000 tonnes of carbon dioxide equivalent land reform policy arena during 2018:
(CO2eq) per year can expect to be taxed after
Phase 1. Under this relatively high emission Land expropriation and redistribution
threshold, very few agricultural enterprises can In his State of the Nation Address of 2018, the
expect to be taxed. Secondary tax implications will President highlighted the need to accelerate the
be experienced through other sectors bearing land redistribution programme in order to redress
5
https://www.greencape.co.za/market-intelligence/
Sustainable Agriculture: Market Intelligence Report 2019 16© Catherine Pineo 17 Sustainable Agriculture: Market Intelligence Report 2019
Sustainable Agriculture: Market Intelligence Report 2019 18
historical land dispossession and enable              expropriation policy. However, it is predicted
availability of land for cultivation. The President   that the policy will influence investor confidence
also emphasised that the approach of land             in the sector.
expropriation without compensation would be
implemented in a manner that enhances                 3.6. Conservation agriculture
agricultural production, improves food security,      updates
and unlocks access to land.                           DAFF released the Draft Conservation Agriculture
                                                      Policy for public comment in February 2018. The
In an effort to determine the public sentiment        draft policy objective is to promote and establish
on State-led land expropriation, the National         ecologically and economically sustainable
Assembly and National Council of Provinces            agricultural systems to increase food security.
instructed the Joint Constitutional Review            The draft policy is rooted in the notion that
Committee (JCRC) to issue a public process            conventional farming systems are not
of collective national input. By November             sustainable, emphasising the need for more
 2018, the JCRC adopted the review process            sustainable agricultural production systems.
recommendations and put forth the proposal            Such systems should focus on fostering synergies
to Parliament. It was subsequently debated            between agricultural production, conservation
and adopted in December 2018 in favour of the         and enhancing rural livelihoods.
report on land expropriation.
                                                      Conservation agriculture (CA) is correspondingly
Empirical data for land                               recommended as a sustainable and cost-
reform strategies                                     effective agricultural system with emphasis
DAFF, together with Statistics South Africa           placed on natural biological processes and
(StatsSA), launched a “Farmer Producer/Register       reduced external input dependency for improved
Campaign” in September 2018 to gather more            ecosystems. The draft policy recommends that
information on the country’s smallholder farmers.     government offer incentives to producers to
It would assist government in measuring the           adopt conservation agriculture measures, and
progress of land reform by using the data to          that tax rebates are provided to manufacturers
inform its strategies. The census would be            of conservation agriculture equipment.
conducted in two parts, focusing on commercial
farmers in 2019 and smallholder farmers in 2020.      3.6.1. Policy impacts and implications
The amount of R10 million has been invested in        There are several environmental benefits
the census database.                                  identified within the Draft Conservation
                                                      Agriculture Policy. These include a reduction
Policy impacts and implications                       in GHG emissions, replenishment of soil
Outcomes from the State of the Nation Address         organic matter, land rehabilitation through
and National Assembly vote on land                    improved water filtration and subsequent
expropriation suggest that the government is          improved groundwater quality and levels,
committed to land reform and redress in line with     increased agricultural production and lower
the country’s constitution. To date, reviewing        production costs, and improved biological and
Section 25 of the Constitution has followed due       ecosystem functioning. In practice, CA would
processes through inclusive, comprehensive, and       undoubtedly favour both the environment and
consultative public procedures. Furthermore,          climate conditions.
initiatives to understand the agriculture sector
through the likes of the DAFF Farmer Producer/        3.7. Climate smart agriculture
Register Campaign will contribute to the
government’s goal of developing efficient             3.7.1. Climate smart agriculture
interventional strategies and mechanisms for          policy updates
measuring the progress on land reform with            During August 2018, the DAFF issued a Draft
empirical-based evidence and data. In addition,       Climate Smart Agriculture Framework for
the Campaign incentivises farmers to register for     public comment. The framework outlines
the census as a prerequisite to qualifying for        the role of climate smart agriculture (CSA)
other agricultural benefits.                          practices in addressing climate change related
                                                      vulnerabilities facing the agricultural sector.
The South African Government has stated that          The importance of integrating mitigation and
commercial farms producing goods for the              adaptation strategies into production systems
agro-food market will not fall under the land         and the need for resource investment in

19                                                    Sustainable Agriculture: Market Intelligence Report 2019
indigenous knowledge systems are and developmental partners in integrating CSA
also highlighted. within projects and programmes. The framework
encourages efficient natural resource use
3.7.2. Policy impacts and implications practices and promotes low carbon based
The Draft Climate Smart Agriculture Framework developments to ensure resilience to climate
is recommended to guide government, investors and weather system shocks.
© Western Cape Department of Agriculture
Sustainable Agriculture: Market Intelligence Report 2019 20© GreenCape 21 Sustainable Agriculture: Market Intelligence Report 2019
4
                  Opportunities and
                      barriers
           Renewable energy and conservation agriculture solutions continue
       to offer opportunities for investors and businesses. Emerging opportunities
           with significant growth potential include technologies for precision
             and undercover agriculture. The main market drivers are climate
                          adaptation and water risk mitigation.

This section starts by providing brief updates on              These services have capitalised on the emerging
agriculture-related market opportunities in                    opportunities in software development and
renewable energy (RE) and conservation                         data analytics, and add value to relatively
agriculture (CA). Opportunities are then                       mature technologies – specifically remote
addressed in more detail for:                                  sensing technologies such as sensors, drones
                                                               and satellite imaging.
■   precision agriculture, in particular the growing
    demand for bespoke advisory services; and                  These opportunities are mapped across different
■   undercover agriculture, including the high                 growth stages in the figure below.
    growth opportunities related to low-tech
    systems, and emerging opportunities in
    medium-to-high tech systems.

            Introduction              Growth                   Maturity               Decline

                                                        Renewable energy (solar PV)
    Sales

                                                  Undercover farming (shade netting and tunnel systems)

                                              Precision agriculture (remote sensing bespoke services)
                                          Conservation agriculture

                                Undercover farming (indoor farming)
                                                                                                     Time
            ■ Low sales           ■ Increasing sales       ■ Peak sales         ■ Falling sales
            ■ High cost per       ■ Cost per product/      ■ Lowest cost per    ■ Lowest cost per
              product/service       service falls            product/service      product/service
            ■ Niche market        ■ Growing market         ■ Mass market        ■ Shrinking market
            ■ Few competitors     ■ More competitors       ■ Stable no. of      ■ Falling no. of
                                                             competitors          competitors

Figure 6: Opportunities highlighted in the 2019 Agricultural Market Intelligence Report

Sustainable Agriculture: Market Intelligence Report 2019                                                     22
4.1. Market updates for 2019 analysis of these opportunities, including
This section provides market updates on the energy efficiency in agriculture, refer to the 2017
opportunities for RE and conservation agriculture and 2018 Agriculture MIRs.
(CA) within agriculture. For a more in-depth
Table 3: Market update for renewable energy
Opportunity Updated market size Developments and Barriers to uptake
for agriculture6 insights
The current opportunity ■ SA: R630 – R960 ■ According to PQRS ■ High capital cost
driving the uptake of RE million data7, installed solar (although technology
is the replacement of ■ WC: R94 – R144 PV capacity for SA prices are
expensive grid million (see Figure 7) agriculture was 40 decreasing).
electricity (Eskom) with ■ The sector is MWp in 2017. ■ Scepticism and lack
relatively ‘cheap’ predicted to grow at ■ An additional 20 MWp of understanding
alternative energy, and 10% annually. was installed in 2018 about what Energy
the growing ability to ■ 10% of all installations (i.e. total installations Services Companies
connect and feed into are in the agricultural of 60 MWp for SA (ESCos) can offer
the grid. sector. agriculture). through their funding
■ Three additional WC models (see case
There are specific solar municipalities (and so study below).
PV opportunities for 22/25 municipalities)
manufacturers and allow small-scale
service providers, embedded generation
which include: (SSEG tariffs when
feeding into the grid.
■ manufacturing of ■ Although many old
components/ farm buildings have
products, asbestos roofing,
■ installation of which can weaken the
systems business case for
■ energy services solar PV, agriculture
(specifically exporters (who make
performance-based up a large percentage
electricity supply of investors) are not
contracts) allowed to have
asbestos roofing in
their facilities.
6
7
6
Based on capital costs of R10 500 – R16 000 per kWh for solar PV (larger units become cheaper per unit of energy) and an industry-
projected uptake of 10% per year.
7
PQRS was created to be a training, information and data platform with the intention of providing data for investors, suppliers, installers
and industry bodies. Installed capacity has been collected from a combination of sources. A blend of three categories of installations are
contained in the data: solar borehole pumps, government concession programmes / installations, and individually listed systems (both grid
tied and off-grid).
23 Sustainable Agriculture: Market Intelligence Report 201914
12
10
8
Installed Capacity (MW)
6
4
2
0
2012 2013 2014 2015 2016 2017 2018 2019 2020 2021
Figure 7: Solar PV currently installed in Western Cape agriculture (in green) and the predicted
uptake (in red). GreenCape analysis (2018).
© New Southern Energy
Sustainable Agriculture: Market Intelligence Report 2019 24Case study: Solar PV investment in the South African fruit sector
New Southern Energy recently installed a ■ a 534 kWp ground mounted solar system
state-of-the-art microgrid solution at to supply RE through the day;
Marlenique, a farm located just outside ■ a 60 kWp floating solar system for the
Franschhoek on the famous Route 45 in the farm’s dam to supply RE through the
Drakenstein Municipality. The farm day, as well as minimise land usage
produces export quality fruit and runs an and reduce evaporation from the dam;
award-winning wedding and function venue. and
■ provision for infrastructure to allow for a
Due to rising energy prices and a high battery system to be included during
energy demand from its cold storage, phase two to take the site completely
irrigation and venue facilities, a microgrid off-grid.
system provided the best long-term solution
for the farm. This decision was also made by The system has been fully operational since
taking into consideration the input costs, 1 February 2019, with the floating solar
power reliability and sustainability as key system being the first such commercially
contributing factors to the success of the operational system to be installed in
business. Sub-Saharan Africa.
The solution includes: The project was financed through Nedbank
Agriculture. The savings from the system
■ an internal AC reticulation upgrade and allow the farm to operate cash-flow positive
consolidation of connection points; from day one, while paying the asset off over
■ the installation of a backup generator to 10 years. With a long-lasting lifespan, the
run the internal grid in the event of benefits of the system will be passed on for
power outages; generations to come.
© New Southern Energy
25 Sustainable Agriculture: Market Intelligence Report 2019Table 4: Market update for conservation agriculture
Opportunity Updated market size Developments and Barriers to uptake
insights
Conservation ■ There is considerable ■ The carbon sequestration ■ A lack of knowledge
agriculture (CA) is scope to scale up CA: impact of reduced tillage regarding the
a way of farming only 15% to 20% of on 20% of SA’s cultivated importance of
that aims to commercial grain areas is ~1.2 million tonnes implementing all
decrease input farmers and 5% of CO2e (WWF 2018). Proving three aspects of CA,
costs and improve smallholder farmers that CA practices namely minimum soil
yields through in SA have adopted sequestrate a significant disturbance,
improving soil CA (WWF 2018). amount of carbon, could permanent soil cover,
health.8 ■ The estimated market strengthen the business and crop rotation
The main agtech size for no-till case for farmers to convert ■ A lack of suitable
opportunity in CA machinery in SA to more sustainable planters for local
is the ranges from R136 practices as opportunities conditions (e.g. rocky
manufacturing and million to R747 such as offsetting carbon soils), especially in
sale of no-till million9. credits arise. the WC.
machinery, which ■ The Department of ■ A delay between
is mostly imported Agriculture, Forestry and investment and
into SA. There are Fishing (DAFF) released a realisation of
emerging Draft Conservation financial return
opportunities for Agriculture Policy10 in 2017, through improved
advisory service which identifies policy yields (relatively long
providers in cover support measures to return on investment
crops, as it starts promote CA adoption, of ~6 years).
playing an including financial ■ The high capital cost
important role in incentives. of equipment.
dryland crop ■ Two recent innovative ■ Currently no
production finance instruments have supporting policy
globally, especially the potential to support environment
in arid and CA adoption in SA: (although this is
semi-arid areas. – The Banking Association being addressed).
of South Africa and its
commercial bank
members are working
with DAFF on a blended
finance instrument that
will include promoting
natural resource
management.
– A recently approved
European Investment
Bank Credit Line to the
Land Bank includes a
portion of credit
earmarked for climate-
smart agriculture.
89 10
8
See 2017 Agriculture MIR for more detail, including definitions and evidence of uptake.
9
Assuming cost of machinery ranges from R400 000 to R2.2 million; 3.4 million ha under cereal production and average farm size of 2 113 ha.
10
Available at https://goo.gl/VuJZCU
Sustainable Agriculture: Market Intelligence Report 2019 264.2. Precision agriculture: Using pesticides through certain technologies. PA uses
remote sensing technologies for sensor technology, including satellites, drones (i.e.
resource efficient farming remotely piloted aircraft systems); and
positioning technology (GPS) to rapidly gather
4.2.1. Overview data about a farm or crop. The data is then used
Precision agriculture (PA), also called ‘smart to make more informed decisions that are
farming’, ‘satellite farming’ or ‘site-specific crop tailored to a specific farm, part of a farm, and
management’, enables producers to accurately crop field. Figure 8 (USB 2018) below shows the
apply inputs such as water, fertiliser and different components used for PA.
Data analytics
Software solutions GIS systems/mapping
Disease forecasting systems
Machine learning
IoT technologies
Precision Robotics/
agriculture/smart autonomous vehicles
farming
Positioning (i.e. GPS)
Drones
Sensor Remote sensing
Satellite imaging
technology Proximal sensing
Communication systems
Variable-rate technology
Figure 8: Aspects of precision agriculture and smart farming
This section focuses on the opportunities created moisture levels, crop factors and climatic
for investors through the demand for remote variables to determine evapotranspiration.
sensing technologies that are used with software
solutions, which communicate real-time The majority of South African players offer
information as actionable insights to a farmer. bespoke services to farmers through data
■ Remote sensing technologies, such as drones, analytics. Companies are usually made up of
can be equipped with multispectral cameras, multi-disciplinary teams, from software
which can help analyse plant health and act developers to agronomists. They will typically use
as an early warning system for farmers. remote sensing hardware – a relatively mature
■ For software solutions, algorithms take various technology in SA – on a contract basis.
variables into account to optimise input
requirements. In the case of irrigation For example, Aerobotics (an aerial-data analytics
requirements, these typically include soil start-up company) usually hires a licensed
27 Sustainable Agriculture: Market Intelligence Report 2019You can also read