EN EN - European Commission
←
→
Page content transcription
If your browser does not render page correctly, please read the page content below
EN

EN        EN
EUROPEAN COMMISSION

                                                   Brussels, xxx
                                                   SEC(2010) yyy

                    COMMISSION STAFF WORKING DOCUMENT

                                 IMPACT ASSESSMENT

                              Accompanying document to the

     Draft Commission Regulation implementing Directive 2009/125/EC of the European
     Parliament and of the Council with regard to ecodesign requirements for household
                                    washing machines

                                    {C(2010) yyy final}
                                     {SEC(2010) yyy}

EN                                          1                                            EN
TABLE OF CONTENTS
Executive summary ............................................................................................................................4
1. Procedural issues and consultation of interested parties ...................................................... 10
1.2 Organisation and timing ..................................................................................................... 10
1.2 Impact Assessment Board .................................................................................................. 11
1.3 Transparency of the consultation process ........................................................................... 11
1.4 Outcome of the consultation process .................................................................................. 12
2. Problem definition ............................................................................................................. 13
2.1 Existing legislation and other relevant initiatives................................................................ 14
2.1.1 Energy labelling of washing machines................................................................................ 14
2.1.2 Voluntary commitment ...................................................................................................... 15
2.2 Market failures................................................................................................................... 16
2.2.1 Clustering of products in highest efficiency classes ............................................................ 16
2.2.2 Negative externality........................................................................................................... 19
2.3 Grounds for an implementing measure............................................................................... 19
2.3.1 Washing machine volume of sales & trade ......................................................................... 19
2.3.2 Washing machine environmental impact ............................................................................ 21
2.3.3 Potential for improvement.................................................................................................. 23
2.3.3.1 Life cycle cost analysis ...................................................................................................... 24
2.3.3.2 Low power modes.............................................................................................................. 28
2.3.4 Conclusion......................................................................................................................... 28
2.4 Legal basis for EU action ................................................................................................... 28
3. Objectives.......................................................................................................................... 28
3.1 General, specific and operational objectives ....................................................................... 28
3.2 Consistency with other EU policies .................................................................................... 29
4. Policy options .................................................................................................................... 30
4.1 Policy options discarded .................................................................................................... 30
4.2 Policy option proposed....................................................................................................... 32
5. Analysis of impacts............................................................................................................ 33
5.1 Policy Proposal .................................................................................................................. 33
5.1.1 Ecodesign requirements ..................................................................................................... 33
5.1.2 Energy labelling proposal................................................................................................... 35
5.2 Other performance aspects ................................................................................................. 39
5.2.1 Water consumption ............................................................................................................ 39
5.2.2 Washing performance ........................................................................................................ 40
5.2.3 Noise emissions ................................................................................................................. 41
5.2.4 Low power modes.............................................................................................................. 41
5.3 Overview ........................................................................................................................... 43
6. Comparing the options ....................................................................................................... 43
6.1 Economic impact ............................................................................................................... 45
6.1.1 Energy savings................................................................................................................... 45
6.1.2 Impact on consumers ......................................................................................................... 47
6.1.3 Impact on manufacturers.................................................................................................... 48
6.1.4 Impact on trade .................................................................................................................. 49
6.1.5 Administrative burden........................................................................................................ 50
6.2 Social impact ..................................................................................................................... 50
6.3 Environmental impact ........................................................................................................ 52
6.3.1 Greenhouse gas emissions.................................................................................................. 52
6.3.2 Water consumption ............................................................................................................ 53
7. Monitoring and Evaluation................................................................................................. 60
Annex I Washing machine Energy Label (95/12/EC) ........................................................................ 61
Annex II Baseline scenario ............................................................................................................... 62
Annex III Draft Minutes of Consultation Forum Washing Machine with regard to ecodesign and
labelling for washing machines- 04.12.2008...................................................................................... 69
EN 2 ENAnnex IV Minutes of the Consultation Forum – 26/03/2010.............................................................. 76
Annex V Calculation methodology for the Energy Efficiency Index .................................................. 81
EN 3 ENCOMMISSION STAFF WORKING DOCUMENT
IMPACT ASSESSMENT
Accompanying document to the
Draft Commission Regulation implementing Directive 2009/125/EC of the European
Parliament and of the Council with regard to ecodesign requirements for household
washing machines
Lead DG: TREN
Associated DG: ENTR
Other involved services: COMP, ECFIN, ENV, INFSO, LS, MARKT, RTD, SANCO, SG,
TRADE
Agenda planning or WP reference: 2009/TREN/023
EXECUTIVE SUMMARY
Household washing machines are currently addressed in Commission Directive 95/12/EC
implementing Council Directive 92/75/EC with regard to energy labelling of household
washing machines. Unlike, for instance, refrigerating appliances, household washing
machines are not subject to requirements regarding minimum energy efficiency or other
performance aspects.
Directive 2009/125/EC of the European Parliament and of the Council (the Ecodesign
Directive) lays down a framework for the Commission, assisted by a Regulatory Committee,
to set ecodesign requirements for energy-related products. It is one of the priorities of the
European Economic Recovery Plan — COM(2008) 800.
The approach to developing the proposed ecodesign implementing measure for household
washing machines and its impact assessment is structured in four steps:
Step 1: assessment of the criteria for an ecodesign implementing measure as set out in Article
15(2)(a)–(c) of the Ecodesign Directive, taking into account the ecodesign parameters listed in
Annex I and the method for setting specific requirements laid down in Annex II of the
Ecodesign Directive;
Step 2: consideration of relevant EU initiatives, market forces and disparities in the
environmental performance of equipment on the market with equivalent functionality, as set
out in Article 15(2) of the Ecodesign Directive;
Step 3: establishing policy objectives, including the desirable level of ambition, the policy
options to achieve them, and the key elements of the ecodesign implementing measure as
required by Annex VII of the Ecodesign Directive;
EN 4 ENStep 4: assessment of the impact on the environment, consumers and industry, with a view to
the criteria for implementing measures set out in Article 15(5) of the Ecodesign Directive.
Step 1: Legal base for an implementing measure: compliance with the Ecodesign
Directive, Article 15
In order to assess the criteria for ecodesign implementing measures as set out in Article 15(2)
of the Ecodesign Directive, the Commission carried out a technical, environmental and
economic analysis (‘preparatory study’) of household washing machines1 in accordance with
Article 15(4)(a) and Annexes I and II of the Ecodesign Directive.
The study has shown, as illustrated in Table A, that (1) household washing machines are
placed on the EU market in large quantities, (2) the environmental impact of household
washing machines is to a large extent related to the consumption of electricity and water
during use, and remains significant despite ongoing improvements, and (3) regarding water
consumption, there is a wide disparity in the performance of appliances currently on the
market, and technical cost-effective solutions exist that could lead to significant
improvements. The existing disparity in electricity consumption is limited, since the majority
of appliances are in the same energy efficiency class. However, the preparatory study
identified a substantial potential for improvement (10 % cost-effective energy savings in the
short term, 14 % in the medium term, using the standard 60ºC cycle, and up to 20 % using
‘benchmark’ technologies).
The economic value and the environmental impacts in 2020 were calculated on the basis of a
business-as-usual scenario.
Table A: Total household washing machines in the EU-27 in 2005 and 2020
Article Annual sales volume 2005: 14 million units per year, representing an
15(2)(a): in the EU economic value of EUR 6.1 billion
Article Environmental Electricity:
15(2)(b): impact: electricity
and water – 2005: 35 TWh/yr or 18 million t/yr CO2 equivalent2
consumption of
appliances (business- – 2020: 37.7 TWh/yr or 19.6 million t/yr CO 2
as-usual — BaU — equivalent
scenario)
Water:
– 2005: 2213 million m3/yr
– 2020: 2051 million m3/yr
Article Improvement Relative potential:
15(2)(c): potential for
household washing – 10 % cost-effective energy savings in the short term
1
Preparatory study for ecodesign requirements of EuPs, Lot 14: ‘Domestic Dishwashers and Washing
Machines’. Available on: www.ecowet-domestic.org.
2
This represents 1 % of the total EU electricity consumption of about 2760 TWh in 2005.
EN 5 ENmachines (applying – 14 % in the medium term (using the standard 60ºC
existing cost- cycle) and up to 20 % using ‘benchmark’
effective technology) technologies
Potential in absolute term:
Between 1.2 and 1.5 TWh/yr, depending on the sub-
options, in 2020 compared with the BaU scenario (in
2025, the energy-savings potential increases to 2.2-2.7
TWh/yr compared to the BaU scenario).
Between 64 to 83 million m3/yr water saved in 2020
(use phase).
Step 2: Existing initiatives and capacity of market forces to address the issue
Further to Articles 15(2) and 15(4)(c) of the Ecodesign Directive, relevant EU and national
environmental legislation was considered. Related (voluntary) initiatives at both EU and
Member State level were taken into account, and barriers leading to market failures and
preventing market take-up of technologies with improved environmental performance were
analysed.
As a result of energy labelling3, combined with voluntary commitments by industry between
1997-2008 to phase out the least efficient household washing machines, household washing
machines have improved their energy efficiency by some 24 %4 in the last 10 years, with the
EU Energy Label becoming one of the most important market drivers.
However, as a consequence of the success of the labelling scheme and the voluntary
commitments, over 90 % of household washing machines are now in the energy label’s
highest efficiency class. In addition, the industry has decided not to make new voluntary
commitments because market actors have become too scattered for proper and fair
implementation.
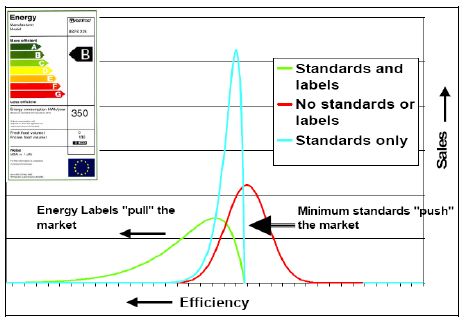
This can be called a regulatory failure, as an outdated labelling scheme means that there are
no market incentives to further improve the energy efficiency of household washing
machines. Consumers are no longer able to differentiate between products on the basis of their
energy efficiency (all models are in the same labelling class), retailers lose interest in drawing
attention to the energy label, authorities have difficulties in promoting the most efficient
models, and the industry is not motivated to invest in energy efficiency, but might instead
invest in other features (possibly more energy-consuming) in order to differentiate their
products from those of their competitors.
Furthermore, not all environmental costs are included in electricity and water prices.
Consequently, consumer (and producer) choices are made on the basis of lower prices that do
not reflect environmental costs for society (negative externality).
3
Commission Directive 95/12/EC implementing Directive 92/75/EEC with regard to energy labelling of
household washing machines, amended by Commission Directive 96/89/EC and 2006/80/EC.
4
Based upon an average energy consumption per cycle of 0.245 kWh/kg in 1997 and 0.185 kWh/kg in
2005.
EN 6 ENAlthough the total energy consumption of household washing machines has been slowly
decreasing, since the market is largely saturated and many older, less efficient appliances are
continuously replaced by new, more efficient appliances, the decrease in energy consumption
could be greater if the stagnation in product innovation was overcome. Stakeholders,
including industry and consumer organisations, have unanimously called for the combined
introduction of ecodesign requirements and a revised labelling scheme for household washing
machines5.
From the first two steps, it is concluded that the criteria for ecodesign implementing measures
as set out in Article 15(2) of the Ecodesign Directive are met, and household washing
machines should be covered by an ecodesign implementing measure in accordance with
Article 15(1) of the Ecodesign Directive, complemented by an upgraded energy labelling
scheme.
Step 3: Policy objectives and levels of ambition
Annex II of the Ecodesign Directive provides that the level of ambition for improving
environmental performance and electricity consumption is to be determined by an analysis of
the least life-cycle cost for the end-user. Furthermore, benchmarks for technologies yielding
best performance, as developed in the preparatory study and the discussions with stakeholders
during the meeting of the Ecodesign Consultation Forum6 on 4 December 2008, are
considered. The minutes of this meeting are attached in Annex III of this Impact Assessment.
The results are reflected in the objectives that the proposed Regulation aims to achieve.
The objective is to trigger a market transformation to realise the improvement potential.
Several policy options were considered, including self-regulation, revision of just the energy
labelling and introduction of minimum energy performance requirements alone. Considering
the strong interrelationship between the energy labelling scheme and the ecodesign
requirements, and given the request by Member States, the industry, consumer organisations
and environmental NGOs for a coordinated revision of the existing legislation, this impact
assessment considers, in sections 5 and 6, the combined impact of both measures.
Step 4: Environmental, economic and social impact assessment
An assessment of the proposed implementing measure is carried out. Considering that the
most significant environmental impact of household washing machines is their energy
consumption during use, sub-options for gradual ecodesign requirements together with
revised energy efficiency classes are analysed in section 6. The sub-options considered (along
with a business-as-usual scenario) are as follows:
– BaU: Business-as-Usual scenario, i.e. continuation of current policy measures at EU level
(current labelling scheme only) and no further action at EU level;
– Sub-option A:
5
In the past, Member States have launched fiscal incentive programmes to foster the market take-up of
energy-efficient appliances, but the uncertainty surrounding the future of the energy efficiency classes
has prevented them from initiating new support programmes. Furthermore, the Ecodesign Directive
implies that legislative action on domestic appliances cannot be taken at Member State level.
6
The Consultation Forum is a balanced grouping of Member State representatives and stakeholders such
as industry, consumer bodies and environmental NGOs, called upon to express their views.
EN 7 EN– Introduction of minimum energy efficiency requirements, i.e. EEI1.00 for machines of max. 3 kg load capacity).
– Introduction of maximum water consumption requirements (litres/cycle,
depending on rated load capacity) in 2011 and 2015 (based on part load);
– Sub-option B:
– Introduction of minimum energy efficiency requirements, i.e. EEI1.00 for machines of max. 3 kg load capacity),
– Introduction of maximum water consumption requirements (litres/cycle,
depending on rated load capacity) in 2011 and 2015 (based on part load).
The following graph illustrates the possible energy savings with each scenario.
Figure A: EU-27 total electricity consumption of household washing machines under
sub-options A and B in TWh/year (EU-27 demand in 2005: 3106 TWh)
WM Electricity (TWh/yr)
46,9
46
A_2011/2015
44
B_2011/2013
42 Baseline BAU
40,4
40
38 38,3
37,6 37,7 37,9
37,3
37,1
36,8 36,6
36 36,3 36,2
35,7
35,1 35,2 35,1
34,7
34
32
30
1990 1995 2000 2005 2010 2015 2020 2025 2030
Source: Input to this Impact Assessment from VHK
The graph shows that from 1990 to 2005 energy consumption decreased, because the
reduction in energy consumption of new appliances outweighed the increase of sales. After
2005 (approximate value) the reduction of energy consumption slowed down and eventually
EN 8 ENcame to a standstill (situation 2010). The resulting energy consumption of the stock increased
because of continuous increase of stock. From 2015 onwards the graph shows that the energy
consumption of household washing machines is expected to increase slightly in the business-
as-usual scenario. To bring about a decrease in energy consumption, while ensuring that
measures remain cost-effective, the existing legal framework needs to be upgraded.
Compared with 1990 — the reference year for climate change policy — the annual energy
consumption and carbon emissions of household washing machines in 2020 will be 20 %
lower in the BaU scenario (1990: 47 TWh/yr; 2020: 37.7 TWh/yr). The estimated savings for
sub-options A and B are 3.1 to 3.9 % with respect to the baseline scenario in 2020. In 2025,
savings are projected to be around 5.9 and 7.1 % (compared to BaU 2025).
Sub-option B (EEI– disproportionate burdens for manufacturers are avoided due to transitional periods that
duly take into account redesign cycles.
The question of the proportionality of the measures in terms of administrative burden
compared with the apparently limited potential for energy savings (1.5 TWh by 2020
compared to the BaU scenario) may be raised. However, one should consider first that the
savings resulting from the implementing measures will take time to occur given the strong
market inertia of this sector, so that the full impact of the measures will be seen only by 2025-
2030. In addition, the BaU option (i.e. current labelling scheme left unrevised and no
ecodesign requirements adopted) was strongly rejected by the industry and a majority of
Member States on the grounds that it would deprive the industry of a marketing tool necessary
to ensure a return on its investment in innovation. Finally, it might have a negative impact on
public opinion, which is used to the labelling scheme and welcomed it as a very useful tool
provided by the European Union. Consumers are likely not to understand why they are
deprived of a very popular purchasing tool enabling them to obtain fair, reliable and
comparable information on the performance of products.
Finally, SMEs are considered to represent 30 % of manufacturers (mainly OEMs, i.e.
suppliers of components like thermostats, shelves, etc.) and 80% of retailers. The analysis
shows that the policy options will have no negative impact on them. On the contrary, they will
benefit from stronger demand for new technologies and higher turnover.
As set out in Section 7, the impacts of the legislation will be monitored mainly through
market surveillance by Member State authorities to ensure that the requirements are met,
whereas the appropriateness of the scope, definitions and concepts will be monitored through
ongoing dialogue with stakeholders and Member States.
1. PROCEDURAL ISSUES AND CONSULTATION OF INTERESTED PARTIES
1.2 Organisation and timing
Household washing machines are covered by Commission Directive 95/12/EC implementing
Council Directive 92/75/EEC with regard to energy labelling of household washing
machines7. No ecodesign requirements have been set on this product group.
Washer-driers that are covered by Commission Directive 96/60/EC of 19 September 1996
implementing Council Directive 92/75/EEC with regard to energy labelling of household
combined washer-driers are outside the scope of this assessment.
Since recent market transformation calls for a revision of the labelling scheme, the Action
Plan for Energy Efficiency: Realising the Potential8 identified 'wet' household appliances (i.e.
household washing machines and washing machines) as one of the 14 priority product groups
for which an up-date of the existing labelling together with minimum energy performance
standards should be adopted.
This impact assessment considers the adoption of ecodesign requirements in compliance with
article 15.4 of Directive 2009/125/EC of the European Parliament and of the Council
7
Amended by Commission Directive 96/89/EC and 2006/80/EC.
8
COM(2006) 545
EN 10 ENestablishing a framework for the Commission to set ecodesign requirements for energy-
related products (hereafter referred to as the Ecodesign Directive)9. The option of having only
a revised labelling scheme is discussed in section 4.1.
The impact assessment was launched in November 2008 supported by an Interservice
Steering Group including COMP, ECFIN, ENTR, ENV, INFSO, LS, MARKT, RTD,
SANCO, SG, TRADE.
1.2 Impact Assessment Board
This impact assessment was scrutinised by the Commission’s Impact Assessment Board
(IAB). In its opinion, the IAB concluded that the impact assessment contains an adequate and
proportionate analysis. The analytical steps based on the requirements of the Ecodesign
Directive 2009/125/EC have been respected.
This impact assessment integrates the additional recommendations for improvements
advocated by the IAB.
1.3 Transparency of the consultation process
A background preparatory study was carried out in 2007-2008 in order to give input to this
impact assessment10. The preparatory study provided the European Commission with the
technical background supporting the design of eco-design requirements following the
methodology defined in Annex I and II of the ecodesign Directive.
The opinion of stakeholders was gathered consistently throughout the process through
bilateral meetings and the Consultation Forum which was created in compliance with Article
18 of the ecodesign Directive (see minutes of the Consultation Forum in Annex III). The
Commission's minimum standards on public consultation can thus be considered to be met.
• The preparatory study was consulted with manufacturers in bilateral meetings and through
their European Federation, CECED. Their input was instrumental in drafting first the life
cycle analysis of wet appliances, second in confirming the base case appliances
representative of the EU market and third the technological means and costs of ecodesign
improvements. CECED in particular provided the consultants with yearly databases on EU
washing machine production which were extremely useful in drafting the policy options
and calculating their economic impact. The preparatory study is published and publicly
available on the ECOWET website: http://www.ecowet-
domestic.org/index.php?option=com_docman&task=cat_view&gid=27&Itemid=40
• An extensive consumer survey was run in 2007 in order to better understand and identify
consumer's needs, expectation and daily use of wet appliances. The opinion of 2 497
European households (250 per country in average) was gathered with the aid of an external
9
Directive 2009/125/EC of the European Parliament and of the Council of 21 October 2009 establishing
a framework for the setting of ecodesign requirements for energy-related products, OJ L 285, 31.10.2009,
p. 10.
10
By ISIS/ENEA, preparatory study for Lot 14 (Task 1-7), Domestic Dishwashers and Washing
Machines.
EN 11 ENmarket research institute ODC Services. The results are available on the ECOWET website
quoted above11 (Task 3 report).
• The Ecodesign Consultation Forum was consulted on 4 December 2008 with the
participation of Member States, consumer organisations, environmental NGO's and the
industry represented by CECED. The working document presenting the policy options for
ecodesign requirements and implementing Directive 2009/125/EC, together with a revised
labelling scheme, were sent one month in advance of the meeting. All replies to the
working documents as well as the minutes of the meetings are available on CIRCA
website.
• A second Consultation Forum meeting was held on 26 March 2010 to discuss the options
for Ecodesign requirements and Energy Labelling of household washing machines under
the recast of the Energy Labelling Directive 92/75/EEC (now Directive 2010/30/EU). This
recast process has enforced a delay on related measures and the scenario analysis takes this
into account by introducing first tier measures from 2011 onwards (at least one year after
entry into force assumed for 2010).
1.4 Outcome of the consultation process
All respondents throughout the consultation process supported in general the adoption of
ecodesign requirements. The following issues were raised and taken into account within this
impact assessment:
• A number of Member States and environmental NGOs requested the second stage to be
implemented earlier than what was proposed in the working document submitted to the
Consultation Forum. A sub-option based on a second stage two years earlier than before
was considered in the assessment of policy options.
• The revision of the calculation of the energy consumption of washing machines was
discussed with a view to better reflect real life energy consumption12. In addition, a number
of stakeholders raised concern about the current energy efficiency index on which the
energy efficiency classes are based which seem to be more 'advantageous' to larger
washing machines (capacities 6,5 kg and higher) than to smaller machines.
• The approach on low power modes (including off mode and left-on mode, see definition in
box 1) appeared to be controversial. While the preparatory study considered the inclusion
of the consumption of low power modes into the calculation of the annual energy
consumption of the appliances (which would influence the ranking of the appliances, hence
give incentives to manufacturers to reduce the consumption of low power modes), other
stakeholders, advocated the implementation on washing machines of the horizontal
requirements laid down in the standby Regulation. This impact assessment addresses the
issue in section 2.2.3.2.
11
See results of preparatory study, task 3: Economic and Market Analysis
12
The analysis performed within the preparatory study shows that the average real life washing
temperature is 45,8ºC and the average real life load 3,2 kg per cycle while the current energy label is
based upon the performance of the machine for a standard 60ºC cotton cycle at full load.
EN 12 EN• A ranking or requirement for rinsing performance was desired by many stakeholders, but
since no good testing standard exists to assess this performance the rinsing performance
could not be included in the proposal(s) as requirement or element for labelling.
• The proposal contains a requirement for maximum water consumption as desired by many
stakeholders. Some stakeholders even asked for a stricter requirement, whereas others
warned for detrimental effects on the rinsing performance of washing machines (which, as
is stated above, cannot be adequately addressed to this date).
• The working document submitted to the consultation forum proposed to reduce the allowed
measurement uncertainty from the 15% laid down in the current energy labelling Directive
on washing machine to 10%. Some stakeholders asked for the verification limit to be
further tightened to 3 or 5%. This impact assessment assesses the scope for further
reduction in section 5.2.
Box 1: Definition of low power modes (or stand-by modes)13
Off mode: is where the product is switched off using appliance controls or switches that are
accessible and intended for operation by the user during normal use to attain the lowest power
consumption that may persist for an indefinite time while connected to a main power source.
It is a common understanding, supported by the results of the preparatory study, that in
washing machines the off mode supports active sensor based protection function(s) to protect
the user from for example accidental water leakage. The presence of such active function(s) is
promoted to insure the highest level of consumer protection.
Left on mode: is the lowest power consumption mode that may persist for an indefinite time
after the completion of the programme and unloading of the machine but not switched off by
a user intervention or automatically; again sensor based protection function(s) are in general
active. In some products this mode may be an equivalent power to off mode.
• .
2. PROBLEM DEFINITION
Until recently household washing machines have shown an impressive continuous
improvement in energy efficiency, driven in general by a strong market demand for energy
efficient products and more specifically by two initiatives: (1) the labelling directive
95/12/EC14 and (2) the voluntary commitments of the industry to phase out the least efficient
models from the market.
These two measures/initiatives resulted in an energy saving of some 24%15 between 1997 and
2005. Part of these savings were also rendered possible by the detergent industry who helped
by developing detergents that work effectively on lower cleaning temperatures, thus
decreasing the energy consumption necessary to heat water.
Figure 1: Average energy consumption per loading
13
Definition provided in the preparatory study, task 7, p. 89
14
Including amendments Commission Directives 96/89/EC and 2006/80/EC.
15
Based upon an average energy consumption of of 0,245kWh/kg in 1997 and 0,185 kWh/kg in 2005.
EN 13 ENHowever, in the most recent years the improvement of energy efficiency seems to have
halted. The highest energy efficiency class is now populated by an extremely large proportion
of available models (in major categories over 90% to 100% of models), leaving fewer options
for consumers to identify the more efficient appliances and depriving manufacturers of
options to highlight their best performing products. The preparatory study identified that
further energy savings are possible and economical for consumers, but the existing measures
and initiatives are not able to unlock this potential.
2.1 Existing legislation and other relevant initiatives
2.1.1 Energy labelling of washing machines
The current Directive 97/17/EC implementing Council Directive 92/75/EEC with regard to
energy labelling of household washing machines provides consumers with the following
information (see layout of label in Annex I):
• Ranking of the energy consumption by means of seven energy efficiency classes (A-G
scale) and energy consumption per cycle (kWh/cycle);
• Ranking of washing performance by means of seven energy efficiency classes (A-G scale);
• Ranking of spin drying performance by means of seven energy efficiency classes (A-G
scale) and indication of spin speed (rpm);
• Capacity (in kg cotton load)
• Water consumption (litres per cycle);
• Noise emissions for washing and spinning (dB(A)).
The introduction of the label helped consumers in identifying the most efficient models on the
market and weigh energy efficiency against the other performance aspects. At the same time,
the label benefited manufacturers who could state the energy efficiency of their appliances
EN 14 ENthrough a neutral (and mandatory) informative label which spurred a competitive race in
achieving the highest energy efficiency scores. The preparatory study shows indeed that the
appliances on which the benefit margin is the highest are those which are in the upper classes.
2.1.2 Voluntary commitment
The washing machine manufacturing industry represented by CECED, the European
Committee of Domestic Equipment Manufacturers, agreed upon two Voluntary Commitments
(the first in 1997, the second in 2002) which proved to be very successful in driving energy
efficiency of washing machines. The participants of the 1st commitment agreed to remove
from the market the least efficient washing machines in two steps16:
• Step one by December 1997: commitment to stop producing or importing in the EU Market
washing machines which belong to the energy efficiency classes E to G. For washing
machines with capacity up to 3 kg, the E-class was still allowed (and vertical axis
machines were allowed).
• Step two by December 1999: commitment to stop producing or importing in the EU Market
washing machines which belong to the energy efficiency class D, except for 3 kg washing
machines, washing machines with no internal heater and vertical axis machines.
The participants of the 2nd commitment agreed on the following:
• Step one by December 2003: commitment to stop producing for or importing in the EU
Market washing machines which belong to the energy efficiency classes D to G, except for
washing machines with no internal heater and vertical axis machines.
• More importantly the manufacturers also decided to support the introduction of an extra,
not EU officially recognised, "A+" energy class for machines that use maximum 0,17
kWh/kg, combined with minimum A class washing performance17.
This 2nd Voluntary Commitment ended in December 2008 and the Industry did not consider it
appropriate to renew it.
Although there is a high concentration of sales among EU producers, voluntary agreements
are becoming more difficult in practice because of the growing share of imports from non-EU
based manufacturers (e.g. Japan, China and South Korea). As a consequence the European
industry association fears not to be able to capture important actors on the EU market for a
16
CECED Voluntary Commitment on Reducing Energy Consumption of Household Washing machines –
September 1997, downloadable from www.ceced.org
17
A CECED proposal of similar meaning was put up to a vote by the Commission. Unfortunately, the 15
member States failed to reach a majority for a positive vote and the EU Commission withdrew the
legislative proposal. As the proposal was withdrawn and manufacturers wanted to have some discipline
on the market about super efficiency claims, they agreed to subscribe the following agreement about the
threshold to be used for better than A claims: manufacturers must link the better-than-A declaration also
to a minimum washing performance level in order to prevent any distortion and consumer misleading.
This minimum performance level is set at the higher rate of the labeling scheme. In other words, a
washing machine from CECED member companies can claim energy-efficiency better than energy
class A, only if the washing performance is an A class, according to the official CENELEC EN test
standard.
EN 15 ENvoluntary agreement to be effective and foresees difficulties in avoiding free riders. The
industry therefore has called instead for legally binding energy efficiency requirements18.
In addition, consumer organisations are sceptical about the value of such voluntary
agreements and favour a harmonised ecodesign and labelling scheme19.
2.2 Market failures
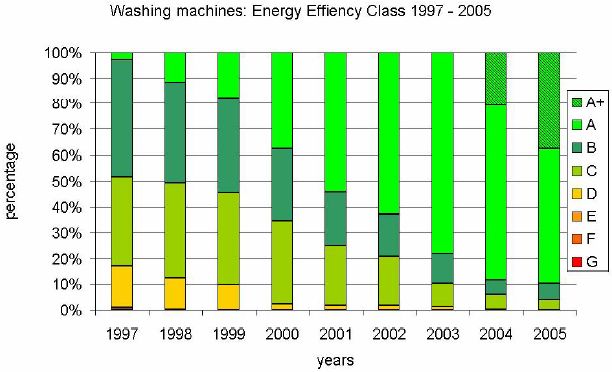
2.2.1 Clustering of products in highest efficiency classes
Energy efficiency
By 2005 the success of the label (and the voluntary commitment) led to a situation that most
(90%) of the washing machines carried the same highest energy efficiency label A. The
label’s primary function of identifying the more efficient models is therefore considered lost
(the only aid is the 'unofficial' class A+ that almost 38% of available models are carrying in
2005).
The figure 2 below illustrates the development of the market between 1998 and 2005.
Figure 2: Market distribution of washing machines by energy efficiency classes
Source: Preparatory study, task 2, p.55
18
See CECED press release on 21 March 2007, "Top executives Discontinue Voluntary Energy
Efficiency Agreements for Large Appliances", downloadable from http://www.ceced.org.
19
See among others ANEC/BEUC contribution to the revision of the Energy-using Products Directive
(Dir. 2005/32/EC), Consumer interests in Eco-design (of energy-using products), Sylvia Maurer, 2008
EN 16 ENWhen assessed per size category20, it becomes apparent that already in 2005 in almost every
category half or more of the appliances are energy class A or A+. In the 5 and 6 kg capacity
categories (that make up 78% of the market in 2005) at least nine out of ten machines are
class A/A+. This can be called a regulatory failure as due to an outdated labelling scheme
there are no market incentives to further improve energy efficiency of washing machines.
There is indeed in the current system, only very limited means for manufacturers to claim
higher energy performances than current class A (or class A+ introduced on a voluntary basis
by the industry21), hence convince consumers to pay more for lower energy using products
(energy savings imply higher purchase costs). In this situation, it appears rationale for
manufacturers not to place washing machines on the market above the threshold necessary to
be classified in energy efficiency class A (or A+).
The stand-still in development of energy efficiency of washing machines is undoubtedly a
sub-optimal situation since consumer surveys reveal that energy consumption is one of the
main criteria in consumers purchasing decision (Figure 2).
Figure 3: purchasing criteria of consumers
Source: Preparatory study, task 2, p.77
Other performance aspects
Although less pronounced, the clustering of washing machines in the highest efficiency class
also happened for washing performance. Technological improvements led to a situation in
2005, where 90% of the appliances were labelled with washing performance class A.
20
See Preparatory study, task 5, table 5.8, p.18.
21
See preparatory study, task 7, p.106. Manufacturers display class A+ on the current label even though
there is no legal basis for this.
EN 17 ENFor drying performance the picture is more diverse, because of varying drying habits (and
needs) throughout Europe, with some 13% of models in class A, 41% in class B and 26% in
class C (remaining 21% of models in class D or worse), all related to year 2005. Spin-drying
performance (expressed as residual moisture of the load) is very important considering that
many people use a clothes drier for drying the wash load.
As regards water consumption no ranking was initially provided on the ground that there is a
positive relationship between water and energy consumption (lower energy consumption is
often directly related to lower water consumption, because there is less water to heat for the
washing cycles). In addition, improvements on water consumption may be achieved at costs
of the cleaning performance of washing machines which may have negative impacts on
health.
The decline in average water consumption is obvious from Figure 422.
Figure 4: Average water consumption per cycle by year
Source: Preparatory Study, Task 2, p. 59
However not all water consumption is linked to energy consumption, e.g. cold rinses add
significantly to the total water consumption but have little impact on energy consumption. A
market survey performed by the UK Market Transformation Programme showed indeed that
there is a great variability in water consumption of washing machines in the same energy
efficiency class A. This appears to be a sub-optimal situation since water consumption is one
of the main purchasing criteria of consumers as highlighted in Figure 3.
22
The apparent stand-still between 2004 and 2005 is no actual standstill since the average capacity of the
machines has grown in those years. The water consumption as L/kg shows an ongoing decline.
EN 18 EN2.2.2 Negative externality
There is a negative externality related to energy use: not all environmental costs are included
in electricity prices. That is why consumer (and producer) choices are made on the basis of
lower electricity price not reflecting environmental costs for the society.
2.3 Grounds for an implementing measure
Taking into account on one hand the strong market demand for more efficient appliances and
on the other hand the rejection of a new Voluntary Commitment as an alternative to address
the environmental impact of washing machines, Member States, the industry and consumer
organisations have asked for both, a revision of the labelling directive and the adoption of
eco-design requirements.
The Ecodesign Directive sets in Article 15 (§1) and (2) the criteria upon which a new
implementing measure on ecodesign may be adopted:
(1) the energy using product shall "represent a significant volume of sales and trade,
indicatively more than 200 000 units a year";
(2) it shall "have a significant environmental impact within the EU";
(3) it shall "present significant potential for improvement in terms of its environmental
impact without entailing excessive costs, taking into account in particular:
• the absence of other relevant EU legislation or failure of market forces to address
the issue properly;
• a wide disparity in the environmental performance of energy using products
available on the market with equivalent functionality."
2.3.1 Washing machine volume of sales & trade
The total sales of domestic washing machines in the EU-27 is close to 14 million units in
2005, which is far beyond the indicative threshold of 200 000 units set by the ecodesign
framework Directive to define whether the sales volume are significant.
With an average product price of 443,50 EUR (incl. VAT, 2005 23) the total trade represents a
value of 6.12 billion EUR.
Of these almost 14 million washing machines the 5 and 6 kg capacity machines are the most
popular (they represent almost 80% of the models available, 4,5 kg is another 10% of the
market). The market split up by size category (as number of models in database) and the
presence of models by efficiency class is given in table below.
23
From Task 6, par. 6.4.3.1, p.64
EN 19 ENTable 1: Models by energy efficiency class and capacity
Capacity # of
% of models in energy class % of models
models
(kg) A+ A B C D technical database
3 0,2% 0,2% 17 0,3%
3.5 0,7% 0,1% 0,2% 52 1,0%
4 0,7% 0,1% 37 0,7%
4.5 1,3% 4,8% 1,8% 1,3% 0,0% 481 9,3%
5 11,6% 32,1% 3,9% 2,4% 2597 50,0%
5.5 1,3% 3,4% 0,0% 0,0% 250 4,8%
6 19,9% 8,3% 0,2% 1471 28,3%
6.5 0,0% 2 0,0%
7 3,0% 0,5% 182 3,5%
7.5 0,4% 1,1% 79 1,5%
8 0,0% 0,3% 14 0,3%
9 0,1% 0,1% 10 0,2%
Overall 37.6% 52.1% 6.2% 4.1% 0.0% 5192 100%
Source: Preparatory Study, task 5, table 5.12, p.22 and table 5.14, p.30
The sales show a slow growth up to 2005, indicating that the EU27 market for washing
machines is close to its saturation point. In Western-Europe penetration rates of 90 to 95% are
not uncommon, indicating a saturated market, dominated by replacement sales. In Eastern-
Europe there is slightly more potential with penetration rates of 80 to 90% for countries such
as Czech Republic and Poland. The overall drivers of the market are mainly replacement sales
and the increase of number of households 24.
Baseline scenario (BAU)
For the Baseline scenario-analysis (see results in section 5) the sales are assumed to steady
themselves after 2005 in order to maintain an overall penetration rate of maximum 95% in
2015. The graph shows that for certain years the sales even decline in order to keep
penetration at maximum 95%. The calculated stock is therefore somewhat smaller than in the
preparatory study25 (where no check on household saturation was found). The installed base is
some 167 million appliances in 2005 and 202 million in 2025 for the EU 27. The stock
calculation is thereby based on an average product life of 15 years.
24
See preparatory study, task 2, p. 33-40.
25
Task 7, table 7.16, p.47
EN 20 ENFigure 5: Baseline sales ('000) and installed stock ('000)
sales ('000 units)
14500
14000
13500
13000
12500
12000
11500
11000
10500
10000
9500
9000
8500
8000
7500
1990 1995 2000 2005 2010 2015 2020
park ('000 units)
210000
200000
190000
180000
170000
160000
150000
140000
130000
120000
110000
100000
1990 1995 2000 2005 2010 2015 2020
Source: Input to this impact assessment by VHK
2.3.2 Washing machine environmental impact
A life-cycle analysis (LCA) was run within the preparatory study to identify the
environmental impact of washing machines following the methodology defined in the
ecodesign framework Directive, annex I, part 1. The life cycle analysis was based upon:
• the definition of a base case, representative of the most common washing machine: a 5,36
kg machine;
EN 21 EN• inventory tables received from manufacturers that include data on raw material,
manufacturing, transport, distribution, use and end-of-life of the base case appliances;
• aggregation of the results using the EuP EcoReport and the SimaPro software.
The analysis illustrated in figure 6 shows that for most environmental impacts, the most
dominant phase is the use-phase, except for the emissions of hazardous substances and waste
which are mainly production related (production of raw materials and manufacturing).
The use-phase is characterised by high (over 90% of total) energy related emissions (such as
greenhouse gas and acidifying emissions). Water consumption over the lifecycle is also
highest in the use-phase (almost 100% of total).
Figure 6: Life cycle impacts of a washing machine
Source: Preparatory study, task 5, p.57
The use of (product related) hazardous substances during the production phase is dealt with
by Directive 2002/95/CE on the Restriction of Use of Hazardous Substances in Electrical and
Electronic Equipment (RoHS Directive).
The end-of-life phase is addressed in the Waste of Electrical and Electronic Equipment
Directive 2002/96/CE (WEEE Directive). Since washing machines comprise many materials
that are recyclable and have a very high economical value (e.g. stainless steel, aluminium,
copper), the majority of materials are recycled at the end-of-life. The WEEE Directive states
that entities responsible for bringing washing machines onto the market are also responsible
for adequate take-back.
Considering the total scope of product policies already in place, covering many aspects of
lifecycle emissions (RoHS and WEEE), it appears appropriate to focus ecodesign
requirements on energy and water consumption.
Baseline scenario
EN 22 ENThe baseline scenario indicates that the total energy and water consumption of washing
machines will respectively grow by 7% in 2020, due to a growing stock (see detailed
assessment in section 5). The scenario is based upon average of 234 washing cycles per year26
and includes a correction for real-life energy consumption of 0,69 (from 2005 on).
• Electricity: in 2005 35 TWh/y (equivalent to 316 PJ/y primary energy), in 2020 37,7
TWh/y (339 PJ/y primary energy);
• CO2 Emissions: in 2005 18.2 mton/y, in 2020 19.6 mton/y;
• Water consumption (use phase only): in 2005 2213 million m3/y, in 2020 2051 million
m3/y.
2.3.3 Potential for improvement
Energy consumption
With 90% of products in energy efficiency class A (or class A+, the class introduced by the
industry on a voluntary basis -see Table 1), there is a limited disparity in the energy
performance of washing machines currently available on the market. This may imply that the
third criterion of the Ecodesign Directive is not met.
The identified regulatory and market failures indicate however that this situation may in fact
result from outdated energy efficiency classes.
Water consumption
In water consumption certain disparity also exists: the range in water consumption of washing
machines within the same size clearly indicates room for improvements.
26
Which corresponds roughly to the real life behaviour of end-users. Although the preparatory study
identified an average of 4,9 cycles/week (see task 3, p. 48) in task 7. table 7.13 (p.44) 234 cycles/year
have been used. This impact assessment also uses 234 cycles/year. Task 6 (p. 90) shows that various
figures for cycles/year have been used in relevant literature (ranging from 200 to 245 cycles/year).
EN 23 ENTable 2: Energy and water consumption of washing machines by size in 2005
Capacity (kg) Energy consumption (kwh/cycle) Water consumption (litre/cycle) %
models
average min max average min max
3 0.686 0.570 0.790 42.2 39.0 45.0 0.33
3.5 0.722 0.660 0.940 45.3 39.0 63.0 1.00
4 0.722 0.750 0.920 44.6 37.0 70.0 0.71
4.5 0.917 0.760 1.300 53.2 37.0 75.0 9.26
5 0.956 0.830 1.370 50.4 35.0 74.0 50.00
5.5 1.012 0.920 1.450 50.9 39.0 69.0 4.82
6 1.057 0.950 1.380 49.2 37.0 69.0 28.30
6.5 1.200 1.200 1.200 50.0 50.0 50.0 0.04
7 1.208 1.020 1.330 52.6 43.0 72.0 3.51
7.5 1.381 1.270 1.450 70.3 64.0 72.0 1.52
8 1.466 1.360 1.520 68.1 60.0 78.0 0.27
9 1.780 1.700 1.900 75.0 69.0 84.0 0.19
average/total 0.998 50.7 100
Source: Preparatory study, task 5, p.29
2.3.3.1 Life cycle cost analysis
A list of possible technological innovations (already applicable and/or estimated to be
available in the future) that improve energy consumption of washing machines has been
gathered in close cooperation with manufacturers, together with the price increase and
environmental impact of each of the identified technological option27.
Applied to the standard base case, it is possible to identify the lifecycle costs (LCC) for each
(combination of) option(s) that reduce the energy consumption. Figure 7 illustrates the results
of the analysis28.
27
See results in the preparatory study, task 6, p.21-31.
28
Task 6, p.64: Key economic assumptions: product life: 15 years; cycles per year: 220; discount rate:
5%/year; electricity price: 0,17 €/kWh; water price: 3,7€/m3; detergent, softener, rinsing agent: 2,34
€/kg, 0,6 €/kg and 2,4 €/kg respectively; maintenance and repairs: 5,5€/year; disposal and recycling: 61
€/life (at end of life); average machine price: 443,50€.
EN 24 ENFigure 7: Life cycle costs of options by energy consumption (kWh/cycle)
Source: Preparatory study, task 6, p.75.
– The first point on the left of the life cycle cost curves represents the base case appliance
with current life cycle costs;
– The lowest point on each curve indicates the least life cycle cost point (LLCC);
– The points at the furthest right indicate consumption values at which the life cycle costs
have increased beyond that of the original base case applying the best available
technologies (BAT) on the market in 2005;
– Above the BAT level, technological options are applied that increase energy consumption,
such as internet connectivity and voice control.
The preparatory study did not assess in-depth the effects of reducing energy consumption on
washing and spin drying performance, but possible detrimental effects of energy saving
options on overall product performance have been considered while selecting technological
options that make up the LLCC and BAT levels. In doing so, the LLCC and BAT levels
represent machines with equivalent performances as the base case machines. The market has
also proven to be able to raise both energy efficiency and cleaning/drying performances (see
section 2.2.1)
According to the methodology laid down in the Ecodesign Framework Directive Annex II,
minimum energy efficiency requirements should aim at the point of LLCC for end-users,
provided there are no significant negative impacts on the parameters listed in article 15 (5)29.
The life cycle costs (purchase price together with the operating costs of the appliance,
assuming a 15 years product life) confirm that the LLCCav level is cost-effective with a
relatively short payback time of around 1,2 years (Task 6, p.88). It is assumed in addition that
29
"Concerning energy consumption in use, the level of energy efficiency or consumption will be set
aiming at the life-cycle cost minimum to end-users for representative EuP models, taking into account
the consequences on other environmental aspects".
EN 25 ENthe combined effect of the labelling scheme (together with the ecodesign requirements) will
drive innovation and progressively reduce the costs of technological options, hence the
purchase price and the marginal payback time for consumers. Section 6.1.2 discusses the
aggregated impact of policy options on consumers.
The sensitivity analysis performed within the preparatory study - with different assumptions
for the electricity price, at 0,10 €/kWh and 0,25 €/kWh (compared to 0,17 €/kWh in the
scenario presented above); water price at 3,7 €/m3, 4,8 €/m3 and 2,6 €/m3; product life of 10,
12 and 17 years (compared to 15 years assumed in the scenario presented above), washing
machine price of 562 EUR in Western Europe and 326 EUR in Eastern Europe, 40ºC washing
cycles and the number of cleaning cycles per year at 200 and 245 in addition to the 220
assumed - confirms the validity of the point of Least Life Cycle Cost identified30.
LLCC level
Table 2.2 gives an overview of the levels achieved at LLCC. The cost-effective level of
improvement is 10%. These values assume a noise level of 53/70 dB(A). The energy
consumption levels of the base case correspond to the current threshold of energy efficiency
class A.
This consumption level will be the target for the ecodesign implementing measures. Note that
the water consumption at LLCC level has also been reduced by up to 24% because many
design options aim to reduce the hot water consumption, thereby reducing both energy and
water consumption.
Table 2: Energy and water consumption at LLCC level (average standard base case)
Energy consumption Water consumption Purchase price
(kWh/cycle) (L/cycle) (EUR)
Standard
Base Base change
average LLCCav LLCCav LLCCav
case change case % Base change
base case
% case %
5,36 kg 0,998 0,900 -10 50.7 38.7 -24 443.50 459.7 +3.7
Source: preparatory study, task 6, Table 6.42, p.88
BAT level
Additional energy savings can be reached by applying energy saving technologies beyond the
point of LLCC. The design of the energy efficiency classes of the labelling scheme should
reflect these levels so as to give incentives for further innovations.
Table 3 indicates the level of EEI achievable applying the best available technologies (BAT)
on the market (i.e. technologies already commercialised), assuming the same spin drying
speed, capacity and noise level of 53/70 dB(A) as the base case.
30
Preparatory study, task 6, p. 87
EN 26 ENYou can also read