4 Ocean Energy - Wave and Tide - River Publishers
←
→
Page content transcription
If your browser does not render page correctly, please read the page content below
4
           Ocean Energy – Wave and Tide

                              Gordon Dalton
University College Cork, Ireland

4.1 Introduction
4.1.1 Policy and EU Strategy Initiatives Overview
      for the Ocean Energy Sector
Our seas and oceans have the potential to become important sources of clean
energy. Marine renewable energy, which includes both offshore wind and
ocean energy (wave and tidal energy), presents the EU with an opportunity to
generate economic growth and jobs, enhance the security of its energy supply
and boost competitiveness through technological innovation. Following the
2008 Communication on offshore wind energy (European Commision 2008),
the European Commission (EC) considered the potential of the ocean energy
sector to contribute to the objectives of the Europe 2020 Strategy (European
Commision 2010) as well EU’s long-term greenhouse gas emission reduction
goals. It also looked over the horizon at this promising new technology (Blue
Growth) and outlines an action plan to help unlock its potential.
    In 2008, the European Commission stated that “Harnessing the economic
potential of our seas and oceans in a sustainable manner is a key element in
the EU’s maritime policy” (European Commision 2007). The ocean energy
sector was highlighted in the Commission’s Blue Growth Strategy (European
Commision 2012) as one of five developing areas in the ‘Blue Economy’ that
could help drive job creation in coastal areas. Other Commission initiatives
were the Communication on Energy Technologies and Innovation (European
Commision 2013) and the Atlantic Action Plan (European Commision 2013).
The Atlantic Action Plan recognised the importance of ocean energy and
aimed to encourage collaborative research and development and cross-border
cooperation to boost its development and published two key reports on Ocean

                                    137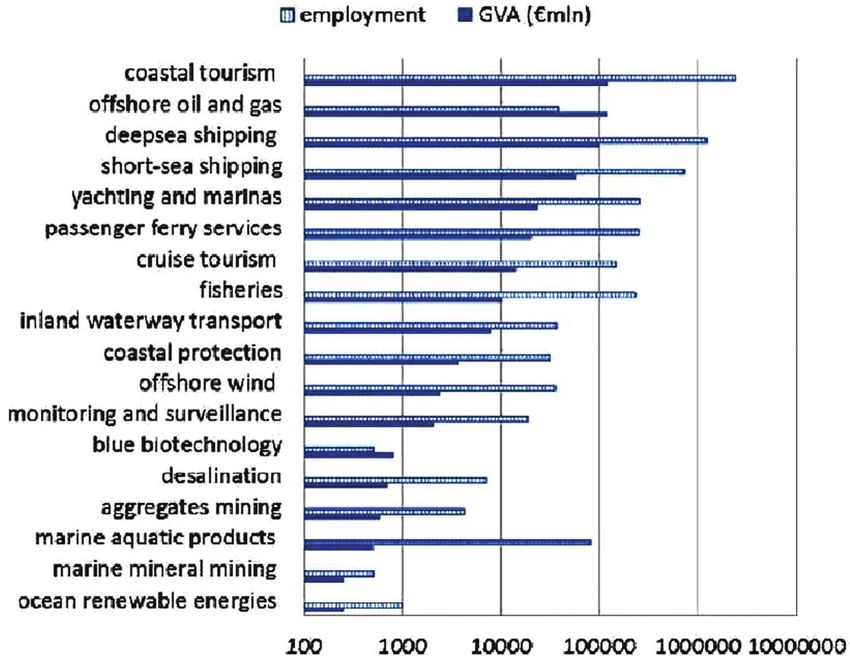
138      Ocean Energy – Wave and Tide

Figure 4.1 The history of Ocean Energy Policies at EU level. Image from JRC report 2016
(Magagna, Monfardini et al. 2016).

Energy development: “Blue Growth, opportunities for marine and maritime
sustainable growth” (Altantic Action Plan 2013), and “Action Plan for a
maritime strategy in the Atlantic area” (Atlantic Action Plan 2013). In 2014,
the European Commission summarised all the initiatives in its COM/2014/08
final report “Blue Energy Action needed to deliver on the potential of
ocean energy in European seas and oceans by 2020 and beyond” (European
Commision 2014).
    In 2014, the Strategic Initiative for Ocean Energy (SI Ocean)1 , released a
report (SI Ocean 2014) detailing four main barriers to widespread wave and
tidal energy deployment in Europe, namely:
  1. Financial risks: market stresses, public support mechanism fluctuations,
     reduced investor confidence.
  2. Technology risks: lack of commercially ready prototype devices, TRL8
     or higher, due to failure of technology developers to overcome tech-
     nology barriers. Insufficient cost reduction has been demonstrated as
     technology moves to higher TRL.
  3. Regulatory and consenting barriers still exist in most jurisdictions with
     slow progress on their resolution. On the other hand, environmental
     impact requirements are increasing, delaying consents and increasing
     costs.
  4. Grid connection, both adequate and sufficient, still remains a huge non-
     technical barrier, mainly due to the remote nature of most ocean energy
     resource areas, and lack of existing infrastructure. Lack of grid infras-
     tructure could posing real risk to large scale deployment once technical
     barriers are overcome.

  1
      https://ec.europa.eu/energy/intelligent/projects/en/projects/si-ocean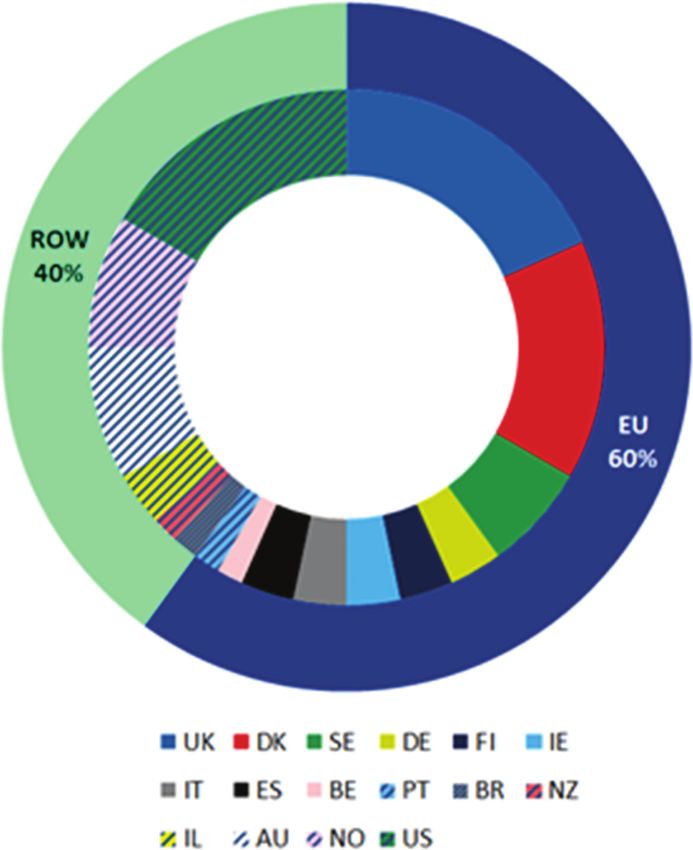
4.1 Introduction   139

The report offered recommendations for addressing those barriers, as part of
its market deployment strategy. SI Ocean presented a vision of Europe reach-
ing 100 gigawatts (GW) of installed wave and tidal energy capacity by 2050,
the report’s subsequent chapters focus on finance, technology development,
regulatory regimes and the grid. Each chapter identifies the challenges these
risk areas present, offers goals to remove barriers and recommends way to
meet those goals. The report suggests that regulators incorporate wave and
tidal energy projects into long-term grid development plans.
    In 2014, the Ocean Energy Forum2 was created by the European Commis-
sion, under the stewardship of Ocean Energy Europe3 . The Forum brought
together more than 100 ocean energy experts over two years. Ocean Energy
Europe created TP Ocean (Ocean Energy Europe 2014) initiative, called the
European Technology and Innovation Platform for Ocean Energy. TP Ocean
identified six essential priority areas to be addressed to improve ocean energy
technology and decrease its risk profile:
  1. Testing sub-system components and devices in real sea conditions.
  2. Increasing the reliability and performance of ocean energy devices
     allowing for future design improvements.
  3. Stimulating a dedicated installation and operation and maintenance
     value chain, to reduce costs.
  4. Delivering power to the grid, with hubs to collect cables from ocean
     energy farms and bring power to shore.
  5. Devising standards and certification, to facilitate access to commercial
     financing.
  6. Reducing costs and increasing performance through innovation and
     testing.
In November 2016, the Ocean Energy Forum created the ‘Ocean Energy
Strategic Roadmap’ (Figure 4.1) (Ocean Energy Forum 2016).
    The Roadmap puts forward four key Action Plans focused on maximising
private and public investments in ocean energy development by de-risking
technology as much as possible, ensuring a smoother transition from one
development phase to another on the path to industrial roll-out and a fully
commercial sector.
    The second initiative of the Ocean Energy Forum was Strategic Research
Agenda for Ocean Energy developed by Technology and Innovation Platform

  2
      https://www.oceanenergy-europe.eu/en/policies/ocean-energy-forum
  3
      https://www.oceanenergy-europe.eu/en/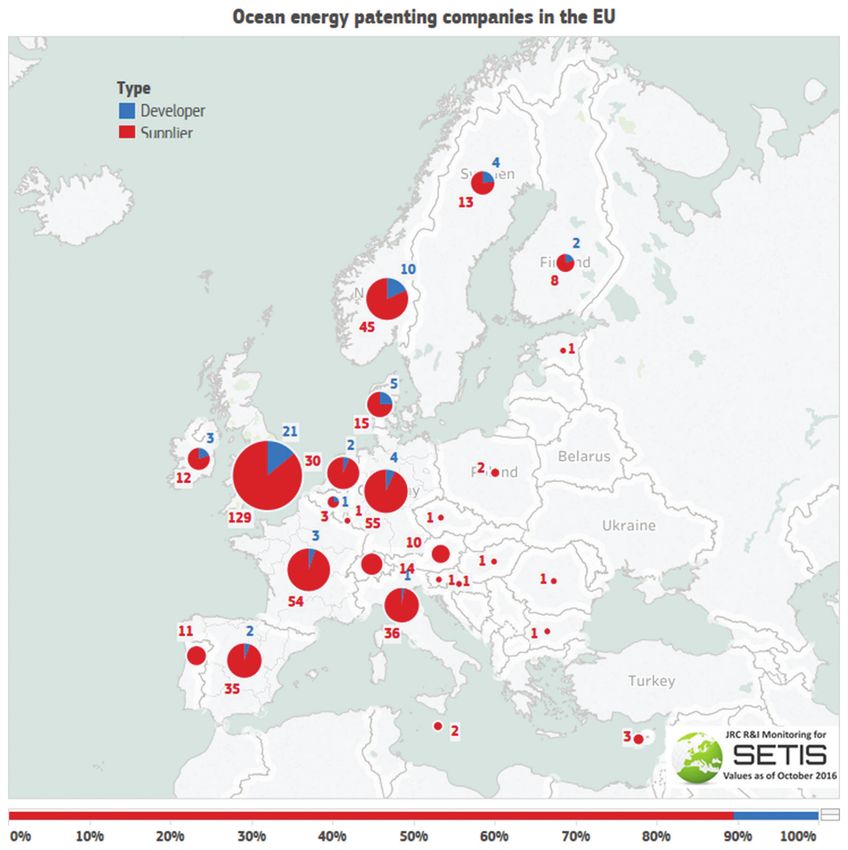
140 Ocean Energy – Wave and Tide
for Ocean Energy (TP Ocean 2016). The ocean energy sector has identified
12 priority research areas and 54 research and innovation actions. The re-
search areas have been attributed indicative budgets that industry, national
authorities and the European Commission need to commit to finance the
RD&I programmes. Rolling-out the actions of this Agenda would generate
around e1 bn in investment over 4 to 5 years. The outcomes for the ocean
energy sector would be the improvement of current technologies and the
identification of novel financial instruments to sustain the critical phase of
moving to demonstration projects.
4.1.2 Tidal Energy Development Demographics
Tidal energy is predictable up to 100 years in advance (Alcorn, Dalton
et al. 2014), making tidal energy attractive to grid operators by adding
more predictable and consistent sources of renewable energy which has
the effect of smoothing out the overall power supply from renewables. In
tidal energy, there has been a general convergence of the technologies, with
several developers testing full-scale prototypes and plans for commercial
deployments.
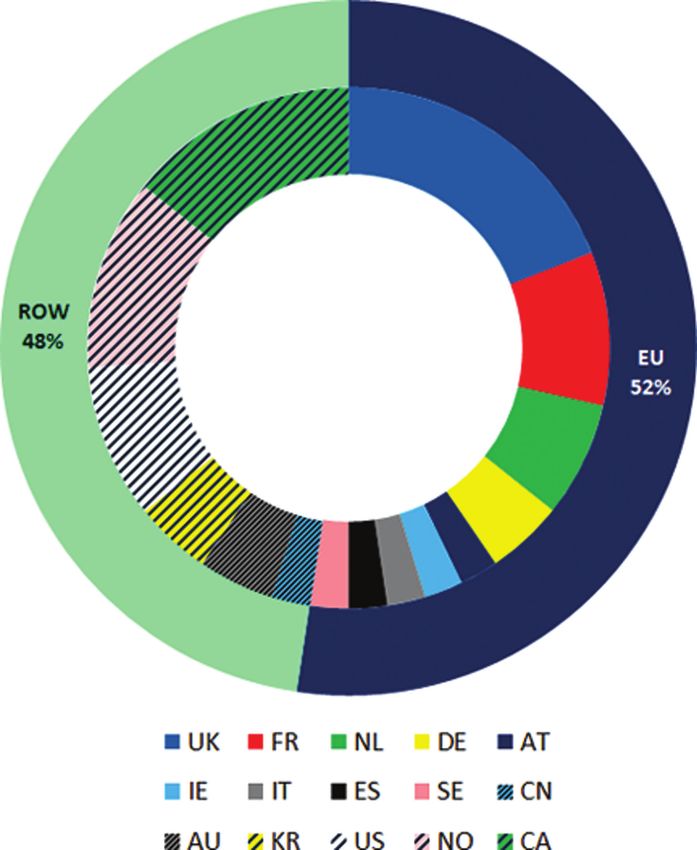
Worldwide, many companies are currently developing tidal energy de-
vices with most (about 52%) being based in the EU (Magagna, Monfardini
et al. 2016). In Europe, the country with the highest level of development is
the United Kingdom, followed by the Netherlands, and France. The United
States and Canada are the major non-EU players (Figure 4.2).
The development of tidal technology is taking place in countries with the
major tidal energy resources: UK, France, and Ireland (OES 2016). Other
active countries, with more limited resources include Germany and Sweden.
4.1.3 Wave Energy Development Demographics
Wave energy is highly predictable days in advance and compliments wind
energy by generally achieving its peak energy after wind energy has reached
its maximum (Alcorn, Dalton et al. 2014). Therefore wave energy is a further
alternative for grid operators seeking to smoothing out the overall power
supply from renewables. By 2016 about 70 different design concepts were
under development (OES 2016), Unlike wind energy (or even tidal current),
designs for wave energy devices have not converged around a standard tech-
nology solution (more likely that wave energy will converge on a number of
standard technologies), and relatively few have made it to full scale prototype
testing, and there are no current plans for commercial arrays. The majority of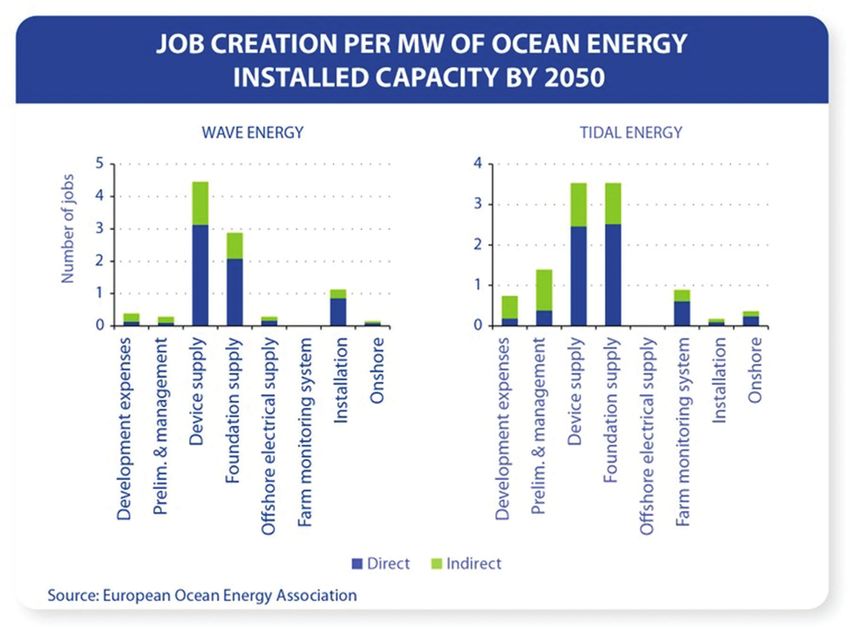
4.2 Market    141

Figure 4.2 Global spread of tidal development companies. Image JRC Ocean Energy Status
Report 2016. (Magagna, Monfardini et al. 2016).

companies developing wave energy devices are based in the EU (Magagna,
Monfardini et al. 2016) (Figure 4.3). The United Kingdom has the highest
numbers of developers, followed by Denmark. Outside the EU, countries with
a larger number of wave energy developers are USA, Australia, and Norway.
Globally, about 57 wave energy developers have tested their devices in open
waters or will do so in the near future.
    See Section 4.5 ‘Innovation’ for details on wave and tidal companies and
their lifecycle stage.

4.2 Market
There are potentially enormous exploitable energy resources available in the
world’s oceans. This would suggest significant potential markets for the sale
of ocean energy as well as opportunities for supporting industries and services
involved in the development, manufacturing, construction, installation and
operation (Alcorn, Dalton et al. 2014). However, uncertainty in future costs
makes it difficult to estimate the scale of the opportunity and the size of the
long term potential market.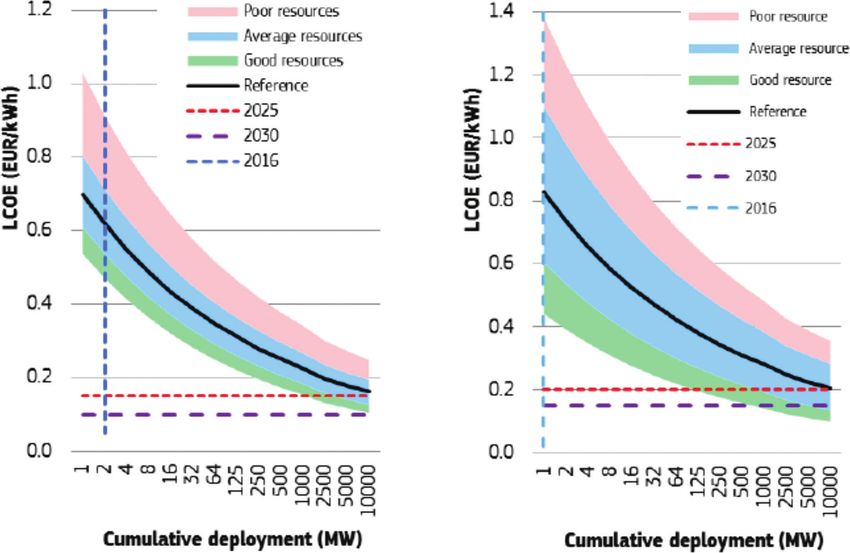
142   Ocean Energy – Wave and Tide

Figure 4.3 Global spread of wave development companies. Image JRC Ocean Energy Status
Report 2016 (Magagna, Monfardini et al. 2016).

4.2.1 Global Ocean Energy Resources and Potential Economic
      Return
The total theoretical energy contained in the seas is estimated to be
32,000 TWh/yr for wave (Mork, Barstow et al. 2010) and 7,800 TWh/y for
tides (IEA-OES 2011). It is this potential scale that justifies the drive for its
development (Alcorn, Dalton et al. 2014, Magagna, Monfardini et al. 2016).
Wave energy devices derive energy from the three dimensional movement of
ocean waves. Tidal energy devices harnesses the bodily movement of water
resulting from the environmental pull between the moon and the earth. The
efficiencies of future ocean energy technologies will dictate how much of
this resource can be usefully harnessed. The technically exploitable energy
of wave energy devices is estimated to be 5,500 TWh/yr (Lewis 2011), which
is approximately 30% of world electricity demand. Whilst currently under
development, the Ocean Energy Forum goal is to install 100GW of wave and
tidal by 2050. This equates to 350 TWh of exploitable electricity and opens
up a global market for investment, jobs and growth. This would meet 10% of
the power demands of the EU, a significant component in the transition to a
low carbon clean economy.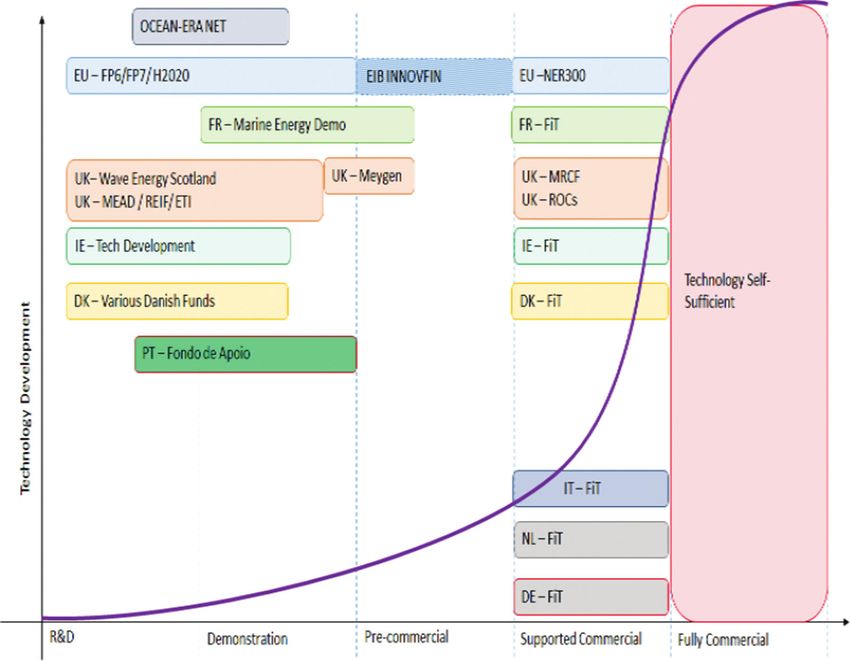
4.2 Market   143

     In 2009 the Renewables Directive 2009/28/EC (European Commision
2007) set binding targets for all EU Member States, such that the EU will
reach a 20% share of energy from renewable sources by 2020 and a 10% share
of renewable energy specifically in the transport sector. The primary produc-
tion of renewable energy within the EU-28 in 2014 was 196 million tonnes of
oil equivalent (toe) – a 25.4% share of total primary energy production from
all sources (Eurostat 2016).
     For Europe to meet its objective of reducing greenhouse gas emissions
to 80–95% below 1990 levels by 2050 (European Commision 2011), Ocean
Energy is needed in a diversified low carbon and renewable energy portfolio.
Investment wise the global market between now and 2050 is estimated to
be worth e653 bn (Ocean Energy Forum 2016) (cumulative, undiscounted)
which would bring great benefit to European and world economies. Tidal
energy is going strongly in its development and some niche opportunities
are expected, whilst wave energy has suffered some setbacks in invest-
ment in 2015 in the EU. The World Energy Council estimates the global
capital expenditure for wave energy projects to be more than £500 bil-
lion, based on a technically exploitable wave resources of 2,000 TWh/year
(World Energy Council 2007). So far, over the past 10 years the ocean
energy industry has invested an estimated e1 bn in capital to move con-
cepts from the drawing board to deployment in EU waters (OEE 2016
(Ocean Energy Forum 2016)).

4.2.2 Installed Capacity and Consented Capacity
      for Wave and Tidal
This section presents the target deployment predictions of the major policy
agencies reviewing ocean energy. There was great optimism in the early
2000’s and accordingly ambitious targets. Successive reviews for both near
term, 2015, and far term, 2050, were revised downwards, as real deployments
failed to materialise. It is likely that the current 2050 projections will be
revised down in subsequent reviews.
2020 deployment predictions
JRC and European Commission in 2010 (European Commision 2010)
set European targets for wave and tidal of 1.9 GW by 2020. In 2015,
OEE downsized the prediction for ocean energy deployment, reaching a
cumulative capacity of 850 MW by 2020 (OEE 2015 (Ocean Energy
Forum 2016)).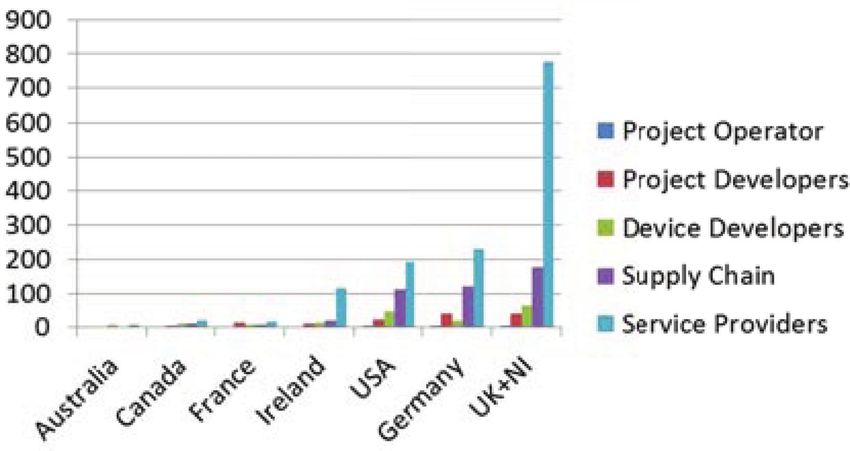
144   Ocean Energy – Wave and Tide

2050 deployment predictions
In 2007, the IEA-Ocean Energy Systems Implementing Agreement (IEA-
OES), predicted combined wave and tidal deployment of 337 gigawatts
(GW) of capacity worldwide by 2050 (IEA-OES., Khan et al. 2008). (By
comparison, the capacity of the much more developed wind energy sector
reached the same figure – 336 GW – by the end of June 2014).
    Current estimates from 2014 for 2050 deployments, as quoted by
SI Ocean (SI Ocean 2014), currently stand at 100 GW of combined
wave and tidal capacity installed (elaborated by Magagna (Magagna and
Uihlein 2015)).
    Table 4.1 represents more detailed breakdown provided by OES 2015
Annual Report for Ocean Energy up to 2020 (OES 2015):
   • current installed capacity
   • consented capacity.
Current capacity (2015) installed for tidal energy exceeds wave energy by a
factor of 5, at 2.4 MW for wave energy and 14 MW for tidal.
    The current predictions for wave energy deployment was optimistic
(consented capacity in Table 4.1), requiring a sizeable increase in deployment

Table 4.1 Table from Ocean Energy Systems Data taken from OES 2015 report (OES 2015)
                               Installed Capacity MW 2015      Consented Capacity
 Basin           Country       Wave        Tidal Stream       Wave Tidal Stream
 Atlantic        UK             0.96            2.1             40          96
                 Portugal        0.4             –               5           –
                 Spain           0.3             –               –           –
                 France           –             2.5              –         21.5
                 Ireland          –              –               –           –
 Baltic          Sweden          0.2             8             10.6
                 Belgium          –              –              20           –
                 Netherlands      –             1.3              –          2.2
                 Norway           –              –              0.2          –
                 Denmark          –              –             0.05          –
 Caribbean       Inactive         –              –               –           –
 Mediterranean Inactive           –              –               –           –
 Rest of World Canada           0.09             –               –          20
                 China          0.45           0.17             2.7         4.8
                 United States    –              –              1.5         1.3
                 Korea           0.5             1              0.5          1
 Total           –              2.4           14.07           80.05       145.8
                                       16.47                        225.85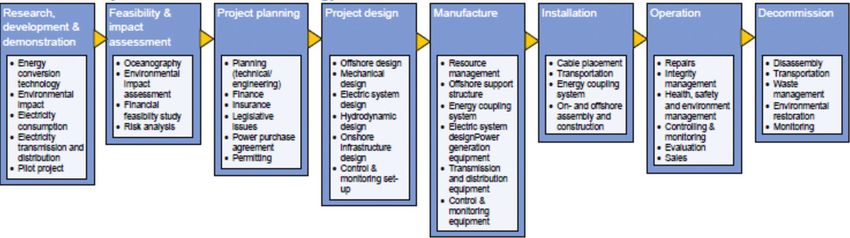
4.2 Market     145

of 4000% in MW deployed, from current 2 MW up to 80 MW. UK, Sweden
and Belgium plan to take the lead, with approx. 20–40 MW deployments in
each jurisdiction. Tidal energy also has optimistic deployment gains, although
more modest, with a 10 fold increase in MW deployed from 14 MW to
145 MW. Deployments in the remainder of the world are currently modest,
with no major plans for increases. The exception is Canada, where tidal
energy is predicted to reach 20 MW installed by 2020.
    In summary, current capacity deployments to date (2016) of 16.7 MW
will make it highly unlikely that the OEE target of 850 MW by 2020 will be
reached (OEE 2015 (Ocean Energy Forum 2016)).
    However, the global potential market identified by SI Ocean (SI Ocean
2014) of 100GW by 2050 is substantial, with very large capital expenditure.
These investments would add significantly to Europe’s strategic goals of jobs
and growth for the European Area.

4.2.3 Capital Expenditure (Capex/MW or e/MW)
Chozas et al., conducted a comprehensive literature review of published data
on historical costs, planned projects and reference reports that estimate capital
expenditure (Capex costs/MW) for both wave and tidal (Figure 4.4) (Chozas,
Wavec et al. 2015). They state that there is a significant variability of CAPEX
values for the first pilot projects (up to 1 MW) installed worldwide, ranging
from e10–50 M/MW for wave energy, and a much lower e5–20 M/MW
for tidal energy. The trends for both technologies were relatively similar as
they progressed to commercial stage, converging to e3–6 M/MW for both
wave and tidal energy. Other reviews of Capex/Mw for ocean energy are
conducted by Dalton et al. (Dalton, Alcorn et al. 2009, Dalton 2010, Dalton,

Figure 4.4 CAPEX cost per kW installed for 1: wave 2: tidal, relative to project deployed
capacity. Image taken from Chozas et al., (Chozas, Wavec et al., 2015).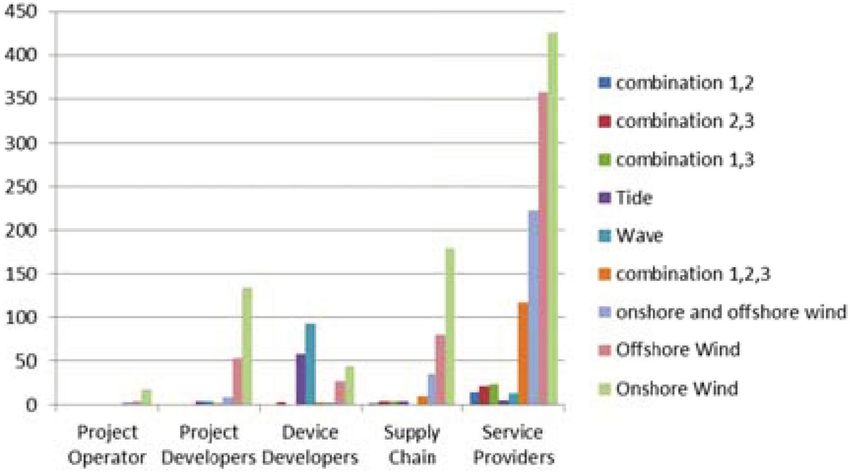
146    Ocean Energy – Wave and Tide

Alcorn et al. 2010, Dalton, Alcorn et al. 2010, Dalton 2011, Dalton and
Lewis 2011, Dalton, Alcorn et al. 2012, Dalton, Allan et al. 2016, Dalton,
Allan et al. 2016).

4.2.4 Prices – Cost of the Product – Levelised Cost of Electricity
      LCOE
The Levelised Cost of Electricity (LCOE) is one of the most commonly used
financial indicators to compare the cost of energy projects. Magagna et al.
(Magagna and Uihlein 2015) published a comprehensive report in 2015 on the
business cases for wave and tidal. Figure 4.5 compares wave and tidal LCOE
to other renewable technologies as well as fossil fuels. LCOE for wave has
a range of e500–650/MWH and Tidal a range of e350 to 450/MWh. Their
forecast for cost reductions and learning for both however are optimistic, with
Wave LCOE dropping to e80/MWH and Tidal e60/MWH, competitive to all
other renewables and fossil fuels.
    The JCR report, authored again by Magagna (Magagna, Monfardini et al.
2016), approached LCOE reduction from a cumulative installed prospective
and in Figure 4.6, also insert timeframe benchmarks. By 2030, they predict

Figure 4.5 LCOE for alternative and conventional energy technologies. Solid bars indicate
current cost ranges, while shaded bars indicate expected future cost reductions. Image taken
from Magagna (Magagna and Uihlein 2015).
4.2 Market 147
Figure 4.6 LCOE cost reduction ranges with cumulative deployments; 1. Tidal 2. Wave.
Image taken from (Magagna, Monfardini et al. 2016).
cumulative installed capacity for both technologies will reach 10 GW each,
and that LCOE for both technologies will drop to e100–120/MWH.
Another JCR report (Global CCS Institute 2013), conducted by Global
CCS, has a longer time span projection to 2050, also predicting that wave
and tidal LCOE cost will reduce to approximately e80/MWH (Figure 4.7).
A more detailed review and modeling of LCOE of Wave and Tide was
published by Chozas (Chozas, Wavec et al. 2015). Table 4.2 is taken from that
report, and presents LCOE results for the various stages of commercialization
for both technologies, however not specifying size of deployment, cumulative
installed capacity or timeframe specified. At full commercial scale, Chozas
predicts a tidal LCOE of e130/MWH and most unusually, wave lower than
tidal at e120/MWH.
Chozas (Chozas, Wavec et al. 2015) also presents LCOE modeling based
on learning curves, as does Dalton (Dalton, Alcorn et al. 2012). Other reviews
of LCOE for ocean energy include Dalton et al. (Dalton, Alcorn et al. 2009,
Dalton 2010, Dalton, Alcorn et al. 2010, Dalton, Alcorn et al. 2010, Dalton
2011, Dalton and Lewis 2011, Dalton, Alcorn et al. 2012, Dalton, Allan et al.
2016, Dalton, Allan et al. 2016).148 Ocean Energy – Wave and Tide
Figure 4.7 LCoE (e/kWh) projections for the main power generation technologies. Image
taken from JCR Report (Global CCS Institute 2013).
Table 4.2 LCOE of wave and Tidal, for 3 stages of development: First array, second array
and Commercial. Table taken from Chozas et al. (Chozas, Wavec et al. 2015)
Wave Tidal
1
Deployment Stage Variable Min Max Min Max
First array/First Project2 Project Capacity (MW) 1 33 0.3 10
CAPEX ($/kW) 4000 18100 5100 14600
OPEX ($/kW per year) 140 1500 160 1160
Second array/ Project Capacity (MW) 1 10 0.5 28
Second Project
CAPEX ($/kW) 3600 15300 4300 8700
OPEX ($/kW per year) 100 500 150 530
Availability (%) 85% 98% 85% 98%
Capacity Factor (%) 30% 35% 35% 42%
LCOE ($/MWh) 210 670 210 470
First Commercial- Project Capacity (MW) 2 75 3 90
Scale Project
CAPEX ($/kW 2700 9100 3300 5600
OPEX ($/kW per year) 70 380 90 400
Availability (%) 95% 98% 92% 98%
Capacity Factor (%) 35% 40% 35% 40%
LCOE $/MWh) 120 470 130 2804.2 Market 149
4.2.5 Funding Support Schemes
4.2.5.1 History of EU funding programme support schemes
for ocean energy
In 2007 EU approved of the Strategic Energy Technology Plan (SET-Plan)
(Europeaan Commision 2015), with aims to develop technologies in areas in-
cluding renewable energy, energy conservation, low-energy buildings, fourth
generation nuclear reactor, coal pollution mitigation, and carbon capture and
sequestration (CCS).
In order to implement the research required for the SET-Plan, the
European Energy Research Alliance (EERA)4 was founded by more than 175
research centres and universities in the European Union (EU). The aim of
EERA is to expand and optimise EU energy research capabilities through the
sharing of world-class national facilities and the joint realisation of national
and European programmes, and builds on national research initiatives.
The following are the list of EU funded programs for ocean energy:
1. Within the EERA, a joint programme for investment in ocean energy
has been set up. NER 300 is an example of one of the EERA initiatives
(see NER 300 described below under push mechanisms). Three ocean
energy projects were awarded around e60 million in total under the first
round of the NER 300 programme, which will enable the demonstration
of arrays from 2016 (European Commision 2014).
2. The development of ocean energy has been highlighted in the recent
Commission Communication entitled “Action Plan for the Atlantic
Ocean area” (Atlantic Action Plan 2013, European Commision 2013)
which encouraged national and regional governments to consider how
they could use EU structural and investment funds as well as research
funds or European Investment Bank funding to support the development
of the sector.
3. Research Framework Programmes (FP4,5,6,7) and the Intelligent En-
ergy Europe Programme provided an amount of up to e90 million
for ocean energy development since the 1980s (European Commision
2014). (Ocean Energy Europe5 reports e124 m to ocean energy projects
between 2005 and 2014, almost e14 m per year).
4. Horizon 20206 , the EU’s research and innovation programme, will aim
to address important societal challenges including clean energy and
4
https://www.eera-set.eu/
5
http://www.oceanenergy-europe.eu/en/14-policy-issues
6
https://ec.europa.eu/programmes/horizon2020/150 Ocean Energy – Wave and Tide
marine research. As such, it is a powerful tool that can drive the ocean
energy sector towards industrialisation, creating new jobs and economic
growth. Between 2014–15, H2020 programme has funding over EUR 60
million (Magagna, Monfardini et al. 2016) of R&D projects in wave and
tidal energy. e30 M7 in demonstration funding was awarded (LCE3 and
12). For 2016–17, total of e22.6 M will be awarded for ocean energy
specific calls, 9.8% of LCE budget. A further e35 M was allocated to
Blue Growth and Co-Funded calls, which include ocean energy.
5. Other funding instruments available in Europe are InnovFin8 (a series
of integrated and complementary financing tools and advisory services
offered by the European Investment Bank Group together with the
European Commission) and the European Regional Development Fund
(ERDF)9 . These funding mechanisms are supporting the deployment
of demonstration projects. Collaboration initiatives at regional level are
catalysing the formation of marine energy clusters to consolidate the
European supply chain.
There are two types of support type mechanisms.
1. Push: = grants and equity
2. Pull: = tariff and other revenue mechanisms
4.2.5.2 Pull support schemes – Feed-in Tariff
Market pull mechanisms for wave and tidal sectors include financial supports
mechanisms such as feed-in tariff and renewable obligations.
Feed-in tariffs (FIT) are the most common support mechanism, and are
also currently the most popular and sought after mechanism by investors.
A feed-in tariff (FIT, FiT, standard offer contract, advanced renewable
tariff, or renewable energy payments) is a policy mechanism designed to ac-
celerate investment in renewable energy technologies (CfD described below
separately). It achieves this by offering long-term contracts to renewable en-
ergy producers, typically based on the cost of generation of each technology.
Ocean energy technologies such as wave and tidal power are offered a higher
FIT price, reflecting costs that are higher at the moment. Table 4.3 presents a
range of market pull mechanisms.
7
http://maritimebrokerageevent2015.eu/media/sites/11/dlm_uploads/2015/11/Ocean-
Energy-presentation.pdf
8
http://www.eib.org/products/blending/innovfin/
9
http://ec.europa.eu/regional_policy/en/funding/erdf/4.2 Market 151
Table 4.3 European Market support ‘pull’ mechanisms. Information adapted from JRC
Ocean Energy Status Report 2016 Edition (Magagna, Monfardini et al. 2016)
Country Tariff Support Scheme
Denmark Maximum tariff of 0.08 EUR/kWh for all renewables including ocean
energy
France Feed-in Tariff for renewable electricity. Currently 15 cEUR/kWh for
ocean energy.
Germany Feed-in Tariff for ocean energy between EUR 0.035 and 0.125
depending on installed capacity
Ireland Market support tariff for ocean energy set at e260/MWh and strictly
limited to 30 MW
Italy For projects until 5 MW 0.3 EUR/kWh
For projects >5 MW 0.194 EUR/kWh
Netherland The SDE+ (feed-in premium) supports ocean energy with a base support
of 0.15 EUR/kWh minus the average market price of electricity in the
Netherlands (support is given for a 15 year period). Total budget for
SDE+ capped (EUR 8 billion in 2016)
UK Renewable Obligation (RO) Scheme. Renewable Obligation Certificates
(ROCs) price set to 44.33 GBP in 2015/16. Replaced by a Contract for
Difference (CfD) scheme in 2017. Wave and tidal energy technologies
will be allowed to bid for CfDs, however they are currently expected to
compete with other technologies (e.g. Offshore Wind) to access CfD.
In addition, feed-in tariffs may include “tariff degression”, a mechanism
whereby the price (or tariff) ratchets down over time. This is done in order
to encourage technological cost reductions. The goal of feed-in tariffs is
to offer cost-based compensation to renewable energy producers, providing
price certainty and long-term contracts that help finance renewable energy
investments.
The disadvantage of Feed-in tariff support schemes is that they are only
beneficial in stimulating investment when the technologies are near commer-
cial (at TRL910 ). They have benefited the tidal developments to some extent,
but have not provided a benefit to wave energy prototypes. The advertised
tariffs for wave energy could be viewed as purely theoretical, as the funds
allocated have never been drawn-down. Moreover, many studies for wave
energy financial viability have stated that current tariff support offered by
most countries are inadequate, and need to be at least over e0.30c/kWh, to be
financially viable (Dalton, Alcorn et al. 2012, Teillant, Costello et al. 2012).
10
Technology Readiness Level: www.westwave.ie/wp-content/uploads/downloads/2012/10/
Wave-Power-Systems-Technology-Readiness-Definition-ESBIoe-WAV-12-091-Rev2.pdf152 Ocean Energy – Wave and Tide
Ireland, in 2016, completed a second review of the marine energy sector,
called “Our Ocean Wealth task force report” (Development Task Force 2015).
The report recommended the introduction of an market support scheme,
funded from the public service obligation levy, equivalent to e260/MWh and
strictly limited to 30 MW for ocean (wave and tidal). This will be allocated
by public competition and focused on pre-commercial trials and experiments.
A subsequent review will determine the most appropriate form and level of
support for projects beyond 30 MW.
Portugal had perhaps the most developed tariff scheme (Figure 4.8),
which incorporates the tariff degression method (this scheme has now
lapsed). The tariff scheme supported prototype deployments under 4 MW
at e0.26/kWh (Brito Melo 2010). Five pre-commercial projects were to be
supported of 20 MW each, with FIT of e0.22/kWh. FIT rates for com-
mercial projects would then drop to a range from e0.16/kWh for under
100 MW farms, e0.11/kWh for 100–250 MW and e0.075/kWh for farms
over 250 MW.
The UK had the Renewable Obligation, active until the end of 2017, man-
dating electricity suppliers to deliver a certain proportion of their electricity
from renewable sources, evidenced each year through the submission of the
appropriate amount of Renewable Obligations Certificates (ROCs). ROCs are
distributed to each renewable energy generator for each MWh of electricity
sold. This effectively establishes a market for ROCs that is separate to the
market for electricity. The price of a ROC in 2008 was approximately £0.047
(Scottish Government 2008). From April 2009, two ROCs was issued for each
Figure 4.8 The proposed range of FIT offered in Portugal for the various stages of R&D and
capacity deployed. (Brito Melo 2010).4.2 Market 153
MWh of wave generated electricity in England and Wales (equating to a value
currently of £0.09/kWh), that is supplementary to the price received for the
electricity). In Scotland five ROCs was allocated for each MWh of wave and
tidal generated electricity (equating to £0.225/kWh based on current prices),
also in addition to the electricity market price.
Post 2017 projects rely on Contract for Difference (CfD) for support in
the UK market (Department of Energy and Climate Change 2014). CfD offers
a fixed price above the market price for electricity, guaranteed for a period of
time. Changing from the ROCs systems to the CfD is a major change for the
UK renewable electricity sector. UK Government states that CfD will give
Wave and Tidal much benefits and greater certainty11 . It is argued that CfD
will lead to lower finance costs, which will reduce the overall project costs.
A potential wave or tidal development would need to bid into the new system
and need win a successful bid to get access to the long term contracts. Once
this is secured, CfD offers more revenue certainty, relative to the previous
ROC regime. Wave and tidal developers will have access to a general pot of
£260m which includes other renewable sectors such as advanced conversion,
anaerobic digestion, dedicated biomass with CHP, geothermal. This does
mean that wave and tidal will be competing with these other technologies
to secure funding in a mechanism where the support will go to the cheapest
technology. The highest strike price for both wave and tidal with be of 305
£/MWh, this is the Initial administrative (maximum) strike prices (£/MWh in
2012 prices). This change may have an initial settling period, where investors
will be uncertain of the new market.
4.2.5.3 Push support scheme
Technology push support mechanisms for wave and tidal include public
grants and private equity. Table 4.4 presents push mechanisms implemented
by four EU member states to favour the development of ocean energy
(Magagna, Monfardini et al. 2016). Push mechanisms tend to provide upfront
capital for the deployment of pilot projects.
Examples include e26 million in Ireland to more than about e285 million
in the United Kingdom.
The largest push support fund to come from the EU is called NER 30012 .
It is composed of European Commission, European Investment Bank
11
https://www.gov.uk/government/publications/contracts-for-difference/contract-for-
difference
12
http://www.ner300.com/154 Ocean Energy – Wave and Tide
Table 4.4 Summary of Push schemes for wave and tidal energy. Information from JRC report
(Magagna, Monfardini et al. 2016)
Country Fund Total Million
France Two projects e103
Ireland SEAI Prototype Development Fund, e4
Ocean Energy Development Budget e26
Portugal Fundo de Apoio à Inovação (FAI) e76
UK Marine Energy Array Demonstrator (MEAD), £20
Energy Technologies Institute (ETI), £32
Scotland Renewable Energy Investment Fund (REIF) Scotland, £103
Marine Renewables Commercialisation Fund (MRCF) £18
Saltire Prize, Scotland, £10
Wave Energy Scotland funding, £14.3
and Member States. The NER 300 is a common pot of e300 M EU ETS
allowances set aside for supporting 8 CCS and 34 renewable energy projects.
The allowances will be sold on the carbon market and the money raised
could be as much as e4.5B if each allowance is sold for e15. Up to 50%
of “relevant costs” are funded under the scheme. Each member state will al-
located at least one and a maximum of three projects13 . The maximum return
would be achieved by securing funding for the three largest demonstration
projects that are in the public interest. The remaining costs will need to be
co-funded by Member State governments and/or the private sector. A total of
three ocean energy projects will be funded including wave, tidal and ocean
thermal. Wave energy devices of up to 5 MW nominal power are eligible to
apply14 .
NER 40015 will supersede NER 300. Called ETS Innovation Fund, and
proposes e2.1 bn EUR awarded for the period 2021–2030 (with some amount
possibly made available before 2021). NER 400 will fund 38 innovative
renewable energy and one CCS project and will additionally include measures
to decarbonise industrial production.
Figure 4.9 provides a visual summary of market push and pull
mechanisms for ocean energy, based on developers stage of technol-
ogy or commercial development stage (Magagna, Monfardini et al. 2016,
Vantoch-Wood 2016).
13
http://ec.europa.eu/clima/funding/ner300/docs/faq_en.pdf
14
http://ec.europa.eu/clima/funding/ner300/00031/index_en.htm
15
http://ner400.com/4.3 Sector Industry Structure and Lifecycle 155
Figure 4.9 Summary of market push and pull mechanisms for ocean energy in the EU based
on Carbon Trust deployment scenarios. Image taken form JRC report and Vantoch-Woods
(Magagna, Monfardini et al. 2016, Vantoch-Wood 2016).
The OES Annual report (OES 2016) presents an excellent summary,
country by country of:
• National strategy
• Market Incentives
• Financing
4.3 Sector Industry Structure and Lifecycle
4.3.1 Wave and Tidal Sectors – Present and Future Centres
of Developer Activity
ReNews (ReNews 2014) in 2014 compiled an exhaustive list of stake-
holder companies in the Wave and Tidal sectors, viewable in the following
reference link: http://renews.biz/wp-content/assets/WTP-Research-Review-
Winter-2014.pdf156 Ocean Energy – Wave and Tide
Figure 4.10 Number of Ocean energy companies defined by technology including on-
shore wind. Figure provided by Exceedence Ireland16 (1=tide, 2=wave, 3=offshore wind,
combination 1,2 = tide and wave).
JRC Ocean report (Magagna, Monfardini et al. 2016) contains a non-
exhaustive list of companies currently active in the field of ocean energy,
ranging from technology developers to component suppliers. The majority of
technology developers are based in countries with significant ocean energy
resources, many intermediate components suppliers are based across the EU
(Germany, Sweden, Finland, Italy, Austria).
Figure 4.10 presents an analysis of the spread of sectors for the global
wave and tidal industry, conducted by Exceedence16 . The figures shows that
service providers are by far the largest category, followed by supply chain.
As anticipated, the majority are focused on onshore and offshore wind. These
service providers are mostly based in the UK currently (Figure 4.11). It is
anticipated that there will be transferable skills and business prospects.
The majority of wave and tidal developer companies are based in the
UK and USA, Figure 4.12, with very sizeable annual turnover in USA as
presented in Figure 4.13.
A visual representation of the European spread of wave and tidal industry
is presented in Figure 4.14, created by SETIS13 , Eurostat for JRC. The map
concurs with Exceedence findings, namely that the UK contains the most of
the wave and tidal companies in Europe. The image also concurs that that
16
www.exceedence.com4.3 Sector Industry Structure and Lifecycle 157
Figure 4.11 Number of companies in sample countries defined by stakeholder type. Figure
provided by Exceedence Ireland11 .
Figure 4.12 Number of wave and tidal developer companies in sample countries. Figure
provided by Exceedence Ireland11 .
wave and tidal developers only comprise a small proportion of the overall
stakeholder industry representation.
An important recent milestone has been a number of large engineering
firms taking controlling stakes in device development companies, primarily
in tidal technology companies, indicating that the tidal industry is closer to
maturity than wave (Alcorn, Dalton et al. 2014). Companies include Siemens,158 Ocean Energy – Wave and Tide
Figure 4.13 Total Annual turnover of all companies in Wave and Tidal in sample countries.
Figure provided by Exceedence Ireland11 .
DCNS, Andriz Hydro, Alstom and others. In the last 7 years up to 2014, total
private sector investment has been over e600 m in the last 7 years in Europe
(EU-OEA 2013).
4.3.2 Supply Chain
Current market conditions and technology status of ocean energy converters
have affected the consolidation of the supply and value chain of the sector
(Magagna, Monfardini et al. 2016).
Supply chain consolidation is project-driven for technologies that are
commercially viable. As witnessed in the wind energy sector, a strong project
pipeline ensures that there is sufficient demand for Original Equipment Man-
ufacturers (OEMs), and as a result guarantees demand for the manufacturing
of components and subcomponents and for the supply of raw materials. On
the other hand, for technologies that are not yet market-ready, such as ocean
energy technology, the consolidation of the supply chain is dependent on the
ability of reliability of the technology and its progress to higher TRL. Un-
certainties in the project-pipeline are amplified throughout the supply chain,
with potentially serious implications for the providers of components and raw
materials. This can result in both price variation of good and materials, and
in limited supply of products.4.3 Sector Industry Structure and Lifecycle 159
Figure 4.14 Ocean Energy patenting companies in the EU in 2008–2013 Companies identi-
fied as wave and tidal energy developers are represented in blue, supply chain and components
manufacturers are classified as suppliers and represented in red. Image from SETIC JRC.17
One of the critical issues for the ocean energy sector over the past few
years has been the lack of engagement of OEMs. Currently, however, as the
separation between tidal and wave energy is more marked, it can be seen that,
OEMs are either acquiring or investing tidal energy developers with DCNS,
Andritz Hydro-Hammerfest, Lock-heed Martin, General Electric all making
investments despite the exit of Siemens from the sector. For wave energy,
however, since 2012 an exodus of OEMs has been witnessed.
17
https://setis.ec.europa.eu/sites/default/files/report_graphs/patenting_companiese_eu_0.png160 Ocean Energy – Wave and Tide
The necessity of reducing the cost of ocean energy technology, also
through economy of scales, implies that the presence of OEMs with ac-
cess to large manufacturing facilities could be seen as an indicator of the
consolidation of the supply chain.
The Exceedence11 company compiled a list of main supply chain compa-
nies supporting Wave and Tidal, categorised by marine basin, and is presented
in Table 4.5.
Table 4.5 Table of major supply chain companies in the Wave and Tidal industry, spanning
all the stakeholder categories categorised by marine basin (compiled by Exceedence)11
Wave
Atlantic
PTO & Electrical & Marine Hydraulic
Generator Automation Bearings Operations Components Coating Diagnostic
Bosch ABB Hutchinsons Mallaig Mallaig Hempel BAE
Rexroth Marine Marine Systems
Siemens KTR Schaeffler Fugro Hunger Protective & Brüel &
Couplings Seascore Hydraulics Marine Kjær Vibro
Coatings GmbH
Winco/ Bailey SKF SeaRoc Hydac Akzo SKF
Dayton Nobel
Coatings
Alstom/TGL Eaton Bailey aquamarine Bailey ICI paints James
power Fisher
Marine
Services
Andritz SKF NSK James Seaproof Jotun
Hydro/ Fisher Solutions
Hammerfest Marine
Services
Baltic
PTO & Electrical & Bearings Marine Hydraulic Coating Diagnostic
generator automation O&M components
Bosch ABB Schaeffler A2SEA Hunger Hempel Voith
Rexroth A/S Hydraulics
SKF Eaton SKF EDF Andritz Protective & SKF
Hydro/ Marine
Hammerfest Coatings
Siemens Metso NSK DNV GL Hydac Sherwin- Brüel &
Williams Kjær Vibro
GmbH
The Switch KTR NKE Parker ICI paints
Couplings
Schottel VEO Wolfgang BASF
Preinfalk Coating
AG4.3 Sector Industry Structure and Lifecycle 161
Wave
Mediterranean
PTO & Electrical & Bearings Marine Hydraulic Coating Diagnostic
Generator Automation Operations Components
Siemens ABB Hutchinsons Oceantec D&D Protective & Metrohm
Ricambi Marine
Coatings
Bosch Eaton SKF Robert Hydac Akzo SKF
Rexroth Bird Nobel
Coatings
Alstom/TGL SKF NSK Parker Hempel
SKF Emerson NKE Jotun
Industrial
Automation
Leroy-Somer Bosch
Rexroth
Caribbean
PTO & Electrical & Marine Hydraulic
Generator Automation Bearings Operations components Coating Diagnostic
Northern Bailey Waukesha Hydac Protective & C&C
Lights Bearings Marine Technolo-
Coatings gies
Winco Eaton SKF Parker Hempel SKF
SKF ABB Hutchinsons Prince Akzo Hoffer
Nobel Flow
Coatings Controls
Inc.
Marathon SKF NSK Bailey Jotun
generators
Bosch General Bailey
Rexroth Electrics
4.3.3 Lifecycle Stage
Figure 4.15 presents the life cycles stages for ocean renewables (Ecorys
2013). It will be noted that the stages are similar to those of offshore wind.
Table 4.6 presents the Life Cycle Stages for Wave and Tidal technology
types.
It can be seen that the tidal industry has two technology types in the
Growth phase.
The Wave energy industry has no technology types in the growth phase,
all still in the embryonic phase. In addition to this negative picture, is the
recent news of four companies liquidating, each company a flagship repre-
sentative of a wave energy technology type of subsector. Oscillating water162 Ocean Energy – Wave and Tide
Figure 4.15 Life Cycle stages for Ocean energy. Image taken for Ecorys report (Ecorys
2013).
Table 4.6 Life cycle stages for Wave and Tidal industry, subdivided in technology types
Sector Sub Sector Life Cycle Stage
Tidal Fixed 3 blades Growth Stage: multiple companies at array testing
Energy
Fixed open Growth Stage: Open Hydro at array testing phase
centre
Floating Tidal Embryonic Stage; At prototype development phase
Wave OWC Embryonic Stage; At prototype development phase
Energy Ocean Energy Buoy and GRS at prototype testing in
Hawaii
Over Topping Embryonic Stage; At prototype development phase:
WaveDragon in Wales and Fred Olsen Bolt
Small scale Embryonic Stage; At prototype development phase:
devices kW Albatern and Seabased
Point Absorber Liquidated: WaveBob
Carnegie Australia, OPT USA, SeaTricity UK
Multiple point Liquidated: Wavestar
absorber
Attenuator Liquidated: Pelamis
Hinge Flap Liquidated: Aquamarine
Wave Roller: Embroyonic
columns and Overtopping are the only technologies types remaining, thus
indirectly demonstrating technology convergent through attrition.
See Section 4.5 ‘Innovation’ for more details on wave and tidal companies
and their lifecycle stage.
4.4 Working Environment
4.4.1 Job Creation and GVA
The European Commission 2012 report on Blue Economy (European Com-
mision 2012) stated that the EU’s blue economy represents 5.4 million jobs4.4 Working Environment 163
and a gross added value of just under e500 billion per year. In all, 75% of
Europe’s external trade and 37% of trade within the EU is seaborne. Much of
this activity is concentrated around Europe’s coasts, but not all. Some land-
locked countries host very successful manufacturers of marine equipment.
Figure 4.16 shows that Ocean Energy comprises a small proportion of
the Blue growth Jobs and GVA total percentages (European Commision
2012). However, Ocean energy is well positioned to contribute to regional
development in Europe, especially in remote and coastal areas. Parallels can
be drawn with the growth of the wind industry.
Based on the projections for installed capacity for ocean energy, the
following reports quote a wide range of job creation potential for ocean
energy and summarised in Figure 4.17:
• Ecorys (2010) (Ecorys 2013) In 2010 about 1000 people were esti-
mated to be employed in the ocean renewable energy sector and about
Figure 4.16 Job employment and GVA for Blue Growth, including ocean energy wave and
tidal. Image taken form European Commission Blue Growth Opportunities COM(2012) 494
final (European Commision 2012).164 Ocean Energy – Wave and Tide
Figure 4.17 Job projection numbers for ocean energy – visual summary of data from reports.
e250 million of GVA was created in the EU. The great majority was
depending on the developments in the Atlantic Arc.
• EU-OES (2010): by 2020 the ocean energy sector will generate over
26,000 direct and 13,000 indirect jobs, for a total of close to 40,000
(EU-OEA 2010). By 2050 these numbers would increase to 314,213,
157,107 and 471,320 respectively. The EU-OEA report further states
that if 3,6 GW was installed in Europe by 2020 it would result in
an investment of around e8,544 M, generating 40 thousand jobs. By
2050, achieving 188 GW could lead to an investment of e451B and the
creation of around 471 thousand jobs.
• European Commission (2014) (European Commision 2014) indicates
that indicative job estimates from the impact assessment show that
10,500–26,500 permanent jobs and up to 14,000 temporary jobs could
be created by 2035. Other, more optimistic sources estimate 20,000
jobs by 2035 in UK alone (RenewableUK 2013) and 18,000 in France
by 202018 . A substantial proportion of these employment opportunities
will arise in the Atlantic coastal areas, which currently suffer from high
unemployment.
• By 2050, the OES (OES 2016) has updated its international vision for
ocean energy stating that by 2050 ocean energy has the potential to have
deployed over 300 GW economic growth and job creation, estimated by
the OES in 680,000 direct jobs.
18
French Senate (2012), Report on Maritime Affairs at: http://www.senat.fr/rap/r11-674/r11-
6741.pdf4.4 Working Environment 165
• Other job predictions:
• UK based (RenewableUK 2011, Energy and Climate Change
Committee of the House of Commons 2012): 70 GW creating
68,000 jobs
• US Based (Ocean Renewable Energy Coalition (OREC) 2011):
15 GW creating 36,000 jobs
4.4.1.1 Jobs/MW for wave and tidal in comparison to wind
Dalton et al. published a detailed paper analysing the metric of Job/MW
relating to wind, wave and tide (Dalton and Lewis 2011). The paper stated
that the onshore wind industry in Europe reported a total of 13 jobs/MW
(direct jobs) were created on average for wind capacity installed in one year
only (2007 in the study), or 1.9 jobs/MW (direct jobs) if using cumulative
MW was used in the estimation. Installation job rates for many renewable
energy technologies can be as labour intensive as fabrication. The European
Photovoltaic Industry Association (EPIA) (EPIA 2004) states that more jobs
could be created in the installation and servicing of PV systems than in their
manufacture (30 jobs/MW). However, this figure contrasts dramatically to the
wind energy installation job/MW figure quoted by the EWEA; 9 jobs/MW
in their 2004 report (EWEA 2004), and 1.2 jobs/MW in their 2008 report
(EWEA, Blanco et al. 2008) (perhaps because they used cumulative MW in
estimations).
Wave and tidal studies on jobs/MW are very few as there is no real data
to model.
Batten et al., (Batten and Bahaj 2006) in 2006 produced a compre-
hensive prediction of job creation for wave and tidal, based on each
stage of the development of an ocean energy project, as well as di-
rect and indirect jobs (Figure 4.18). This data was used in the report
European Ocean Energy Association 2010 report, “Waves of Opportunity”
(European Ocean Energy Association 2010). The analysis predicts the
job/MW rate for both wave and tidal, direct and indirect, to be very similar,
with wave having on average 1 job/MW more than tidal for each category.
The greatest job intensities in device construction supply and foundation
constructing (4-5jobs/MW for wave, 3jobs/Mw for tidal), followed by in-
stallation 1 job/MW. Batten’s report predicts that by 2015, 19 direct and
indirect jobs/MW at the start, falling to 7 jobs/MW by 2020. Direct jobs in
device and foundation supply are quoted at around 10 jobs/MW falling to
3.5 jobs/MW.166 Ocean Energy – Wave and Tide
Figure 4.18 Job creation per MW of Ocean Energy. Image taken from SETIS Ocean Energy
Association 2010 (European Ocean Energy Association 2010).
Further reports predicting jobs/MW figures for 2050 based on at least
10,000+MW installed are:
• Ireland (SEAI 2012): 2.4 Jobs/MW (based on 70,000 jobs created
installing 29 GW)
• UK (RenewableUK 2011, Energy and Climate Change Committee of
the House of Commons 2012): 1.08 Jobs/MW (based on 68,000 jobs
created installing 70 GW)
• USA (Ocean Renewable Energy Coalition (OREC) 2011): 2.4 Jobs/MW
(based on 15 GW installed and 36,000 jobs)
4.4.2 Skills Required, Workforce Mobility and Availability/
Competition for Skills
It is expected that workforce characteristics for ocean renewable energy will
be similar to offshore wind and other offshore activities (Ecorys 2013). Ocean
renewable energy requires a combination of skills from hydropower and
offshore skills also needed for offshore wind, but also offshore oil & gas.4.4 Working Environment 167
For different parts of the value chain, different skills are needed. Further-
more, as the sector is still under development, there are many research and
consulting skills required.
4.4.2.1 Population centres versus ocean energy ‘Hotspot’
centres
Ideally, power production is located as close as possible to population centres
to reduce energy loss via cable transmission. In the majority of northern
European cases, the premium ‘hotspot’ sites are in remote locations, far
from population centre. Analysis will be necessary to ascertain the economic
optimum location taking both these factors into account.
Table 4.7 presents general information on skilled labour trends in 4
maritime basins. The following observations can be observed that are of
relevance to wave and tidal development in the Atlantic and Baltic nations:
• Economies of Atlantic and Baltics nations are strong, with positive
political stability favouring investment in the high-risk areas of Ocean
Energy development.
Table 4.7 Population stats for 4 maritime basins, labour costs and migration trends
(information taken for Maribe WP4- Wave and Tide Context report)19
Atlantic Baltic Mediterranean Caribbean
Population Stats 311,871,390 145,911,069 482,217,455 344,520,725
Pop growth or 0.27 –0.05 0.81 1.03
decline [%]
Economic climate 1.68 1.96 0.18 2.29
(growing, static,
decline) (GDP) [%]
Political stability 0.78 0.94 –0.44 0.19
(stable, neutral,
unstable) [from
–2.8 to 1.5]
Skilled labour 33.8 33.1 23.3 21.3
(workforce with
tertiary
education) [%]
Skilled Migration low labour relatively low relatively high high labour
trends mobility labour mobility labour mobility mobility
Annual average 49,193 35,345 16,851 14,658
wage cost [$]
19
http://maribe.eu/blue-growth-deliverables/blue-growth-work-packages/168 Ocean Energy – Wave and Tide
• Third level skilled labour numbers are is high in Atlantic and Baltics
nations favouring R&D in the high tech areas required for development
of Ocean Energy.
• Negatives for the Atlantic and Baltics nations in developing ocean
energy sector:
• Labour mobility is low, posing a barrier to development of ocean
energy in remote locations. Labour might be filled by highly
mobile skilled workforce form Mediterranean and Caribbean.
• Wages are high, posing a financial barrier to device development.
Cheaper labour sourced from Mediterranean and Caribbean might
be the solution.
4.4.2.2 Construction and fabrication skilled workforce
Manufacturing of turbines and other parts of ocean energy spare parts is
mainly done by companies which have experience in related technologies.
These bigger companies can easier shift workforce from one sector to the
other. For example, Voith20 used its knowledge from automotive industry,
aerospace industry and apply it towards ocean renewable energy. Andritz21
used its experience and knowledge on hydropower plants and transfers this
towards the ocean tidal devices.
4.4.2.2.1 Shipyards
WEC devices will more than likely need to be built in shipyards (Previsic
2004), where existing maritime construction expertise and facilities exist.
So far, most of the WEC prototypes have been constructed in local ship-
yards e.g. OE buoy in Cork Dockyards22 , Wavebob in Harland and Wolf,
Belfast23 and the ‘Mighty Whale’ in the Ishikawajima Harima shipyards in
Japan24 . The steel sections and power conversion modules of Pelamis were
constructed in Scotland, but were assembled at the site of deployment: e.g.
Peniche shipyards in Portugal25 and Hunters Bay shipyards in San Francisco
(Previsic 2004). The last two decades have witnessed a major contraction in
20
http://voith.com/en/index.html
21
http://www.andritz.com/
22
http://www.irishexaminer.com/business/eco-energy-company-rides-on-a-wave-of-success
-80844.html
23
http://www.irishtimes.com/business/wave-generator-damaged-by-storm-1.1018087
24
http://www.nsf.gov/pubs/1998/int9815/ssr9809.doc
25
http://www.ain.pt/index.php/178703956051dad39d28963.pdf?mod=articles&action=dow
nloadDocument&article_id=++++++++++++++++++237&document_id=2564.4 Working Environment 169
Table 4.8 Shipyards for the four marine basins
Shipyards
Atlantic Baltic Mediterranean Caribbean
Harland & Wolff, Riga Shipyard, Hellenic Grand Bahama
Belfast, UK Riga, Latvia Shipyards, Shipyard, Bahamas
Piraeus, Greece
Luerssen-Werft, Western Gibdock, Ciramar Shipyards,
Bremen, Germany Shipyard, Gibraltar Dom.Rep.
Klaipėda,
Lithuania
Peniche PT, Peniche, Admiralty Tuzla Shipyard, CL Marine Limited
Portugal Shipyards, St. Istanbul, Turkey Caribbean
Petersburg, Dockyard,
Russia Trinidad & Tobago
Damen Shipyard, Meyer-Werft, Palumbo Cotecmar Shipyard,
Gorinchem, Turku, Finland Shipyard, Colombia
Netherlands Messina, Italy
Les Nefs Shipyard,
Nantes, France
Europe’s shipbuilding capacity (Stopford 1997). Consequently future large-
scale production of WEC devices in European shipyards may not be viable.
Even if the choice were available, overseas competing shipyards in Poland,
Korea and China, could feasibly outbid local contractors even factoring in
shipping costs, due to lower overseas wages and cost of materials (Salonen,
Gabrielsson et al. 2006).
Table 4.8 presents a list of shipyards, categorised into four marine basins,
that may potentially serve the wave and tidal industry in construction and
maintenance.
4.4.2.3 Installation and operations & maintenance (O&M) skilled
workforce
Installation and operations & maintenance (O&M) of the ocean energy de-
vices, cables and moorings also requires a skilled workforce and facilities.
Specialised tugs companies are required to toe the devices to site, experi-
enced underwater divers are required for deployment and maintenance of
WEC and moorings, and specialised cable laying services for the electricity
connector cable. A local skilled workforce may not available in the loca-
tion for construction and deployment, or may be in limited supply due to
competing technologies such as offshore wind. An example of this situation
was when Seagen’s tidal turbine was supposed to have been installed byYou can also read


