Massachusetts Clean Energy Industry Report
←
→
Page content transcription
If your browser does not render page correctly, please read the page content below
Massachusetts Clean Energy Industry Report
                                                  2          0          1          3

                  Prepared for the Massachusetts Clean Energy Center by BW Research Partnership

                  50 Mill Pond Drive, Wrentham, MA 02093 | T (617) 395-8898 | www.bwresearch.com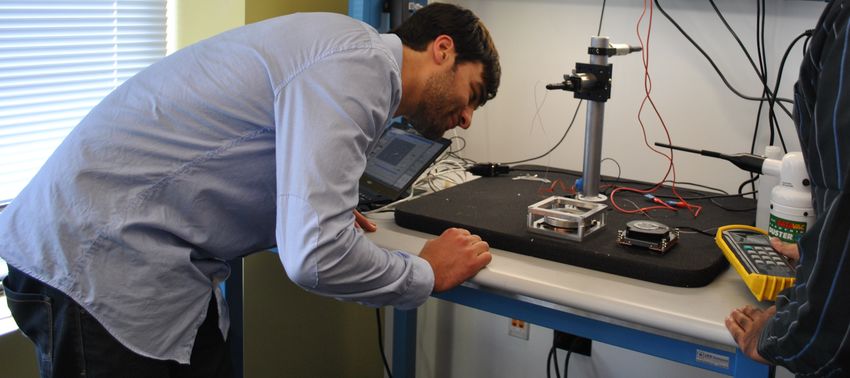
Table of Contents
         Letter from MassCEC CEO Alicia Barton                                                  ii

         Acknowledgments                                                                       iv

         Introduction                                                                           1

         Key Findings of the 2013
         Massachusetts Clean Energy Industry Study                                              2

         Industry Overview                                                                      7

                  The Clean Energy Sector Is a Large Component
                  of the Massachusetts Economy                                                  7

                  Clean Energy Employers in Massachusetts Continue to Grow Rapidly              8

                  Clean Energy Job Growth Has Been Fueled by Business Creation                  9

                  Clean Energy Workers Spend Most of
                  Their Time Supporting Clean Energy                                            9

                  Clean Energy Is Responsible for a Significant
                  Share of Respondent Company Revenue                                          10

                  Small Businesses Continue to Play a Key Role
                  in the Clean Energy Sector                                                   10

                  Clean Energy Firms Are Growing in All Regions of Massachusetts               10

                  Clean Energy Crosses Many Traditional Industry Lines                         11

                  All Technology Areas Are Growing                                             12

                  Solar Energy Is a Bright Spot in the Massachusetts Renewable Energy Sector   14

         Business Climate Findings                                                             15

         Clean Energy Capital Snapshot                                                         21

         Detailed Workforce Findings                                                           27

         Conclusions                                                                           32

         Appendix A: Research Methodology                                                      34

         Appendix B: Capital Trends Data                                                       36

2013 Massachusetts Clean Energy Industry Report                                                      i
Letter from MassCEC CEO Alicia Barton

     I
         am pleased to report that, for the third straight   Energy Center (MassCEC) five years ago on Au-
         year, the Massachusetts clean energy economy        gust 13, 2008.
         is growing. The 2013 Massachusetts Clean
     Energy Industry Report shows clean energy jobs          At MassCEC, we are dedicated to growing the
     grew by 11.8% from 2012 to 2013, following              clean energy sector from the ground up. We
     11.2% growth the year before and 6.7% growth            do this by assisting early-stage companies with
     in 2011. In just the past two years, clean energy       funding for research and by targeting invest-
     sector jobs have grown by 24% overall. This suc-        ments at companies that aim to create jobs here
     cess in growing clean energy jobs is defying na-        in Massachusetts. We work with schools, non-
     tional and global economic trends and puts Mas-         profit groups and businesses to develop clean
     sachusetts squarely on the global map as a leading      energy job training programs and we fund in-
     clean energy economy.                                   ternships so the next generation of clean ener-
                                                             gy workers is prepared to step into the jobs of
     Established in 2011, our Massachusetts Clean            tomorrow. We offer rebates and incentives for
     Energy Industry Report seeks to gauge the size          renewable energy projects that help create the
     and growth of clean energy sector employment            markets for Massachusetts-made technologies.
     and businesses across Massachusetts. This year’s        And we are building the infrastructure to ensure
     report provides further evidence that this re-          Massachusetts’ clean energy leadership into the
     markable rate of growth hasn’t occurred by ac-          future.
     cident—it’s by design. The seeds were sown for
     sweeping clean energy economic development              As a result of these efforts, there are now 79,994
     policies when Governor Deval Patrick signed the         Massachusetts clean energy workers and 5,557
     Green Jobs Act creating the Massachusetts Clean         clean energy firms operating in Massachusetts.

ii
And employers are “bullish” about continued growth in       For the first time, this year’s report provides a detailed
the year to come.                                           report on the business climate for clean energy firms and
                                                            reports a high level of business confidence. The employ-
Stemming from Massachusetts’ unparalleled access to         ers surveyed provided detailed feedback that will help
financial and intellectual capital, some of the largest     Massachusetts policymakers continue to implement poli-
gains in employment came from early-stage clean en-         cies that are tailored to meet the needs of this rapidly
ergy innovation firms entering the market. Engineering      growing field.
and research jobs grew by 32.4%. Manufacturing and
assembly jobs rose again this year as well, by an impres-   The 2013 Massachusetts Clean Energy Industry Report is
sive 20.6%.                                                 clear evidence that Massachusetts’ nation-leading invest-
                                                            ments in clean energy are paying off. With its continued
And we’re seeing this growth across the state, with the     projected growth, the clean energy sector is poised to join
southeastern region rebounding from a period of decline     the Commonwealth’s other marquee industries including
from 2011 and 2012 to become the fastest-growing re-        life sciences, financial services and information technol-
gion of the Commonwealth in terms of clean energy           ogy in the years to come.
employment with a 14.3% increase from 2012 to 2013.
Small, independent contractors were a major driver of       It’s up to us to keep up the pace. Now is no time to let up.
growth in Central and Western Massachusetts.

The Massachusetts clean energy workforce is also ex-
pected to grow more diverse. Women now make up ap-
proximately 21% and racial or ethnic minorities make        Alicia Barton
up 14% of Massachusetts’ total clean energy workforce.      Chief Executive Officer

2013 Massachusetts Clean Energy Industry Report                                                                            iii
Acknowledgments
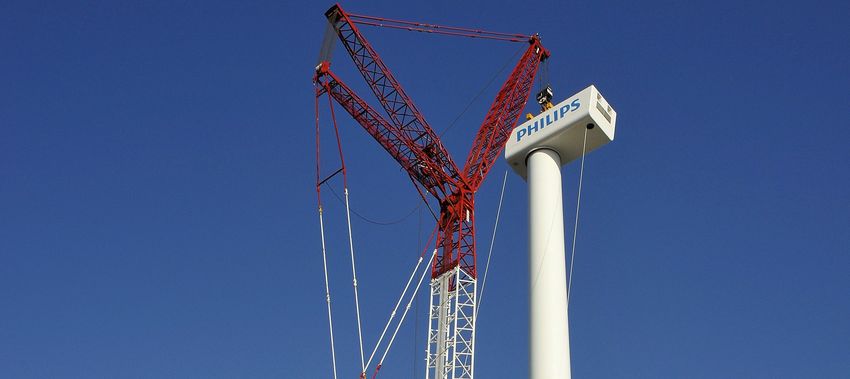
The 2013 Massachusetts Clean Energy Industry Photo Credits
Report is the result of an extensive research pro- Thanks are due to the following Massachusetts
cess that included a survey of more than 1,200 clean energy firms, who allowed us to feature
respondents. MassCEC would like to thank all their photos in the report: CoolChip Technolo-
of the respondents for engaging with us to gather gies, Conservation Services Group, and Phil-
this important data. Researchers could only gath- lips Lightolier. In addition, thanks to Stephanie
er these data because of each respondent’s willing- Stoops for her photography and collation of
ness to generously share their time and insights. these photographs.
The publication of this report would not have
been possible without the hard work and dedica-
tion of the following individuals:
BW Research Team
■■ Philip Jordan, BW Research
■■ Kevin Doyle, Green Economy
■■ Gordon Carr, GMC Strategies
■■ Jamie Barrah-Burtoft, BW Research
■■ Josh Williams, BW Research
■■ Ryan Young, BW Research
MassCEC Staff
■■ Martha Broad
■■ Sally Griffith
■■ Tamika Jacques
■■ Jeremy McDiarmid
■■ Arthur Natella
■■ Sasha Varasano
iv
Introduction

M
             assachusetts has a long history of tech-        able, and bridge the gap between basic energy
             nological innovation. Its world-class           research and developmental and industrial inno-
             universities, access to capital, deep           vation. At the same time, the Bay State has sig-
legal and financial services sectors and strong              nificantly increased its production of renewable
public policy commitments have kept it at the                energy, with an 85-fold increase in installed solar
forefront of the 21st Century economy. As much               capacity in just under seven years. Furthermore,
of the nation emerges from a deep economic re-               between 2007 and 2013, Massachusetts experi-
cession, Massachusetts has fared better, thanks to           enced a 157% growth in electric energy savings
its diverse mix of industries and its ability to em-         from energy efficiency measures.
brace change. No sector demonstrates the Com-
monwealth’s competitive advantages better than               With such a solid track record of performance on
its clean energy sector.                                     renewable energy and energy efficiency measures,
                                                             it is no surprise that the Massachusetts clean en-
Among recent recognition of its accomplish-                  ergy sector continues to grow. Since 2011, our
ments, the Commonwealth received a No. 1                     independent analysis of employer data has shown
ranking from the 2013 U.S. Clean Tech Leader-                that Massachusetts has a strong and growing
ship Index, in the Capital category, reflecting a            clean energy sector, with a diverse base of compa-
nation-leading level of private investment activ-            nies that conduct activities across the entire spec-
ity, as well as our abundance of human and intel-            trum of the value chain and clean energy tech-
lectual capital. Massachusetts-based companies               nologies. This is the third report released by the
have competed for and received 17%—or $90.5                  Massachusetts Clean Energy Center (MassCEC)
million—of the federal dollars awarded through               as part of its requirement to conduct an annual
the U.S. Department of Energy’s ARPA-E pro-                  accounting of the clean energy industry in Mas-
gram, which is devoted to advanced energy re-                sachusetts. As with any longitudinal research
search projects that are transformational, sustain-          study, each year presents new trends – and new

Introduction | 2013 Massachusetts Clean Energy Industry Report                                                      1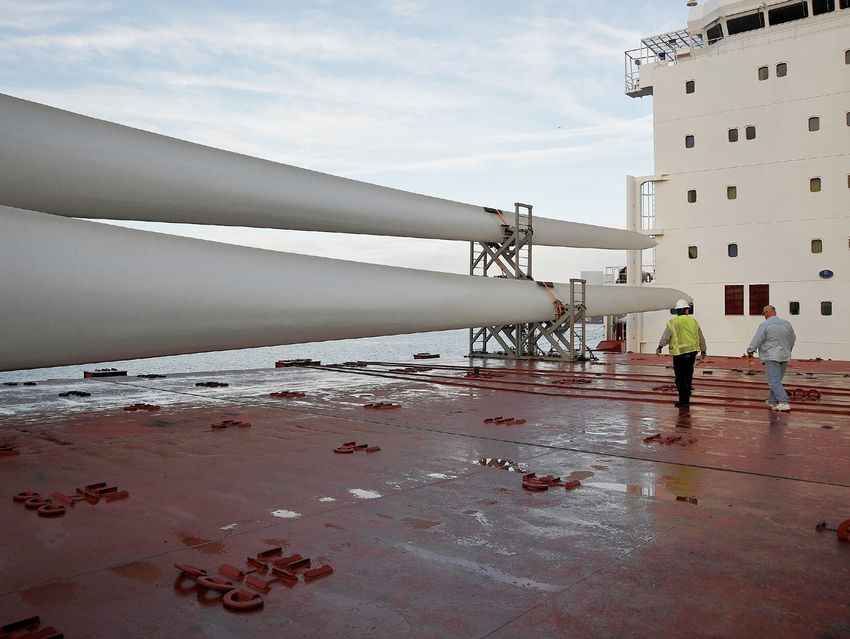
KEY FINDINGS OF THE 2013
    MA CLEAN ENERGY INDUSTRY REPORT
                                                                     energy sector crosses over so many different tra-
    ■■ 5,557 clean energy firms                                      ditional industries, and because most tradition-
                                                                     al labor market reports often do not count the
    ■■ 79,994 clean energy workers                                   small startup firms that do not have established
                                                                     payrolls. Examples of other sectors’ employ-
    ■■ 1.9% of total workers in the                                  ment include healthcare (including doctors’ of-
                                                                     fices, hospitals, ambulatory care, etc.) at 462,362
        Commonwealth
                                                                     workers,1 construction, at 169,198 workers,2 bi-

    ■■ 11.8% employment growth rate                                  opharma at 56,462 workers,3 information tech-
                                                                     nology at 151,025 workers,4 and financial and
        from 2012 to 2013                                            insurance services at 177,567 workers.5

                                                                     When the studies commenced in 2011, the Mas-
            questions to answer. In response to questions            sachusetts clean energy sector employed 64,310
            raised in previous years’ efforts, the 2013 study        clean energy workers across renewable energy,
            dramatically expands the scope of the research,          energy efficiency, alternative transportation, car-
            by adding employer feedback regarding the busi-          bon management and other related technologies.
            ness climate and detailed workforce needs of             The 2012 report found a quickly growing sector,
            Massachusetts clean energy companies, together           with employment growth of 11.2%, representing
            with a clean energy capital snapshot. This report        over 7,000 additional clean energy jobs. The in-
            includes a summary of these expanded findings.           formation collected this year continues to update
                                                                     and expand our knowledge of the Massachusetts
            Since 2011, three themes have emerged as the             clean energy sector, which now stands at just un-
            key to employers’ ability to meet customer de-           der 80,000 workers.
            mand and grow their businesses: 1) supportive
            public policies; 2) a well established culture of in-    As with the previous studies, this 2013 report is
            novation and entrepreneurship; and 3) an educa-          based on survey data gathered directly from clean
            tion system that helps produce a highly talented         energy employers in the Massachusetts. Unlike
            workforce. These assets, coupled with continued          other studies, this report does not rely solely on
            growth in demand for cleaner energy goods and            databases of known employers—those organiza-
            services, have led to an emerging sector that is on
            a path similar to the Commonwealth’s other mar-
            quee industries including life sciences, financial
            services and information technology.                     1   EMSI Class of Worker, 2013.2

                                                                     2   Id.
            Comparison to other sectors in Massachusetts             3   http://www.massbio.org/news/397-massachusetts_continues_to_
            helps frame the clean energy sector in terms of its          lead_biopharma_industry/news_detail

            size and scope. Direct comparisons are difficult         4   EMSI Class of Worker, 2013.2
            (and serve only as examples) because the clean           5   Id.

2                                                               Introduction | 2013 Massachusetts Clean Energy Industry Report
tions that are members of industry associations,                A further advantage of the comprehensive survey
have signed up for various clean energy incentives              method used in this report is a reduced reliance on
or programs or have been otherwise identified as                models to estimate employment. Most clean en-
conducting clean energy work. While known-                      ergy employment studies rely on assumptions and
employer lists are important, analyses based solely             economic models that estimate employment based
on such lists can undercount clean energy workers               on revenue. Studies have shown that economic
because they miss the large number of companies                 models and the assumptions they require at the
engaged in clean energy work that have not yet                  state and local level are low-cost fallback options
been identified as part of the sector.                          but are not as accurate as direct survey methods.7
                                                                Finally, the wide-ranging interviews conducted for
In addition to understanding the known em-                      this report allowed for in-depth employer infor-
ployers, a truly comprehensive accounting of the                mation to be captured from a broad cross-section
clean energy economy requires collecting infor-                 of stakeholders in the clean energy industry.
mation on the thousands of companies that are
conducting clean energy activities as part of their             As with previous years, surveys were administered
business, but are not identified in any database                online and by telephone to a list of known clean
of clean energy firms. At the end of 2012, there                energy employers, as well as to a representative,
were more than 5,000 plumbing, heating, venti-                  stratified, clustered sample8 of companies across
lation and air conditioning (HVAC), and electri-                the entire Commonwealth. This sample includes
cal contractor establishments in Massachusetts.6                the primary value-chain industries such as agricul-
Many of these have a clean energy aspect to their               ture, construction, manufacturing, wholesale trade
business, yet few appear in any known clean ener-               and research and development (R&D). While
gy database. Therefore, it is important to develop              some supportive industries, such as financial ser-
a methodology that can determine the number                     vices and law firms are included in the known list
of firms in industries like these that are active in            of employers, these firms are not targeted in the
clean energy and the number of their workers                    random sample outside of the known universe of
that support clean energy activities, particularly              clean energy activity. This same method of em-
in order to understand the distinct needs of these              ployer identification was used for the 2011 and
more traditional and often “population-serving”                 2012 report, allowing us to effectively and consis-
companies that manufacture, sell, install, and                  tently compare data across time and to expand the
maintain existing clean energy products for the                 baseline of data for future comparisons.
local market. Many other surveys simply cannot
devote adequate time and resources to make the
tens of thousands of inquiries necessary for such
rigorous data collection.
                                                                7   See generally, http://www.edrgroup.com/pdf/iowa-energy-econ-
                                                                    part1.pdf, at p. 8-9 (1995) and http://www.nrel.gov/analysis/
                                                                    jedi/limitations.html (2012)

                                                                8   See http://support.sas.com/rnd/app/da/new/801ce/stat/chap13/
6   Economic Modeling Specialists, Inc., Complete Data 2013.2       sect13.htm.

Introduction | 2013 Massachusetts Clean Energy Industry Report                                                                      3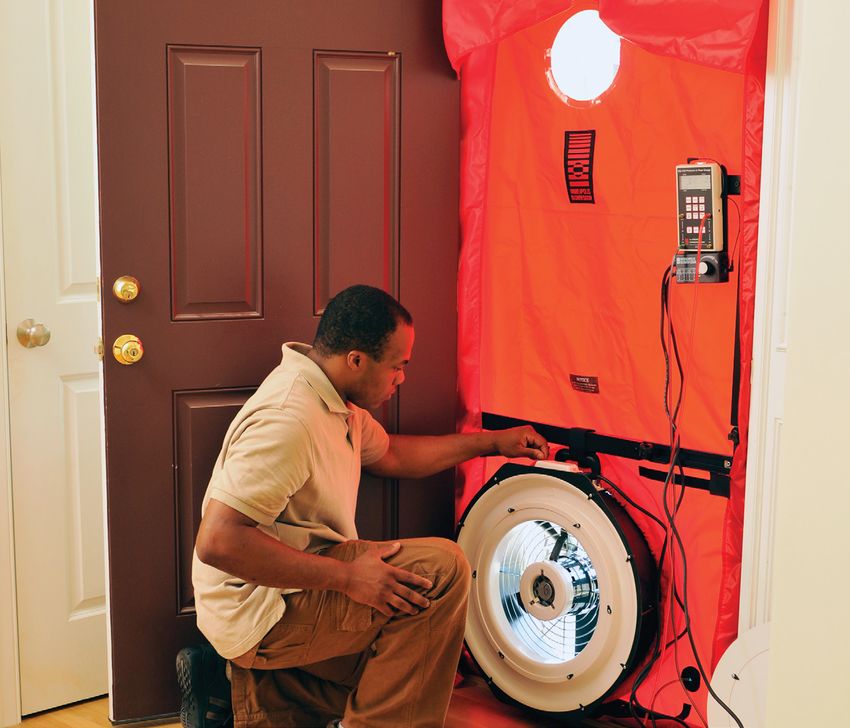
For the purpose of this report, a clean energy firm
             is defined as an employer engaged in whole or in part
             in providing goods and services related to renewable
             energy, energy efficiency, alternative transportation, and
             carbon management. Clean energy workers are defined
             as spending at least a portion of their time supporting the
             clean energy aspects of their businesses.

    The data presented in this report result from di-     sachusetts economy. The growth pattern, while
    rect feedback from over 1,200 Massachusetts em-       impressive in its own right, is even more mean-
    ployers. Over the past three years, the research      ingful because it is in a different form this year
    team attempted approximately 59,550 telephone         than in previous years. In 2012, the bulk of the
    calls and sent over 17,000 emails to employers.       employment growth was due to existing compa-
    The level of sampling has generated highly reli-      nies adding employees. This year, the overwhelm-
    able data, with a margin of error of approximate-     ing majority of growth came from new entrants to
    ly +/3.1% at a 95% confidence interval, which         the sector – both startups and existing firms that
    is considerably more reliable than the industry       have started conducting clean energy activities.
    standard for survey research.
                                                          The research also finds that the clean energy sector
    The large sample size ensures that the 2013 Mas-      is growing significantly faster than other sectors
    sachusetts Clean Energy Industry Report provides      of the Massachusetts economy. Since 2011, clean
    comprehensive and reliable data on the number         energy employment has grown by an astound-
    of clean energy firms and employees while vali-       ing 24.4%, more than eight times faster than the
    dating the findings from previous studies. It also    overall 3% growth rate9 among all industries in the
    allows for deeper segmentation and analysis of        Commonwealth over the same period. This rep-
    regions and employers by size, technology, and        resents over 15,000 jobs in two years. The 11.8%
    value-chain activity. This report finds that the      employment growth rate is slightly faster than the
    Massachusetts clean energy sector has expanded        2011-2012 growth rate of 11.2%, demonstrat-
    to 5,557 clean energy firms that employ 79,994        ing continued promise for the sector. At the same
    clean energy workers. The 79,994 clean energy         time, employers remain optimistic about the fu-
    workers in Massachusetts represent 1.9% of total
    employment in the Commonwealth, making the
    clean energy sector a key component of the Mas-
                                                          9   EMSI Complete Employment, 2013.2.

4                                                    Introduction | 2013 Massachusetts Clean Energy Industry Report
Traditional industries create significant entrepreneurial
activity, often in the form of small, independent contractors
in plumbing, electrical or HVAC—which this year was a
major driver of clean energy growth, especially in Central
and Western Massachusetts.
ture, anticipating another strong rate of 11.1% Traditional firms tend to be larger and more
growth over the coming 12 months. evenly spread throughout the Commonwealth.
They are more often engaged with energy effi-
There are some changes to the 2013 report, with ciency work, are older, and are responsible for a
additional information that enables further re- larger share of the clean energy workforce. Tra-
finement of the employment totals. For the first ditional firms are most typically service-related,
time this year, the study provides employment including HVAC, plumbing, electrical and other
totals by primary clean energy focus (e.g., renew- building contractors, and business service es-
able energy, energy efficiency, etc.) that does not tablishments such as finance and law firms (fin-
include overlap. There is also significant new data ished product manufacturers are an exception to
on employment for solar and wind technologies, the more typical service focus of this category).
as well as analysis of the representation of women While their growth rates are slower than inno-
and minorities in the clean energy workplace. vation firms, they are also less likely to experi-
ence precipitous employment declines. While
While the data in this report present an overview it is often overlooked, traditional industries do
of the Massachusetts clean energy sector, they create significant entrepreneurial activity, often
present a tale of two very different worlds. On the in the form of small, independent contractors in
one hand are the early-stage, innovation compa- plumbing, electrical or HVAC. This year, new
nies that are on the cutting edge of research and business activity in traditional fields was a major
development and focused heavily on deployment driver of clean energy growth, especially in Cen-
and global export markets. On the other are more tral and Western Massachusetts.
traditional, population-serving firms that manu-
facture, sell, install and maintain existing clean Innovation firms, on the other hand, tend to be
energy products. These two worlds operate very early-stage and smaller. They are predominantly
differently and have different drivers for growth. focused on renewable energy or energy storage
Introduction | 2013 Massachusetts Clean Energy Industry Report 5and often report being small consultancies, R&D environmentally-friendly place to live and work.
firms or advanced or prototype manufacturing Their preferences are strongly connected to at-
companies. These firms receive the bulk of the tracting and retaining talent and connecting to
investment capital and start-up attention and are global markets.
often closely linked to academic research centers.
Traditional firms are focused on containing costs
Different types of firms have quite different needs. and spurring consumer demand. Most frequent-
When interviewing employers for this study, in- ly, such firms report the cost of healthcare and
novation firms focused most heavily on higher- wages as obstacles to growth and seek tax relief
educated, high-wage employees. They seek access and affordable health insurance options from the
to capital, networking with suppliers, vendors, Commonwealth. Additionally, these firms’ for-
and customers, in addition to relationships with tunes are closely linked with local spending on
academic researchers. They have a strong interest clean energy goods and services, most typically
in maintaining Massachusetts’ quality of life and at the consumer level (unlike innovation firms
reputation as a good place to do business and as a which are more closely tied to global demand).
forward thinking location for clean energy goods Traditional firms most frequently cite increased
and services. Business costs rarely impact their consumer incentives, enhanced customer aware-
decision-making, though transportation is criti- ness, and consumer-access to capital for home
cal to them—specifically regarding public transit, and business energy improvements in addition to
traffic, and commuting patterns. their cost-containment requests.
Innovation firms would like to see Massachu- Because each of these two worlds has different
setts invest in education, transportation, health- drivers for growth, both types of firms should
care, and clean energy “statement” policies that be able to independently lead the charge into
highlight the Commonwealth’s standing as an the future.
6 Introduction | 2013 Massachusetts Clean Energy Industry ReportIndustry Overview
The Clean Energy Sector Is as those focused on law, finance, consulting, and
policy (note: these numbers are rounded to the
a Large Component of the nearest worker).
Massachusetts Economy
Massachusetts is already recognized as a leader in Clean energy firms are most likely to work with
the global clean energy economy, and its position energy efficiency or renewable energy goods and
is strengthening. The Commonwealth’s public services. Specifically, 3,002 firms and 46,613
investments in clean energy have solidified Mas- clean energy workers produce goods or services
sachusetts’ position as a clean tech hub, receiv- related to energy efficiency, while 2,312 firms
ing nation-leading rankings in energy efficiency and 30,537 clean energy workers work with re-
investments. Massachusetts boasts 5,557 clean newable energy.10
energy employers and 79,994 clean energy work-
ers, as of June 2013. For the first time this year, employers were asked
about their primary clean energy focus. These ini-
Clean energy workers make up 1.9% of all work- tial results indicate that, of the firms that conduct
ers in the Commonwealth and are found in near- energy efficiency and renewable energy activities,
ly all industries across the state. Of the 79,994 a greater percentage primarily conduct energy ef-
Massachusetts clean energy workers, 21,637 ficiency activities. It is estimated that there are
work in sales and distribution; 19,031 work pri- 1,801 primary renewable energy firms employ-
marily with installation and maintenance firms;
17,458 work for engineering and research firms;
13,458 work for manufacturers; and 8,409 work 10 Note that these figures include overlap because many of the firms
reported working with both renewable energy and energy efficiency
for other types of clean energy companies, such technologies. See Table 3 for the breakdown of clean energy firms
by technology without overlap.
Industry Overview | 2013 Massachusetts Clean Energy Industry Report 7Clean energy employers are bullish about future growth
again this year and expect to have 8,880 more clean energy
jobs over the coming 12 months.
ing 21,017 workers in Massachusetts, while there Clean Energy Employers
are 2,634 firms that are primary energy efficiency
firms, employing 46,947 workers.
in Massachusetts Continue
to Grow Rapidly
The Massachusetts clean energy sector has grown
at an impressive rate from June 2012 to June 2013,
Clean Energy Job Growth
adding nearly 8,500 new jobs at an 11.8% growth
100,000 11.1% rate. Since the MassCEC’s first study in 2011, Mas-
Growth sachusetts clean energy employers have added more
11.8%
Growth than 15,500 jobs, representing 24% growth. Despite
11.2%
Growth job growth of 1.6% for all Massachusetts jobs over
75,000 6.7%
Growth the period,11 about 25% of all clean energy compa-
nies grew, while only 15% cut their workforce. This
finding highlights clean energy as a bright spot in
50,000
jobs recovery in the Bay State, with the growth this
74
10
23
94
74
year fueled more by startups and new entrants to
,2
,3
,5
,9
,8
60
64
71
79
88
clean energy than hiring at existing firms.
25,000
The research also found that respondents are bullish
about future growth again this year. In most survey-
0
2010 2011 2012 2013 Projected based industry studies, employers tend to be overly
2014
sensitive to short-term trends. When the economy
or industry is doing well, they tend to over-report,
11 EMSI Complete Employment, 2013.2.
8 Industry Overview | 2013 Massachusetts Clean Energy Industry Report38.9%
45.6%
27% of employers report that they have current openings
that they expect to fill in the next three months.
while during times of downturn, they are overly Clean Energy Job Growth
pessimistic. Over the last three years, however,
employers that have participated in this study have
Has Been Fueled by
been quite accurate in their predictions.12 Business Creation
The 11.8% growth from 2012 is a combination
Overall, clean energy employers expect to have of new positions at existing clean energy firms,
8,880 more clean energy jobs over the coming repurposing of employees to support clean ener-
12 months, which would represent an 11.1% gy at existing firms, and especially, new business
growth rate in clean energy employment. Forty- creation. Annual hiring gains only account for
two percent of employers expect to have more about 15% of the new clean energy workers. Of
clean energy workers in the coming year, while these new workers, 83% were reported as having
only 3.2% expect fewer. In comparison, overall been hired to new positions, while 17% were in
Massachusetts employment is projected to grow existing positions to which clean energy respon-
by 1.7% over the coming 12 months.13 sibilities were added.
This is not just long-range planning. Twenty-
seven percent of employers report that they
have current openings that they expect to fill
Clean Energy Workers
in the next three months. The average firm Spend Most of Their Time
has two to three current openings. This finding Supporting Clean Energy
could represent thousands of new jobs filled over
the summer and fall of 2013 alone. While this study’s definition of a clean energy
worker is any worker that spends any portion
of his or her time supporting their firm’s clean
energy business, this year employers were also
12 In the 2012 Massachusetts Clean Energy Industry Report,
employers projected 12.4% growth in the upcoming year. asked to report the number of workers who
13 EMSI Complete Employment, 2013.2
spend at least 50% or 100% of their time do-
Industry Overview | 2013 Massachusetts Clean Energy Industry Report 9ing so. The research indicates that a majority Small Businesses Continue
meet these thresholds, with 87% reported to
spend at least 50% of their time supporting
to Play a Key Role in the
clean energy and 79% spending all of their Clean Energy Sector
time doing so. The majority of the Commonwealth’s clean en-
ergy employers are small, with 55% having five
or fewer permanent clean energy employees.
Clean Energy Is
Responsible for a Significant Company Size by Number
Share of Respondent of Employees 4.3% 3.0%
3.0%
Company Revenue ■ 5 or fewer 5.1%
Businesses report that their clean energy revenues ■ 6 to 10
continue to increase as a share of overall rev- ■ 11 to 24 13.2%
enue. Thirty-nine percent of surveyed firms re- ■ 25 to 49 55.2%
ported that 100% of their revenues are attributed ■ 50 to 99 16.1%
to clean energy goods and services, while 60% ■ 100 or more
receive at least half of their revenue from clean ■ Don’t know/no answer
energy work. This work is defined as producing
goods or services related to renewable energy, en-
ergy efficiency, carbon management or alterna- Clean Energy Firms Are
tive transportation.
Growing in All Regions
Percent of Revenue from Clean of Massachusetts
Energy Goods and Services
4.8% Clean energy employers operate in every county
in Massachusetts. The map below illustrates the
■ All of it clean energy employment concentrations of the
■ Half to most of it 24.1%
four regions in Massachusetts. Again this year,
38.8%
■ A quarter to the Northeast has the greatest concentration
almost half of it of workers, followed by the Southeast, Central
10.7%
■ Less than a quarter and West. All areas, however, show significant
■ Don’t know/no answer 21.5% employment, ranging from 11,116 clean ener-
gy workers in the West to 36,155 clean energy
workers in the Northeast.
10 Industry Overview | 2013 Massachusetts Clean Energy Industry ReportAll regions showed growth over the past 12 Clean Energy Crosses Many
months. The Southeast rebounded from its de-
cline in 2011-2012 to become the fastest grow-
Traditional Industry Lines
ing region from 2012-2013, with a 14.3% em- One key driver of the sector’s growth is its pen-
ployment growth rate. etration across traditional industry lines, illus-
trated by the ways that firms classified themselves
Clean Energy Workers by Region
in the survey. The clean energy sector is one that
NORTHEAST serves all others. With clear strength in the entire
36,155 value chain of activities, the sector can withstand
WESTERN
short-term fluctuations in various markets. This
11,116 15,518
means that Massachusetts is not reliant on one
CENTRAL
activity (such as manufacturing or finance). The
17,205 entire value chain of activities is well represented
SOUTHEAST
in Massachusetts, as illustrated by Table 1 below:
Table 1: Current Overall Clean Energy Employment14
Table 1: Current Overall Clean Energy Employment14
2013 Number 2013 Clean 2012 Number 2012 Clean
Firm's Primary
of Clean Energy Energy of Clean Energy Energy
Clean Energy Activity
Firms Employment Firms Employment
Total 5,577 79,994 4,995 71,523
Manufacturing and Assembly 564 13,458 489 11,162
Engineering and Research 1,018 17,458 889 13,182
Sales and Distribution 992 21,637 917 20,671
Installation and Maintenance 2,187 19,031 1,996 18,280
Other 816 8,409 705 8,229
14 Note that the total in each category is rounded to the nearest worker,
which explains the difference with the totals reported herein.
Industry Overview | 2013 Massachusetts Clean Energy Industry Report 11The clean energy economy in the Commonwealth is not
reliant on one single technology and is therefore better
able to weather short-term variations in the market.
While there are many firms engaged in more All Technology Areas
than one activity, installation and maintenance
continues to be the largest value chain activity
Are Growing
by number of firms. Sales and distribution firms Massachusetts firms reported working with
still employ the most clean energy workers, many different clean energy technologies, again
though installation and maintenance and man- demonstrating strength through diversity. The
ufacturing are gaining fast. Engineering and clean energy economy in the Commonwealth
R&D, long considered a strength of the Massa- is not reliant on one single technology and is
chusetts clean energy economy, is also growing therefore better able to weather short-term vari-
at an impressive rate. ations in the market. Survey participants were
first asked to list their employer’s major areas
of focus, such as renewable energy, energy ef-
Growth in Clean Energy
Employment by Activity ficiency, alternative transportation, etc. Because
researchers anticipated that many employers
Sales and 20,671 would be active in a number of areas, multiple
Distribution
21,637 4.7% responses were permitted.
Growth
Installation and 18,280
Maintenance
19,031 4.1% Renewable energy firms leveled off from their
Growth
rate of growth in 2012, but still added 800 jobs
13,182
Engineering over the past year. In contrast, energy efficiency
and Research
17,458 32.4%
Growth added more than 6,000 new jobs, with a 16%
11,162 growth rate over the past year.
Manufacturing
and Assembly
13,458 20.6%
Growth 2012
Other Activity 8,229
Firms were also categorized by their primary fo-
2013
(Finance, legal,
2.2% cus. Energy efficiency remains the largest catego-
policy and 8,409 Growth
other support) ry in this analysis.
0 5,000 10,000 15,000 20,000
12 Industry Overview | 2013 Massachusetts Clean Energy Industry ReportTable 2. Firms and Employment by Clean Energy Focus (With Overlap)
Clean Energy Focus 2013 Number of 2013 Clean Energy 2012-2013
(Overlap Included) Clean Energy Firms Employment Employment Growth
Total 5,577 79,994 11.8%
Renewable Energy 2,312 30,537 2.6%
Energy Efficiency 3,002 46,613 15.9%
Alternative Transportation 456 5,338 2.9%
Carbon Management 489 11,807 19.7%
Other 847 8,467 26.0%
Table 3. Firms and Employment Growth in Employment by
by Primary Clean Energy Focus Clean Energy Focus
Current 40,207
Primary Clean Current Energy
Number of Efficiency 15.9%
Energy Focus Clean Energy 46,613
Clean Energy Growth
(Without Overlap) Employment
Firms
29,777
Renewable
Total 5,577 79,994 Energy
30,537 2.6%
Growth
Renewable Energy 1,801 21,017 9,866
Carbon
Management
11,807 19.7%
Energy Efficiency 2,634 46,947 Growth
Alternative 5,189 2012
173 899 Alternative
Transportation Transportation 2.9%
5,338
Growth
2013
Carbon Management 303 2,480
6,719
Other
Other 666 8,651 26.0%
8,467 Growth
0 10,000 20,000 30,000 40,000 50,000
Industry Overview | 2013 Massachusetts Clean Energy Industry Report 13Solar Energy Is a Bright Renewable Energy Employees
by Technology
Spot in the Massachusetts
Renewable Energy Sector
For the first time as part of this study, employers
were asked to allocate their employees by specific
categories. The bulk of the renewable energy 59.7%
workers in Massachusetts support solar, wind,
and hydroelectric technologies, from research
and development through installation and main-
tenance. Nearly 60% support solar technologies,
while another 13% are engaged in hydroelectric ■ Solar: PV or photovoltaic, thermal
and 11% in wind power. or concentrated or CS 59.7%
■ Wind power 10.8%
In Massachusetts, this survey finding translates to ■ Fuel cell 1.0%
at least 8,400 workers that spend at least 50% of ■ Bioenergy 6.2%
their time supporting the solar portion of their ■ Hydropower or hydrokinetic:
business.15 river, wave, tidal 13.1%
■ Geothermal 2.4%
■ Hydrogen generation 0.3%
■ Thermal to energy conversion 1.8%
■ RE combined heat and power 3.1%
■ Other 1.6%
15 This figure was calculated using a subset of clean energy employers
that are engaged in solar activities. The calculation used solar-
specific employer data on the total number of workers spending
50% of their time supporting clean energy and the total number of
renewable energy employees predominantly working in solar.
14 Industry Overview | 2013 Massachusetts Clean Energy Industry ReportBusiness Climate Findings
The 2013 survey included in-depth questions Massachusetts as a place to do business due to
about respondent business operations and trends. its high quality of life, access to capital and tal-
The responding firms ranged from very large em- ent and favorable reputation as a clean energy
ployers with thousands of workers to very small, hotspot. Traditional firms, which tend to focus
with just a handful of employees. The respon- on business costs, still rank Massachusetts as a
dents’ companies span the entire industry, and good place to operate a clean energy business, de-
included manufacturers, consultancies, research spite the reported higher cost of doing business,
laboratories, trade contractors, and nonprofit or- because they have access to a population of con-
ganizations. sumers that is higher-income and more positive
about clean energy goods and services.
The number of responses varied by question de-
pending on the type of employer and the report- In terms of their needs and desires, innovation-
ed difficulties they faced. As a result, the sample focused firms seek improvements to transpor-
size for each question ranges from 93 to 376 re- tation, education, and healthcare, as well as
sponses. In addition, 26 executives participated facilitated networking and increased access to
in follow up interviews to explore the context be- capital (particularly venture capital and other
hind the survey results. private equity). Traditional firms, on the other
hand, seek cost-containment (particularly of
The questions about operating a clean energy healthcare costs), improved public transit, and
business in Massachusetts provide some interest- increased incentives and access to capital for
ing results and highlight the dichotomy between consumers.
innovation-focused firms and more traditional
companies. Generally speaking, the smaller, Specifically, employer responses yielded the fol-
early-stage, innovation companies welcome lowing findings:
Business Climate Findings | 2013 Massachusetts Clean Energy Industry Report 15Education and Environmental support, yet felt as though the general incentives
for starting a business were lacking. One good
Protection Rank Highly example of this is that numerous employers noted
Overall, the findings illustrate that the K-12 that the renewable energy credits offered by the
system ranks as the Commonwealth’s great- state “has fostered a ton of enthusiasm, growth,
est strength of the tested components, followed and activity in our area,” but that we need “more
closely by its history of environmental protec- shared office space and incubators to help new
tion. Said one Massachusetts executive, “Every- companies grow.”
thing that moves our society towards clean en-
ergy, environmental health, and sustainability is Another industry executive discussed how Mass-
good. Massachusetts has done some great work CEC provided “much needed funds to local start
and needs to continue it. Legislation and regula- ups like ours that … help them hire engineering
tions are fine, but implementation, monitoring, support in critical early phases of their enterprise”
and enforcement are equally important.” but followed by suggesting that the Commonwealth
needs more low-cost startup office space and help
At the same time, public safety and public trans- for new businesses to contain costs of healthcare.
portation both ranked well, while Massachusetts’
roads and bridges and economic development These findings translate directly to the impor-
and business services were rated as its biggest tance of quality of life in Massachusetts to grow-
weaknesses. This point requires further nuance, ing the state’s clean energy economy. Public edu-
however. Overall, employers gave Massachusetts cation matters to companies. Most often, this is
high grades for targeted, clean energy-specific because executives either have children of school
Strengths and Weaknesses of Massachusetts For Operating a Clean Energy Business
K-12 Education 18.3% 39.9% 27.8% 5.0% 7.1%
Environmental
16.7% 41.3% 28.6% 6.6%
Protection
Public safety 8.5% 40.5% 41.5% 5.3%
Economic
development/ 7.4% 35.2% 32.3% 12.4% 6.3% 6.3%
business assistance
Public 11.1% 31.5% 33.3% 11.9% 6.1% 6.1%
transportation
Roads/bridges 5.8% 21.7% 44.4% 16.7% 7.7%
0% 20% 40% 60% 80% 100%
■ Major strength ■ Strength ■ Neither ■ Weakness ■ Major weakness ■ Don't know/ Refused
16 Business Climate Findings | 2013 Massachusetts Clean Energy Industry Reportage and want strong schools for them or they Clean Energy Employers Opinion
recognize that effective schools can be a major of Transportation Infrastructure
incentive to attract talent from other states and Massachusetts needs
countries. This is one finding that cuts across to make it easier for
residents to travel to
42.6%
work without driving
technology, purpose, activity, and geography. Massachusetts needs to do a
better job maintaining its
existing roads and highways, 22.6%
but no added capacity
Transportation Massachusetts needs
to add capacity to its
roads and highways
21.0%
Upgrades Are Critical Current transportation
infrastructure is adequate 9.3%
Employers most clearly emphasized the need for in Massachusetts
more public transit options, with 43% selecting Don’t know/ No opinion 4.5%
“Massachusetts needs to make it easier for resi-
dents to travel to work without driving.” Twen- 0% 10% 20% 30% 40% 50%
ty-three percent noted a need for Massachusetts
to do a better job maintaining its existing road- Massachusetts Quality
way infrastructure, while 21% report that more
capacity is needed. Fewer than 10% reported
of Life Plays a Large Role
that the current infrastructure is sufficient. in Business Expansion
When asked about why their firms are located in
Employers care a great deal about transportation Massachusetts, the overwhelming majority fall into
in Massachusetts. One key reason is that an effec- three categories (for this question, up to three re-
tive transportation system can more easily mitigate sponses were permitted). Eighty percent reported
Boston’s high real estate prices in two key ways. the reason is simply because it is where the owner
First, it opens additional, lower-cost alternatives to and senior executives want to live. Additional rea-
the downtown by providing access for people and
goods to be connected to the marketplace. Second, Reasons Why Clean Energy Businesses
it allows workers to commute from farther, lower Choose Massachusetts
cost areas, which allows for wage-growth contain- It is where the owner/leadership
79.3%
team lives/wants to live
ment as it less frequently needs to be linked to cost Proximity to customers 38.0%
of living standards of Boston. Access to educated
and skilled workers 36.7%
Proximity to world-class
research universities 22.3%
Executives also recognize the cost to their businesses Proximity to suppliers
and vendors
16.2%
caused by inefficient transportation. One employ- Good public schools 9.8%
er said, “Improving public transit would allow us Access to high-quality healthcare 9.8%
to connect regionally, and would prevent wasting Cost of doing business 4.3%
10.4%
money on travel and transportation …traffic kills Other
Don't know/ Refused 3.7%
our productivity but we need better and more op-
tions for people to reliably get to and from work.” 0% 20% 40% 60% 80% 100%
Business Climate Findings | 2013 Massachusetts Clean Energy Industry Report 17sons cited include access to healthcare, good schools Massachusetts Compares
and other typical quality of life issues, highlighting
the importance of keeping Massachusetts a good
Favorably to Other Locations
place to live in order to grow businesses here. Firms that reported having locations in other
states and countries were asked to rank Mas-
These issues were followed by proximity to sachusetts as better, worse, or the same as their
customers, with 38%, and access to a high skill, other business locations on a variety of measures.
talented workforce, at 37%. Also of note (at The majority ranked Massachusetts as a better
22%) is proximity to world-class universities. overall place to do business than other locations,
even if wages and business costs are higher.
Most typically, innovation firms focused on the
Cost of Living and Cost of
attractiveness of Massachusetts, and Boston in
Healthcare Are Perceived particular, to attracting talent. One employer
as Obstacles to Growth said, “Simply put, Massachusetts is a great place
to live and talented people want to live here.”
Businesses reported cost of living and cost of health
insurance as the greatest barriers to expanding their
clean energy operations in Massachusetts. This is More traditional firms added that they value a
especially true of traditional, mature companies. solid, educated consumer base, with the right
Costs of energy do not appear to be a common bar- policies in place to help grow demand. “The
rier to business expansion with 69.4% of firms in- MassSAVE program, MassCEC internships,
dicating that energy costs are “not a barrier.” Sign Green Communities Act and Stretch Code are all
codes, parking regulations, and online competition positive policies helping stimulate business and
were reported as the lowest rated obstacles. job growth...Those have really helped the sector
to grow and make this a strong location for us.”
Cost of living 11.2% 53.1% 34.7%
Cost of health 25.5% 35.7% 36.7%
Insurance
Real estate prices 14.3% 35.7% 49.0%
Employee wages 42.9% 51.0%
Finding employees
with the right skills 13.3% 33.7% 52.0%
Access to capital 19.4% 25.5% 53.1%
Permits/fee 14.3% 25.5% 55.1%
Local taxes 10.2% 27.6% 59.2%
Cost of energy 12.2% 17.3% 69.4%
0% 20% 40% 60% 80% 100%
■ Significant barrier ■ Somewhat of a barrier ■ Not a barrier ■ Don't know/No opinion
18 Business Climate Findings | 2013 Massachusetts Clean Energy Industry ReportUniversities 70.8% 25.0%
Public transportation
to/from work 50.0% 16.7% 29.2%
K-12 education 45.8% 25.0% 29.2%
Access to
45.8% 41.7% 8.3%
talented workers
Community colleges 37.5% 29.2% 12.5% 20.8%
Environmental
33.3% 41.7% 20.8%
protection
Quality of life 29.2% 45.8% 8.3% 16.7%
0% 20% 40% 60% 80% 100%
■ Massachusetts is better ■ Same ■ Massachusetts is worse ■ Don't know/Refused
Firms Are More Likely Firms Are Growing
to Pay Higher Wages Slightly Faster Outside of
in Massachusetts Than Massachusetts Than Within
Other Locations While the plurality of firms expects no difference
Half of all firms that have out-of-state locations in the rate of hiring inside and outside of Massa-
say that they pay the same wages, but nearly a chusetts, more firms expect to grow outside Mas-
quarter pay more wages in Massachusetts than sachusetts than within. There are several potential
out of state. reasons for this. The first is that many firms have
more than two locations across the country, mean-
■ MA workers are paid
ing that, in aggregate, they are growing more out-
higher wages 19.6% 22.3% side Massachusetts than within. Others noted that
■ MA workers are paid
as they mature, higher costs limit their ability to ex-
lower wages
8.1% pand certain parts of their business here, especially
■ No difference
when the new jobs have a lower talent requirement,
50.0%
■ Don’t know/ Refused
thereby making them easier to find elsewhere.
■ Greater rate in MA 41.3%
■ Great rate at 8.7%
other locations
■ No difference 29.3% 20.7%
■ Don’t know/ Refused
Business Climate Findings | 2013 Massachusetts Clean Energy Industry Report 19Massachusetts Boasts Most Firms Unlikely
a High Quality of Life to Relocate Outside
But Is More Expensive of Massachusetts
than Other Locations Firms were also asked about their expectations re-
Massachusetts ranks highly in terms of quality of garding relocation. Eleven percent are likely to re-
life, public transit, public safety, K-12 education, locate outside of Massachusetts (5.2% very likely
environmental protection, universities, commu- and most often reporting due to higher costs),
nity colleges and access to vendors. Massachu- while 86% are unlikely (62% very unlikely).
setts stacks up poorly next to its competitor loca-
2.9% 5.2%
tions in cost of labor, real estate prices, driving to 5.6%
and from work and business costs. Massachusetts
firms are somewhat ambivalent about their access ■ Very likely
to capital here, with only a very slightly higher ■ Somewhat likely
24.2%
number reporting easier access in the Common- ■ Unlikely
wealth. A plurality of firms report that Massa- ■ Very unlikely 62.1%
chusetts economic and business development ■ Don’t know/ Refused
activities are the same as their other locations;
however, more firms rank Massachusetts as worse
in these categories than elsewhere. In the follow
up interviews, employers seemed to focus less on
clean energy-specific policies and more on the
general business incentives available here.
Ecosystem of vendors,
suppliers, and partners
25.0% 50.0% 12.5% 12.5%
Driving to/from work 25.0% 33.3% 33.3% 8.3%
Access to
financial capital 25.0% 33.3% 20.8% 20.8%
Public safety 20.8% 50.0% 12.5% 16.7%
Business costs 20.8% 29.2% 37.5% 12.5%
Economic
development and 20.8% 41.7% 29.2% 8.3%
business assistance
Commercial/industrial
real estate prices/rents
8.3% 33.3% 54.2%
Cost of labor 8.3% 41.7% 41.7% 8.3%
0% 20% 40% 60% 80% 100%
■ Massachusetts is better ■ Same ■ Massachusetts is worse ■ Don't know/Refused
20 Business Climate Findings | 2013 Massachusetts Clean Energy Industry ReportClean Energy Capital Snapshot
Massachusetts has a strong reputation and long Recovery Act (ARRA).17 Recently, and for a vari-
history of attracting capital for its growing inno- ety of reasons, overall global clean energy invest-
vation industries. The Commonwealth has effec- ments have cooled and shifted, which could have
tively leveraged its core academic, human capital, important implications for Massachusetts’ clean
and research strengths to attract a relatively large energy sector.
share of public and private funding for the clean
energy sector, particularly with regards to federal Several widely reported studies18 have illustrated
research dollars and early-stage (Seed, Series A, a considerable global decline in clean energy
and Series B) venture capital funding. investment; however, the wide range of capital
sources included in these analyses, from govern-
Clean energy investments remained a small por- ment loan guarantees to venture capital to asset
tion of total global venture capital investment financing provide a high-level overview, which
dollars through the early-2000s, but the prom- may not accurately describe trends for each capi-
ise of a clean energy future fueled a dramatic tal source. To put these figures into context, this
increase in the total number and value of deals, report includes information about four capital
reaching a peak in 2011.16 This trend was mir- sources and analyzes each while also drawing
rored by global government spending on clean some broad conclusions from the data.
energy, which in the United States peaked with
the passage of the American Reinvestment and A recent report by Bloomberg New Energy Fi-
nance and the Frankfurt School states that, from
16 See, e.g., Bryan Pearce and Dr. Martin Haemmig, Global Venture
Capital Insights and Trends Report, EY, 2011, available at: http://
www.ey.com/GL/en/Services/Strategic-Growth-Markets/Global- 17 See, e.g., http://www.nytimes.com/2012/10/24/business/energy-
venture-capital-insights-and-trends-report. See also, http://www. environment/future-of-american-aid-to-clean-energy.html.
forbes.com/sites/energysource/2013/02/13/why-venture-capital-is-
weak-fuel-for-clean-energy-startups/. 18 See citations throughout this section.
Clean Energy Capital Snapshot | 2013 Massachusetts Clean Energy Industry Report 212011 to 2012, global clean energy investment When government loans, guarantees and grants
declined by 12% while it declined in the U.S. by are removed from the equation, the change is
34%.19 A review of these data show that approx- even more dramatic—global investment totals,
imately 63% of the total value of the reported excluding asset finance, show a 134.5% increase,
investment trends is based on a broad category while the U.S. figure is actually an increase of
called “asset finance” (see Appendix B for further 19.7%.20 In summary, between 2011 and 2012,
discussion of capital trends data). when excluding debt-only asset-based financ-
ing deals and government loans, guarantees and
If the investment landscape is limited to venture grants, and focusing on the aggregate of venture
capital (Seed, Series A, and Series B), growth capital, growth equity and project finance invest-
equity, project finance, and government loans, ments, there was significant global growth and
guarantees and grants, however, the stated 12% positive, albeit much smaller, growth in the U.S.
global decline is misleading—the actual figure
is a 57.2% growth in investments of these types. Comparative Trends, Government
The impact of this change on the United States Excluded, 2010-2012
figure is much less, with the decline of 34% be- 300%
coming a decline of 27.1%. The Massachusetts Global
figure also demonstrates a decline, though it is a 250% US
Massachusetts
comparatively small 3.8%.
Percent Change from 2010
200%
Comparative Trends, 2010-2012 150%
200%
Global 100%
US
Massachusetts
50%
150%
Percent Change from 2010
0%
2010 2011 2012
100%
The figures above demonstrate the need for cau-
50%
tion before reading too much into any broad or
sweeping statements about clean energy trends,
0% and to recognize the importance of definitions
2010 2011 2012
in any capital trend analysis. For the remainder
of this section, a single, consistent data source
19 Bloomberg New Energy Finance and the Frankfurt School UNEP
Collaborating Centre, GLOBAL TRENDS IN RENEWABLE
ENERGY INVESTMENT 2013, available at: http://fs-unep-
centre.org/sites/default/files/attachments/gtr2013keyfindings.pdf.
20 Cleantech Group i3 data.
22 Clean Energy Capital Snapshot | 2013 Massachusetts Clean Energy Industry Reportis used.21 The included capital sources for this Project Finance Comparison, 2010-2012
analysis are limited to venture capital, growth 80%
equity, project finance, and government loans, 68.2%
guarantees, and grants.22 Below is a summary of Global
60% 56.3%
the data. US
Massachusetts
45.3%
40%
Project Finance Is Driving 21.3%
29.3%
Global Clean Energy Markets 20% 16.8%
Worldwide, project financing grew by 404% be- 1.2% 2.6%
0.0%
tween 2011-2012, from just under $5 billion to 0%
2010 2011 2012
nearly $25 billion (up from only $182.4 million
in 2010). This increase has been fueled primar- U.S. capital markets have followed this trend,
ily by expansion of energy markets in developing though not as quickly, which is likely due to con-
economies and the declining price of solar pho- straints of existing, developed infrastructure (as
tovoltaics.23 The increased importance of project compared to developing economies) and declining
finance, defined as financing for the deployment overall energy demand.25 Between 2011 and 2012,
of new, large scale energy generation projects, project financing increased by 143.7%, from $2.9
cannot be understated. From representing only billion to $7 billion (and up from $161 million
1.2% of the global investment total (of the four in 2010, when U.S. deals made up the majority
sources used in this analysis, venture capital, of global project finance deals). In the U.S., the
growth equity, project finance, and government increase can also be illustrated as a share of invest-
loans, guarantees, and grants) in 2010, to repre- ment, going from only 2.6% in 2010 to 16.8% in
senting 68% of the total investments in clean en- 2011 to 56.3% in 2012.26
ergy across the globe in 2012 (21.2% in 2011).24
Percent of Global Investment by Category
2012 10.9% 68.2% 17.4%
21 The Cleantech Group’s i3 platform is used because each investment
is cited with date and amount, allowing each to be independently
verified.
2011 10.2% 23.9% 21.3% 44.6%
22 To keep the clean energy definition consistent across each segment
of this report, the following tags were used to track clean energy
investment: solar, wind, geothermal, biomass generation, biofuels 2010 18.2% 30.9% 49.7%
and biochemicals, hydro and marine power, energy efficiency,
energy storage, and alternative transportation. Two investments
that were included in Cleantech’s database, totaling $1.25 billion to 0% 20% 40% 60% 80% 100%
GreatPoint Energy for coal-to-gas plants, were excluded from this
analysis because the projects do not meet MassCEC’s definition of ■ Venture Capital ■ Growth Equity ■ Project Finance ■ Government
clean energy used in other sections of this report.
23 http://fs-unep-centre.org/sites/default/files/attachments/
gtr2013keyfindings.pdf, at p. 11. 25 http://www.eia.gov/forecasts/aeo/MT_energydemand.cfm.
24 Cleantech Group i3 data. 26 Id.
Clean Energy Capital Snapshot | 2013 Massachusetts Clean Energy Industry Report 23You can also read