Wind energy helps build a more reliable and balanced electricity portfolio
←
→
Page content transcription
If your browser does not render page correctly, please read the page content below

Wind energy helps build a more
reliable and balanced electricity
            portfolio
        American Wind Energy Association I www.awea.org

                                             American Wind Energy Association I www.awea.org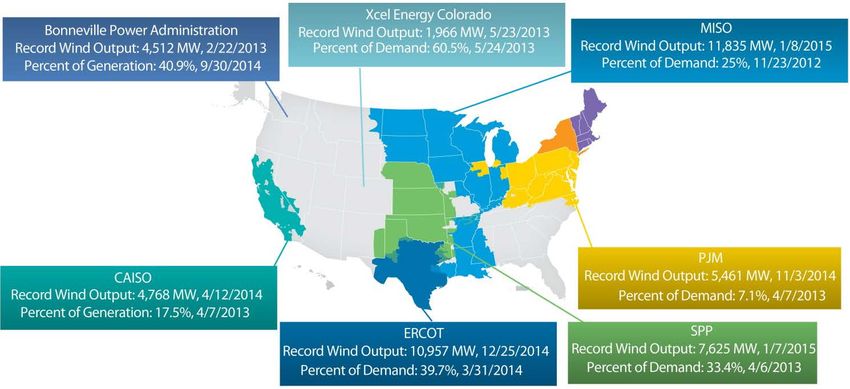
Executive Summary
Some of the most common questions                     3. How much does it cost to integrate
about wind energy focus on how wind                   wind?
can be reliably integrated into the power             Grid operator data show that the cost of the
system. A key source of confusion is that,            incremental flexible reserves needed to
contrary to most people’s intuitive experience        accommodate wind amount to pennies on a
that winds are variable and electricity demand        typical electric bill. In fact, the cost of
and supply is stable, the opposite is actually true   accommodating the unexpected failures of large
at the grid operator scale. The following report      conventional power plants is far higher.
answers 15 of the most frequently asked
questions with lessons learned from grid              4. How much more wind energy can we
operators’ experiences reliably integrating large     reliably integrate?
amounts of wind. Concise answers to these             While U.S. and European grid operators have
questions are provided here in the executive          already reliably integrated large amounts of
summary, while citations and explanations of the      wind energy, studies indicate that we can go far
supporting data and analysis for those answers        higher. Studies examining obtaining 40% or
can be found by following the hyperlinks to the       more of our electricity from wind have found no
relevant sections of the full report below.           major obstacles to doing so. Ten years ago
                                                      some utilities and grid operators were
1. How much wind energy is on the                     concerned about reaching 5% wind; they now
power system now?                                     have a lot more experience to draw from, and
U.S. wind energy provides enough electricity to       over the next ten years, they will surely learn
power the equivalent of over 18 million homes.        more and be able to continue increasing reliable
Iowa and South Dakota reliably produced more          penetration.
than 25% of their electricity from wind last year,
with a total of nine states above 12% and 17          5. Don’t grid operators need to add
states at more than 5%. At times, wind has            backup to integrate wind?
supplied more than 60% of the electricity on the      No. One of main reasons why an integrated
main utility system in Colorado, and nearly 40%       power system was first built more than 100 years
of the main Texas power system.                       ago was so that all power plants could back up
                                                      all other power plants. Because most sources of
2. How do grid operators accommodate                  variability cancel each other out, having a
such large amounts of wind energy?                    dedicated backup source for each would be
Variability and uncertainty are nothing new for       highly inefficient and counterproductive.
grid operators, as they have always dealt with
large and unexpected fluctuations in electricity      6. What happens when the wind doesn’t
supply and demand by changing the output of           blow?
power plants. Most changes in wind output are         Other plants provide energy at those times, in
canceled out by other offsetting changes in           the same way that all power plants back up all
electricity supply and demand, and any                other power plants. Portfolio diversity is the key,
remaining variability is accommodated using the       as no resource is available 100% of the time. All
same flexible reserves that grid operators have       power plants have reduced output at times, and
always used. In fact, because changes in wind         grid operators plan for wind’s contribution using
output occur gradually and can be forecast, they      the same tools they use to evaluate the
are less costly for grid operators to                 contributions of other resources. Adding wind
accommodate than the abrupt failures of large         power never increases the need for power
conventional power plants.                            plants, but rather reduces it. During a number of
                                                      events wind has demonstrated its contribution

                                                      American Wind Energy Association I www.awea.org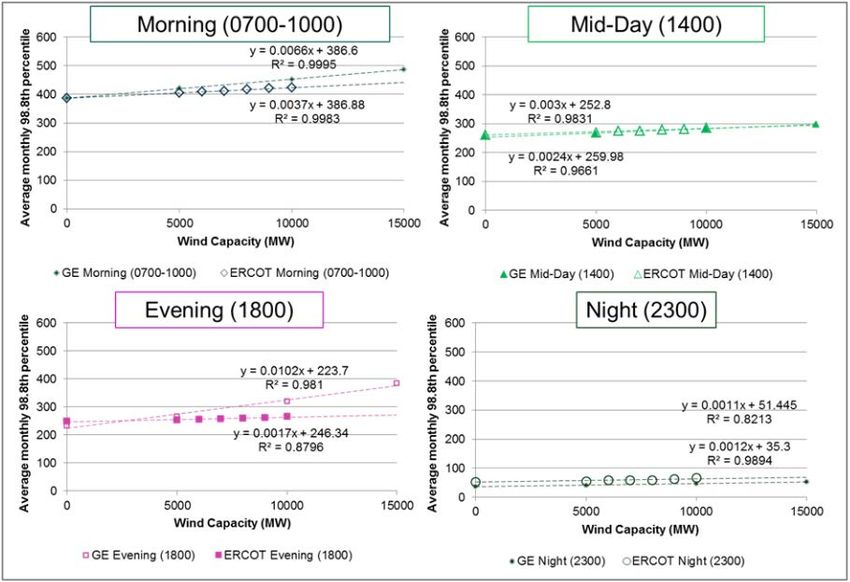
to a more reliable and diverse energy portfolio       obtaining around 20% of their electricity from
by stepping in when other resources failed            wind on an annual basis, Germany at 25% from
unexpectedly.                                         wind and solar, and Denmark at nearly 35%
                                                      wind. Carbon emissions have fallen drastically in
7. Don’t we need baseload power?                      all of these countries, while electric reliability has
Instead of using the term “baseload,” it is more      been maintained at world-leading levels and in
productive to talk about the three main services      many cases improved.
the grid needs to operate reliably: energy,
capacity, and flexibility. Energy is the production   10. What is needed to reliably
of electricity, capacity is the ability to produce    accommodate higher levels of wind?
power during periods of high demand, and              Market-based grid operating reforms and
flexibility is the ability to change output to keep   transmission upgrades are by far the lowest
supply and demand in balance. Cost-effectively        hanging fruit for making the power system more
obtaining all three services requires a division of   efficient by using more of the flexibility that
labor among a diverse mix of energy sources, as       already exists on the power system. These grid
no resource excels at providing all three. For        operating reforms provide major net benefits to
example, baseload resources typically do not          consumers and improve reliability even without
provide flexibility, and there can be lower-cost      renewable energy on the power system, so they
ways of obtaining the energy and capacity             should be pursued regardless.
provided by baseload. Wind energy primarily
adds value to an energy portfolio as a low-cost       11. Isn’t energy storage necessary to
and non-polluting source of energy, though it         integrate wind?
also provides some capacity and can provide
                                                      No. Very large amounts of wind energy can be
flexibility when it is economic to do so.
                                                      reliably integrated at low cost without a need for
                                                      energy storage. Energy storage provides a
8. What about the reliability services                variety of services and is therefore best viewed
provided by conventional generation?                  as a power system resource and not a resource
As wind energy has grown to provide a larger          for renewable energy. Energy storage is typically
share of our electricity mix, wind turbine            a more expensive source of flexibility than grid
technology has matured so that modern wind            operating reforms that allow greater use of the
plants are able to provide the same grid              flexibility that already exists on the power
reliability services as conventional generators,      system.
including voltage and reactive power control,
frequency and inertial response, active power         12. Why is some wind power curtailed?
control, and voltage and frequency ride-through.      How does time of production affect the
In some cases the reliability services provided by
                                                      value of wind energy?
wind exceed those of conventional generators,
                                                      In some areas the growth of wind energy has
while in other cases conventional generators can
                                                      outpaced the addition of transmission. At times
provide those services more economically than
                                                      this has required reducing, or curtailing, the
wind generators, but wind generators can
                                                      output of wind plants until new transmission is
provide those services if it becomes economic to
                                                      added. However, as long-needed grid upgrades
do so.
                                                      are completed, wind curtailment is being
                                                      virtually eliminated, as are occurrences of
9. What has been Europe’s experience                  negative electricity prices. Wind energy always
with renewable energy?                                has high economic value, particularly once the
European nations have demonstrated that wind          environmental and public health costs of fossil
energy can reliably provide a large share of our      fuel generation are taken into account.
electricity, with Ireland, Spain, and Portugal

                                                      American Wind Energy Association I www.awea.org
13. How does the renewable energy
Production Tax Credit affect electricity
markets and reliability?
Wind and the production tax credit are
compatible with well-functioning electricity
markets. Wind’s impact on other generators is
market-driven and the same as that of any low-
cost generator, and trivially small compared to
other factors.

14. What is wind’s net impact on
emissions?
Wind energy greatly reduces emissions of
carbon dioxide and other pollutants after all
impacts on other power plants are taken into
account.

15. Can wind reliably reach the level of
output EPA assumed in its Clean Power
Plan?
Yes. Renewable energy has already met EPA’s
2020 target and is well on its way to greatly
exceed EPA’s 2020-2030 targets. By exceeding
its targets, wind energy can help comply with
other parts of EPA’s plan, lessening the
requirements on other parts of the electric
sector.

As should be apparent from the extensive
evidence provided in the full text below,
this report seeks to distill tens of thousands
of pages of analysis by grid operators and
other experts into a more digestible
document. Additional technical support for
the points made in this document can be
found in a similar 2009 FAQ authored by
some of the world’s leading wind
integration experts. 1

1
 http://www.ieee-pes.org/images/pdf/open-access-
milligan.pdf

                                                   American Wind Energy Association I www.awea.org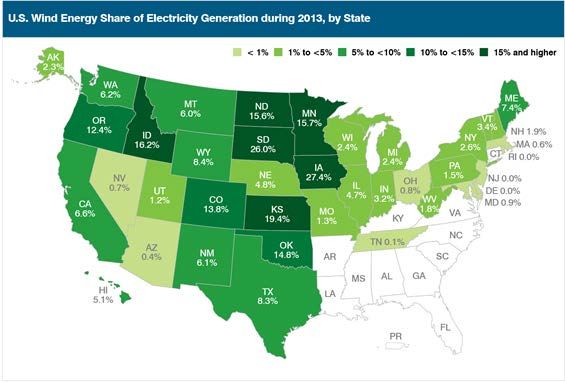
1. How much wind energy is on the power system now?
U.S. wind energy provides enough electricity to power the equivalent of over 18 million
homes. Iowa and South Dakota produced more than 25% of their electricity from wind in 2013, with a
total of nine states above 12% and 17 states at more than 5%. Wind energy provided 10.6% of the
electricity last year on the main power system in Texas, 2 ERCOT, and that figure is expected to reach 15-
20% by 2017. 3

At certain times, wind output levels have gone even higher. The graphic below shows wind generation
records and the record percent of demand or generation from wind. At times, wind has supplied more
than 60% of the electricity on the main utility system in Colorado, nearly 40% of the main Texas power
system, and 33% in the Southwest Power Pool, all without any reliability problems.

2
  http://ercot.com/news/press_releases/show/51654
3
 http://www.ercot.com/content/committees/board/keydocs/2014/ERCOT_Monthly_Operational_Overview_201412.pdf,
page 18

                                                          American Wind Energy Association I www.awea.org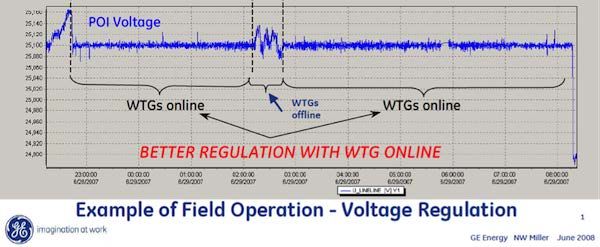
Wind energy output records by region

In the North American Electric Reliability Corporation’s (NERC) annual report on threats to grid reliability,
the only mention of renewable energy is one paragraph explaining that wind energy is being reliably
integrated: “There were no significant reliability challenges reported in the 2011/2012 winter and the
2012 summer periods resulting from the integration of variable generation resources. More improved wind
forecast tools and wind monitoring displays are being used to help system operators manage integration
of wind resources into real-time operations.” 4

4
    http://www.nerc.com/pa/RAPA/PA/Performance%20Analysis%20DL/2013_SOR_May%2015.pdf, page 47

                                                          American Wind Energy Association I www.awea.org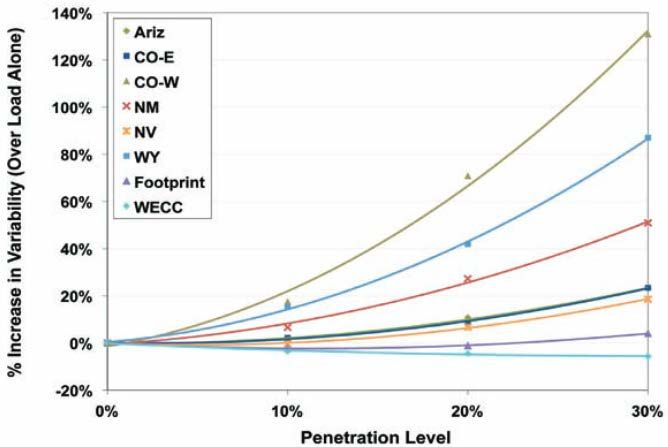
2. How do grid operators accommodate such large
amounts of wind energy?
Variability and uncertainty are nothing new for grid operators, as they have always dealt
with large and unexpected fluctuations in electricity supply and demand. Since the days of
Thomas Edison, grid operators have had to constantly accommodate variability in electricity demand and
supply by increasing and decreasing the output of flexible generators – power plants like hydroelectric
dams or natural gas plants that can change their level of generation. Thus, the water kept behind a dam or
the natural gas held in a pipeline may be thought of as a form of energy storage, with operators using this
energy when it is needed and "storing" it when it is not. For a video illustrating this process, see:
https://www.youtube.com/watch?v=gSiCRZcJnfE.

Grid operators have always kept large quantities of fast-acting generation in reserve to respond to the
instantaneous and unpredictable failures of large conventional power plants, a challenge and cost that is
far greater than accommodating any incremental variability added by the gradual and predictable changes
in the aggregate output of a wind fleet. Grid operators use these same flexible resources to accommodate
any incremental variability introduced by wind energy that is not canceled out by other changes in
electricity supply or demand.

Over the last century, grid operators moved to larger interstate power systems so that changes like an
increase in electricity demand caused by a factory coming online would be offset by decreases in
electricity demand occurring elsewhere, or an unexpected outage at a power plant could be compensated
for by a power plant several states away. The grid remains reliable even though it takes power from many
sources that vary over time, just like the Mississippi River takes water from many varying tributaries yet
keeps a steady flow into the Gulf of Mexico.

This diversity benefit provides even greater value for wind energy because a region’s wind plants are
experiencing different weather at any one point in time. Just as a customer in Washington DC turning on
their air conditioner is canceled out by a customer in Chicago turning theirs off, output changes at one
wind plant are often offset by an opposite change at another wind plant. Furthermore, most output
changes for the total wind fleet are canceled out by other changes in electricity supply and demand,
mostly by random fluctuations in electricity demand.

Because wind turbines are spread across a large area, it typically takes many hours for a weather event to
affect a large share of a region’s wind output. Changes in total wind energy output occur very slowly, even
though the winds may change fairly rapidly at any one location. The diversity of wind energy output can be
seen in this real-time map of wind speeds. 5 NREL’s Renewable Energy Futures study, which examined a
future in which nearly 50% of electricity is reliably provided by wind and solar, also shows the value of this
diversity. For a sample of the study’s modeling of hourly electricity supply at nearly 50% wind and solar
energy, see: https://www.youtube.com/watch?v=fQl7PS243Dg

Moreover, weather forecasting makes changes in wind energy output predictable, unlike the abrupt
outages at conventional power plants that can take 1,000 MW or more offline instantaneously. Wind
energy forecasting greatly reduces uncertainty about what wind energy output will be over the next day or
more. The use of weather forecasting to reduce uncertainty is also nothing new for grid operators, as grid
operators already use weather forecasting to predict how electricity demand will be driven by consumers
running their air conditioners or heaters.

5
    http://hint.fm/wind/

                                                           American Wind Energy Association I www.awea.org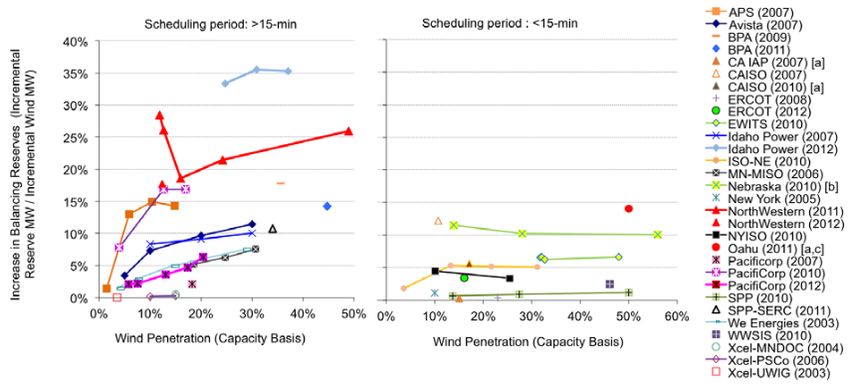
Thus, contrary to most people’s intuitive experience that winds are highly variable and electricity demand
and supply is fairly stable, the opposite is actually true at the grid operator level. Data from the PJM
independent grid operator illustrate this fact. The largest hourly changes in electricity demand are typically
about 10 times larger than the largest hourly changes in wind energy output, even though PJM has around
6,000 MW of wind energy on its system. 6

A tremendous amount of flexibility has been built into the power system to accommodate these large and
abrupt swings in electricity supply and demand. Demand for electricity can vary by a factor of three or
more depending on the time of day and year, which nationwide translates into hundreds of gigawatts of
flexibility that are already built into the power system.

Grid operators accommodate variability using different types of “operating reserves,” which are provided
by flexible resources. As described in more detail under Question 3 below, “regulating reserves” are the
fast-acting reserves for accommodating moment-to-moment variability in electricity supply and demand.
Grid operators also use fast-acting “contingency reserves” to accommodate unexpected and abrupt
failures of large conventional generators. These fast-acting reserves are typically provided by operating
power plants changing their level of output.

Slower-acting reserves can be provided by a much larger group of resources, often including power plants
that are offline but can start up on short notice. These “non-spinning” reserves typically cost far less than
the fast-acting reserves provided by operating power plants. This is important because it means that the
gradual and predictable changes in wind output are much less costly to accommodate than the
instantaneous and unpredictable outages that occur at large conventional power plants, which require grid
operators to hold expensive fast-acting reserves 24/7/365.

Several charts derived from wind integration studies and actual grid operating experience help illustrate
the variability and uncertainty of wind energy and how they interact with other sources of variability and
uncertainty. The first chart shows that as the distance between two wind plants increases, it becomes more
likely that their output is not changing in the same direction. 7 This makes sense, because few weather
systems are large enough and aligned in such a way that they could affect more than a small number of
wind plants simultaneously. As a result, it becomes likely that changes in their output will offset each other.
Importantly, the chart shows that for the 5-minute timeframe covered by the fast-acting and most
expensive regulating reserves, even a dozen or so miles between two wind plants is enough to make it
likely that changes in one wind plant’s output will cancel out changes in the other plant’s output. This
offsetting impact, combined with the fact that electricity demand contributes far more total variability at
the 5-minute timescale than wind, explains why wind generation only minimally contributes to the need for
fast-acting regulating reserves.

6
  https://www.pjm.com/~/media/committees-groups/task-forces/irtf/20140721/20140721-item-05-wind-report.ashx,
http://www.pjm.com/markets-and-operations/energy/real-time/loadhryr.aspx
7 http://www2.vtt.fi/inf/pdf/tiedotteet/2009/T2493.pdf, page 25

                                                            American Wind Energy Association I www.awea.org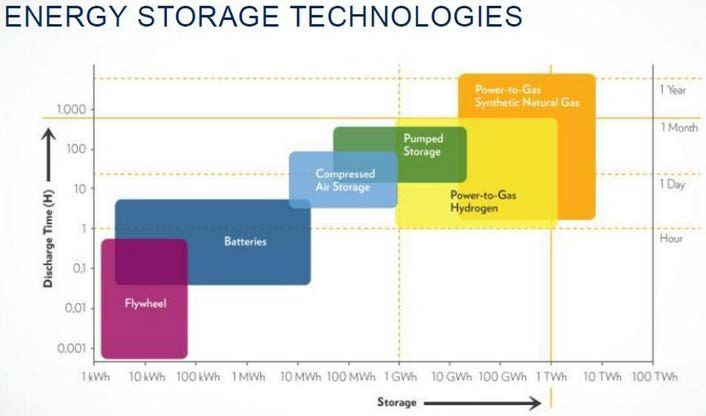
Because wind plant output changes are not correlated across large areas,
                       these output changes cancel each other out

For similar reasons, wind and solar forecast errors also tend to cancel out over larger areas, as shown
below. This allows grid operators to more accurately predict changes in wind output and accommodate
them at low cost. 8

8
    Ibid., pages 26-28

                                                         American Wind Energy Association I www.awea.org
Wind forecast error decreases over larger geographic areas

Because increases in output at one wind plant tend to cancel out decreases in output at others, total wind
variability grows more slowly as one adds more wind. Said another way, adding more wind generation
increases total wind variability, but tends to reduce the amount of wind variability per MW of installed
wind capacity. This is illustrated in the chart below, which shows per-MW wind variability on the y-axis. 9

              Total wind variability grows more slowly as more wind is added

The last chart shows how total system hourly variability changes at higher levels of renewable use. For
smaller geographic areas, total system variability grows significantly as renewable variability eclipses
electricity demand variability. However, over a geographic area the size of the entire Western U.S.,
renewable variability cancels out other renewable variability and demand variability to such a large extent
that total power system variability actually decreases as one increases to 30% renewable energy use. 10 This
geographic diversity drives the benefits associated with coordinating grid operations across larger areas,
as discussed in more detail in the answer to Question 10.

9
 http://decarboni.se/publications/western-wind-and-solar-integration-study-phase-2/41-geographic-diversity
10
  Pages 83-84 at http://www.nrel.gov/docs/fy10osti/47434.pdf. “WECC‐wide, the variability at 30% penetration is
actually less than the variability with load alone.” [emphasis in original] “The fact that the net load variability at the
footprint and WECC level does not significantly increase with penetration speaks volumes about the impact of temporal
averaging, geographic diversity and wide-area aggregation on variability.”

                                                                  American Wind Energy Association I www.awea.org
Change in total power system variability
based on renewable use level and size of geographic area
Dozens of grid operator studies and years of real-world operating experience confirm that wind energy
only slightly adds to total power system variability, and that most changes in wind energy output are
canceled out by opposite changes in electricity supply and demand. 11 Because demand is a far larger
contributor to total fast variability, changes in wind output on the minute-to-minute are typically canceled
out and have minimal impact on total system fast variability.
Variability in wind and solar does not need to be managed on a stand-alone basis, but rather the grid
operator is only concerned about managing the combined variability of all sources of supply and demand.
This greatly reduces the cost and challenge of accommodating variability, as the total variability is far less
than the sum of its parts. As an analogy, it would be highly inefficient and counterproductive to have a
battery or power plant accommodating changes in the electricity demand at your house as you turn
appliances on and off, as nearly all of those changes are canceled out anyway by other changes on the
aggregate grid, whether caused by your neighbor or someone several states away turning their TV off as
you turn yours on.
The table below shows that the regulating reserve need for wind is much smaller than the contingency
reserve need for conventional generation. The results are consistent, and surprising. For example, the
ERCOT (Texas) and MISO (Upper Midwest) grid operators each reliably accommodate more than 10,000
MW of wind energy on their power systems. These significant levels of wind penetration are being
accomplished with limited amount of reserves, with ERCOT finding that amount of wind is reliably
accommodated with less than 50 MW of additional fast-acting reserves. 12 ERCOT has also noted that it has
been able to integrate renewable energy with a “minimal increase” in operating reserves. 13 Similarly,
11
http://variablegen.org/resources/
12
http://variablegen.org/wp-content/uploads/2012/12/Maggio-Reserve_Calculation_Methodology_Discussion.pdf
13
http://www.ercot.com/content/committees/other/fast/keydocs/2014/ERCOT_AS_Concept_Paper_Version_1.1_as_of_
11-01-13_1445_black.doc , page 8
American Wind Energy Association I www.awea.orgMISO explains that the incremental need for fast-acting reserves due to wind is “little to none.” 14 The grid
operator for the Great Lakes and Mid-Atlantic states, PJM, holds 3,350 MW of expensive, fast-acting
reserves 24/7 in case a large fossil or nuclear power plant unexpectedly breaks down. For comparison,
PJM’s renewable integration study found that adding more than 28,000 MW of wind only increases the
need for these fast-acting reserves by around 360 MW. 15
The table below focuses on the two fast-acting types of reserves described above, as they are the most
expensive types of operating reserves. These two types are also the focus because all grid operators hold
regulation and contingency reserves, while the definitions and use of slower-acting reserves vary
considerably from grid operator to grid operator, with some not holding these reserves at all but relying
on the energy market to provide the needed flexibility. 16 Wind’s variability does increase the need for
other types of slower-acting, non-spinning reserves, though these reserves are typically much less
expensive than regulating reserves. In the next section, a more detailed look at the ERCOT data expands
the analysis to include those other types of reserves, and demonstrates that wind’s total operating reserve
needs are still less costly than the reserve needs for conventional generation.
MW of Regulating Regulating Increase in regulating Contingency
wind reserve without reserve with reserve with wind reserves for
added wind (MW) wind (MW) (MW) conventional
generators (MW)
ERCOT actual 17 10,000 508 550 42 2,800 18
MISO actual 19 10,000 NA NA “Little to none” 2,000
PJM study 20 28,000 1,204 1,566 362 3,350 21
Minnesota study 22 5,688 137 157 20 660
Westar actual 23 400 120.2 123 2.8 NA
Adding wind energy does affect the operation of other power plants aside from the impact on operating
reserve needs. However, the introduction of any new generating resource, particularly a low-marginal cost
resource like wind energy, similarly affects the operations of other resources. Moreover, much of this
impact is the intentional benefit that wind generation should displace more expensive and polluting forms
of energy, and it is difficult if not impossible to disentangle that impact from wind’s other impacts on those
generators. 24 A further complicating factor is that each grid operator uses different methods for
accommodating slower sources of variability and uncertainty, with some using the energy market to
14
http://variablegen.org/wp-content/uploads/2012/12/Navid-Reserve_Calculation.pdf
15
http://www.pjm.com/~/media/committees-groups/committees/mic/20140303/20140303-pjm-pris-final-project-
review.ashx, page 111
16
http://apps1.eere.energy.gov/wind/newsletter/pdfs/51978.pdf, page 18
17
Available at http://variablegen.org/wp-content/uploads/2012/12/Maggio-
Reserve_Calculation_Methodology_Discussion.pdf.
18
http://www.ercot.com/content/news/presentations/2012/Dumas_IPPSA_March13.pdf, page 5
19
See http://variablegen.org/wp-content/uploads/2012/12/Navid-Reserve_Calculation.pdf,
http://www.ferc.gov/CalendarFiles/20140411130433-T1-A%20-%20Navid.pdf
20
PJM study results, regulation reserve needs in the 14 percent renewable energy scenario, slide 111, available at:
http://www.pjm.com/~/media/committees-groups/committees/mic/20140303/20140303-pjm-pris-final-project-
review.ashx.
21
http://www.nrel.gov/docs/fy11osti/47078.pdf, page 141
22
http://mn.gov/puc/documents/pdf_files/000664.pdf, page xvii
23
Data submitted to FERC by Westar Energy on February 29, 2012.
24
http://www.nrel.gov/docs/fy11osti/51860.pdf, pages 6-11
American Wind Energy Association I www.awea.orgprovide the flexibility and others using reserve products. As a result, this paper does not attempt to
address those issues beyond what has already been discussed by others. 25
Returning to the operating reserve table above, a powerful yet under-appreciated mathematical principle
explains why wind variability contributes little to total power system variability. Two sources of
uncorrelated variability cancel each other out such that the total variability is much less than the sum of the
parts. Fortuitously, wind variability and electricity demand variability are uncorrelated at sub-hourly
timescales. Mathematically, total variability is the square root of the sum of the squares of the individual
variabilities, or sqrt(x2+y2). As an example, if the variability of electricity demand is 10 MW and the
variability of wind generation is 5 MW, the total variability is not 15 MW, but rather sqrt(100+25) = 11.18
MW. So in this example, adding 5 MW of wind variability only increased total system variability by 1.18
MW, with the other roughly 4 MW of variability canceled out by counteracting demand variability.
The efficiency with which grid operators manage wind variability by aggregating it with all other sources of
variability was concisely summed up by an analyst for the International Energy Agency:
“Variability is not just some new phenomenon in grid management. What we found is that renewable
energy is not fundamentally different. The criticisms of renewables often neglect the complementarities
between different technologies and the way they can balance each other out if spread over certain regions
and energy types.
“Grid operators are constantly working to balance available supply with demand – it’s what they do. There
are always natural variations that cause spikes in demand, reductions in supply or create disturbances in
frequency and voltage. Once you see there are a variety of ways to properly manage that variability, you
start whittling away at the argument that you always need storage or a megawatt of natural gas backup for
every megawatt of renewable energy.” 26
25
Id.
26
http://thinkprogress.org/climate/2011/06/15/245880/top-5-coolest-ways-companies-are-integrating-renewable-
energy-into-the-grid/
American Wind Energy Association I www.awea.org3. How much does it cost to integrate wind?
While it is true that wind energy’s variability does slightly increase the need for the operating
reserves that grid operators use to keep supply and demand in balance, all forms of energy impose
integration costs on the power system. 27 In regions with efficient grid operating procedures, by a
large margin the most expensive challenge for grid operators is accommodating the abrupt failures of
large conventional power plants, not the gradual and predictable changes in wind energy output.
For example, Texas grid operator data show that the operating reserve costs for conventional power
plants are far larger than the operating reserve costs for wind generation, even though Texas has more
wind energy than any other state and one of the highest levels of wind generation for a U.S. grid operator.
The Texas grid operator ERCOT holds 28 2,800 MW of fast-acting reserves 24/7/365 to keep the lights on in
case one of the state’s large fossil or nuclear power plants experiences an unexpected failure, as all power
plants do from time to time. In contrast, the reserve need for wind is far smaller and can be met with less
expensive, slower=acting reserves. The following table compares the reserve costs for wind versus other
sources of variability on the ERCOT grid.
Total annual
% of total Cost per MWh of
Factor reserve cost Cost per electric bill
reserve cost total/wind generation
(million $)
Conventional power plant
$239.690 67% 76 cents $0.65/MWh
failures
Conventional and
$103.359 29% 33 cents $0.28/MWh
demand deviations
Wind $13.740 4% 4 cents $0.37/MWh
As the table shows, the cost of additional reserves to accommodate wind accounts for about 4 cents out
of a typical Texas household’s $128 monthly electric bill 29, or 1/30,000th of a typical electric bill. In contrast,
the $240 million annual cost of reserves to accommodate conventional power plant failures works out to
about 76 cents per monthly electric bill. In other words, the total cost of contingency reserves for
conventional power plant failures is more than 17 times larger than the cost of all wind-related reserves.
On a per-MWh of energy produced basis, wind’s reserve cost is still about half as large as conventional
power plants’ reserve costs (1 MWh is roughly the amount consumed by a typical household in a month).
Wind’s reserve cost is about $0.37/MWh of wind when allocated across the wind MWh generated in
ERCOT last year, which equates to roughly 1% of the typical price for 1 MWh of wholesale electricity. In
contrast, the cost of contingency reserves was $.65/MWh when allocated across all MWh generated in
ERCOT last year, and even higher if only allocated to generation from the larger conventional power
plants that cause the need for contingency reserves. 30
27
http://www.nrel.gov/docs/fy11osti/51860.pdf, pages 11-16.
28
http://www.ercot.com/content/news/presentations/2012/Dumas_IPPSA_March13.pdf, page 5
29
Available at: http://www.eia.gov/electricity/sales_revenue_price/pdf/table5_a.pdf
30
For more background on these calculations, see http://aweablog.org/blog/post/fact-check-winds-integration-costs-
are-lower-than-those-for-other-energy-sources
American Wind Energy Association I www.awea.orgThe table above is directly calculated from the following ERCOT data. The first three rows in the following
table list ERCOT data 31 on the incremental amount of reserves it holds to accommodate various sources of
variability, while the fourth row lists the average cost of those reserves in 2013, also calculated from
ERCOT data. 32 The last three rows use this data to calculate the total reserve cost for each source of
variability.
Regulation down Regulation up Responsive Non-spinning
(fast-acting (fast-acting reserves reserves
reduction in electric increase in electric (contingency (slower-acting
supply) supply) reserves) reserves)
Contingency reserves for
conventional power plant 2,800
failures (MW)
Incremental reserves for wind
14 42 328
(MW)
Electricity demand variability
and deviations at conventional 476 508 1,474
power plants (MW)
Average cost of reserve
$4.89 $8.57 $9.77 $3.47
($/MW)
Annual reserve cost for
conventional power plant $239.690
failures (million $)
Annual reserve cost for wind
$0.585 $3.159 $9.996
(million $)
Annual reserve cost for
electricity demand variability
and supply deviations at $20.372 $38.126 $44.860
conventional power plants
(million $)
The 2- to 3-fold cost premium for faster-acting regulation and responsive reserves versus slower-acting
non-spinning reserves is an important driver of the difference in total cost for wind versus conventional.
Slower-acting reserves can be provided by a much larger group of resources, often including power plants
that are offline but can start up on short notice. These “non-spinning” reserves typically incur far less cost
to provide operating reserves than operating power plants, as reflected in the reserve prices shown in the
table above. In other regions and under different fuel prices the cost difference can be even more
pronounced, with fast-acting reserves sometimes dozens of times more expensive than slower-acting
reserves. 33
31
Available at: http://variablegen.org/wp-content/uploads/2012/12/Maggio-
Reserve_Calculation_Methodology_Discussion.pdf
32
Data available at
http://mis.ercot.com/misapp/GetReports.do?reportTypeId=13091&reportTitle=Historical%20DAM%20Clearing%20Pric
es%20for%20Capacity&showHTMLView=&mimicKey
33
http://www.consultkirby.com/files/Ancillary_Services_-_Technical_And_Commercial_Insights_EXT_.pdf, page 30
American Wind Energy Association I www.awea.orgMoreover, recent analysis by NREL indicates that higher levels of renewable energy may actually decrease
the total cost of operating reserves, even though the quantity of operating reserves has increased. Adding
renewable generation displaces the output of the most expensive power plants that are currently
operating, freeing those generators up to provide reserves and therefore driving down the cost of
reserves. 34 As a result, in NREL’s analysis of the Colorado and Wyoming power system, total operating
reserve costs actually fell from $32.3 million at a 25% renewable penetration to $31.2 million at a 35%
renewable penetration, even though the quantity of operating reserves increased.
It is also important to keep in mind that all operating reserve costs are a very small component of the total
costs reflected in the average ratepayer’s electric bill. For example, total regulation reserve costs account
for 0.5% of total PJM wholesale market costs, or about $0.24/MWh. 35 PJM’s renewable integration study
found that the current amount of renewable generation on its power system increased the need for
regulation reserves from 1,204 MW to 1,222 MW. 36 Thus, the incremental regulation reserves needed due
to renewable energy accounted for less than 1.5% of 0.5% of total wholesale market costs, or about 4
cents per year for a household that consumes 1 MWh per month. While this calculation does not include
slower-acting and less expensive types of operating reserves, it still indicates the very small magnitude of
wind-related reserve costs. MISO data show an even lower total cost for operating reserves than PJM. 37
In short, wind-related reserve costs are a small subset of a small subset of the average ratepayer’s electric
bill. It is not surprising that the total wind reserve cost was calculated at 4 cents per month for the average
Texas customer, even with more than 10,000 MW of wind generation on the main Texas power system.
As addressed later in the answer to Question 10, renewable integration costs may appear to be higher in
parts of the country with less efficient grid operating practices, particularly in the Western U.S. However,
because these costs would likely be reduced to the levels described above if efficient operating practices
were in place, those higher costs should be attributed to the obsolete operating practices that are in
place, not renewable generation.
Finally, it should be noted that integration costs for conventional power plants are not assigned to
conventional power plant owners, but are rather paid by electricity customers. Wind farm owners can be
and are charged for integration costs, while the integration costs for conventional power plants are
socialized across consumers’ electric bills. As a result, false claims that renewable integration costs will
impose a significant burden on customers add insult to injury because conventional generators’ far larger
integration costs are the ones that are always paid by ratepayers.
34
http://www.nrel.gov/docs/fy13osti/58491.pdf, page 31
35
http://www.monitoringanalytics.com/reports/PJM_State_of_the_Market/2013/2013-som-pjm-volume1.pdf, page 12
36
PJM study results, slide 111, available at: http://www.pjm.com/~/media/committees-
groups/committees/mic/20140303/20140303-pjm-pris-final-project-review.ashx.
37
https://www.misoenergy.org/Library/Repository/Market%20Reports/20140120_sr_ctsl.pdf
American Wind Energy Association I www.awea.org4. How much more wind energy can we reliably
integrate?
More than a dozen wind integration studies by U.S. grid operators and others have found that wind
energy can reliably supply at least 20-30% of our electricity, 38 with some studies analyzing wind providing
40% of total electricity on an annual basis. For example, NREL’s Renewable Energy Futures study found no
reliability problems for a case in which wind and solar provide nearly 50% of total electricity. 39 A wind
integration study by Nebraska utilities found minimal integration costs and no reliability concerns
associated with wind providing 40% of electricity in the Southwest Power Pool. 40 As another example, PJM
recently studied the impacts of increasing its use of wind energy by a factor of 15, and found the “PJM
system, with adequate transmission and ancillary services in the form of Regulation, will not have any
significant issue absorbing the higher levels of renewable energy penetration considered in the study.” 41
The Minnesota Department of Commerce just released a comprehensive study that found no challenges to
integrating 40% wind and solar energy in Minnesota, including a detailed examination of power system
dynamics and other reliability services. The study also found no challenges for accommodating the
variability associated with wind and solar providing 50% of electricity in the state, though due to time
constraints the study did not include a full analysis of power system dynamics in that case. 42 The
International Energy Agency also recently released analysis that examined seven large power systems
around the globe, including Texas’s, and found that all could reliably and cost-effectively obtain 45% of
their electricity from renewable energy. 43 NREL’s analyses of over 30% renewable energy penetrations in
the Eastern and Western U.S. also found no reliability problems or economic barriers. 44
It is reasonable to ask whether these studies accurately reflect grid operating realities. Fortunately, the
Texas grid operator has answered that question, and in that case found the study actually overestimated
the increase in reserve needs that would be caused by wind. In 2013, ERCOT used its real-world grid
operating data to validate the results of a 2008 study it had conducted to estimate the impact of higher
levels of wind use. 45 The results are summarized in the following table, drawn from the report’s graph
shown below that.
Regulation reserve need 2008 study 2012 actual data
per 1,000 MW of wind
capacity
Morning 6.6 3.7
Mid-Day 2.4 3
Evening 10.2 1.7
Night 1.2 1.1
Simple Average 5.1 2.4
While the 2008 study had predicted that wind would cause a very small increase in operating reserve
needs, the actual impact ended up being even smaller. The following graphs from the ERCOT report show
38
See the library of studies available at http://variablegen.org/resources/#!/3700/u-s-regional-and-state-studies.
39
http://www.nrel.gov/analysis/re_futures/.
40
Available at http://www.nepower.org/Wind_Study/final_report.pdf
41
http://www.pjm.com/~/media/committees-groups/committees/mic/20140303/20140303-pjm-pris-final-project-
review.ashx, page 12
42
https://www.edockets.state.mn.us/EFiling/edockets/searchDocuments.do?method=showPoup&documentId=%7bD60
7FB96-F80C-49EE-A719-39C411D5D7C3%7d&documentTitle=201411-104466-01.
43
http://www.iea.org/Textbase/npsum/GIVAR2014sum.pdf
44
http://www.nrel.gov/docs/fy11osti/47078.pdf, http://www.nrel.gov/electricity/transmission/western_wind.html.
45
http://www.ercot.com/content/meetings/qmwg/keydocs/2013/1007/GEStudyAnalysis_ERCOTInternalReport.pdf
American Wind Energy Association I www.awea.orgthat the regulation reserve need (y-axis) only marginally increases as the amount of wind increases (x-axis),
as most reserves are needed for non-wind variability, even at very high wind penetrations of 15,000 MW.
Increase in ERCOT operating reserve needs as a function of wind capacity
Returning to the question of how high can wind penetration levels go, that is ultimately a question of
economics, not reliability. As the use of renewable energy increases, grid operators will simply increase
operating reserve levels to ensure that reliability will be maintained at current levels to meet reliability
standards. Though as explained above, the incremental cost of these operating reserves is incredibly small,
and actually smaller than the integration cost for conventional generation. Moreover, as discussed in the
answer to Question 10 below, cost-effective grid operating reforms can provide large amounts of
additional flexibility that will enable even higher levels of renewable use.
Grid operating challenges could emerge at very high levels of renewable use, beyond the levels examined
in all wind integration studies to date. However, it should be noted that challenges experienced as a
power system approaches 100% wind energy have little bearing on the path forward for U.S. grid
operators today. Criticizing the challenges in approaching 100% wind energy is an attack on a strawman
argument, as no rational voice would call for 100% of electricity supply to be provided by any single
energy source, whether it be renewable, coal, gas, nuclear, or anything else.
It is likely that grid operating reforms and holding higher levels of operating reserves could address the
challenges associated with extremely high levels of renewable use. The U.S. generation mix is currently
evolving towards more flexible resources, which will help address many of those challenges as well. By the
American Wind Energy Association I www.awea.orgtime those renewable levels are reached in the U.S., there will likely also have been technological advances
in areas such as demand response, energy storage, plug-in vehicles, and even unforeseeable areas that will
likely help address these challenges.
It is worth noting that ten years ago, some utilities and grid operators were concerned about the reliability
impacts of reaching 5% wind. With greater operational experience and improvements in areas like wind
energy forecasting, those concerns have been addressed. This provides reason to be optimistic that
improvements in grid operating practices and other areas will continue to make the integration of wind
energy even easier.
American Wind Energy Association I www.awea.org5. Don’t grid operators need to add backup to integrate
wind?
No. One of main reasons grid operators built an integrated power system is so that all power plants can
back up all other power plants. As explained under Question 2 above, the variability and uncertainty that
affect all sources of electricity supply and demand are largely canceled out by other sources of variability
and uncertainty. As a result, having a dedicated backup source for each source of variability would be
highly inefficient and counterproductive, as counteracting that resource’s variability would often increase
total power system variability. As an analogy, it would be highly inefficient and counterproductive to have
a dedicated resource accommodating fluctuations in the electricity demand at your house, as nearly all of
those changes are canceled out anyway by other changes on the aggregate grid. 46
Moreover, any total power system variability and uncertainty is most efficiently accommodated by the
large pool of flexible resources available on the power system. Like any generation resource, wind works
best as part of a mix of other resources on the power system. As explained above, a major challenge and
expense faced by grid operators is how to keep the lights on when individual power plants break down, as
all power plants do from time to time. The challenge is particularly great for failures at large fossil and
nuclear power plants, which because of their size can take offline in a fraction of a second enough
electricity to supply a large city.
Over the last century, power grid operators have perfected tools for combining hundreds of power plants
that are each individually unreliable into a power system that is very reliable. By using most power plants
to “back up” all other power plants, grid operators ensure that the lights stay on when even the largest
power plant on the grid breaks down. This process works so well that most people are not aware that it
occurs, even though the expense of maintaining that backup 24/7 for the unpredictable failure of
conventional power plants is quite large, as explained under Question 3 above.
Grid operators typically make a distinction between operating reserves, which were addressed in this
answer and the answers above, and “planning reserves,” which will be discussed in more detail in the
following answer. The primary distinction is that grid operators think about planning reserves on a years-
ahead basis when they are deciding what power plants to build, while they think about operating reserves
on a day-ahead to real-time basis when they are deciding what power plants to operate. Planning reserves
are essentially the cushion of extra power plant capacity that grid operators build so that they will have
enough power plants even if some of those power plants are not available on a particular day. For both
operating reserves and planning reserves, the answer is that wind can be reliably added at low cost, as the
power plant capacity and flexibility that is needed already exists on the power system.
46
Discussion of pairing dedicated storage or a dedicated “backup” power plant with a particular resource, or
combining several resources to create a virtual power plant or a microgrid, often falls into that trap. The power system
was built to realize the diversity benefits of having all resources backed up by all other resources and all sources of
variability canceling each other out, so dis-aggregating the grid would be a step backwards.
American Wind Energy Association I www.awea.org6. What happens when the wind doesn’t blow?
Other plants provide energy at those times, in the same way that all power plants back up all other power
plants. Portfolio diversity is the key, as no resource is available 100% of the time and all power plants are
dependent on all others to back them up. Grid operators build more than enough power plant capacity to
meet electricity demand, so that a “reserve margin,” or cushion is available in case some power plants are
not available.
Adding wind power never increases the need for power plants, but rather reduces it. No new capacity is
needed to integrate wind, as wind’s contribution to meeting system capacity needs is always positive. 47 A
power system’s capacity need is a total system need driven by peak demand, so that total need does not
change based on the amount of wind power on the system.
Wind does make valuable contributions to meeting the power system’s need for capacity. Because of the
geographic diversity described in the answer to Question 2 above, a region’s aggregated wind energy
fleet produces power almost all of the time, particularly when diverse wind resources are aggregated over
a very large area. In some regions, such as coastal areas and some mountain passes, wind output is
typically highest when electricity demand is highest. Moreover, as described in more detail below, wind
energy is a critical part of creating a more diverse energy mix to protect against the type of “common
mode” simultaneous failure that can affect any type of generation, often in unforeseen ways.
Regardless of a region’s wind energy output profile, grid operators plan for the capacity value provided by
wind like any other resource, and by using the same statistical tools. 48 These tools account for each
resource’s contribution to the need for on-peak capacity and ensure there is sufficient cushion based on
the expected availability of each resource. Wind energy is typically readily incorporated into that
calculation.
This calculation accounts for the fact that no power plant is perfectly controllable, and in fact many
resources also fail to produce their maximum capacity when electricity prices are highest. Most thermal
power plants experience significant de-rates in their efficiency and maximum output when ambient air
temperatures are high, which typically coincides with the time periods when electricity demand and prices
are at their highest. DOE data show that the U.S.’s gas, oil, coal, and nuclear fleets have “summer
capacities” that are 87%, 89%, 92%, and 95% respectively of their nameplate capacities. In addition, all
power plants occasionally experience forced outages that unexpectedly take them offline, and these
outages tend to happen with higher frequency during weather extremes that drive high electricity
demand. As discussed below, a prime example is the unexpected failure of more than 20% of PJM’s
conventional power plants during extreme cold and electricity demand in January 2014. 49
As explained in the next section, grid operators only need a certain amount of flexibility to operate the
power system, so it is not necessary for all resources to be operated in a “dispatchable” manner so that
their output can be changed to accommodate changes in electricity supply and demand. Wind plants can
be operated dispatchably if necessary, but it is not typically economic to do so as other resources can
provide that dispatchability at lower cost. This situation is very similar to that of “baseload” conventional
resources: because both types of resources can provide low cost energy, it typically does not make
economic sense for them to forgo energy production so they can provide flexibility.
47
See page 2 at http://www.nrel.gov/docs/fy11osti/51860.pdf
48
http://www.nrel.gov/docs/fy08osti/43433.pdf
49
http://www.pjm.com/~/media/documents/reports/20140509-analysis-of-operational-events-and-market-impacts-
during-the-jan-2014-cold-weather-events.ashx
American Wind Energy Association I www.awea.orgIt should also be noted that most U.S. power systems currently have a surplus of capacity. For those that
do not, additional capacity can be obtained at relatively low cost through demand response and energy
efficiency, the 45+ GWs of new gas generation that is already being built, 50 or even retaining some
existing generating capacity. Retaining capacity is often an attractive option, as doing so only incurs a
plant’s ongoing fixed costs and does not significantly affect emissions because emissions are a product of
energy production, not maintaining capacity.
Energy costs are a far larger component of consumers’ electric bills than capacity costs. The value
recovered in PJM’s separate capacity market is only about 1/6 of the total value recovered in the energy
market. 51 This is confirmed by comparing the very large total production cost of the power system, which
is largely composed of fuel costs, versus the far smaller annualized capital cost of total power plant
capacity levelized over the very long lifetime of those assets.
Given recent events in which many conventional power plants of the same type experienced unexpected
simultaneous “common mode” failures, portfolio diversity is also becoming an increasingly important
consideration. Wind energy provides significant value by diversifying our electricity mix to makie it more
reliable.
The portfolio diversity benefits of wind energy were particularly pronounced last winter as unexpected
generator failures and fuel price spikes caused electricity prices to soar as many regions faced record
winter demand. Wind energy continued to produce at or above expectations with no exposure to fuel
price increases. The consumer savings from stably-priced wind generation totaled at least $1 billion over
two days in PJM alone, and wind helped to avert potentially severe reliability problems. 52 During another
cold snap in early January 2015, wind energy similarly provided record amounts of power to grid operators
in the Central and Eastern U.S. as they faced high demand due to extreme cold. 53 These events illustrate
how wind plays a critical role in protecting consumers and reliability by diversifying our energy mix:
• Early on January 6, 2014, the Nebraska Public Power District met record winter electricity
demand with wind providing about 13% of its electricity. The utility explained that “Nebraskans
benefit from NPPD’s diverse portfolio of generating resources. Using a combination of fuels
means we deliver electricity using the lowest cost resources while maintaining high reliability for
our customers.” The utility also noted that “NPPD did not operate its natural gas generation
because the fuel costs were up more than 300 percent over typical prices.” 54
• On January 7, 2014, wind output was very high when the New York grid operator faced record
winter demand. 55
• On January 22 and 23, 2014, PJM electricity and natural gas prices skyrocketed to 10-50 times
normal due to extreme cold. Wind output was above 3,000 MW, saving consumers millions. 56
• As “a shortage of natural gas triggered by extreme cold weather” affected California on February
6, 2014, wind energy provided the state with around 2,000 MW at the time of peak demand, with
50
www.nerc.com/pa/RAPA/ra/Reliability Assessments DL/2014LTRA_ERATTA.pdf, page 18
51
http://www.monitoringanalytics.com/reports/PJM_State_of_the_Market/2013/2013-som-pjm-volume1.pdf, page 12
52
http://awea.files.cms-plus.com/AWEA%20Cold%20Snap%20Report%20Final%20-%20January%202015.pdf
53
http://www.utilitydive.com/news/wind-generation-hits-records-mitigates-price-spikes-during-cold-snap/351057/
54
http://www.nppd.com/2014/nebraska-customers-set-time-winter-peak-nppd/
55
http://www.nyiso.com/public/webdocs/media_room/press_releases/2014/NYISO%20-
%20Frigid%20Temperatures%20from%20Polar%20Vortex%20Drive%20Record%20Winter%20Demand%20-
%2001_09_14%20-%20FINAL.pdf
56
http://www.pjm.com/markets-and-operations/ops-analysis.aspx
American Wind Energy Association I www.awea.orgwind output above 2,500 MW for most of the rest of the evening. 57 The state grid operator noted
that this wind output allowed it to avoid calling an energy emergency alert. 58
NERC recently released its Polar Vortex Review. 59 This report identified fuel deliverability issues, natural
gas pipeline outages, gas service interruptions, and frozen electricity and gas equipment as key factors for
generator unavailability during the vortex, which threatened system reliability in multiple regions. While
wind turbines did occasionally experience outages due to the cold weather, the vast majority of the
generators that failed to perform were conventional power plants.
The story was the same in February 2011, when ERCOT noted wind energy’s role in keeping the lights on
when a cold snap caused many conventional power plants to fail. 60 Notable examples of wind improving
reliability by increasing the diversity of the energy mix have also occurred in other countries. 61
The portfolio diversity benefits of renewable energy can also be seen in how wind and solar have helped
to cost-effectively maintain electric reliability during the California drought over the last year, making up 62
for the vast majority of the 1/3 decline in hydroelectric output. 63
While the drought is imposing major costs on the state’s agriculture and Californians in general, the
drought also poses challenges for electric reliability because the U.S. electricity system is so heavily
dependent on water. The California grid operator expected 1,370 MW to 1,669 MW (18-22 percent) of the
state’s 7,666 MW of hydroelectric power plants to be unavailable to provide energy to meet peak system
demands during the summer of 2014. 64 Moreover, the grid operator noted that 1,150 MW of the state’s
thermal power plants were at risk of having cooling water supply curtailments that summer.
Renewable energy is helping with this challenge in two direct ways. One of wind energy’s most overlooked
benefits is that it requires virtually no water to produce electricity, while almost all other electricity sources
evaporate tremendous amounts of water. In 2008, the nation’s thermal power plants consumed 1 to 2
trillion gallons of water. 65 By displacing generation from these conventional power plants, U.S. wind
energy currently saves around 35 billion gallons of water per year, the equivalent of 120 gallons per
person or 285 billion bottles of water. 66
In addition to directly offsetting freshwater consumption at thermal power plants, wind energy helps
combat the impacts of drought by allowing grid operators to save hydroelectric energy (in the form of
water behind dams) until they need it to meet grid reliability needs. A MWh of wind energy almost always
displaces a MWh that would have been produced by a fossil-fired power plant, though sometimes grid
operators use wind energy to store additional water behind dams where it can be used later to displace
fossil fuel generation. While a number of complex factors affect how dams use their water resources, the
abundant supply of renewable energy likely alleviated pressure on the operators’ need to use water to
57
http://www.caiso.com/Documents/ISOissuesStatewideFlexAlert.pdf
58
SNL Energy article, Christine Cordner, “CAISO: Wind, demand response helped avoid February emergency alert,”
March 21, 2014
59
Available at:
http://www.nerc.com/pa/rrm/January%202014%20Polar%20Vortex%20Review/Polar_Vortex_Review_29_Sept_2014_Fin
al.pdf
60
Available at: http://www.texastribune.org/2011/02/04/an-interview-with-the-ceo-of-the-texas-grid/
61
http://thinkprogress.org/climate/2014/08/12/3470140/wind-power-nuclear/
62
http://www.eia.gov/electricity/monthly/epm_table_grapher.cfm?t=epmt_1_14_b
63
http://www.eia.gov/electricity/monthly/epm_table_grapher.cfm?t=epmt_1_13_b
64
http://www.caiso.com/Documents/2014SummerAssessment.pdf
65
http://www.ucsusa.org/assets/documents/clean_energy/ew3/ew3-freshwater-use-by-us-power-plants.pdf
66
http://www.awea.org/windandwater
American Wind Energy Association I www.awea.orgYou can also read