Title Assessing the impact of renewable energy on local development and the Sustainable Development Goals: Insights from a small Philippine island
←
→
Page content transcription
If your browser does not render page correctly, please read the page content below
Title
Assessing the impact of renewable energy on local development and the
Sustainable Development Goals: Insights from a small Philippine island
This is a pre-print of a paper published in “Technological Forecasting and Social Change”, Volume 153, April
2020, 119919.

Author
Paul Bertheau

1 Introduction
The global community has agreed on 17 Sustainable Development Goals (SDGs) to
address various global development challenges and inequalities. The SDGs provide a
framework to include social and environmental sustainability in development processes
(Stevens & Kanie 2016). Innovative, clean and sustainable technologies are crucial
instruments for advancing towards these SDGs (Moyer & Bohl 2019). Supportive
technology policy is therefore of paramount importance to stimulate the development
and diffusion of those technologies (Liu et al. 2019). An important example is the use of
renewable energy (RE) technologies for achieving SDG #7: “Ensure access to affordable,
reliable, sustainable and modern energy for all” (United Nations 2015). Thus, many
supranational institutions and national governments promote RE for energy transition
and rural electrification to provide and improve energy access and to address increasing
energy demands in a sustainable manner (Almeshqab & Ustun 2019).
Energy access and electrification can provide opportunities for new businesses,
extended study and working hours, better health and education infrastructure and new
opportunities for community building activities (Karekezi & McDade 2013). However,
context-dependencies prevent generalizable conclusions about these interlinkages that
ultimately depend on locally specific factors. Insights from case studies reveal that the
capability to benefit from access to electricity strongly depends on the socio-economic
and socio-cultural context (Kumar 2018). It is hence necessary to assess the impact of
modern and improved energy access at the local level to derive recommendations for
policy makers and technology policy interventions (McCollum et al. 2017). The research
direction is therefore bottom-up, using case studies to derive local and regional
recommendations instead of taking a global approach and breaking it down to the
country level.
Such case studies need an interdisciplinary approach combining energy research with
social sciences based approaches (Sovacool 2014; Sovacool et al. 2015). This could be
the analysis of an energy supply system by including the consumer perspective via
qualitative interviews, quantitative surveys and case studies especially in less studied
regions like remote areas of developing countries (Sovacool 2012; Bhattacharyya & Palit
2014). Lessons learnt of such studies can serve as crucial insights for addressing the
need for access to energy in a more adequate and sustainable way in the future. In
conclusion, supporting technology policy for SDGs needs context and regional specific
research to improve evidence-based decision making.
In our paper, we address this need by investigating the impact of providing more
affordable, reliable and sustainable access to energy on consumption patterns,
appliance uptake and overall socio-economic development. We selected the local
community of Cobrador Island in the Philippines as case study. Choosing a typical small
island in this region allows to extend recommendations not only in the Philippine context
but also for Southeast Asia. Many remote islands in this region suffer from unreliable
power supply and in the Philippines, still 2.36 million households (HHs) lack access to
sustainable energy supply (IRENA 2017a). The purpose of our study is to highlight the
effects of sustainable energy supply on the local community and to address the
following research aspects to derive recommendations for policy makers:
(a) How can SDG#7 be achieved on remote islands and what are specific consumption
patterns and appliance usages to be considered?
(b) How is the achievement of SDG#7 addressing crosscutting SDG targets such as
access to information, access to education, access to health services, income
generation and other?
(c) How can the achievement of SDG#7 contribute to poverty alleviation and addressing
inequalities?
To find solutions to these questions we have developed and applied a quantitative
questionnaire and surveyed a significant share of households on the case study island.
We use descriptive statistics to explore the data and analyze relevant aspects in more
detail. Findings were compared to historical data of consumption patterns on the island
and to results of other case studies. The specific measure that addressed SDG#7 on the
case study island was the hybridization of a diesel generator with solar PV and battery
storage to provide clean and reliable electricity on a 24/7 base. The geographical,
demographic, socio-economic, infrastructural and institutional framework conditions of
our case study reflect a situation comparable to a large number of islands in the
Philippines and the Southeast Asia. Therefore, this case study analysis can serve for
deriving implications for wider RE deployment in the region.

2 Background
The background section introduces the context of this study. First, we examine the
interlinkages between energy access, SDGs and RE. Second, we highlight the energy
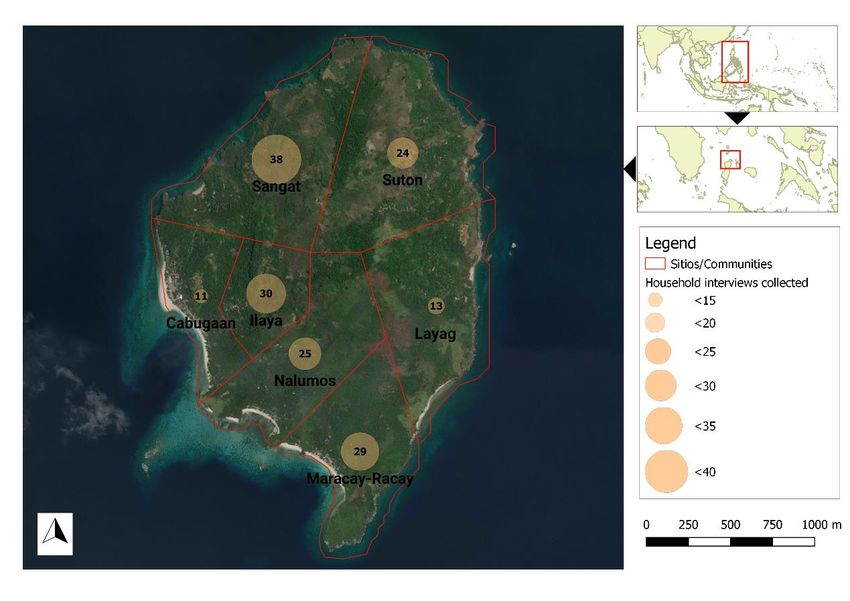
access situation in the Philippines. Finally, we introduce the background of the selected
case study.

 2.1 Global context: Energy access and the Sustainable Development Goals
The lack of access to electricity hampers human development in many regards
(Bhattacharyya 2013). For example, a lack of modern lighting in households is
considered to limit the ability to pursue not only productive activities after nightfall, but
also educational and recreational activities. Likewise, business development and the
provision of public services like health care and education are difficult (Bonan 2017).
Figure 1 provides an overview on possible linkages between SDG#7 and other SDGs.

 Figure 1: Interlinkage of SDG#7 to other SDG (own illustration).

The possible linkages of SDG #7 to the other SDGs have been studied to a large extend
already (Alloisio et al. 2017; McCollum et al. 2017; Le Blanc 2015). A strong
interconnection is often found concluding that access to modern energy services
enables the implementation of a series of other SDGs, hence significantly contributes to
sustainable development in general. Access to modern energy forms is fundamental to
human development and to support the alleviation of poverty (SDG #1) according to
Akter (2017) as well as Casillas & Kammen (2010). This energy access is also critical to
enhance agricultural yields and productivity, which can increase food security (SDG #2)
(Acheampong 2017). In terms of increased health and well-being (SDG #3), access to
modern energy services can reduce diseases caused by the emissions of traditional
biomass for cooking and of kerosene lamps (Amegah 2016). Especially women are
highly affected by indoor air pollution (Das et al. 2017). The use of refrigerators
facilitates cooling of medicine, especially of vaccines. Moreover, it allows for the cooling
of food, which on one hand results in better hygiene and on the other in new economic
opportunities by selling preserved food or ice (Palit & Chaurey 2011). Access to modern
lighting enables for studying after nightfall, and modern information and
communication technologies in schools can raise the quality of education and
information access, which contributes to SDG #4 (Collste et al. 2017). A strong impact
of improved electricity access on women’s safety and girls' school enrollment is found
and it can empower women by improving their income-earning, e.g. through time-saving
from household chores (SDG #5) (Akter 2017). Time savings for women can also be
used for productive activities and education. SDG #7 can hence have a strong positive
impact on the SDGs #5 (Gender equality), #8 (Economic growth) and #10 (Reduced
inequalities) (Burney et al. 2017). Moreover, decentralized renewable energy systems
such as solar home systems (SHS) or village-scale solar systems can enable more
participatory and inclusive processes for managing energy supply on the community-
level (Kunze & Becker 2015). Depending on the policies in place it can also help to reduce
inequalities between poorer and wealthier households (SDG #10) (Casillas & Kammen
2010). On a local as well as global scale SDG #7 is an enabling factor for the
implementation of SDG #13 on climate change mitigation and adaptation (Alloisio et al.
2017; Cherian 2015; Gambhir A et al. 2017; Riahi et al. 2016). Ensuring access to clean
and modern cooking and heating energy can also lead to less disturbance of the local
biodiversity and the ecosystems through firewood collection and thereby contribute to
SDG #15 (Life on Land) (Pagdee 2017).
Whereas the positive impact of modern energy services on a variety of other fields might
be evident, and many governments have acknowledged the importance of action in this
field, many still struggle to deploy RE technologies, especially in remote areas. In many
developing countries, complex and inadequate regulations, policies, and legal
frameworks hamper the development of new RE or electrification projects and
technologies (Blechinger 2013; Brahim 2014). Lack of financing for off-grid
entrepreneurs and affordability of clean energy for poorer households is found to be a
major challenge for the implementation of modern energy services (UNDP & ETH Zurich
2018). Furthermore, the positive relations are highly dependent on the policy
instruments in place. For example, if distributional costs of new energy policies (e.g.
supporting renewables and energy efficiency) fall disproportionately on the poor, then
this could even work against the promotion of social, economic and political equality for
all (McCollum et al. 2017).
In conclusion, the positive effects of SDG#7 on other SDGs have been widely studied
and acknowledged on a global scale. Nevertheless, country specific contexts need to be
considered when designing supporting policies. Thus, findings from interventions
targeting SDG #7 in remote areas of the Philippines are of importance for more
accurately and sustainably designing an appropriate technology policy in the future.

 2.2 Country context: Energy access in the Philippines
As an archipelago comprised of more than 7,000 islands the Philippines are a
considerably fragmented country (Boquet 2017). Continuous power supply is provided
to the most populous and economic relevant “on-grid” islands through two main electric
grids (IRENA 2017b). Isolated grids supply the “off-grid” areas, which defined as islands
or remote areas not connected to one of the two main grids. Frequent power
rationalization in off-grid areas is a consequence of high costs due to the use of diesel
generators (Roxas & Santiago 2016) and 24 hours supply is mostly not available (DoE
2016). The remaining non electrified areas (“missionary areas”) are a large number of
small islands with no power supply or informal power supply only. The objective of the
government of the Philippines is to provide access to clean and continuous energy
supply to all parts of the country for improving the living conditions. Therefore, 100%
electrification of all households by 2022 was set as target within the Philippine Energy
Plan (PEP) (DOE 2015). Nevertheless, the share of electrified households was only at
89.6% in 2016, reflecting 2.36 million households without electricity supply and many
other with only basic and limited energy supply (IRENA 2017a). The Philippine
Renewable Energy Act (RE Act), inaugurated in 2008 (RA9513 2008), serves as
technology policy instrument for stimulating the deployment of RE technologies in the
country (Roxas & Santiago 2016). High expectation arose as a large number of fiscal
and non-fiscal incentives was implemented under it (Rosellon 2017), with specific
schemes envisioned to facilitate rural electrification through private sector participation.
However, a study on the risks and uncertainties of RE implementation on the Philippines,
(Bertheau et al. 2019) indicates that the lack of clear implementation for these policies
hinder them from successfully supporting the energy transition in remote islands.
Numerous attempts for RE based electrification in the framework of international
development cooperation were undertaken in the Philippines. Early initiatives focused
on deploying SHS (Heruela 1992), followed by hybrid energy systems comprised of solar
PV, batteries and diesel generators for back-up power supply (Hong & Abe 2012).
Although many donor based RE projects have been conducted by USAID, GIZ, UNDP and
others (Marquardt 2015), little information on their evaluation can be found. Several
studies (Hong & Abe 2012; Marquardt 2015; Yaqoot et al. 2016) indicate that most of
the donor-based projects proved unsustainable due to weak local capacities for proper
operation and maintenance of the systems which then led to low acceptance towards
new technologies among the population. In summary, the Philippines are a renewable
resource rich country which currently fails in exploiting its full potential to achieve
SDG#7. More locally adapted interventions are necessary to facilitated the
implementation of RE technologies on remote islands and provide access to energy.

 2.3 Case study context: Cobrador Island Solar – Diesel Project
Cobrador Island forms a single barangay1 as part of the province of Romblon, located
centrally in the Philippines. The island is small with an area of 2.6 km² comprised by a
small beach stripe and mainly hilly terrains. It is home to approximately 1,000 people
living in about 250 households scattered over seven sitios 2. The island has a barangay
hall (town hall), health station, a primary school and kindergarten and the main source
of income is fishing. With these typical characteristics, Cobrador island is representative
for a large number of small islands in the Philippines and the region (Meschede 2018).
Some households of the island were initially electrified in 1997 by means of solar-home-
systems within a governmental electrification program. In 2010, the local electric
cooperative (EC), installed a diesel generator of 15 kW capacity to address an increasing

1
 Smallest administrative unit in the Philippines
2
 Part of a barangay
demand. However, due to high fuel costs electricity was provided for eight hours per day
and due to difficult terrain to 138 HHs only. This situation changed with the inauguration
of the Cobrador Island Solar – Diesel Project in August 2016, which facilitated 24 hour
electricity supply. The new hybrid system consists of a solar capacity of 30 kW, battery
(lithium-ion) capacity of 180 kWh and a diesel back-up generator of 15 kW. As a result it
improved the reliability of supply (24 h), affordability (50% electricity price reduction) and
environmental soundness (renewable energy share of up to 92% per day). In the first
year of operation the bulk of required electricity was supplied by the solar plant with 32.7
MWh and 10.6 MWh were supplemented by the diesel generator. This reflects an
average RE share of 75%. Solar PV and battery storage was selected as appropriate RE
technology given its matureness and ease of installation. Other RE technology options
were not considered given the unfeasibility of installation (wind power) or uncertain fuel
supply (biomass). The intervention was realized through international collaboration in
the framework of the Asian Development Bank’s Energy for all (E4ALL) initiative which
aims at contributing to SDG#7 through various activities. The project included technical
and financial cooperation for the Romblon Electric Cooperative (ROMELCO) from the
Asian Development Bank (ADB), Korea Energy Agency (KEA) and the National
Electrification Administration (NEA) of the Philippines. The overall costs summed up to
approx. 500 thousand USD split between KEA (300,000 USD grant fund), ADB (100,000
USD grant fund) and NEA (100,000 USD loan fund). ROMELCO contributed with
workforce, constructed the powerhouse and purchased the necessary land. The
outlined case study presents an example for the deployment of an innovative and
sustainable energy solution through technology policy. The specific conditions of the
island are comparable to a large number of islands in the Philippines and in the region.
Given the remoteness of the island, external influences are low and clear system
boundaries are defined. This makes the island a suitable research subject to understand
the socio-economic implications of an intervention targeting SDG #7 with a focus on
electrification through RE.

3 Material and methods
Our study mainly relies on primary data from Cobrador Island. The primary data
collection builds upon a household survey since this allows for assessing the impact of
an improved and RE-based energy supply on the household level. By covering other
characteristics of the studied HHs such as socio-economic data it is possible to study
coherences and derive key findings. Surveys are a cornerstone of empirical research in
the field of social science based energy research (Sovacool et al. 2018) and are
combined with literature analysis and data on historical energy consumption for this
study. The material and methods section describes the development of the applied
household questionnaire, the preparation of the field survey, the implementation of the
field survey and the limitations faced during the data collection.
3.1 Questionnaire design
We developed the applied questionnaire in an iterative approach to assure its
appropriateness and applicability (Preston 2009). Specific challenges can occur when
conducting questionnaire surveys in remote and marginalized communities of
developing countries, such as low educational level of respondents, cultural traditions,
gender roles, local languages (UN-DESA 2005). To address these challenges, Philippine
experts (scholars from University of the Philippines-Diliman), familiar with the case
study region, were involved in the questionnaire design from an early stage on.
Additionally, we analyzed relevant literature and questionnaires applied for addressing
similar research questions, e.g. (Hong & Abe 2012; Sullivan & Barnes 2006; Sovacool et
al. 2018).
The iterative development and design process included the following steps: (1) Design
of first questionnaire draft based on literature analysis. (2) Feedback round with
Philippine and international experts. (3) Design of second questionnaire draft based on
feedback. (4) Double blind translation of questionnaire from English to Tagalog and
Tagalog to English. (5) Design of third questionnaire draft based on issues revealed
during translation. (6) Pretesting of questionnaire, workshop and training with group of
enumerators. (7) Creation of fourth questionnaire draft based on feedback from
pretesting and workshop. During the field survey, the team conducted daily meetings for
feedback and necessary adaption of the research design. Figure 2 illustrates the
approach applied for developing and designing the questionnaire.

 Figure 2: Approach for questionnaire design (own illustration).

The finally applied questionnaire is comprised of four sections with 58 main questions,
and additional follow-up and sub-questions. Most questions are closed-ended but few
are open-ended questions to account for not anticipated responses (Sullivan & Barnes
2006). Answering the questionnaire took approximately one hour during pretesting and
during the field survey. Table 1 presents and describes the four main sections of the
questionnaire.
Table 1: Questionnaire structure.

 Section I II III IV
 General socio- Subjective
 Topic Electricity demand
 economic information perceptions of Challenges
 area and usage
 of the households changes
 Electricity bill,
 Household size, willingness to pay,
 Impact of electricity State major challenges
 adults/children, age, appliances (what, how
 access on health, for the household and
 Questions education status, main many, since when,
 security, education, the island within the
 income sources and how often used),
 safety and income next two years
 expenditures activities with
 electricity
Setting basic socio- This data allows for Enables an
 demographic context an understanding understanding of the
 Enables a detailed
 and providing key whether residents major concerns of the
 Rationale understanding of the
 information for perceive an impact of residents and if they
 usage of electricity
 interpreting the survey electricity on their are related to
 results daily life electricity access.

 3.2 Survey design
We applied a stratified random sampling technique for the selection of respondents to
make sure that all households, within the predefined household classes, have the same
probability of consideration. Data on monthly electricity consumption, of all households
of the case study island, served as stratification variable. Data was classified by means
of the Jenks optimization method for minimizing the deviation from the average within
a class and for maximizing the deviation to the average of other classes (Jenks 1967).
We applied four classes since it provides an acceptable goodness of variance fit (GVF)
value with 0.92. Table 2 presents the derived classes based on the electricity
consumption of households.
Table 2: Questionnaire structure.

 Class Lower boundary Upper boundary Count Considered in sample
 (kWh/month) (kWh/month)
 1 5 195 164 108
 2 210 607.5 55 36
 3 742.5 1,567.5 14 9
 4 1,942.5 3,217.5 6 4
 GVF 0.92

We determined a statistically representative sample of at least 158 HHs questionnaires
based on a population of 239 households, a 95% confidence interval, and 5% margin of
error and non-response factor (Barlett et al. 2001). According to the share of the total
population of each class, it was then determined how many households of each class
had to be interviewed (Table 2). For each class the proportionate amount of
respondents was randomly selected for the final sample. On site, the enumerators
approached only the randomly derived households through asking the villagers for
directions. For anonymization reasons, a code was assigned to each household in the
questionnaire. In case that the assigned household was not available for an interview
for any reason (e.g. declined to respond, absence, only underage household members
available), the enumerator selected the next household of the same class from a
randomly comprised list. Finally, it was possible to interview 170 HHs, considered as
sufficient to expect a sampling error close +/- 5% at a 95% confidence interval for the
given population (Sovacool et al. 2018).

 3.3 Household questionnaire survey
The author and a team of five enumerators, all volunteers and students from the
University of the Philippines – Diliman, conducted the field survey. The team of
enumerators took most of the questionnaires due to their proficiency in Tagalog and the
local dialect (mix of Tagalog and Cebuano). Prior to the survey the local government
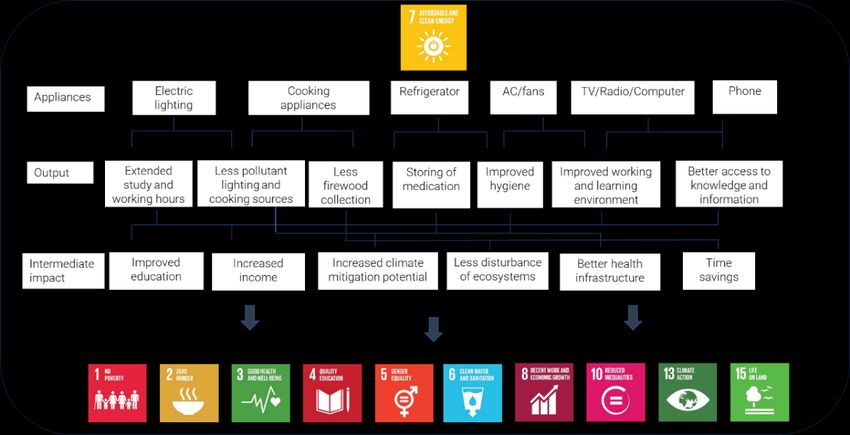
unit, electric cooperative, barangay captain (community unit) and local leaders, as well
as interested inhabitants were invited to a stakeholder meeting informing about content
and purpose of the study, and assuring confidentiality of responses in order to meet the
ethical standards of cross-cultural studies. The questionnaire were digitized and each
enumerator was provided with a tablet applying KoBoToolbox© which is a free open
source tool for mobile data collection. The tablet approach was selected to minimize
survey costs and material use (Leisher 2014). Before starting with the questionnaire,
each enumerator explained about purpose, content and length of the questionnaire
explicitly highlighting that the respondent can decline to respond to the questionnaire.
The household head was addressed for the interview; in case of absence another full-
aged household member was asked to respond to the questionnaire. Finally, 170
questionnaires were conducted (Figure 3).

Figure 3: Overview map for case study area and questionnaires conducted per sitio/community (own
illustration).

 3.4 Statistical data analysis
In order to derive statistically valid conclusions based on the collected primary data, a
range of tools and methods can be applied. Here, collected data was compiled into a
single dataset and prepared for further processing. The statistical data analysis was
carried out with the software SPSS©3. Minor data cleaning and the definition of variable
types was necessary before statistical analysis were applied. Descriptive statistics
served to gain a comprehensive overview of the current socio-economic situation as

3
 IBM SPSS Statistics 25
well as the general usage of electricity on the case study island. Frequency distributions,
cross tables, and mean/median values were used to describe the collected data. In order
to analyze the data with regard to differences between poor and wealthy households,
income groups were separated by the mean income per month. Households whose
income was above the mean were classified as “above-average income households”,
households with an average monthly income below the mean were grouped as “below-
average income households”. On the basis of this classification, several hypotheses
were tested by means of chi-square test, t-test and Mann-Whitney-U test based on the
variable type and data characteristics focused on.

 3.5 Limitations
Only a few households declined to respond to the questionnaire. In contrast to that, the
arrival of the enumerator team were attracting a significant share of people of the visited
communities. Thus, it was sometimes challenging to keep the privacy of interviews and
it was necessary to request neighbors and passers-by to not disturb the interview.
Additionally, neighbors of interviewed households offered or requested to hold an
interview with them and it was necessary to explain that respondents are selected
randomly. Another limitation from the approach is a bias in responses for several
reasons: Although the enumerators were comprehensively trained in conducting the
interviews, a bias based on the enumerator cannot be entirely ruled out. Another
limitation could be the bias in responses of the interviews. Although enumerators made
clear that, they are not representing a governmental unit or the electric cooperative
respondents may have responded according to what they perceived as the favored
answer. No disaggregated baseline data on the aspects analyzed are available for the
case study. The impacts assessed here might thus not represent long lasting
developments. An attempt was made to reconstruct the pre-electrification state and
examine the changes by including respective questions in the household survey. For all
quantitative data gathered in the household survey, e.g. monetary data about incomes
and expenses, uncertainty regarding the reliability and accuracy must be taken into
consideration. For most of the information no exact accounts are held by the
households and statements are mostly based on respondent’s estimates.

4 Results
In the results section we present the main findings from the household survey. We
highlight socio-economic characteristics, electricity consumption patterns, electric
appliances inventories and perceived changes of the hybrid system implementation for
the surveyed households. We put a specific emphasize on differences between below
and above-average income households to study the effect of sustainable energy supply
on inequality and poverty alleviation.

 4.1 Socio-economic characteristics of households
We interviewed 170 out of approximately 250 households for the survey.
Table 3 summarizes key characteristics of the households. The average age of
respondents is 46.7 years and most are married (57%). On average, 3.6 persons live in
one household which is below the national average of 4.4 persons (PSA 2017). With the
170 households a population of more than 602 individuals (39% younger than 18) is
represented.

Table 3: Respondent and household characteristics

 M or % SD Min Max N
 Yes 59.4 101
 HH head No 38.8 66
 N/A 1.8 3
 Male 34.1 58
 Gender Female 64.7 110
 N/A 1.2 2
 Age 46.7 15.76 18 84 170
 HH size 3.6 1.73 1 10 170
 Male 1.9 1.11 0 5 170
 Female 1.7 1.17 0 7 170
 Children (
Figure 5: Highest education degree for female
 2,7 respondents in % (n=110).
 15,5

 6,4
 51,8

 23,6

 Primary school Secondary school
 College/University No degree
 Other

Income

The survey responses reveal that a large share of 33.5% of households is poor
(monetary wise) with a weekly income lower than 500 PHP (9.6 USD)4 compared to the
World Bank’s extreme poverty line of 1.9 USD/day (Warwick et al. 2018) (see Table 4).
Most HHs have intermittent incomes and a weekly analysis reveals a strong impact: A
week with a lower than average income increases the share of HHs with a very small
income by + 30.5% to 64%. In contrast, a week with a higher than average income
reduces the share of HHs with a very small income only by 10.8%. The observed
intermittency is due to the dependency on fish catches and selling as main income
source of most HHs.
Table 4: Income classes of surveyed households.

 Average weekly income High income week Low income week
 Percent Frequency Percent Frequency Percent Frequency
income HHs (N = 43) and HHs with monthly income lower than 10,485 PHP as below-
average income HHs (N = 121). Mean HHs expenditures per month are 6,045 PHP (~116
USD) (median of 4,531 PHP) per month with a standard deviation of 5,748 PHP. The
high standard deviation for both income and expenditures reflects the large
heterogeneity among the households.
Figure 6 shows main sources of income and Figure 7 shows main purposes for
expenditures for the surveyed HH. Many households have diversified their income
sources and it is common that both, men and women participate in income generating
activities with women often additionally taking care of the household chores. The main
income source is fishing (47.7%). Followed by home business activities (17.6%), for
which 21% of the households use electricity. The most common home business type is
a small shop (sari-sari store), where foods, drinks and miscellaneous things are sold.
Other home business types are boat manufacturing and boat renting, mat weaving,
copra drying and occasional street food selling. Government employment (11.5%) is a
secure income source with a fixed monthly salary. Other income sources (10.1%)
include non-home businesses such as charcoal production and selling, carpentry,
construction and some support from government programs. More than 43% of the HH
receive remittances from relatives that live either abroad or in Manila which contribute
to overall income by 5.8%. Even though marble processing is one of the main income
sources in Romblon province, on Cobrador island only 3% of the income is generated by
it. Farming mostly serves as means for self-subsistence rather than as a monetary
income source. Services make up a minor share of income. There are no significant
differences in income sources between income classes.

 2,7% 1,7%
 3,0% 1,5% 6,3%
 5,8%
 7,6%

 10,1%
 9,7%
 47,7%
 11,5% 59,9%
 14,7%

 17,6%

 Fish Home business
 Food Education
 Government Other
 Remittances Marble Domestic needs Transport
 Farming Services Electricity Other

Figure 6: Monthly income sources of surveyed Figure 7: Monthly expenditure purposes of
households (n=170). surveyed households (n=170).

The major share of the HH income is spent for food (59.9%). Households with
schoolchildren spend a significant share of their income on education, with an overall
expenditure of 14.7%. This high expenditure is due to the absence of a secondary school
on the island. Older children have to visit secondary school on Romblon Island, where
they stay during the week in paid accommodation. Domestic needs comprise drinkable
water, medicines, toiletries and baby foods (9.7%). Transportation expenditures are
relatively high due to the remoteness of the island (7.6%). Electricity is a minor share of
expenditures (6.3%) and other expenditures are spend for leisure activities such as
liquor, cigarettes and gambling. Similar expenditure patterns have been reported for
other regions of the Philippines (Agbola et al. 2017). A higher share of below-average
income HH (44.3%) spend more than 75% of their total expenditures for food compared
to above-average income HH (21.4%), a significant difference was identified through
means of chi-square test ( 2 (3) = 14.49, = .002, = .304, = 157). Besides that no
other significant differences in expenditure patterns between income groups were
identified. However, chi-square test revealed that a significant higher share of above-
average income households (72.1%) can tap savings for daily expenditures or
investments than below-average income HHs (48.8%), by applying chi-square test
( 2 (1) = 6.97, = .008, = .206, = 164).

 4.2 Electricity consumption patterns
Almost all HHs use electricity from the hybrid energy system as primary source of
electricity as 97.7% of respondents stated to have access to electricity via the
distribution grid. Other devices such as automotive batteries (7% of HHs), SHS (12% of
HHs) and small diesel gensets (2% of HHs) are applied by few HHs and rather
occasionally as a back-up source.
Electricity consumption

Prior to the implementation, a steep growth in electricity demand was expected once
the electric service was made available 24 hours per day. Electricity for refrigeration and
ice-making were among the identified uses e.g. in support of the island’s fishing sector.
Figure 8 shows the annual energy sales development. Energy sales increased from 2015
to 2016 through the implementation of the hybrid energy system which included the
connection of additional HHs and the provision of 24 hours supply. Energy sales further
increased through appliance uptake from 2016 to 2017 and averaged at a daily demand
of 142 kWh/d. Figure 9 highlights the growth of the maximal peak demand on a daily
basis. Compared to 2016 the maximal peak demand for 2017 and 2018 increased
significantly during early afternoon and in the evening hours. The maximal daily energy
demand observed for 2017 and 2018 exceed the average demand by far with 270 kWh
(2017) and 279 kWh (2018). Such extreme demands exceed the capacity limits of the
implemented system. We can conclude that the provision of 24 supply increased
electricity consumption and that large differences in mean and maximal daily demands
occur.
60 25
 51,2
 Energy sales (MWh)

 50 20
 39,8

 Demand (kW)
 40
 15
 30
 10
 20
 11,6
 5
 10

 0 0
 2015 2016 2017 1 3 5 7 9 11 13 15 17 19 21 23

 Year Hours
 2015 2016 2017 2018

Figure 8: Annual energy sales growth from 2015 - Figure 9: Annual maximal peak demand growth
2017 (MWh). from 2015 - 2018 (kW).

HHs were asked for their monthly electricity expenditures, responses were converted
into monthly electricity consumption based on the uniform tariff of 15 PHP/kWh. Table
5 gives the monthly electricity consumption for the two income groups.
Table 5. Distribution electricity consumption within below-average, above-average income groups, and total

 Electricity consumption
 Income group
 < 6 kWh < 30 kWh < 60 kWh >60 kWh N
 Below-average 33.6% 60.2% 4.4% 1.8% 113
 Above-average 4.8% 61.9% 19.0% 14.3% 42
 Total 25.8% 60.6% 8.4% 5.2% 155

The majority of HHs have a relatively small monthly consumption of up to 33.3 kWh.
According to the Multi-Tier Framework (MTF) for Measuring Energy Access (MTF) most
of the HH can be classified into Tier 2 and Tier 3 (Bhatia & Angelou 2015). The cross
table indicates a clear difference between income groups since a high share of below-
average HHs (33.6%) uses only very little electricity per month. Chi-square test reveals
a significance with medium effect size, ( 2 (3) = 27.0, = .000, = .417, = 155).
Electricity usage

Electricity is not intensively used for income related work and household chores as
shown in Table 6. The prevailing income related activities are conducted mainly during
daytime and do often not require electricity. However, a high share of children (51.4%)
study after sunset and require electricity (98.6%) to do so. HHs of different income
classes significantly differ in their statement towards household chores after sunsets,
by means chi-square test ( 2 (1) = 5.59, = .018, = .185, = 164). Above-average
income HH commonly employ domestic helpers (e.g. maids), which can explain the
difference.
Table 6: Electricity usage after sunset.

 If yes, is electricity
 No Yes required? N
 Do household members do income-related work after
 sunset? 69.5% 30.5% 76.0% 164
 Do household members do household chores after
 sunset? 65.9% 34.1% 94.6% 164
 Do children of the household study after sunset? 48.6% 51.4% 98.6% 144
For a further understanding of the income’s group capabilities to use electricity for
income generation we explore for coherences between income groups, income
generation through an own business (taking place at the HH – e.g. shop, handicraft,
e.g.), and if electricity is required for such activity. Table 7 provides an overview on
observed cell frequencies and expected cell frequencies.
Table 7: Cross table highlighting the income group’s home business activities.

 I: Do you generate II: Do you use III: Since when do you run the own
 income through an electricity in your business?
 own business in your household for income
 household? generation purposes?
 No Yes No Yes After 24 Bef. 24 h No
 supply supply answer
 Below- Count 92 29 98 20 6 12 2
 average Expected 86.1 34.9 91.6 26.4 8.9 16.2 1.5
 Above- Count 24 18 27 16 6 10 0
 average Expected 29.9 12.1 33.4 9.6 3.1 5.8 0.5
 Total 116 47 125 36 12 22 2

The differences between observed cell frequencies and expected cell frequencies
indicate a possible coherence between income group and the three presented items. To
prove the significance of the coherence we apply chi-square test for the item I and II
(presented in Table 7) since the expected cell frequencies are met (0.0% < 5). The results
show that income group significantly affects the likelihood of income-generation
through an own (home) business, with 2 (1) = 5.42, = .02, = .0182 (medium effect
size). Above-average income groups are more likely using electricity for income
generation in their HH, with 2 (1) = 7.45, = .006, = .215 (medium effect size).
Additionally, the results show for item III that HHs with above average income already
operated more businesses before 24 hours supply and were able to set up more
businesses, although no chi-square test was possible due to insufficient cell values.
Tariff and willingness to pay

Most HHs approve (59.4%) the current electricity price (15 PHP/kWh). A certain
dissatisfaction originates from many villager’s knowledge that the electricity price of the
neighboring larger island is half the price of their electricity costs. Wealthier HH are less
satisfied with the electricity price and occasionally demanded for an adjustment of the
price to neighboring islands during the interviews (Figure 10), we reveal a significant
difference between income groups by applying Fisher’s exact test (=11.1, = .017, =
.280, = 157). Respondents stated that they spent more (20%) and even a lot more
(15.3%) money for electricity before the hybrid system intervention. Contrasted by 24.1%
stating that they spent approximately the same amount for electricity or even less.
Figure 11 shows differences between below- and above-average income groups: A
higher share of wealthier HHs states to spend less money since the hybrid system
intervention. Nevertheless, by applying chi-square test no significant difference was
detected, although the p-value is close to the significance threshold value, ( 2 (4) =
9.19, = .056, = .255, = 141).
75% 63,8% 40% 34,0%

 43,9% 28,0%29,3% 26,8%
 29,3%
 50% 23,0%
 34,1%
 21,6% 20%
 25% 14,6% 14,6% 13,0%
 8,6% 4,9%
 2,6% 3,4% 2,4%
 0% 2,0%
 Strongly Disagree Neither Agree Strongly 0,0%
 disagree agree nor agree 0%
 disagree A lot less Less The same More A lot more

 Below-average income HH Above-average income HH Below-average income HH Above-average income HH

Figure 10: HH responses for: “The price for Figure 11: HH responses for: “Did the HH pay more
electricity that we are currently paying is just fine”. or less for electricity before the installation of the
 solar plant?

When asked if respondents would pay a higher price for electricity the slight majority
agreed to be willing to pay double the price (54.4%), which quickly decreases to
overwhelming disagreement when asked for triple or quadruple the price (Figure 12).
Whereas respondents state that they can simply not afford 3 times or 4 times the
electricity price, they would rather spend their income on other things when refusing to
pay double the price. No correlation between income and willingness to pay for
electricity supply was identified. The main problems with the electricity supply stated
are power outages, damaged appliances through outages and high costs. Most of the
HH need electricity during evening hours when light is required or for gathering at home
for jointly watching TV (Figure 13). Both income groups show similar patterns when
asked to for the most important period of the day where they need electricity.

 75,3
 80 70,4 80%
 70,2%
 70
 60 54,4
 45,6 60%
 50
 40 29,6
 24,7
 30
 40%
 20
 10
 0 20%
 9,3% 9,9%
 Double price Triple price Quadruple price 5,3%
 2,6%
 0,7% 2,0%
 0%
 No Yes 0-6 am 6-9 am 9-12 am 12-3 pm 3-6 pm 6-9 pm 9-12 pm

Figure 12: Willingness to pay higher electricity Figure 13: Need for electricity during the day.
costs.

Overall, our results indicate that electricity is primarily used for entertainment and
information gathering compared to income generation, whereas the availability of
constant lighting allows for increased study hours for children. Nevertheless, the direct
impact on the HHs depends on consumption of electricity and electric appliance
inventory. Here we find that wealthier HHs consume considerably more electricity and
at the same time profit more from the reduced electricity prices. Paradoxically, wealthier
HH are less content with the applied electricity charge and both groups do not differ in
their willingness to pay more for electricity. Besides the household level the hybrid
renewable energy system improved access to health and education since the
elementary school now provides computer classes (mandatory for the students of
grades four to six) and the services of the health center have improved through
continuous access to electricity and new devices, which leads to more security and
possibilities for curing and treating diseases. Since both school and health center are
community entities these outcomes are accessible to all households. Additionally, the
higher reliability of electricity supply allows replacing some rather health-affecting
appliances such as kerosene lamps, and more sensitive electric appliances, e.g. for
entertainment, such as sound systems or multimedia devices, can be powered with a
reduced risk of damage through power outages. For lighting purposes, a larger variety
of sources besides electricity is used, e.g. candles (17% of HH), kerosene lamps (18% of
HH) and rechargeable flashlights (70% of HH), which are important appliances for night
fishing activities. The findings indicate that the households favor the electricity from the
mini-grid over other and formerly used solutions.

 4.3 Electric appliances
We asked the HHs for their electric appliance inventory to study the use of certain
devices. Electric lighting is the main electricity appliance used in almost all surveyed
households. 92% of the HHs use electricity for lighting, on average a typical HH possess
2.5 light bulbs. A typical appliance inventory consists additionally of cell & smart phones
(88%), television (73%) and fan (70%). Followed by other entertainment appliances such
as DVD players, sound systems and radios. Household appliances and IT appliances are
less frequent. Wealthier households own generally more (Fisher’s exact test: =
.000, = .333, = 164) and more energy intensive appliances. Results show a
significance between income class and ownership of fridges by applying chi-square test
( 2 (1) = 13.43, = .000, = .286, = 164), ownership of washing machines by
applying Fisher’s exact test ( = .001, = .282, = 164) and ownership of water
heaters by applying Fisher’s exact test ( = .001, = .282, = 164). Mostly firewood,
charcoal and in some instances LPG stoves are used for cooking, but no electrical ovens
are owned or used. Only one household owns an AC. Figure 14 shows the quantity of
HHs with certain appliances and the quantity of appliances purchased after the increase
of electric service hours. The data indicates that HHs purchased some appliance types
more often since the provision of 24 hours power supply. This is especially true for
appliances outside the light, TV, fan, cell phone standard set. Appliances with highest
growth rates are water heaters (86%), refrigerators (76%) and sound systems (73%),
which are appliances with high or constant power demand or vulnerable to power
outages. Increased appliance purchases and more frequent appliance usage
contributed to the rapid demand growth in addition to new connections.
180
 155
 160
 140 122 117
 120
 91
 100
 80 56
 60 44 44 38
 40 22 20 18
 20 9 8 7 65 63 51 60
 74 72 75 54 36 27 32 25 15 15 0 4 3 4
 0

 Nr. of HH with appliance Purchased after 24 hours supply

Figure 14: Electric appliance inventory and purchases.

We asked for planned appliance purchases to investigate if the power demand is likely
to further increase. However, the larger share of HHs (57%) stated not to plan to
purchase any appliances in the next two years. This indicates that first demand for
essential electric appliances is saturated. Nevertheless, a number of HHs still plans to
purchase energy-intensive appliances like fridges (13%) and washing machines (4%)
which can significantly add to the baseload and peak load in the hybrid energy system.
Figure 15 provides an overview on planned electric appliance purchases.

 120
 98
 100

 80

 60

 40
 23 22
 20 14
 8 7 7 6 4
 0
 None Fridge TV Rice Cooker Radio Washing Soundsystem Fan Other
 machine

Figure 15: Planned purchases in the next two years.

 4.4 Perceived impact of SDG#7 intervention
The implementation of the Cobrador Island Solar – Diesel project clearly complies with
the SDG #7 to provide reliable, affordable and sustainable energy access. This was
achieved through the implementation of solar power combined with battery storage
leading to lower electricity charges, 24 hour supply and a high renewable energy share.
However, with regard to energy access it needs to be underlined that the improvements
address electricity access and no other forms of necessary energy access (e.g. energy
for cooking).
Other SDGs have been addressed through the intervention by realizing reliable electricity
supply in the health station, school and power devices for sterilizing water: This includes
SDG#3 “Good health and well-being”, SDG#4 “Quality education” and SDG#6 “Clean
water and sanitation”. Due to absence of socio-economic data characterizing the
situation prior to the installation of the hybrid power plant and availability of 24 hours
power supply, we asked for the respondents perceived changes after the hybrid energy
system intervention for the six key target fields of safety situation, education,
information, communication, income and health services. Respondents were asked to
state to agree or disagree to the statements, using a 5-point likert scale (strongly
disagree (1), disagree (2), neither disagree nor agree (3), agree (4), strongly agree (5)).
Table 8 provides an overview about the perceived changes. The objective is to identify
whether any significant differences in below-average and above-average income
classes in the perception of the aforementioned topic areas exist.
Table 8. Subjective perception of changes after 24 hours electricity supply.

 Statement Income group Strongly Disagree Neither/ Agree Strongly N
 disagree (%) Nor (%) (%) agree (%)
 (%)
 Below-average 1.7% 12.1% 7.8% 60.3% 18.1% 116
 The safety situation has Above-average 2.3% 18.6% 16.3% 46.5% 16.3% 43
 improved.
 Total 1,9% 13,8% 10,1% 56,6% 17,6% 159
 Access to education and Below-average 0% 4.4% 17.6% 58.2% 19.8% 91
 quality of education has Above-average 0% 13.5% 24.3% 35.1% 27.0% 37
 improved. Total 0% 7.0% 19.5% 51.6% 21.9% 128
 Below-average 1.7% 9.4% 6.0% 54.7% 28.2% 117
 Access to critical Above-average 0.0% 14.0% 4.7% 46.5% 34.9% 43
 information has improved.
 Total 1.3% 10.6% 5.6% 52.5% 30.0% 160
 Below-average 1.7% 6.0% 2.6% 57.3% 32.5% 117
 Access to communication Above-average 0.0% 7.0% 7.0% 51.2% 34.9% 43
 means has improved.
 Total 1.3% 6.3% 3.8% 55.6% 33.1% 160
 Below-average 10.3% 35.0% 20.5% 26.5% 7.7% 117
 The income situation has Above-average 4.7% 25.6% 16.3% 41.9% 11.6% 43
 improved and/or increased.
 Total 8.8% 32.5% 19.4% 30.6% 8.8% 160
 Access to health services Below-average 0.9% 19.0% 11.2% 54.3% 14.7% 116
 and quality of health Above-average 2.3% 23.3% 9.3% 53.5% 11.6% 43
 service has improved. Total 1.3% 20.1% 10.7% 54.1% 13.8% 159

The majority of HH respondents agrees or strongly agrees that the safety situation
(>74%), access to education (>73%), information (>82%), communication (>89%) and
health services (68%) has improved or increased. For the income situation, we find a
less clear picture with 41% disagreement and 39% agreement. When taking into account
the income groups we find only few noteworthy differences: A higher share of below-
average income HHs (+16%) perceives the safety situation as improved and an
additional 16% of below-average HHs perceived the education situation as improved
compared to above-average income HH. However, the perception of income groups
towards the perception of the income situation differs distinctively: More below-average
income households (+15%) overall disagree that the HHs income increased after the
intervention whereas more above-average income HH (+19%) overall agree that the HHs
income has increased. We applied further tests to explore if the differences between
income groups are statistically significant. Since the considered six dependent variables
are ordinal scaled and not normally distributed, the Mann-Whitney U test is applied.
Table 9 provides the results and reveals that below-average households (m = 3) perceive
significant less improved or increased income opportunities compared to above-
average income groups (m = 4), with z=2.143, p=0.032, and medium effect size r = 0.169.
Table 9. Mann-Whitney U test results for below average and above average income households.

 The safety Access to Access to Access to The income Access to
 situation has education critical communicati situation has health
 improved. and quality information on means improved services and
 of education has has and/or quality of
 has improved. improved. increased. health
 improved. service has
 improved.
 Mann-Whitney U 2155.000 1542.500 2405.500 2512.000 1979.000 2328.500

 Wilcoxon W 3101.000 2245.500 9308.500 9415.000 8882.000 3274.500

 Z -1.461 -0.806 -0.466 -0.015 -2.143 -0.705

 Asymp. Sig. (2-tailed) 0.144 0.420 0.642 0.988 0.032 0.481

Our findings highlight that the implemented technology enables the realization of
SDG#7 in the given framework conditions. Further SDGs are positively addressed
through, in particular SDG#3, SDG#4 and SDG#6. However, wealthier HHs profit more
from achieving SDG#7 than less wealthier ones as no impact on SDG#1 and SDG#10 is
achieved. This discrepancy of being able to profit from more reliable, affordable and
sustainable energy supply even bears the threat to further increase inequalities.

5 Discussion
Our findings indicate that upgrading the former diesel-based energy system to a hybrid
energy system using solar power and battery storage clearly improved the livelihood
and wellbeing of the local community. This was achieved by improving sustainability
(increased RE share), reliability (establishing 24 hours supply) and affordability (tariff
reduction). However, our findings reveal that HHs do not equally profit from the
intervention. In the following we are highlighting the implications for energy access
planning, implications for addressing other SDGs, implications for addressing poverty
and inequalities and contextualize the findings of our case study.

 5.1 Implications for energy access planning and SDG#7
The new hybrid system is able to fully supply the loads on Cobrador Island. Universal
access to electricity has now been achieved on the island. Anyhow, we find that a large
number of HHs use small amounts of electricity compared to few HHs with a larger
consumption. This becomes obvious when comparing the identified consumption
levels with the Multi-Tier Framework (MTF) for Measuring Energy Access (Bhatia &
Angelou 2015). The majority of HHs do not exceed tier 2 or 3 of the MTF characterized
by a monthly consumption of
that an oversizing of supply systems would take place when assuming a Tier 5 level for
all HHs. SHS are an appropriate technology to deliver electricity access at least for tier
1 and 2 (Narayan et al. 2019). Whereas tier 3 can be addressed with SHS as well, tier 4
and 5 are currently out of reach of SHS products. Thus, depending on the local situation,
it might make sense to not connect all HHs to the island’s grid, but supply some of them
with SHS. This would reduce the costs of supply per customer and ultimately increase
the affordability of electricity.
One could criticize the MTF for its inability to accurately access the demand for vital
services required for HHs’ wellbeing (Groh et al. 2016) and given its global scope it is
inaccurate to national conditions (Pelz et al. 2018), but due to our locally collected data
it can be a good guidance for energy access planning in the Philippines. However,
addressing the electricity demand of the low income HHs with SHS would decrease the
customer base for the hybrid system and might reduce its future economic
attractiveness. Additionally, electrification with SHS is less capable of powering
productive loads (Bhattacharyya & Palit 2014). A more accurate assessment of
electricity demands and planning of the energy system can avoid oversizing and
suitable approaches have been presented in the scientific literature (Riva et al. 2019).
Two main implications can be derived for future energy access planning for similar
islands: First, it is necessary to decide if all HHs shall be connected to the hybrid system
based on detailed electricity demand assessment. Deploying SHS to far away and
scattered HHs with low present and low projected electricity demands can lower the
overall costs while addressing the surveyed electricity demands. HHs could be
connected to the hybrid energy system in a later step when an increased demand
economically justifies a connection. Above all, it is important to consider whether two
different electrification schemes would lead to increased energy injustice as
demonstrated for other case studies (Monyei et al. 2018). Second, a large share of the
investment was spent for the battery storage system. This seems appropriate given the
remoteness of the case study island and the objectives of a high RE share allowing for
sustainable energy supply. However, a smaller sized battery storage system in
combination with deploying SHS to the most remote HH could increase the replicability
of the implemented technology solution through decreasing necessary investments.
Battery storage costs are projected to decrease significantly which could enhance the
replicability of the implemented energy system (Kittner et al. 2017).

 5.2 Implications for addressing other Sustainable Development Goals
HHs use electricity mainly for leisure and entertainment (TV, DVD, cell phone, sound
system) and well-being (light bulb, fan) as indicated through the analysis of the HHs’
appliance inventory (see Figure 14) which is in accordance with other findings for the
Philippines (Hong & Abe 2012). The majority of HHs is satisfied with the electricity
service/costs (compare Figure 10) and consider supply safety and reliability as most
important, similar findings have been found for case studies in South Asia (Sharma &
Chan 2016). Further SDGs have been addressed through implementing SDG#7: As an
example SDG#3 “Good health and well-being” by realizing more reliable electricity supply
in the health station, SDG#4 “Quality education” by using appliances such as computers
and fans in the school and by using electric lighting for studying at home, and SDG#6
“Clean water and sanitation” by powering devices for sterilizing water. We focus with
this case study on electricity supply but recommend that future studies and
interventions targeting SDG#7 have to address the energy demand for cooking. For the
case study, observations reveal that cooking is largely based on fuelwood and in few
cases HHs use LPG stoves. Thereby the potential of clean energy supply for addressing
SDG#3 “Good health and wellbeing”, SDG#5 “Gender equality” and SDG#15 “Life on land”
is not fully exploited as cooking based on fuelwood negatively affect these three SDGs
(Das et al. 2017). Recent studies have revealed that innovative electric cooking
technologies can be beneficially incorporated in hybrid energy systems (Lombardi et al.
2019).

 5.3 Implications for addressing poverty and inequality
Our results show that the HHs perceive an overall positive impact on their livelihoods.
However, the perceived impact on income generation is divided among the HH wealth
groups. Here, we identify that the majority of above-average income HHs perceive a
positive impact on income generation whereas a high share of below-average HHs
perceives no impact on income generation (compare section 4.4). It can be concluded
that there is so far no significant increase in income generating activities through
electricity on Cobrador Island and that few households have opened up new businesses.
Other case studies have found similar results for India (Khandker et al. 2012), Brazil
(Obermaier et al. 2012) and Rwanda (Lenz et al. 2017). There are however significant
differences between wealthy and poor households in terms of electricity usage.
Wealthier households have a higher ability to save money for major investments and do
not necessarily have to take up a loan. As a consequence they own a higher number of
electronic appliances. The results show that wealthier households use electricity more
frequently for income generating activities and have opened more businesses than
poorer households.
We propose that projects addressing SDG#7 must incorporate specific poverty reducing
measures coupled with the implementation of more reliable, affordable and sustainable
electricity. Such measures could include to offer micro-finance products (MFP) for
appliance purchases, to implement a cross-subsidy scheme within the community or
initiating cooperative-based companies. MFP could enable below-average income
households to profit from the improved electricity supply through small credits for
important appliances, such as refrigerators or appliances allowing for productive use
(Gutiérrez-Nieto & Serrano-Cinca 2019). However, an analysis of potential markets and
demands for the producible products needs to be conducted first. It has been shown
that a slow effect on income generation can be based on the lack of demand and
markets (Lenz et al. 2017). A cross-subsidy scheme within the community could enable
a higher usage of electricity for below-average HHs subsidized by above-average
income HHs. Most probably the social acceptability of such an approach would be a
challenge. Nevertheless, for hybridization projects on other islands the communities
You can also read