R 1259 - Energy costs and competitiveness in Europe by Ivan Faiella and Alessandro Mistretta - Banca d'Italia
←
→
Page content transcription
If your browser does not render page correctly, please read the page content below
Temi di discussione
                (Working Papers)

                Energy costs and competitiveness in Europe

                by Ivan Faiella and Alessandro Mistretta
February 2020

                                                                      1259
                                                             Number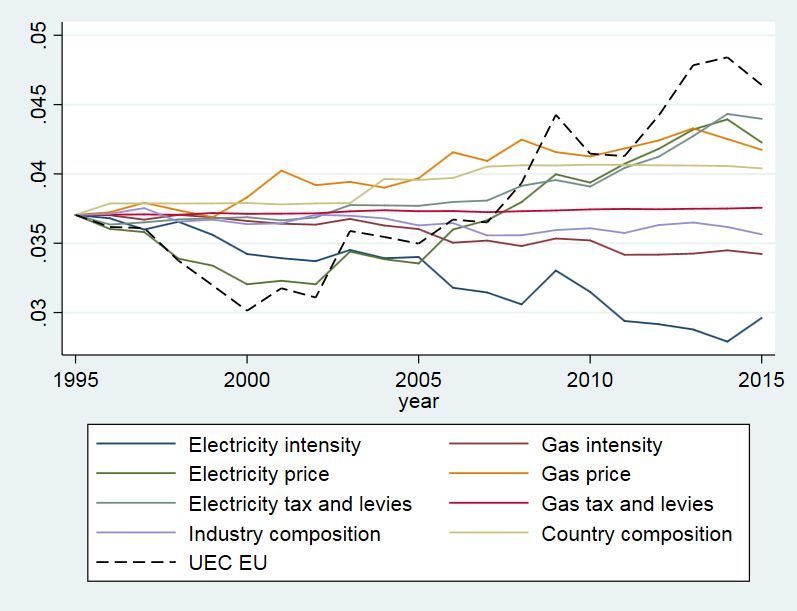
Temi di discussione
(Working Papers)

Energy costs and competitiveness in Europe

by Ivan Faiella and Alessandro Mistretta

Number 1259 - February 2020
The papers published in the Temi di discussione series describe preliminary results and
are made available to the public to encourage discussion and elicit comments.
The views expressed in the articles are those of the authors and do not involve the
responsibility of the Bank.

Editorial Board: Federico Cingano, Marianna Riggi, Monica Andini, Audinga
Baltrunaite, Marco Bottone, Nicola Curci, Davide Delle Monache, Sara Formai,
Francesco Franceschi, Salvatore Lo Bello, Juho Taneli Makinen, Luca Metelli,
Mario Pietrunti, Massimiliano Stacchini.
Editorial Assistants: Alessandra Giammarco, Roberto Marano.

ISSN 1594-7939 (print)
ISSN 2281-3950 (online)
Printed by the Printing and Publishing Division of the Bank of Italy
ENERGY COSTS AND COMPETITIVENESS IN EUROPE

                                        by Ivan Faiella* and Alessandro Mistretta*

                                                                 Abstract
       The worldwide upswing in energy prices recorded in the last decade has placed
decarbonization strategies, and their potentially negative consequences for firms’ costs and
competitiveness, at the centre of the European policy debate. We evaluate the relevance of
energy policies for competitiveness by augmenting the standard analysis, largely based on
labour costs, with a Unit Energy Cost (UEC) indicator. We analyse how the UEC evolved in
different countries and industries and we assess its main drivers (prices, energy intensity,
sector composition). Modelling the relationship between foreign sales and the UEC in a
gravity model setup, we find that an increase in UECs reduces bilateral exports; the largest
negative effects are obtained when limiting the analysis to euro-area countries. Our results
strengthen the case for pursuing further integration of European energy markets (as provided
for in the Energy Union and Winter packages) to ensure that the ambitious long-term
European decarbonization targets do not have a negative impact on the euro-area industry’s
ability to compete worldwide.
JEL Classification: C53, D24, Q41.
Keywords: firms’ costs, energy, competitiveness, decarbonization, EMU.
DOI: 10.32057/0.TD.2020.1259
                                         Contents
1. Introduction ......................................................................................................................... 5
2. The literature on energy and competitiveness ..................................................................... 6
3. Data...................................................................................................................................... 7
4. An indicator to assess firms’ energy costs........................................................................... 8
   4.1 The UEC and its components ....................................................................................... 8
   4.2 Some descriptive results ............................................................................................... 9
   4.3 Renewable support and UEC...................................................................................... 12
5. Does energy matter for competitiveness? .......................................................................... 14
   5.1 UEC and export competitiveness ............................................................................... 14
   5.2 The European Monetary Union as a natural experiment ............................................ 16
6. Conclusions ....................................................................................................................... 19
References .............................................................................................................................. 21
Appendices ............................................................................................................................. 24
   A Figures ........................................................................................................................... 25
   B Tables ............................................................................................................................. 26
   C UEC decomposition ....................................................................................................... 33

_________________________________________
*
    Bank of Italy, Directorate General for Economics, Statistics and Research.
1 Introduction1
The European business community regularly raises the issue of a growing gap in energy prices
compared with the global competitors (e.g. US and China) that could hamper the competitive-
ness of many industrial activities, blaming the European decarbonization strategy and an over-
cautious approach in harnessing unconventional hydrocarbons (European Commission 2014b).
Also some European institutions are expressing their concern for the effect that ever-increasing
energy prices can have on households’ energy poverty and on the competitiveness of European
firms. According to the European Competitiveness Report 2014, electricity prices for industrial
use are, in Europe, twice than in the US (gas prices three times).(European Commission 2014a)
EU climate and energy policies (Europe 2020, the Energy Union, the Winter package and,recently,
the Green New Deal for Europe) will plausibly involve a further rise in energy prices (for the
extra-costs of a full-fledged EU ETS, of further renewable subsidization or renewable-related
system costs, carbon taxation, etc.) with a potential detrimental effect on European industry
competitiveness.2
Nonetheless the relevance of this issue, European statistics on business energy costs are scant,
irregular and with a very limited level of disaggregation. This data gap hinders the understanding
of the link between energy costs and firms’ features such as sector specialization, mark-ups’ and,
in general, firms’ ability to compete on the international markets.
The situation is different for labour costs: for example Unit Labour Cost (ULC) is one of
the indicators monitored by the Country Macroeconomic Imbalance Procedure - (MIP) - of the
European Commission3 .
We think that energy deserves the same attention and therefore we propose a new formulation
of the Unit Energy Cost (UEC), first suggested by Andersen and Ekins (2009).
To estimate this indicator we merge Eurostat data - at a year*country*sector level - covering
information on production, value added and energy mix fro all EU countries. We also resort to
the information on energy prices paid by industrial users for gas and power (available only at
a year*country level). The availability of this detailed data (with information on single energy
sources) allow us to analyse how UEC has evolved in different countries/industries and what
have been the main drivers (changes in prices, in energy intensity or sector composition).
In order to understand how UEC can influence industry competitiveness, this set of data
is combined with information on external trade of EU countries at the industry level. Using a
gravity model, and adopting different specifications and robustness checks, we find a persistent
negative relationship between export and UEC: between 1995 and 2015, on average, the increase
of energy costs curbed the value of export by almost 2.5 percentage points.
This relationship is stronger when we limit the analysis to euro area (EA) countries. Exploit-
ing the adoption of the euro as a natural experiment who might have affected the pricing strategy
of the European manufacturing sector, we find for EA countries a higher negative elasticity of
trade to UEC (even higher limiting to intra-EU trade).
1 We would like to thank the participants to the 6th Italian Association of Environmental and Resource
Economists (IAERE), to the World Congress of Environmental and Resource Economists (WCERE) confer-
ences, to the eighth edition of the Italian Congress of Econometrics and Empirical Economics (ICEEE) and to the
38th edition of the International Energy Workshop (IEW). We are also indebted to Matteo Bugamelli, Federico
Cingano, Paolo Sestito, Stefano Siviero, Roberto Torrini, Roberta Zizza, Francesco Zollino and an anonymous
referee for their valuable comments. The views expressed do not necessarily reflect those of the Bank of Italy.
E-mail: ivan.faiella@bancaditalia.it; alessandro.mistretta@bancaditalia.it.
2 According to the 2017 World Energy Outlook, the European Union and Japan are the two regions with the
highest electricity prices. Over time, EU electricity prices are predicted to become the highest in the world (see
fig 6.26 of IEA, 2017).
3 The indicators used in the MIP scoreboard to measure price and cost competitiveness are the Real Effective
Exchange Rate and the nominal Unit Labour Cost with the addition of the Export Market Share.
5The paper is organized as follows. Section 2 recaps the literature on the relationship between
energy costs, firms’ performance and their ability to sell their products on foreign markets.
Section 3 describes the set of data used in the empirical analysis. Section 4 introduces the
UEC indicator, detailing its main components and drivers, and assessing the causal link between
Renewable Energy Sources incentives and energy costs. In Section 5 we present a set of models
with the purpose to shed light on the relationship between energy costs and competitiveness and
propose a diff-in-diff econometric strategy in order to investigate if the EMU beneficial effects
on trade have been lower for high-UEC countries. Finally, Section 6 concludes.
2 The literature on energy and competitiveness
There is a large body of studies on energy costs and firms’ performance, focusing on how an
increase in energy expenditure might impact investment, profitability, exports, employment or
productivity. Many of these analyses assess the side-effects of environmental or energy policies.
For example Arlinghaus (2015) reviews the empirical literature on the effects of carbon taxation
and EU ETS (the EU cap-and-trade system that limits the emissions of energy intensive indus-
tries) on various indicators and finds no significant ex-post adverse effects on competitiveness.
Some of these works uses country panel data with a sector-level disaggregation while others
exploit detailed microdata at the firm or plant level.
Among the latter, the results are rather mixed.
A group of studies ascertain a link between energy prices changes and firms’ performance.
Ratti et al. (2011) observe that a 1 per cent increase in energy prices would reduce investment by
1.2 per cent. Abeberese (2017) finds a connection between electricity costs and firms’ productivity
growth. According to Rentschler and Kornejew (2017) higher energy prices are correlated with
reduced profit margins, though the magnitude of the effect is small and it varies across different
types of fuel and industries. Faiella and Mistretta (2015) observe that higher energy expenditure
compresses firms’ ability to increase their revenue, especially abroad.
Other studies find no association between change in energy costs and firms’ results. Martin
et al. (2014) find that energy taxes, that affects energy intensity, have no impact on firms’
performance. Flues and Lutz (2015) don’t detect any correlation among changes in electricity
prices, firms’ exports and other performance measures. Also Gerster (2017) does not find evidence
of short-run effects on firms’ gross output, exports and employment. Rammer et al. (2017) use
firm-level data for countries featuring similar industry structures but different energy policies
and their findings suggest that these policies have no relevant influence on firms’ international
market position (they explain their results with the evidence that cost effects are neutralised by
the adoption of more efficient technologies).
A similar range of uncertainty characterizes the analyses that use sectoral-level data.
Costantini and Mazzanti (2012) find that energy taxes are either neutral or even positively
correlated with exports (an evidence of a sort of Porter effect; Porter and van der Linde (1995)).
Sato and Dechezleprêtre (2015) observe only a small impact on trade of a change in relative
energy prices. Kaltenegger et al. (2017) underline the rising importance of indirect energy costs -
estimated using the energy embodied in intermediate inputs - in assessing how energy expenditure
influences firms’ performance given the increasing participation in global value chains.
Our paper exploits the wealth of harmonized information provided yearly by Eurostat on
different energy sources, production and gross export at the country and industry level. We
propose to use our UEC estimator in order to assess the latest dynamics of energy costs - across
different sectors and countries - and how these developments might affect firms’ competitiveness.
Our study use Sector-level fully comparable data. While controlling for the high degree of
6heterogeneity among firms would require firm-level data, our harmonized dataset is suitable for
the purpose of evaluating energy policies and energy costs trends across EU countries.
Finally, even if competitiveness is a multi-dimensional concept that should be assessed using a
set of price- and non-price indicators (e.g. firms’ profitability as suggested by Amici et al., 2017),
in what follows we mainly focus on the former. We are aware of the limits of correlating export
performance only to the evolution of costs measures. These indicators should be supplemented
with price-based real effective exchange rate indices that perform better in explaining export
dynamics (Giordano and Zollino, 2015).
3 Data
The idea underlying a Unit Energy Cost (UEC) measure, alike for Unit Labour Cost (ULC), is
to develop a simple indicator that provides information on the amount of energy that the average
firm needs to produce a unit of output, given the adopted technology and fuel mix.
As the ULC can be expressed as a combination of earnings and labour productivity, also the
UEC can be estimated as the ratio of energy prices Pe to energy productivity or, equivalently,
as the product of prices and energy intensity YE . The UEC can be expressed as follows:
U EC = Pe YE
Every piece of information used for calculating this indicator is based on Eurostat data and
hence it is fully comparable across EU countries; because of data constraints we limit our analysis
to the manufacturing sector.
We use National Energy Balances for the information on the energy demanded by each sector
in a given year; the information is available at sub-industry level with details on different energy
sources.4
Cross-country comparable information on industry prices, released bi-annually, are only avail-
able for electricity and natural gas.5 The information on output, in nominal terms, is obtained
from National Accounts.6
To analyse EU country competitiveness we use Eurostat trade data. Because there is no
information available on export at the industry level, we use a dataset that accounts for the
bilateral trade at the product level according to the Combined Nomenclature at 8-digits (CN8)
classification.7 In particular we collect data for about 18,000 different products and we map
the CN8 classification into the Prodcom sectorization thus obtaining trade information at the
industry level according to Nace rev. 2, at two digits level, classification.8
4 This dataset reports information on the use of total oil products, natural gas, electricity, derived heat, solid
fossil fuels, renewables and waste by these sub-industries: Iron and Steel/Non-Ferrous Metals, Chemical and
Petrochemical, Non-Metallic Minerals, Mining and Quarrying, Food and Tobacco, Textile and Leather, Paper Pulp
and Print,Transport Equipment, Machinery, Wood and Wood Products, Construction, Non-specified (Industry).
5 Data are collected for different consumption bands. Since information on the level of consumption in each
band is not available, we use the price of the median band.
6 Data are aggregated according to Nace rev 2. We combine this information to obtain a level of aggregation
that is coherent to the one used for energy data.
7 The Combined Nomenclature (CN) is a tool for classifying goods, set up to meet the requirements both of
the Common Customs Tariff and of the EU’s external trade statistics. The CN is also used in intra-EU trade
statistics.
8 Prodcom codes are composed by 8 digits where the first 4 are related to the corresponding Nace rev. 2
classification. Using this code we are able to aggregate data at industry level. For more details see http:
//ec.europa.eu/eurostat/web/prodcom.
74 An indicator to assess firms’ energy costs
4.1 The UEC and its components
As previously illustrated, energy costs are estimated using amount of energy, with specific infor-
mation on electricity, gas, coal, renewable and oil (available from the National Energy Balances)
while energy costs are approximated using the information on electricity and natural gas prices
paid by industrial users. Since we don’t have price data for every energy source, we impute the
missing information using the share of gas and electricity on industry final use. This probably
results in an overestimation of the UEC given that the sources excluded from the computation
(coal, fuel oil, etc.) are usually cheaper than electricity and natural gas (because of their lower
value in terms of flexibility and energy returns); the shrinking trend in the use of these sources
should limit the upward bias of our estimates.
The general formula for the UEC is the following:
EC
U EC = P ROD .
This indicator, that expresses total energy costs (EC) as a percentage of the value of pro-
duction (P ROD),9 can be estimated at different levels of aggregation, allowing us to analyze it
at the EU, country or industry level; moreover, it can be easily decomposed in order to identify
the main drivers of its dynamics.
Defining Ksiet as the quantity of the energy source e used at time t in industry i of country
s, and p as the price and τ as the tax and levies; we have:
P P
Ksiet (Pset +τset ) Ksiet (Pset +τset )
sie
P P RODst PP RODsit e
U ECEU t = P
P RODsit = P
P RODst P RODsit P RODsit =
P P si si s i
= zst qsit U ECsit
s i
P RODsit
where qsit = P
P RODsit represents the share of sector i in state s at time t over the whole
i
P RODst
manufacturing sector and zst = P
P RODst is the share of manufacturing of state s with respect
s
to the total EU manufacturing.
Considering the UEC dynamics at EU level, computed as a difference in percentage points,
we can derive the following identities:
X X X
4t U ECEU = zst−1 qsit−1 (Pbsiet−1 + τbset−1 ) 4t Iies +
s i e
| {z }
Energy intensity ef f ect
X X X X X X
+ zst−1 qsit−1 Isiet 4t Pbsie + zst−1 qsit−1 Isiet 4t τbse +
s i e s i e
| {z } | {z }
P rice ef f ect tax ef f ect
X X X
+ zst−1 U ECsit 4t qsi + U ECst 4t zs
s i s
| {z } | {z }
Sectoral composition ef f ect Country composition ef f ect
9 In the paper we follow the suggestions of the European Commission of using a real unit energy costs indicator,
defined as energy costs as a fraction of a measure of production (European Commission 2014b).
8where prices and taxes are expressed in real terms using the implicit deflator of the production
(Pbsiet and τbset ), whereas the Isiet is the energy intensity for a specific country*industry*energy
source. The detailed decomposition is available in Appendix C.
According to this decomposition, we can single out 5 drivers: 1) The Intensity effect gives
information on how energy efficiency is evolving across different industries; 2) The Price effect
accounts for the developments of the unit cost of natural gas and electricity; 3) The Tax effect
is similar to the Price effect but focus on taxation and levies only; 4) The Sectoral composition
effect describes how changes in industry structure influence total energy costs (e.g. because of
the decline/increase of a sector contribution to total production); 5) The Country effect affects
the UEC according to the relative weight of different EU economies. The first three drivers can
be assessed separately for electricity and gas.
4.2 Some descriptive results
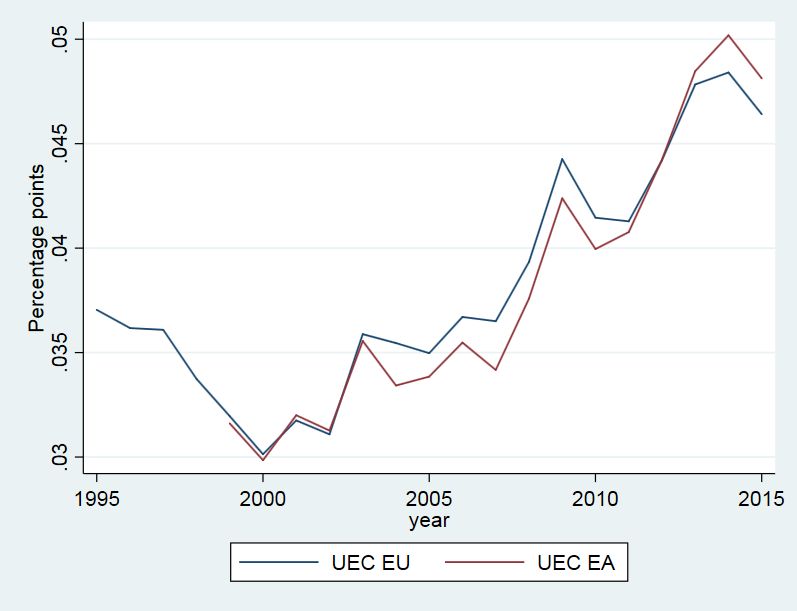
In the last decades energy costs became increasingly relevant: UECs almost doubled rising from
3.1% in 2000 to 4.7% in 2015 (Figure 1).
Figure 1. UEC in EU and in EA
To have an idea on UEC dynamics in relative terms one can compare it with the costs of
another key input of production, labour. In the first decade of this century energy purchases
in the EU manufacturing sector were roughly a seventh of labour cost. This ratio has been
constantly increasing in the following years, reaching more than a quarter in the latest period
(Figure 2).
9Figure 2. Comparison between UEC and ULC.
If we analyse the UEC by sector, we can see, not surprisingly, that this upward general trend
has been mostly driven by energy-intensive sectors, that contribute the most to the EU-level
UEC.10 These are essentially Iron and Steal/Non-Ferrous Materials, Non Metallic Minerals and
Paper Pulp and Print (Figure 3).
Figure 3. UEC trends by sector
But there is more then the weight of energy intensive-industries that can explain UEC dynam-
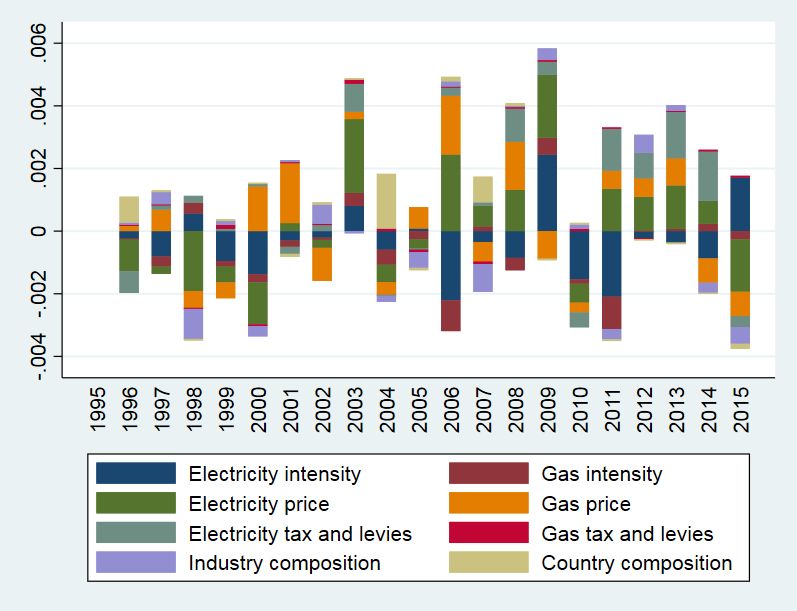
ics. In order to understand the role of the different drivers of UEC dynamics we can decompose
the different factors, as discussed in Section 3.1, according to their year-on-year contribution
(Figure 4).
10 We define Energy Intensive sectors as those with a UEC greater than the 75th percentile of the country
distribution during the whole sample period.
10Country composition effect seems to be relevant when new countries accessed the EU, because
the UEC of those countries was larger than the EU average.11
Considering prices, until 2001 electricity prices gave a negative contribution to UEC changes,
while afterwards it was responsible for most of UEC growth. The opposite is true for electricity
intensity, whose contribution to UEC growth has been constantly decreasing (with the only
exception of 2003). In more recent years, taxation, in particular that on electricity (that includes
also the levies collected to support renewable energy), has becoming increasingly important.
Figure 4. EU UEC dynamics, y-o-y contributions
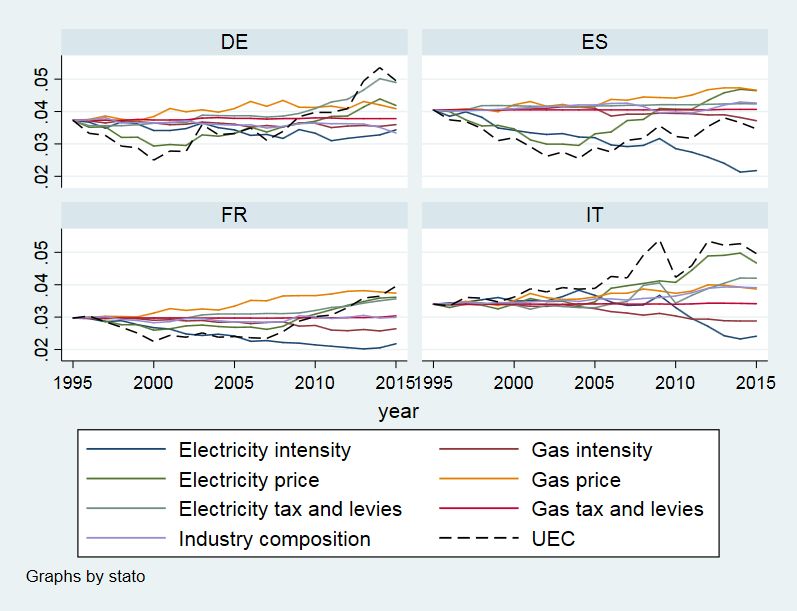
Finally, the evolution of EU UEC can also be assessed by considering the cumulative growth
of its components over the last 20 years. Figure 5 shows that: 1) energy intensity (both for gas
and electricity) decreased over time, suggesting a constant improvement in the level of energy
efficiency (in particular for gas); 2) pre-tax price dynamics has been particularly important in
determining UEC trends; 3) fiscal and parafiscal components (especially for electricity) have
played a key role in UEC growth. The observed trends are very similar when we focus on the
evolution of the UECs in the bigger EU countries (see figures 9 in Appendix A).
11 From 2004 EU includes Cyprus, Czech Republic, Estonia, Hungary, Latvia, Lithuania, Malta, Poland, Slovakia
and Slovenia; from 2007 it also includes Bulgaria and Romania.
11Figure 5. EU UEC, cumulative contributions
If future UEC changes will be governed by the same drivers, EU and National institutions
should be aware that a renewed vigour in European climate policies could increase energy costs
at the expense of the European manufacturing industry. Without a coordinated global action,
higher energy costs could affect the price attractiveness of European goods and this in turn
could hamper European competitiveness if there is a negative relationship between energy costs
and trade competitiveness; this is what we are going to investigate in Section 4. But since
electrification is, together with an increasing role of renewable in the energy mix, one of the
major pillars of the European future decarbonisation strategy (European Commission, 2016) we
delve more into the relation between Renewable financing and UEC.
4.3 Renewable support and UEC
It is useful to elaborate upon the relation among decarbonization, renewable sources, electricity
prices and UEC. In the last decade there has been a growing attention to Renewable Energy
Sources (RES) as a key strategy to decarbonize the energy systems; this has become a priority
since the international agreement on the Kyoto Protocol in 2005. In order to achieve the de-
carbonization goals envisaged by the Protocol, the EU devised the Europe 2020 strategy that
requires specific RES targets: by 2020 RES should contribute to about 20% to gross final energy
consumption and this EU-wide objective has been translated in national targets by each country
(burden sharing).
This decarbonization process is having a significant economic impact, in particular in those
countries (notably Italy, Germany and Spain) that invested substantially in financing RES de-
ployment: the resources used to pay RES producers are collected through a levy on the use of
electricity, thus putting an upward pressure on the electric component of firms’ energy expendi-
ture (and, ceteris paribus, increasing their UEC) for the years to come.12
12 For an evaluation of RES deployment in Italy see Faiella et al., 2016.
12Figure 6. EU UEC, RES deployment and financing
As it is shown in Figure 6, it is clear that RES diffusion has pushed electricity levies and
consequently UECs.
To better understand the nature of this link we run a set of regressions that explain UEC
changes with a measure of how the share of RES in the national power mix affects firms’ electricity
consumption (RES industry impact) using the following model specification:
∆U ECist = α + β∆RESist + λis + ist .
Because the majority of RES is deployed in the power sector and is financed through electricity
levies, this indicator is a proxy of the indirect impact of RES via firms’ demand for electricity: in
practice the RES industry impact (RESist ) is computed as the product of the share of electricity
in the firm energy mix by the RES contribution to the national power energy mix.
Electricityist RESst
RESIndustryImpactist = T otalEnergyist ElectricityP roducedst
We find a strong association between the dynamic of this measure and UEC (see columns
1 and 5 in Table 2). However, these results could be affected by a reverse causality problem.
RES penetration can depend on several factors: the cost of deployment can be different across
industries (e.g. because of location or technology constraints) and some sectors may be more
exposed to the level and volatility of traditional fuels prices (with an incentive of increasing
the proportion of RES into their energy mix). To address this issue we adopt the following IV
strategy. Because RES deployment in EU countries is related to the enforcement of the Europe
2020 strategy, the reference target should be exogenous with respect to the single industry of a
particular country. Since RES deployment affects energy costs (and therefore the country UEC)
these links should be related not only with the notional target but also with the actual effort
made in order to achieve it.
We therefore define the variable Achievementst , which is informative on the success of each
country s at time t in order to achieve the national T argets
RESSharest
Achievementst = T argets
13Following the approach of Abeberese (2017), who proposed the generation power mix as
an instrument for electricity price, we use as instrument for RES industry share dynamics
(∆RESIndustryImpactist ) an exogenous variable coming from the Europe 2020 targets. In
particular we employ the variable Ef f ortst - defined as the progression towards the achievement
(Ef f ortst = ∆Achievementst ) interacted with a dummy for the period in which Europe 2020
rules have become compulsory (columns 2 and 6 in Table 2) and, additionally, the level of the
national RES target (see columns 3-4 and 7-8 in Table 2).
According to the results of first stage regressions we can reject the hypotheses of weak in-
strument for all the specifications adopted (using the standard F test) (Table 3).
This analysis corroborates a causal link between RES deployment and industries’ energy cost
for European countries: ∆RES coefficients range from 0.29 to 0.48 and applying these parameters
to Italy in the period 1995-2015 gives a contribution of RES deployment to total UEC growth
between a sixth and a fourth. This average effect hides a large heterogeneity among EU countries.
It is possible that countries adopted different strategies: for example one country can spread RES
costs evenly between firms and households according to their energy use (as in Italy) while an
other can shift the financial burden on households (as it happens in Germany). These differences
change how RES support influences UEC and in turn how this affects competitiveness, that is
the topic of the next section.
5 Does energy matter for competitiveness?
As detailed in Section 1, higher energy costs can hamper firms’ competitiveness in many ways.
In order to explore the nexus with exports, we estimate a gravity model, harnessing a detailed
dataset with bilateral trade information for each EU country (described in Section 2). In the
model, information about exporters and importers is used with other covariates meant to control
for unobserved fixed effects.
5.1 UEC and export competitiveness
According to the literature, in order to avoid biased estimators uni-directional, bilateral flows
should be considered13 and all trade information should be expressed in nominal terms (Baldwin
and Taglioni 2006). In this type of models, bilateral export is modelled using a specification
in which demand and supply factors are used as controls: typically GDP and population are
included among the regressors as well as other variables deemed relevant (e.g. the distance
between countries to proxy for trade barriers).14
Gravity models have been extensively used in the trade literature for their empirical robust-
ness and their explanatory power (Kepaptsoglou, Karlaftis, and Tsamboulas 2010); in the last
years this class of models has become the main tool for estimating bilateral trade (Egger and
Pfaffermayr 2003).
Since the seminal paper by Santos Silva and Tenreyro (2006), the empirical literature suggests
to adopt the Poisson quasi-maximum-likelihood (PQML) method in order to estimate this class
of models. This estimation procedure allows to deal with a large number of zero values and with
13 Uni-directional bilateral flows represent the country export: the previous literature used an average between
import and export but this might lead to biased estimators.
14 There is an intense debate regarding the inclusion of fixed effects in panel data analyses: according to Egger
and Pfaffermayr (2003), models including bilateral effects dominate those with main effects and a selection of
observable time-invariant variables; however, the inclusion of fixed bilateral effects makes it impossible to directly
estimate the coefficients of time-invariant observables (like distance).
14the presence of a high level of heteroscedasticity, and it performs better in term of bias (Head
and Mayer 2014).
As in Santos Silva and Tenreyro (2006), we check for the correct specification of the conditional
expectation comparing the model estimated with PQML and with OLS, using a modified RESET
test (Ramsey 1969). This test shows the superiority of the PMQL estimator (see Table 4 ).
INSERT HERE TABLE 4
Using PMQL, we choose the following model specification:
Expspit = αXsit + ωWpt + βU ECsit + ts + λspi + spit .
where Expspit is the uni-directional bilateral trade flowing from country s to country p of goods
produced by industry i at time t; additionally, Xsit includes controls for the exporter country
(s) and Wpt for the commercial counterpart (p); additional controls are countries’ GDP and
population and the sector composition of the considered economy. Moreover, since UEC exploits
only information on electricity and natural gas, we also include the share of other energy sources
that are consumed at the industry level, the industry-country specific ULC15 and the weight of
the i − th sector compared to total manufacturing in country s. We also add a fixed effect λspi at
industry-country-partner level and, in order to control for global sectoral shocks, a year*industry
dummy (ts ). Additionally, in some specifications we consider the differential elasticity of Export
to UEC for energy intensive sectors.
We find a negative relationship, statistically different from zero, between UEC and exports,
with an elasticity ranging from 0.07 to 0.09.16 Considering the relative change in UECs in the
last decade (+29% between 1995 and 2015) this corresponds to an average reduction of export
by almost 2.5 percentage points; while in the same timespan the change in the ULC (-1.5%)
would have increased export by 0.48 percentage points.
INSERT HERE TABLE 6
For maximising comparability we use Eurostat data preventing us from exploiting information
on China, USA and the Rest of the World. For this reason in the first column of Table 6 we
don’t have counterparts’ information as control variables. To disentangle how much our results
depend on the sample composition or the controls considered, in column (3) we exclude trade
flows to China, USA and the Rest of the World. These results are robust to different specifications
of the model and strategies for standard errors computation.17 Our estimates support, in line
with the existing literature (see for example Sato and Dechezlepretre, 2015), the hypothesis that
energy costs affects country competitiveness. When only European trade partners are considered
(columns (2)-(6) compared to column (1)) our results are even stronger. Results are robust
even when we add controls on commercial partners (columns (3)-(6)). Additionally, for energy
intensive sectors, our estimates suggest, as expected, a greater response of exports with respect
to UEC in columns (4)-(6)). In order to avoid that the energy-intensive parameter is biased by
a size-effect we also control for the number of workers employed in the sector. Moreover, since
- during the period considered - international trade landscape has drastically changed because
of the growing role of China (Caliendo et al., 2015), in columns (7) and (8) we also control
for the degree of Chinese goods penetration in the counterpart economies.18 Finally, we also
15 For the sake of full comparability with UECs we express labor costs as a share of the value of production.
16 The coefficients reported in Tables are estimated with a PQML and as such they can be interpreted as
elasticities. See Gourieroux, (2000).
17 Considering the bilateral exchange rate among the covariates does not impact significantly our results. These
set of estimates are available upon request.
18 The contribution of the counterpart Chinese import with respect to the total import at the industry level is
included as a regressor.
15consider industry composition of both exporter countries (columns (1) to (6)) and commercial
counterparts (columns (3) to (6)).19
In all regressions, parameters’ estimates have the expected sign and size, in line with the main
results in the literature: export increases with GDP (in both importer and exporter countries)
and decreases with population size.
There is the possibility that our results are affected by a reverse causality issue: for instance,
firms more exposed to the international markets may decide to invest more in energy efficiency in
order to reduce their UECs. Although this effect is plausible, the process of incorporating energy-
efficient technologies impacts all the other industrial processes and takes times to be completed.
We check the robustness of our results to this issue using a bi-annual dataset and assessing the
impact of the UEC in a 4-years time span. In particular we average our original data over two
years and we estimate the same set of models on this collapsed dataset (see columns (1)-(5) of
Table 7); additionally we use lagged UECs as a proxy of the current UECs (columns (6)-(10)
of Table 7). Also in this case our results corroborate the hypothesis that energy costs depress
exports and, again, this effect is stronger when we limit the analysis to EU countries.
5.2 The European Monetary Union as a natural experiment
To better understand the link between energy costs and competitiveness we exploit the adoption
of the euro as a specific event who might have affected the pricing strategy of the manufacturing
firms in the European Monetary Union (EMU) (see for example Bayoumi et al., 2011).
Within a monetary union, the rebalancing of countries with current account deficits requires
deflationary adjustment such as fiscal contraction and/or internal devaluation. The literature on
internal devaluation usually considers differences in ULCs and finds that countries with lower
labour costs exhibit an higher degree of competitiveness. In particular, Myant et al. (2016)
observe that during the double-dip recession internal devaluation has been used in order to
reduce current account imbalances; Angelini et al. (2015) compare the experiences of internal
devaluation in Germany and Spain and find that lower wage and price mark-ups led to an increase
in competitiveness; Stockhammer and Sotiropoulos (2014) estimate the effect of domestic demand
and ULC on current account, in order to assess the costs of internal devaluation.
Applying these findings to our analysis, a persistent rise in energy prices can give a compar-
ative advantage to countries with lower and more stable UECs. The difference in UECs can be
ascribed to several factors, e.g. lower-UEC can be the result of domestic energy resources, less
ambitious climate and energy policies - relying on cheaper fuels and/or disregarding their effects
on the environment - or the fact that some countries shield industrial users from taxation on
energy products.
Before studying how UECs affect trade among EA countries, it is important to recall that
adopting the euro has boosted per se the trade opportunities within the common currency area.
This result is widely corroborated by the literature. Since Glick and Rose (2002) a large body of
literature has investigated this issue. Most of the studies have found a large and positive effect
on trade; more recently, Glick and Rose (2016) revised downward their results. Rose (2017)
provides a short review of the papers on EMU effect on trade:20 he finds that there are about 45
papers on this topic (with only six reporting negative effects) and that the contribution of EMU
to trade growth (that most of the studies estimate in the neighbourhood of 20%) varies because
19 We use the share of value added of Agriculture, forestry and fishing; Arts, entertainment and recreation, other
service activities, activities of household and extra-territorial organizations and bodies; Construction; Industry
(except construction); Information and communication; Professional, scientific and technical activities; adminis-
trative and support service activities, Public administration, defense, education, human health and social work
activities; Real estate activities; Wholesale and retail trade, transport, accommodation and food service activities.
20 There are several papers that review this literature like Rose and Stanley (2005) and Havranek (2010).
16different countries and years are selected to define the sample. Camarero et al. (2018) find
that the effect of the euro on trade has been positive and significant also through the stimulus
of foreign direct investments. A different perspective is presented by Mika and Zymek (2017)
that, focussing on the experience of countries that recently joined EA, revise the trade benefits
of euro membership arguing that estimates from an appropriately specified and estimated gravity
equation do not support the notion of a euro effect on trade flows based on the experience of euro
adopters to date.
Figure 7. Export (levels)
A graphical inspection confirms the positive impact of joining EA on trade: as Figure 7
shows, the growth in total exports of EA members clearly diverges, compared with that of EU
countries that opted out, since 1999 when the Euro was adopted. We find the same pattern for
those countries that joined EA since 1999 and for those that joined EU before 1995 (second panel
of Figure 7). This result is also substantiated by a pre-treatment common trend test (see Table
5).
This effect is also confirmed by a multivariate analysis: we mantain as in Section 4.1 the
structure of our gravity model using socio-economic characteristics of both exporter and importer
countries and bilateral fixed effects that absorb time invariant unobserved variables.
Following Santos Silva and Tenreyro (2010), we use a diff-in-diffs approach in a gravity model
framework where the treated group includes countries that joined the EA while the control group
is composed by the EU countries that didn’t join (e.g. the UK, Denmark, Sweden etc...), since
these countries are subject to the same institutional setting (the EU trade framework).
In order to strengthen our estimates against the risk of misspecification (e.g some results
can be driven by the comparison of manufacturing-based economies with service-based ones), all
specifications include the countries’ sector compositions.
In line with the empirical literature, in the model we also use as controls a set of interactions
of time-dummies together with the bilateral fixed effects, in order to take into account that not
all countries joined the EA (the treatment) in the same year. At the same time, because the
majority of EA countries adopted the euro in 1999, we also include a common time trend.
We use the following specification:
Expspit = αXsit + ωWpt + βU ECsit + νEUst + θEUpt + ϕEAst + ψEApt + t + λspi + spit .
17where EAst /EApt is a dummy equal to one if country s/partner p joined the EA at time t (the
same representation is used for the EU dummy). According to this specification ϕ represents the
causal effect on export of being part of the EA.
In line with the literature, the estimates corroborate that joining the EA had a positive effect
on trade (Table 8): this effect is larger when only intra-EU trade is considered (columns (3)-(8)).
As in the previous analysis, we consider export for all counterpart (column (1)-(2)) and then we
exclude the Rest of the World, US and China as commercial partners (columns (3) and (9)).
These results are confirmed in all specification, also when we consider the economic structure
of the counterpart economy - column (7) - and also when the China import share effect is
considered - column (8). In order to see if the results are somewhat influenced by the presence of
countries in the upper tail of the export distribution, we also removed Germany from the group
of the treated. The results remain substantially unchanged (see column (9) of Table 8).21
If the EMU has been beneficial for trade, we want though to examine if the benefit of joining
has been lower for high-UEC countries. In practice we explore if the adoption of the euro
changed the elasticity of exports to UEC. We then add to the previous model an interaction
between U ECsit and the treatment dummy variables (EAst ).
The new specification is the following:
Expspit = αXsit + ωWpt + βU ECsit + νEUst + θEUpt + ϕEAst + ψEApt + ψEAs ∗ U ECsit +
%EUst ∗ U ECsit + ρEUpt ∗ U ECsit + φEAst ∗ U ECsit + πEApt ∗ U ECsit + t + λspi + spit ,
where φ measures how exports change with the interaction between U ECsit and EAst : this can
be seen both as the differential effect of UEC on export for EA countries or as the benefit of
joining the EA, considering the relevance of energy cost in the production.
Table 9 reports the estimates that confirm a differential UEC effect on trade among countries
that adopted the Euro. Those that joined the EA show a even more negative elasticity of trade
to UEC. This is further amplified if we limit the analysis to intra-EU trade (columns (2)-(8)).
Additionally, to avoid the risk that our results are somehow influenced by a trend (general or
industry specific) that links UEC and trade, we include a common time trend (see columns (3)
and (5)) and a industry-time trend (see columns (6)-(8)); also these specifications corroborate
that UECs matter for international competitiveness.22
For the countries that joined the EMU, the link between exports and UEC is negative and
different from zero as shown in Table 9 and in Figure 8, that displays a non-parametric confidence
interval of the estimates derived as follows. First we boostrap 1,000 EA-specific parameters using
the model corresponding to column (1) of Table 9; we then fit these coefficients using the UEC
observed in the sample; we use the empirical distribution of the fitted values to compute a 95%
confidence interval. 23
21 Between 1999 and 2015, EA export in nominal terms grew of about 140%; excluding Germany, EA export
would have increased by about 100% while in the same period German export grew of about 250%.
22 Shengwu et al. (2017) , following Puhani (2012), argue that in case of non-linear models (in particular with
a Poisson link function), the interaction parameters cannot be considered as the difference in semi-elasticity and
propose a solution to fix this issue; in the bottom of Table 9 we show some estimates of the interactions that uses
the same kind of adjustment.
23 The central line is based on the mean of the replications while the upper and lower bound are computed
taking upper and lower 2.5 percent of the empirical distribution.
18Figure 8. The relationship between export and UEC: differential effect for EA countries
6 Conclusions
The EU is the world biggest trader and free trade among its members is one of its founding
principles. The Economic and Monetary Union took the European process of economic inte-
gration one step further. Moreover, since 2007, the EU started to pursue a common climate
and, de facto, energy policy, taking the leadership in the climate arena establishing targets (for
climate, renewable energy and energy efficiency) and setting up the biggest cap-and-trade system
in the world. Since then, these policies, although lately with less political emphasis, have been
reiterated and extended to 2030.
How these different strategies interact is not completely understood. EU climate and energy
policies are putting upward pressure on energy prices (for the extra-costs implied by a full-
fledged EU ETS, RES subsidization and carbon taxation) with a potential detrimental effect on
the competitiveness of the European industry. But on the other hand the EMU has shielded the
EA members from the price spike occurred in the first decade of the 2000.
In order to study the drivers of energy costs and the link between their dynamics and export
we propose a new formulation of the Unit Energy Cost (UEC). To estimate this indicator we
merge Eurostat data - at a year*country*sector level - covering information on production, value
added and energy mix, energy prices and external trade.
In the first decade of the century energy purchases in the EU manufacturing sector were
roughly a seventh of labour cost. This ratio has been constantly increasing in the following
years, reaching more than a quarter of labour costs in the latest period. The evolution of EU
UEC, assessed by considering the cumulative growth of its components in the last 20 years, shows
that final prices (mainly driven by their fiscal and parafiscal components) have played a key role
19in sustaining UEC growth, somewhat counterbalanced by an increase in energy efficiency; these
trends has been very similar among the bigger EU countries.
We find a causal link between RES deployment and industries’ energy cost for European
countries, with a large heterogeneity among EU countries: in case of Italy in the period 1995-
2015 the contribution of RES deployment to total UEC growth has been between a sixth and
a fourth. If the effects of future energy and climate policies on UECs will be similar of what
happened in the past we can expect that EU manufacturing sector will be seriously impacted
unless analogous initiatives are adopted across the board at the global level, such as the carbon
border tax that re-entered in the EU policy debate with the Green New Deal proposal. 24
As it happens for ULC, we suggest to use some kind of energy cost indicator in monitoring
country competitiveness: a possibility is to add UEC to the Countries’ Macroeconomic Imbalance
Procedure (MIP) prepared by the European Commission. This would add information to the
current analyses that only asses differences in energy prices (with no clues neither on the quantity
of energy used nor on the level or the evolution of energy intensity). Filling this data gap would
improve the understanding of the link between energy and climate policies, firms’ costs and firms’
features such as sector specialization, mark-up and, in general, EU firms’ ability to compete on
the international markets.
Finally, using a gravity model, we find a negative relationship, statistically different from
zero, between UEC and exports, with an elasticity ranging from 0.07 to 0.09. Considering the
relative change in UECs in the last decade (+29% between 1995 and 2015) this corresponds to
a cumulative reduction of export by almost 2.5 percentage points. Our estimates suggest, as
expected, a greater response of exports with respect to UEC in energy intensive sectors.
When evaluating UEC effect on trade among Euro members we find that countries that joined
the EMU show a persistently larger elasticity. This can be interpreted as a sign that the benefits
of joining the EA, although positive, decrease as energy costs soar.
Our results recall the risk that a long-lasting increase in energy costs can make European
products less price-attractive. Therefore, if we want to limit the negative impact that a renovated
effort to decarbonize the European economies can have on industrial competitiveness there is the
need to push forward the integration of European energy markets (as envisaged in the Energy
Union and in the Winter package).25 Finally a better coordination of the EU climate and energy
policies (such as a common carbon taxation on non-ETS sectors’ emissions or a design of common
EU incentives to promote energy efficiency) could help in reducing the UEC heterogeneity within
the EU.
24 The practical setup of a carbon border adjustment, that does not violate the WTO legal framework, must
overcome significant challenges: technical feasibility, data availability, the risk of retaliation (Rocchi, Serrano,
Roca, and Arto 2018)
25 For example the integration of European electricity and gas markets (such as a common European capacity
and reserve mechanism) can scale down system costs reducing the need for a large generation capacity (Bockers,
Haucap, and Heimeshoff 2013).
20References
Abeberese, A. (2017): “Electricity Cost and Firm Performance: Evidence from India,” The
Review of Economics and Statistics, 99(5).
Amici, M., E. Bobbio, and R. Torrini (2017): “Patterns of convergence (divergence) in the
euro area: profitability versus cost and price indicators,” Bank of Italy Occasional Papers,
(415).
Andersen, M. S., and P. Ekins (2009): Carbon-energy taxation: lessons from Europe.
Angelini, E., A. Dieppe, and B. Pierluigi (2015): “Modelling internal devaluation experi-
ences in Europe: Rational or learning agents?,” Journal of Macroeconomics, 43, 81 – 92.
Arlinghaus, J. (2015): “Impacts of Carbon Prices on Indicators of Competitiveness: A Review
of Empirical Finding,” OECD Environment Working Papers, (87).
Baldwin, R., and D. Taglioni (2006): “Gravity for Dummies and Dummies for Gravity
Equations,” (12516).
Bayoumi, T., R. Harmsen, and J. Turunen (2011): “Euro Area Export Performance and
Competitiveness,” IMF Working Paper, (11).
Bockers, V., J. Haucap, and U. Heimeshoff (2013): “Benefits of an integrated European
electricity market,” .
Caliendo, L., M. Dvorkin, and F. Parro (2015): “Trade and Labor Market Dynamics:
General Equilibrium Analysis of the China Trade Shock,” Working Papers 2015-9, Federal
Reserve Bank of St. Louis.
Camarero, M., E. Gómez-Herrera, and C. Tamarit (2018): “New Evidence on Trade and
FDI: how Large is the Euro Effect?,” Open Economies Review, 29(2), 451–467.
Costantini, C., and V. Mazzanti (2012): “On the green and innovative side of trade com-
petitiveness. The impact of environmental policies and innovation on EU exports,” Research
Policy, 41, 132–153.
Egger, P., and M. Pfaffermayr (2003): “The proper panel econometric specification of the
gravity equation: A three-way model with bilateral interaction effects,” Empirical Economics,
28(3), 571–580.
European Commission (2014a): Energy Costs and EU Industrial Competitivenesschap. 6, pp.
185–212. SWD(2014)277.
(2014b): “Energy prices and costs report,” Discussion paper.
(2016): “EU Reference Scenario 2016. Energy, transport and GHG emissions Trends to
2050,” Discussion paper.
Faiella, I., A. Bartocci, E. Brodi, A. Felettigh, A. Mistretta, F. Natoli, and
L. Painelli (2016): “La Rivoluzione Silenziosa delle Energie Rinnovabili,” Mimeograph.
Faiella, I., and A. Mistretta (2015): “Spesa energetica e competitività delle imprese ital-
iane,” Economia Pubblica, 42(3).
21Flues, F., and B. Lutz (2015): “Competitiveness Impacts of the German Electricity Tax,”
OECD Environment Working Papers, (88).
Gerster, A. (2017): “Do electricity prices matter? Plant-level evidence from German man-
ufacturing,” Ruhr Economic Papers 672, RWI - Leibniz-Institut für Wirtschaftsforschung,
Ruhr-University Bochum, TU Dortmund University, University of Duisburg-Essen.
Giordano, C., and F. Zollino (2015): “Exploring Price and Non-Price Determinants of Trade
Flows in the Largest Euro-Area Countries,” ECB Working Paper, (1789).
Glick, R., and A. K. Rose (2002): “Does a currency union affect trade? The time-series
evidence,” European Economic Review, 46(6), 1125–1151.
(2016): “Currency unions and trade: A post-EMU reassessment,” European Economic
Review, 87(C), 78–91.
Gourieroux, C. (2000): Econometrics of Qualitative Dependent Variables, Themes in Modern
Econometrics. Cambridge University Press.
Havranek, T. (2010): “Rose effect and the euro: is the magic gone?,” Review of World Eco-
nomics, 146(2), 241–261.
Head, K., and T. Mayer (2014): “Chapter 3 - Gravity Equations: Workhorse,Toolkit, and
Cookbook,” in Handbook of International Economics, ed. by G. Gopinath, E. Helpman, and
K. Rogoff, vol. 4 of Handbook of International Economics, pp. 131 – 195. Elsevier.
IEA (2017): “World Energy Outlook,” Discussion paper, International Energy Agency, Paris.
Kaltenegger, O., A. Loschel, M. Baikowski, and J. Lingens (2017): “Energy costs in
Germany and Europe: An assessment based on a (total real unit) energy cost accounting
framework,” Energy Policy, 104, 419 – 430.
Kepaptsoglou, K., M. Karlaftis, and D. Tsamboulas (2010): “The Gravity Model Speci-
fication for Modeling International Trade Flows and Free Trade Agreement Effects: A 10-Year
Review of Empirical Studies,” The Open Economics Journal, (3), 1–13.
Martin, R., L. B. de Preux, and U. J. Wagner (2014): “The impact of a carbon tax on
manufacturing: Evidence from microdata,” Journal of Public Economics, 117, 1–14.
Mika, A., and R. Zymek (2017): “Friends Without Benefits? New EMU Members and the
“Euro Effect” on Trade,” Discussion paper.
Myant, M., S. Theodoropoulou, and A. Piasna (2016): Unemployment, internal devalua-
tion and labour market deregulation in Europe. European Trade Union Institute.
Porter, M. E., and C. van der Linde (1995): “Toward a New Conception of the Environment-
Competitiveness Relationship,” Journal of Economic Perspectives, 9(4), 97–118.
Puhani, P. (2012): “The treatment effect, the cross difference, and the interaction term in
nonlinear difference-in-differences models,” Economics Letters, 115(1), 85 – 87.
Rammer, C., S. Gottschalk, M. Peneder, M. Wörter, T. Stucki, and S. Arvanitis
(2017): “Does energy policy hurt international competitiveness of firms? A comparative study
for Germany, Switzerland and Austria,” Energy Policy, 109, 154 – 180.
22Ramsey, J. (1969): “Test For Specification Errors in Classical Linear Least Squares Regression
Analysis,” Journal of the Royal Statistical Society. Series B, 31.
Ratti, R. A., Y. Seol, and K. Yoon (2011): “Relative energy price and investment by
European firms,” Energy Economics, 33(5).
Rentschler, J., and M. Kornejew (2017): “Energy price variation and competitiveness:
Firm level evidence from Indonesia,” Energy Economics, 67, 242 – 254.
Rocchi, P., M. Serrano, J. Roca, and I. Arto (2018): “Border Carbon Adjustments Based
on Avoided Emissions: Addressing the Challenge of Its Design,” Ecological Economics, 145,
126 – 136.
Rose, A. K. (2017): “Why do Estimates of the EMU Effect on Trade Vary so Much?,” Open
Economies Review, 28(1), 1–18.
Rose, A. K., and T. D. Stanley (2005): “A Meta-Analysis of the Effect of Common Currencies
on International Trade ,” Journal of Economic Surveys, 19(3), 347–365.
Santos Silva, J., and S. Tenreyro (2006): “The Log of Gravity,” The Review of Economics
and Statistics, 88(4), 641–658.
(2010): “Currency Unions in Prospect and Retrospect,” Annual Review of Economics,
2(1), 51–74.
Sato, M., and A. Dechezlepretre (2015): “Asymmetric industrial energy prices and inter-
national trade,” Energy Economics, 52, S130 – S141, Frontiers in the Economics of Energy
Efficiency.
Shengwu, S., N. Erik, and F. Maoyong (2017): “Interaction Terms in Poisson and Log
Linear Regression Models,” Bulletin of Economic Research, 70(1), E89–E96.
Stockhammer, E., and D. P. Sotiropoulos (2014): “Rebalancing the Euro Area: The Costs
of Internal Devaluation,” Review of Political Economy, 26(2), 210–233.
23You can also read