Stated Willingness to Pay for Residential Renewable Electricity and Green Jobs in Aguascalientes, Mexico
←
→
Page content transcription
If your browser does not render page correctly, please read the page content below
Stated Willingness to Pay for Residential
          Renewable Electricity and Green Jobs in
                  Aguascalientes, Mexico ∗
               Adán L. Martı́nez-Cruz1,2,3 and Héctor M. Núñez2
 1
     Department of Forest Economics and Centre for Environmental and Resource
Economics (CERE), Swedish University of Agricultural Sciences (SLU), Sweden
     2
         Department of Economics, Centro de Investigacion y Docencia Economicas
                                      (CIDE), Mexico
          3
              Center of Economic Research (CER-ETH), ETH Zurich, Switzerland

                                                                                          Draft
                                         Abstract
               Via a discrete choice experiment, this paper documents that resi-
           dential electricity consumers in Aguascalientes, Mexico, are willing to
           pay a premium for renewable energies as well as for the creation of
           green jobs. These results are particularly timely because the current
           Federal administration has redirected priorities from an energy transi-
           tion that was expected to boost renewable energies to the pursuing of
           energy sovereignty. Concerns regarding this prioritization have been
           raised by national and international stakeholders due to its potential
           economic inefficiency and its implications for the achievement of cli-
           mate change goals. These concerns have only intensified as discussions
           begin on how Mexico should face the post-coronavirus recession. This
           paper’s findings open the door to discuss whether a combination of a
           just energy transition together with the boosting of renewable energies
           should be part of a strategy to reach energy sovereignty at the same
           time that Mexico deals with a post-coronavirus world.
               JEL Classification: Q42, Q48, Q51.
               Keywords: Residential renewable electricity demand; just energy
           transition; post-coronavirus policy; energy sovereignty; Mexico; dis-
           crete choice experiment.

     ∗
     E-mail addresses:       adan.martinez.cruz@slu.se (A. Martı́nez-Cruz)     and hec-
tor.nunez@cide.edu (H.M. Nuñez)
1 Introduction
As part of the global commitment to tackle climate change, Mexico’s Congress
approved in 2012 the General Law on Climate Change which mandates the
crafting of a comprehensive long-term national climate policy. Following suit,
2015’s Energy Transition Law aims to transform Mexico’s energy sector by
adopting clean energy technologies and targets, including decarbonization
strategies for the electricity sector (SENER, 2018b).
Since 2018, a change in Federal administration has led to new priorities.
In particular, the focus is now on energy sovereignty —which is a concept that
reflects the intention of bringing the energy industry back under government
Draft
control (Gross, 2019). Consequently, without backing off from international
agreements or contracted commitments, the current Federal administration
has implemented measures that effectively slow down the energy transition
in general, and the promotion of renewable energies in particular. Two in-
stances of such measures are the cancellation of what would have been Mex-
ico’s fourth clean energy auction, and the modernization of existing power
plants which primarily run on coal, fuel oil, and natural gas (Davis, 2019).
In addition, public remarks from Mexico’s president seem to suggest a pre-
conception against renewable energies —in referring to a wind power plant
built with support from Federal and State governments during a previous
administration, the president stated that this plant is an example of visual
pollution, and it only produces benefits to private owners who sell the energy
to consumers in USA (Infobae, 2020).
This change in priorities has been received with concerns from both na-
tional and international stakeholders because of its potential negative im-
plications for climate change goals, its potential economic inefficiency, and
the uncertainty it generates (Davis, 2019; Gonzalez, 2019; Nava, 2020; Pro-
ceso, 2020; Stromsta, 2019). Such concerns have only intensified as discus-
sions begin on how Mexico should face the post-coronavirus recession (see
1Castañeda-Morales, 2020; Levy, 2020).
In this context, two policy-relevant findings are highlighted in this docu-
ment. First, residential electricity consumers in Aguascalientes City report
that they are willing to pay a bimonthly premium up to 23 Mexican pesos
(2018 MXP) for an increase in the share of renewable energy in their elec-
tricity mix. Second, consumers are also willing to pay a bimonthly premium
up to MXP 59 for the creation of green jobs. According to our findings,
a policy that achieves a 30% biomass share together with the creation of
1,000 new green jobs would generate benefits among residential consumers
in Aguascalientes equivalent to MXP 63 (USD 3.28) on a bimonthly basis.1
Strictly speaking, these findings hold for consumers responding our sur-
Draft
vey in Aguascalientes city, and further research is necessary to claim national
or other scale representativeness. With this caveat in mind, we believe that
this paper’s findings highlight an opportunity that the current administra-
tion may be overlooking when pursuing energy sovereignty. That is, policy
makers can generate societal benefits through a policy that simultaneously
boosts renewable energies and encourages that workers currently employed
in fossil fuel-based industries transition to jobs in renewable energy-based in-
dustries. The latter goal is at the core of a just energy transition —a concept
that has been put forward to guide the designing of strategies that aid those
whose jobs, income, and livelihoods are at risk as the world pursues sustain-
able pathways (Rosemberg, 2017). In section 7, we discuss how this paper’s
findings may inform a just energy transition, and emphasize that this policy
is also desirable to overcome the post-coronavirus recession in Mexico. In
this sense, our results may help other regions in the world as policy guidance
for the challenge of overcoming the recession while maintaining the goal of
achieving energy transitions.
This paper’s findings arise from the implementation of a Discrete Choice
1
Assuming an exchange rate of 19.22 MXP/USD which was the average closing price
in 2019 (Macrotrends, 2020).
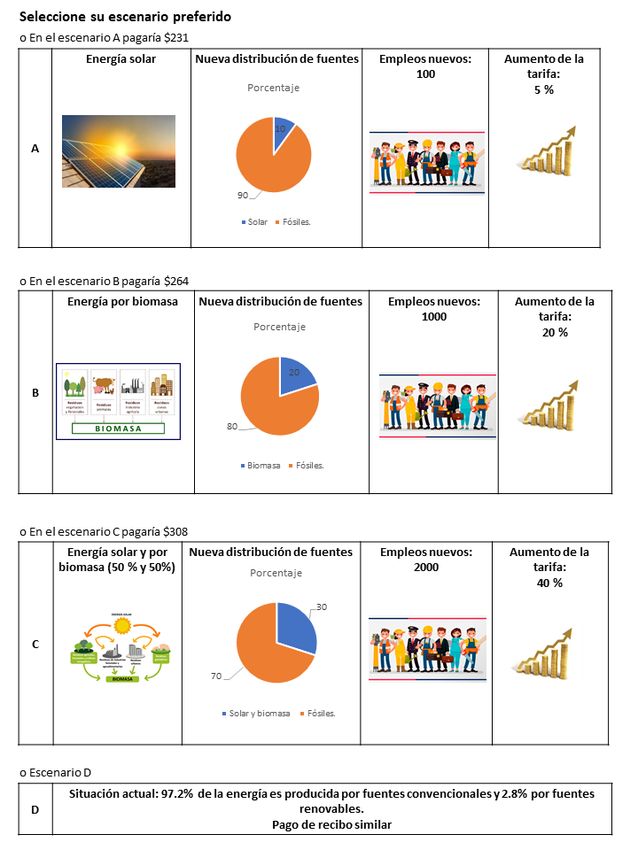
2Experiment (DCE) that presents respondents to four alternatives. One al-
ternative is the status quo option, and the other three are described in terms
of four attributes. The first attribute refers to the source of renewable energy
—solar, biomass, and a 50/50 mix of both. The second attribute is percent-
age of renewable energy (from any source) in current electricity mix —10%,
20%, and 30%. The third attribute is number of green jobs —100, 1,000,
and 2,000— which are described as new jobs created in the renewable energy
sector.
The price attribute is presented as an increase in respondents’ self-reported
bimonthly electricity bill —5%, 20%, and 40%. Importantly, the hypothetical
increase in bill is not explained to respondents as resulting from an increase
Draft
in electricity tariff —which would be unrealistic in this context because of the
increasing block tariff scheme in Mexico. Instead, the hypothetical increase
comes from an opt-in extra fee (holding tariffs unchanged) that would com-
pensate for an increase in the share of electricity generated with renewable
energies.
The rest of this manuscript is organized as follows. Section 2 summarizes
previous DCE studies that have documented stated preferences for residential
renewable energy. Section 3 describes the current Mexican energy policy and
its implications for the promotion of renewable energies. Section 4 describes
the theoretical and empirical strategies supporting our analysis. Section 5
explains the design of our DCE, describes the data collection strategy, and
reports descriptive statistics. Section 6 reports econometric specifications
and welfare estimates, and discusses how these estimates compare to those
in previous studies. Section 7 discusses how this paper’s findings can inform
current energy policy of Mexico. Section 8 reports the limitations of this
study and further research needed.
32 Previous studies
There is a well-established literature on stated preferences for residential re-
newable electricity. Findings from this literature have been consolidated in
one literature review (Oerlemans et al., 2016), and four meta-analyses (Ma
et al., 2015; Soon and Ahmad, 2015; Sundt and Rehdanz, 2015; Pokhrel,
2016). Through this section, when referring to these five studies altogether,
we call them synthesizing studies. Oerlemans et al. (2016) carry out a litera-
ture review of 57 studies implementing a contingent valuation (CV) protocol
to estimate WTP for residential renewable electricity —with a focus on iden-
tifying areas of potential improvement to deliver more reliable estimates.
Draft
The four meta-analyses differ in the welfare measures under analysis.
Also, the number and subset of primary studies are different —although
the subsets largely intersect. Ma et al. (2015) analyze 142 WTP estimates
expressed as perpetual payment per kWh (in 2006 USD), and reported in
29 primary studies. Pokhrel (2016) studies 99 WTP estimates measured as
monthly 2008 USD per household, obtained from 21 primary studies. Soon
and Ahmad (2015) focus on 124 WTP estimates expressed as monthly 2013
USD per household, reported in 30 primary studies. Sundt and Rehdanz
(2015) analyze 85 WTP estimates reported by 18 primary studies, and ex-
pressed either as monthly 2010 USD per household or US-cents per kWh.
In terms of empirical methods, these synthesizing studies report that CV
and DCE are the two most common methods collecting stated preferences
for residential renewable energy. CV studies have predominantly used di-
chotomous choice and open-ended questions to elicit WTP (Oerlemans et al.,
2016). More recently, vignette designs have made their way into this lit-
erature. A vignette study uses short descriptions of situations or persons
(vignettes) that are shown to respondents in order to elicit their judgments
about these scenarios (Atzmüller and Steiner, 2010).2 Researchers have im-
2
Vignette scenarios resemble alternatives presented by DCE in the sense that they are
4plemented vignette designs to explore household’s preferences for electric-
ity mixes (that may include renewable energies) in post-Fukushima Japan
(Rehdanz et al., 2017), and residential consumers’ preferences for renewable
energies and supply reliability in Germany and Great Britain (Merk et al.,
2019).
In terms of geographical coverage, all five synthesizing studies report that
stated preferences for residential renewable energy have been studied mostly
in the U.S., Canada, some EU countries, China, South Korea, and Japan
(Sundt and Rehdanz, 2015; Soon and Ahmad, 2015). Latin America, Africa,
and in general less developed countries are the regions with the least number
of studies.
Draft
Publication bias seems to not be present in the literature documenting
stated WTP for residential renewable electricity.3 In the context of studies
estimating stated WTP for residential renewable electricity, it is important
that authors and journals report not only positive, statistically significant
estimates but also zero-WTP and negative WTP estimates —as these values
are theoretically feasible as well. Focusing on different subsets of primary
studies, Ma et al. (2015) and Soon and Ahmad (2015) report Begg’s test
statistics that suggest lack of publication bias.
Results highlighted by the meta-analyses include i) residential consumers’
WTP for renewable electricity differs depending on the source of energy —
with solar and wind energies being more valued than hydropower and biomass
(Ma et al., 2015; Sundt and Rehdanz, 2015); ii) metropolitan residents report
higher WTP than their rural counterparts (Soon and Ahmad, 2015); iii) U.S.
and Canada residents report higher WTP than residents in other parts of the
designed to experimentally vary the levels of theoretically important vignette characteris-
tics (or attributes).
3
The term publication bias refers to the systematic preference (from either authors
or journals or both) to select publications that report statistically significant associations
between the outcome variable and the explanatory variable of main interest in a research
project.
5world (Soon and Ahmad, 2015; Sundt and Rehdanz, 2015); iv) respondents’
socioeconomic characteristics (e.g. income, electricity consumption level) and
knowledge about renewable energies are relevant to explain heterogeneity in
WTP (Ma et al., 2015; Pokhrel, 2016; Soon and Ahmad, 2015; Sundt and
Rehdanz, 2015); and v) characteristics of the study itself statistically explain
variations in the WTP (Ma et al., 2015; Pokhrel, 2016; Soon and Ahmad,
2015; Sundt and Rehdanz, 2015).4
The meta-analyses reach different conclusions in two realms. First, while
Soon and Ahmad (2015) report that DCE studies yield lower estimates than
CV studies, the opposite direction is reported by Ma et al. (2015); Pokhrel
(2016) and Sundt and Rehdanz (2015). Second, they differ in terms of their
Draft
conclusion with respect to the reliability of benefit transfers based on their
corresponding meta-regressions.5 Ma et al. (2015) cautions against benefit
transfer because their analysis yields that characteristics of the study design
weigh more than other factors when explaining variation in WTP. Pokhrel
(2016) documents that a unit value transfer with income adjustment out-
performs several meta analytic strategies. Soon and Ahmad (2015) do not
pursue the transfer of benefits —deeming it controversial. With the caveat
that their transfers are unreliable when dealing with biomass, Sundt and
Rehdanz (2015) report a median percentage error of 21% for the transfer of
WTP per household per month –an error that falls within previous reported
ranges.
Our analysis contributes to evaluating the case of stated preferences for
renewable energies in a less developed country. The focus on the Mexican case
4
The impact from studies’ design is an undesirable result —as ideally the instrument
with which data is collected is expected to be uninformative of the resulting estimates.
However, an advantage of a meta-analysis is that researchers can learn how important the
instrument is itself and take it into consideration accordingly.
5
In this paper’s context, benefit transfer refers to estimating WTP for residential renew-
able electricity for a population for which no primary data is available. Such estimation
is carried out by transferring estimated obtained on a different population that, under
specific assumptions, is deemed informative of the unstudied population.
6also stems from the fact that current administration is changing priorities to
energy sovereignty over climate and clean energy goals.
3 Energy policy in Mexico
3.1 Energy Transition: 2013-2018
Mexico’s previous administration (2013-2018) signed important international
environmental agreements and pushed an energy reform at a high political
cost to promote a competitive market across the whole supply chain in the
electricity and fuel markets, with renewable energy one of the priorities. En-
vironmental goals of Mexico were set to an unconditional 22% reduction of
Draft
the greenhouse gases (GHG) emissions respect to a baseline scenario by 2030,
and specifically a 31% GHG emissions reduction by the generation electricity
sector by the same year (updated 2018 “General Law on Climate Change”).
Concurrently, Mexico has committed to an energy transition during the last
and following years. In 2015, through the Energy Transition Law (ETL),
the Mexican government committed to 30% of clean electricity by 2021 –and
35% by 2024 (Mexican 2015 “Energy Transition Law”). As a result, Mexico
increased the production of clean electricity at a rate of 4.8% annual average
from 2014 to 2018, and reached a 23.1% share into the electricity mix of
which 6.5% corresponds to efficient co-generation and nuclear power and the
remaining 16.6% to renewable sources (SENER, 2019, 2018d). Renewable
power increased by only 1.0% over the same period, while its contribution to
the electricity supply decreased from 18% to 16%. These two issues relate
to the reduction in hydropower generation. However, the installed capacity
of other sources (i.e. wind, geothermic, biomass, solar, and biogas) has dra-
matically increased. For instance, solar and biogas installed capacity went
up from 461 MW and 89 MW in 2017 to 1647 MW and 217 MW in 2018,
respectively (SENER, 2018e). Their potential is still quite large, solar and
bioenergy estimated installed capacity will be 11,661 MW and 1,478 MW
7by 2032, respectively SENER (2018b). It is worth noticing that solar isola-
tion in Mexico is larger than 5 kWh/m2/day, one of the largest worldwide
(Hancevic et al., 2017).
In intersection with the clean energy goals, ETL has promoted natural
gas (NG) use in new power plants as well as modernization of existing con-
ventional plants under the argument that NG is cleaner than other fossil fuels
and price is significantly lower. This transition includes to shut down high
emission power plants, like coal-fired power plants. From an aggregated point
of view, it is expected new green jobs to be able to compensate job losses
from closed down plants, but at regional level this does not necessarily hold.
For instance, coal-fired power plants in the states of Coahuila and Guerrero
Draft
are expected to be retired by 2030, which will affect directly local communi-
ties, since plants and coal mines represent the most important source of jobs
in the region.
Finally, ETL aims to promote a competitive market across all the supply
chain in the electricity and fuel markets. In the former case, the first step has
been to let private companies enter to power market and compete with CFE.
The previous administration implemented three successful auctions to add 7
GW of energy (about 6% of the projected installed capacity in 2032) from
solar, wind, and geothermal to the system in the following 15 to 20 years
(SENER, 2019). In addition to the auctions, there are two other schemes to
promote the development of renewable energies. First, the introduction of
Clean Energy Certificates, which were created to ensure increasing annual
shares of clean energy market. Second, promotion of distributed generation
projects for the residential sector. The latter alternative has made small
progress in the country and a massive program can threat financial viability
of electricity companies (see Hancevic et al., 2019).
The following transition steps should allow private companies to compete
in the rest of the supply chain, including the retail market. A change in
tariff scheme would have been required to let private retailers offer a com-
8petitive portfolio to consumers with a large variety of characteristics. For in-
stance, one scheme that includes shares of renewable as part of the electricity
sold. However, such change will face a high obstacle. As mentioned, residen-
tial electricity consumption in Mexico is heavily and horizontally subsidized
through a increasing block tariff (IBT) schedule. On average, households
only pay 46% of the total cost of the service –i.e., generation, transmission,
distribution and retail costs. Reducing this subsidy would imply high polit-
ical costs for any administration, so the one in turn usually maintains the
IBT schedule unchanged. As expected previous and current administrations
have maintained it untouched.
Draft
3.2 New energy sovereignty: 2019-
New administration (2019-2024), which was elected in 2018 with a vast ma-
jority, has changed radically to new priorities. In particular, the focus is
now on energy sovereignty – aiming to bring the energy industry back under
government control through the monopoly publicly owned company (CFE)
and decreasing imports of refined fuels (Gross, 2019). One of the first signals
of the new direction has been to hold up the fourth auction indefinitely. The
federal government argues that renewable energy is too expensive because
needs from cheap fossil fuel power to connect to the grid and becuase only
benefits some few private companies (e.g. Méjia and Saldaña, 2019; Infobae,
2020). Although it has committed to comply with the clean energy goals,
it is expected to do it using more NG than renewable energies. Another
important signal has been to invest significant resources both in the CFE to
build new fossil fuel based plants, to renew some of the current power plants,
and to postpone some shutting down plans, including the coal-fired power
plants. Fossils have also been boosted by important investments from the
government to the oil company (PEMEX) and the building of a major oil
9refinery, which is expected to be ready by 2023.6
Nevertheless, electric sovereignty is in question still. NG is the main fuel
used for electricity generation in Mexico (68%). Mexico currently imports
more than 60% of the NG required to satisfy domestic demand mainly from
the U.S., and the electricity sector claims more than 50% of that amount
(SENER, 2018c, 2019). This trend is expected to remain at a similar level
in the coming years (SENER, 2018c). As explained above, the high levels
of NG consumption are explained in part by the transition toward cleaner
and cheaper fuels in recent years and the low NG price in the US (SENER,
2018d).
Draft
3.3 Renewable energies in Aguascalientes
Mexico government follows a federal system under which states and mu-
nicipalities have certain autonomy to legislate in matters that are not the
exclusive competence of the federation and to spend autonomously some re-
sources. For this case, states and municipalities may take further steps to
support renewable energies, and therefore green jobs in their regions. Incen-
tives includes but are not limited to property tax exemptions to renewable
plants and/or their tier companies, training human capital on energy issues
at the states universities, waste recovering and recycling, among others. Con-
versely, they cannot take direct measures to avoid power plants’ close downs.
The city of Aguascalientes is the capital of the state with the same name,
it has an area of 385 km2 and about 1 million residents. It is located in a
semi-arid region, with a high potential and an installed capacity for solar
and a medium-high potential for biomass (IRENA, 2018; SENER, 2018a,d).
Aguascalientes state is home for two 250 MW solar parks already connected
to the grid and will host about additional 570 MW (SENER, 2019). The
6
See report from president López Obrador after his first year of ad-
ministration in “Primer Informe de Gobierno” at https://framework-
gb.cdn.gob.mx/informe/Informe Gobierno de Mexico.pdf
10state is estimated to have an annual power generation potential of 1350 TJ
from urban solid waste and wastewater, which is a high potential for a small
region (SENER, 2018a). In addition, the local government is committed to
encourage renewable energy further, for instance, by promoting human re-
sources training at state universities, incentivizing PV solar parts companies,
and launching a new waste processing facility for power generation and other
uses.
Whereas the federal government seems to slow down renewable energy
progress in the country, other groups such as state governments could take
steps forward to support it and to comply the ETL and General Law on
Climate Change. CFE can buy this energy and eventually federal adminis-
Draft
tration will realize that consumers are willing to pay for it. Unfortunately, to
the best of our knowledge there is not any source of information or previous
studies to support such policy recommendations. Hence, our study would be
an interesting piece to do so.
4 Theoretical and empirical approaches
4.1 Random Utility Model
The Random Utility Model (RUM) provides theoretical support to the empir-
ical analysis of discrete choice experiments (see Train, 2009). The departure
point of the RUM is that, when faced to J mutually exclusive alternatives,
individual i chooses the alternative that provides him/her with the highest
utility. An individual’s indirect utility from each alternative is denoted as
Uij for i = 1, 2, ..., I and j = 1, 2, ..., J. The individual is assumed to know
his/her own utility function with certainty. The researcher, however, cannot
fully observe each Uij . Thus, from the researcher’s point of view and once a
linear indirect utility function is assumed, Uij can be expressed as
0
Uij = Vij + ij = β xij + ij (1)
11where Vij is the component observed by the researcher; xij is a (M + 1)X1
column vector denoting M alternative-specific attributes and the alternative-
specific intercept; β is a (M +1)X1 column vector representing the alternative-
specific intercept, and the preferences for the alternative-specific attributes;
and ij represents the purely random heterogeneity that the researcher is
unable to observe.
If an individual chooses the alternative associated to the highest utility,
then the individual i chooses Uimax , where
Uimax = max{Ui1 , Ui2 , ......., UiJ } (2)
The willingness to pay (WTP) for the alternative associated to the highest
Draft
utility is expressed as the monetary value of the utility derived from Uimax ,
i.e.,
Uimax
W T Pi = (3)
βp
where W T Pi is individual i’s WTP; and βp is the price preference parameter.
Under the assumption that indirect utility is linear in attributes, including
income, βp is the negative of the marginal utility from income.
Under the assumptions embedded in equation (1), a researcher cannot
observe Uimax as defined in equation (2). A researcher can only make state-
ments in terms of expected utilities which are calculated over the error term
ij , i.e.
E(Uimax ) = E [max{Vi1 , Vi2 , ......., ViJ }] (4)
Under the assumption that ij follow a type I extreme value distribu-
tion, the expected maximum utility can be calculated through the logsum
12formula,7 i.e.
XJ
E(Uimax ) = ln exp(Vij )
j=1
Accordingly, statements involving welfare measures are made in expected
terms. For a before (b) and an after (a) situations —where after implies a
change in the available alternatives—, the expected value of the compensa-
tion variation (CV) due to the change in individual i’s utility is expressed
as
1
E (CVi ) = (E (Uimax,a ) − E (Uimax,b ))
−βp
Draft
J J
1 X
a
X
= (ln exp(Vij ) − ln exp(Vijb )) (5)
−βp j=1 j=1
The marginal willingness to pay (MWTP) can be derive from equation
(5) as follows. Assume attribute q changes in a non-marginal fashion across
all alternatives -i.e. q a = q b + ∆q is the level of q after ∆q has been added
to q b . Introduce the change in q in equation (5) and, because such a change
occurs across all alternatives, factor it 8 . The expected CV can be expressed
as follows
βq
E (CVi [∆q]) = −∆q (6)
βp
where βq is the marginal utility from q.
Equation (6) reduces to the WTP for a marginal change across alterna-
tives when ∆q = 1 —i.e. when the change in q is marginal, and
βq
E (M W T Pi ) = − (7)
βp
Equation (7) can be interpreted as the ratio of the marginal utility from the
attribute that changes and the negative of the marginal utility from income.
7
Pioneer derivations of the logsum formula were independently developed by Ben-Akiva
(1973) and McFadden (1973).
8
Further details can be found in Haab and McConnell (2002).
134.2 Econometric model
Empirical estimations of the parameters required in the calculation of the
expected MWTP (i.e. β̂q and β̂p ) can be obtained via a conditional logit
econometric specification. The departure point of this empirical model is
the same as to establish the theoretical expectations of the welfare measures
under discrete choice modelling —i.e. ij is distributed according to a type
I extreme value distribution. Under this assumption, the probability that
individual i chooses alternative j is expressed as follows
Pij =P r[Vij + ij > Vik + ik ∀k 6= j]
=P r[ij > Vik − Vij + ik ∀k 6= j]
Draft
0
eVij eβ xij
= =P (8)
β 0 xik
P Vik
k∈J e k∈J e
A conditional logit (CL) specification faces two limitations to model em-
pirical discrete choice data (Train, 2009). First, a CL can represent system-
atic variation (i.e. taste variation that is related to observed characteristics)
but not random taste variation (i.e. differences in tastes that cannot be
linked to observed characteristics). Second, the estimation of the CL proba-
bilities implies proportional substitution across alternatives —more flexible,
9
more realistic patterns cannot be fitted with a CL model.
The random parameters logit (RPL) results from adapting the CL model
to incorporate non-systematic heterogeneity in preferences and discard the
proportional substitution across alternatives. The RPL turns out to be a
highly flexible model that can approximate any random utility model (Mc-
Fadden and Train, 2000).
The RPL probabilities are the integrals of standard logit probabilities
over a density of parameters. That is, keeping in mind equation (8), a RPL
9
A third limitation is that a CL is not fitted to capture correlation over time (Train,
2009).
14is a model whose choice probabilities can be expressed in the following form
0
eβ xij
Z
Pij = P 0 f (β)dβ (9)
k∈J eβ xik
where f (β) is a density function. The RPL probability is a weighted average
of the logit formula evaluated at different values of β, with the weights given
by the density f (β). In statistical terms, the weighted average of several
functions is called a mixed function. Consequently, a RPL is a mixture of
the logit function evaluated at different β’s with f (β) as the mixing function.
5 Survey methods and data
Draft
5.1 Discrete choice experiment
Table 1 lists the four attributes of our discrete choice experiment (DCE) and
their corresponding levels. The included attributes and levels have been cho-
sen closely resembling designs reported in previous studies, and were piloted
before embarking on the gathering of final data.
The first attribute refers to the source of renewable energy —solar, biomass,
or a 50/50 mix. WTP for residential renewable energy has been documented
to vary depending on the source of the renewable energy. In particular,
stated WTP is higher for solar and wind energies and lower for biomass and
hydropower. These empirical results have been reported both by documents
consolidating the relevant literature (Ma et al., 2015; Sundt and Rehdanz,
2015), and by individual studies focusing, for instance, on Spaniard (Gracia
et al., 2012), Danish (Yang et al., 2016), American (Borchers et al., 2007),
and Italian consumers (Vecchiato and Tempesta, 2015; Cicia et al., 2012).
The second attribute in our DCE refers to the share of renewable energy
in current electricity mix —10%, 20% or 30%. These values are relevant
under the light of the Mexican Energy Transition Law (ETL). Specifically,
the ETL mandates that 10.9% of electricity consumption in Mexico comes
15from clean energies for large consumers. In addition, 30% of total electricity
generation in Mexico must come from clean energies by 2021.
The inclusion of source as well as share of renewable energy is key for this
study’s purpose. Respondents may be willing to pay a premium for renew-
able electricity because they value renewable energies regardless their source.
However, it is also possible that this premium arises from respondents’ pref-
erences for a specific source of renewable energy. A third alternative is that
consumers have preferences for a larger share of renewable electricity at the
same time that they attach a premium to a specific source. By including
both attributes, our DCE is designed to empirically test which one of those
three hypotheses holds. Borchers et al. (2007), Gracia et al. (2012), and Yang
Draft
et al. (2016) are instances of previous studies that also include source and
share of renewable energy as attributes in their DCE.
The third attribute in our DCE refers to the number of new jobs cre-
ated in the renewable sector —which we call green jobs. This attribute takes
values 100, 1,000, or 2,000. Strictly speaking, the creation of jobs is not an
attribute of the electricity service. This attribute aims to explore whether
are altruistic in this respect —i.e. whether respondents’ indirect utility is a
function of the number of jobs that the renewable sector may create. If re-
spondents’ utility positively depends on number of green jobs, then pursuing
the adoption of renewable energies may yield a double dividend —generation
of less greenhouse emissions per KWh and the creation of jobs that are valued
by residential consumers. A new jobs attribute has previously been included
in DCE studying stated preferences for residential renewable electricity (e.g.
Bergmann et al., 2006; Soliño et al., 2012; Yoo and Ready, 2014).
Similar to Amador et al. (2013), our DCE presents the price attribute as
an increase in respondents’ self-reported bimonthly electricity bill —5%, 20%,
and 40%. When incorporated in the empirical analysis, we calculate the cor-
responding hypothetical bimonthly electricity bill by applying the percentage
change to the self-reported bill. The hypothetical increase in bill comes from
16an opt-in extra fee (holding tariffs unchanged) that would compensate for an
increase in the share of electricity generated with renewable energies —which
we deem more realistic in a context where tariffs are heavily and horizontally
subsidized in Mexico.
The scenarios of our DCE were designed according to a orthogonal main
effects strategy (see Aizaki, 2012). The DCE contains nine choice sets, all of
which were presented to respondents. Each choice set includes three alterna-
tives described in terms of four attributes, and a status quo alternative. The
respondents were asked to choose one alternative in each choice set. Figure
1 illustrates a choice set.
Draft
5.2 Data collection
Face-to-face implementation of our DCE was conducted through September
to November, 2019. Respondents were approached randomly in public spaces
such as shopping malls and the main square in downtown of Aguascalientes
city. We made sure that respondents were adults residing in Aguascalientes
city that contribute to paying the electricity bill.
5.3 Descriptive statistics
Once missing values have been dropped, our sample is composed of 199 re-
spondents. Table 2 reports mean, standard deviation, minimum and max-
imum of variables describing respondents’ and his/her household’s charac-
teristics. To put our sample’s characteristics in context, table 2 reports in
its last column the official statistics for household heads in Aguascalientes
(see INEGI, 2018). In comparison to official statistics of household heads in
Aguascalientes, our sample is composed by a higher share of females (42%
versus 26%), and a smaller proportion of married people (44% versus 58%).
In terms of range of age, respondents of our DCE are younger than
household heads in Aguascalientes. The proportion of respondents that are
17younger than 30 years old is higher in our sample (43% versus 12%). The pro-
portion of respondents between 30 and 40 years old in our sample is almost
identical to the official proportion of household heads (22% versus 21%). Our
sample includes smaller shares of respondents i) between 40 to 50 years old
(16% versus 23%); ii) between 50 to 60 years old (14% versus 20%); and iii)
older than 60 years old (6% versus 24%).
A bigger proportion of our respondents report higher incomes at the
household level in comparison to official statistics at the household head
level. While the official proportion for income below 8,000 Mexican pesos
(MXP) is 83%, this proportion is 39% in our sample; for income between
MXP 8,000 and MXP 15,000, the official statistic is 10% and our sample’s
Draft
is 33%; and for income above MXP 15,000, the official number is 7% and
our sample’s is 28%. The proportion of respondents with a full-time jobs is
closer to the official statistic for household heads in Aguascalientes —48%
versus 41%. Around 72% of our respondents report affording the full amount
of the electricity bill —which implies that a share of respondents affording
the electricity bill hold part-time jobs.
Two averages at the household level in our sample are almost identical to
official numbers. In our sample, around 70% of respondents live in a house
that is owned by a household member and the average number of household
members is 3.93. These numbers in the official statistics are 69% and 3.91,
respectively.
In comparison to the official statistic, a smaller proportion of respondents
pay electricity on bimonthly basis —61% in our sample versus 89%. The
average self-reported electricity bill is MXP 455 —on a bimonthly basis. The
average hypothetical bimonthly bill implied by the DCE scenarios is MXP
659. The average self-reported bill is bigger than the official statistic —MXP
455 versus MXP 306—, and a two-tailed t-test rejects the null hypothesis that
the difference between these numbers is zero with 99% of confidence —with
a p-value of 0.0019 that corresponds to a t-test statistic of 3.15. We highlight
18that our sample is similar to official statistics when it comes to household’s
characteristics such as number of household members and whether the house
is owned by a household member.
At the individual level, our sample is composed by a smaller share of
married people; and bigger shares of females, and younger respondents who
belong to higher incomes households. As our respondents of interest are
adults that contribute (at least partially) to paying the electricity bill and
not necessarily household heads, the differences in individuals’ characteristics
are not unexpected. The higher self-reported electricity bill and household’s
income imply that our sample is composed by households richer than the
average one in Aguascalientes. In section 8, we discuss implications of these
Draft
differences in terms of external validity of our results and conclusions.
6 Results
6.1 Econometric specifications
Table 3 reports estimates from six random parameter logit (RPL) specifi-
cations. In all six specifications, normal distributions are assumed for all
parameters with exception of the parameter associated to the price attribute
which is assumed fixed.
The first specification (I) in table 3 has been estimated on the entire work-
ing sample (199 respondents). Considering that 3.93 is the average number
of household members, we have re-estimated the RPL on a sample that only
includes respondents whose households have less than eight members (195
respondents). This is the second specification (II) reported in table 3. To
check the sensitivity of the parameter associated to the price attribute, the
third specification (III) excludes 33 choice sets in which the hypothetical
bill falls below or above the 1% tails. The resulting sample contains 195
respondents —which are not the same as in specification (II). The fourth
specification in table 3 is estimated on data from 191 respondents that pass
19(II)+(III) exclusion criteria. The fifth specification (IV) excludes 193 choice
sets in which the hypothetical bill falls below or above the 5% tails, leaving
a sample with 177 respondents. The sixth specification is estimated on a
sample of 174 respondents resulting from implementing (II)+(IV) exclusion
criteria.
We highlight five features from table 3. First, point estimates of all but
the price parameter are similar across specifications. Second, all estimated
parameters but the one associated to 20% of renewable energy are statisti-
cally significant. Third, the level of statistical significance of each estimated
parameter remains the same across specifications for all attributes —and it
is always above a 95% confidence. Fourth, point estimates of standard de-
Draft
viation of most parameters are similar across specifications —the exceptions
being the standard deviations for parameters associated with biomass and
2,000 new green jobs. Fifth, standard deviations associated to status quo,
solar, and 30% of renewable energy are statistically significant across speci-
fications. We deem features 2 and 3 as evidence that all attributes included
in our DCE are relevant to respondents; and features 4 and 5, as evidence
that unobserved heterogeneity is at place —and RPL should be preferred to
conditional logit (CL) specifications.
Features 1 and 4 of table 3 suggest that a few point estimates depend
on the composition of the sample under analysis. The price parameter is
estimated in a range that goes from -2.46 (first specification in table 3) to
-5.59 (sixth specification in table 3) —with standard errors of 0.27 and 0.46,
respectively. Estimates of the standard deviation of the parameter associated
to biomass go from a statistically insignificant 0.23 (first specification) to a
0.33 that is significant at 95% of confidence (sixth specification). Similarly,
estimates of the standard deviation of the parameter associate to 2,000 new
green jobs go from a statistically insignificant 0.19 to a 0.37 that is significant
at 99% confidence.
The variation in those parameters is associated to the exclusion of (upper
20and lower) tails of the hypothetical bill’s distribution. For the case of the
price parameter, point estimates remain similar across specifications on the
entire sample and specifications that exclude i) households with more than
8 members; ii) 1% tails; and iii) these two criteria together. However, a
jump from -2.46 (on entire sample) to -5.54 happens when the 5% tails are
dropped (fifth specification); and the point estimate becomes -5.59 when the
households with more than 8 members are also excluded (sixth specification).
Similarly, the standard deviation of the parameter associated to biomass is
sensitive to the exclusion of the 5% tails. The standard deviation of the
parameter associated to 2,000 new green jobs is insignificant unless the 1%
tails are excluded and remains significant in specifications that drop the 5%
Draft
tails.
When it comes to the sign of specific parameters, we highlight that the
negative sign of the status quo parameter implies that respondents dislike the
current situation in terms of renewable energies. Taking the solar-biomass
mix as reference category, the positive sign of the solar energy parameter
implies that solar is preferred over the mix; and the negative sign of the
biomass parameter implies that the mix is preferred over biomass —an or-
dering of preferences consistent with results from previous studies (e.g. Cicia
et al., 2012; Gracia et al., 2012; Vecchiato and Tempesta, 2015). Taking 10%
of electricity from renewable sources as reference category, the positive sign
of the parameter associated to 30% from renewable sources implies that a
share of 30% is preferred over a share of 10%. Taking 100 new green jobs as
reference category, the positive signs of parameters associated to 1,000 and
2,000 new green jobs, respectively, imply that respondents prefer the creation
of 1,000 and 2,000 green jobs over the creation of 100 jobs.
216.2 Welfare estimates
For each attribute in our DCE, we have estimated the marginal willingness
to pay (MWTP) —expressed as bimonthly, 2018 thousand Mexican pesos
(MXP). Table 4 reports six sets of MWTP estimates and their 95% confidence
interval. Each set of MWTP estimates corresponds to one specification in
table 3.
We focus our attention on the most conservative welfare estimates —i.e.
those that imply the smallest MWTP for all attributes. These estimates
are reported in the last column of table 4, and arise from the specification
that excludes the 5% tails and the households with more than 8 members.10
Draft
Thus respondents’ loss in utility for remaining in the status quo situation is
valued at MXP 899 bimonthly. When it comes to solar energy, respondents’
WTP is MXP 34 on a bimonthly basis —a WTP whose 95% confidence
interval includes the zero, and the zero null hypothesis can only be rejected
at a 10% of significance. Respondents report a bimonthly loss of MXP 51
when it comes to biomass energy in comparison to a 50/50 mix of biomass
and solar energies. The WTP for a share of 20% of renewable energy is not
statistically significant. In contrast, the WTP for a share of 30% is MXP
74 on bimonthly basis. The WTP for the creation of 1,000 new green jobs
is MXP 40 on bimonthly basis; and MXP 59 for the creation of 2,000 new
green jobs.
6.3 Robustness checks
We have also estimated conditional logit (CL) specifications on the same
six samples than those of the RPL specifications reported in table 3 in the
appendix. Parameter estimates from these CL specifications are reported
10
The smaller estimates are direct consequence of the higher absolute value of the price
parameter yielded by the corresponding specification. From equation (7), and given the
similarity among point estimates of all but the price parameter, it can be seen that a
higher absolute value of the price parameter results in a smaller MWTP.
22in table A1, and the corresponding MWTP estimates are reported in table
A2. Due to limitations of the CL (see section 4), estimates from a CL can
only be used to check that the welfare estimates are around the same order
of magnitude than those arising from a RPL. Focusing on the last column
of table A2, we highlight that most MWTP estimates are similar to those
yielded by the RPL specification, with exception of the one associated to
the status quo —which the CL yields a third of the value resulting from
the RPL. Similarly to welfare estimates from the RPL, table A2 reports a
loss in utility from the status quo (value at MXP 298, bimonthly) and from
biomass (MXP 46); no statistically significant MWTP for a share of 20%;
and positive MWTP for solar energy (MXP 46), a share of 30% (MXP 85),
Draft
and the creation of 1,000 (MXP 31) and 2,000 (MXP 63) new green jobs.
In addition, we have estimated six RPL specifications that assume share
of renewable energy and number of new green jobs are continuous variables.
The parameter estimates from these RPL and their corresponding welfare
estimates are reported in tables A3 and A4, respectively. Focusing our at-
tention on the last column of table A4, we highlight the similarity in point
estimates in comparison to those in table 4. For the case of status quo, the
loss in utility is estimated at MXP 751 (versus MXP 899 in table 4). For the
case of biomass, the loss is valued at MXP 54 (versus MXP 51). MWTP for
Solar is MXP 30 (versus MXP 34) —and it is statistically significant only
with p < 0.10. MWTP for a 1% increase in the share of renewable energy is
MXP 5 which implies a WTP of MXP 150 for a share of 30% which is around
twice as much as the MXP 74 reported in table 4. MWTP for an increase
in 1,000 new green jobs is MXP 30, or for 2,000 jobs is MXP 60, which are
close, respectively to the MXP 40 and MXP 59 reported in table 4.
The corresponding CL specifications and their MWTP estimates are re-
ported in tables A5 and A6. Orders of magnitude and significance levels
remain similar to those previously discussed.
236.4 This paper’s results in comparison to those in pre-
vious studies
To put this paper’s welfare estimates in context with respect to previous
papers’ estimates, it is convenient to carry out comparisons in terms of WTP
per kWh under specific scenarios. Thus, based on the after-tax self-reported
electricity bill, we first retrieve electricity consumption, measured in terms of
kWh. In Aguascalientes, consumers face a three-tier block increasing tariff.
At the time of the survey, first tier charge was MXP 0.823 to consumption up
to 150 kWh; the second tier charged MXP 0.996 to consumption above 150
kWh and u to 280 kWh; and the third tier charged 2.912 for consumption over
280 Kwh.11 Correspondingly, electricity consumption is inferred by inverting
Draft
the tariff formula.
Once electricity consumption is inferred, estimated bimonthly WTP is
added to the self-reported bimonthly bill, and the total amount is divided by
the inferred consumption. This estimation of WTP per kWh assumes that i)
consumers know and keep in mind the three-tier block tariff when it comes
to deciding electricity consumption; ii) consumers pay attention to before-
tax amounts and not to after-tax amounts; and iii) had consumers paid a
premium on top of their current bills, they would not change consumption
levels.
Table 5 reports WTP per kWh under nine scenarios that we deem of
public policy interest. All nine scenarios assume a 30% share of renewable
energy, and the corresponding WTP is calculated based on MWTP numbers
reported in last column of table 4. A first scenario assumes that this share is
achieved with biomass energy (I). Notice that estimation of WTP under this
scenario implies the subtraction of MXP 51 from MXP 74 which is the utility
11
If annual consumption exceeds 3000 Kwh, the household is reclassified as a high-
consuming household (Demanda de alto consumo and the corresponding tariff is signifi-
cantly higher than tier-3 tariff. We are not able to identify any of our respondents in the
high-consuming category.
24that 30% renewable share produces —the subtraction is due to the desutility
from biomass energy in comparison to a 50/50 biomass and solar mix. The
second and third scenarios assume (I) and, respectively, the creation of 1,000
and 2,000 new green jobs. The fourth scenario assumes that the 30% share
of renewable energy is reached with solar energy but no premium is paid
for this source of energy (II). This no premium assumption aims to take
into consideration that, according to estimates in the last column of table 4,
MWTP for solar energy is statistically significant only with p < 0.10. The
fifth and sixth scenarios assume (II) and, respectively, the creation of 1,000
and 2,000 new green jobs. The seventh scenario assumes that the 30% share
of renewable energy is reached with solar energy and a premium of MXP 34
Draft
is paid for this source of energy (III). The eight and ninth scenarios assume
(III) and, respectively, the creation of 1,000 and 2,000 new green jobs. Table
5 first reports the bimonthly WTP under each of the nine describes scenarios
—both in 2018 MXP and USD, respectively.12 Then table 5 reports the
bimonthly WTP as a proportion of the average bimonthly bill —both self-
reported and hypothetical. In its last two columns, table 5 reports bimonthly
WTP per kWh —in 2018 MXP and USD (cents), respectively.
A 30% share of renewable electricity generated through biomass is valued
at USD 1.20 on a bimonthly basis. When 1,000 new green jobs are created,
consumers’ stated benefits are USD 3.28; and when 2,000 new green jobs are
added, stated benefits are estimated at USD 4.27. These numbers represent,
respectively 5%, 14%, and 18% of the average self-reported bill; or 3%, 10%,
and 12% of the hypothetical bill. In terms of USD per kWh, these numbers
are equivalent, respectively, to 3.09 cents, 4.33 cents, and 4.93 cents.
For the three scenarios involving solar energy under the assumption that
no premium is paid for this energy source, the bimonthly WTP is USD 3.85
for the 30% share; and USD 5.93 (USD 6.92) when 1,000 (2,000) are added.
12
Assuming an exchange rate of 19.22 MXP/USD which was the average closing price
in 2019 according to Macrotrends (2020).
25In temrs of cents per kWh, these numbers translate into 4.68, 5.98, and 6.52,
respectively. When a premium for solar energy is added, the bimonthly WTP
becomes USD 5.62, USD 7.70, and USD 8.69, respectively. In terms of WTP
per kWh, these numbers are equivalent to 5.74, 6.99, and 7.59, respectively.
Our per kWh welfare estimates fall well within the range of values re-
ported by previous studies. The studies summarizing the previous literature
provide useful information to carry out a comparison. Ma et al. (2015) find
that a majority of WTP values falling between -10 cents and +10 cents and
Sundt and Rehdanz (2015) report an average of 3.18 cents. Our lowest per
kWh estimates (3.09) for 30% share produced with biomass is not only close
to the average reported by Sundt and Rehdanz (2015), but also along with
Draft
our highest bimonthly per kWh estimate (7.59) for 30% share produced with
solar, both fall within the [−10, +10] interval reported by Ma et al. (2015).
In terms of monthly household WTP, our estimates fall well below USD
13.13 (average) and USD 11.67 (median) reported by Sundt and Rehdanz
(2015). Our lowest monthly household WTP is equivalent to 0.60 cents,
and our highest is USD 4.34. This relative magnitude in the household
WTP should not be surprising as most of previous studies have focused on
developed countries and Mexico has only recently being classified as upper
middle income.
7 Public policy implications
The national business sector has expressed concerns about the Federal strat-
egy pursuing energy sovereignty due to its negative implications for the com-
petitiveness of the energy sector and potential spillovers to other economic
sectors (Gonzalez, 2019; Nava, 2020). This apprehension is shared by in-
ternational stakeholders and discussions have been hold among diplomats
of eight developed countries to explore the best way to communicate such
concerns to the Federal administration (Proceso, 2020). Scholars and ana-
26lysts have also expressed that the planned renovation of state-owned oil and
electricity companies may be too costly, and in addition may deviate Mexico
from achieving climate change goals (Davis, 2019; Stromsta, 2019; Martin,
2019).
These concerns have become stronger as discussions begin on how to over-
come the post-coronavirus recession (Castañeda-Morales, 2020; Levy, 2020).
The volatility in oil prices make investments in state-owned companies even
riskier —as reflected by the re-evaluation of the credit ranking for Mexico
and its oil company. However, in face of the evidence, such as everyday new
announcement from the federal government, it would be naive to think that
current administration would follow any policy recommendations toward a
Draft
just energy transition. Hence, other groups such as state governments could
take steps forward to support it. This kind of initiatives would counterbal-
ance partially the slowing down of the energy transition.
In this context, it is reasonable to highlight the estimations suggesting
that Mexico could increase the health of its population and simultaneously
boost its economy by pursuing a strong climate policy. For instance, Flores
et al. (2019) report that Mexico could save more than 25,000 lives and USD
5 billion in public health costs by 2030 if it pursues mitigation of greenhouse
emissions —as it has committed under the Paris Agreement. Three-quarters
of such reductions would arise from addressing three sectors —electricity,
transport and industry.
In a similar vein, findings from this study suggest that a policy simultane-
ously boosting renewable energies and the creation of green jobs would i) have
the support of residential electricity consumers; ii) help in recovering from
the post-coronavirus recession; and iii) provide a just transition for workers
currently employed in fossil-fuel based industries. A just transition encom-
passes policies that support workers and families whose jobs, incomes, and
livelihoods are at risk as the world pursues sustainable pathways (Rosemberg,
2017).
27Our findings suggest that a policy achieving a 30% share of renewable
biomass energy and the creation of 1,000 new green jobs is valued by elec-
tricity consumers at USD 3.28 on bimonthly basis —2.1 of which correspond
to the creation of the jobs. To put this number in context, the Federal ad-
ministration provides USD 195 on a monthly basis to people between 18 and
29 years old who enroll in training programs (STPS, 2020). If the trainee
were going to learn skills that facilitate his/her participation in the energy
renewable sector, a household in our sample would contribute with around
1% of the USD 195 that the Federal administration transfer to a trainee.
Equivalently, the contribution from 100 households would cover the USD
195 on a bimonthly basis.
Draft
A policy encouraging re-training of individuals to transition to the re-
newable energy industry would also support the recovery from the post-
coronavirus recession. As many people is expected to loss their jobs, a com-
pensation during the re-training period would help in avoiding that displaced
workers transition to informal sector jobs. A transition to the informal sec-
tor is undesirable because i) it would decrease wages in the informal sector
—negatively impacting not only newcomers but also those who permanently
hold an informal job; and ii) it implies a loss in returns from investments that
individuals and the State have done on specific skills that are not useful in
the informal sector —a waste from which a recovery is difficult once workers
transition to the informal sector because it has been documented that they
do not return to the formal sector easily (Levy, 2020).
When designing a policy that boosts both renewable energies and creation
of green jobs, it is important to keep in mind that the potential number of new
jobs differs depending on the source of energy. For instance, International
Renewable Energy Agency (2015) estimates that while one Gigawatt (GW)
of solar photovoltaic power can create on average 8,250 new jobs, one GW of
biomass power can create 31,000 new jobs. Another element to keep in mind
is that jobs created by biomass energy generation are mostly permanent jobs
28You can also read