Unlocking Potential: An Economic Valuation of Energy Storage in Ontario - A Report by Power Advisory LLC Commissioned by Energy Storage Canada ...
←
→
Page content transcription
If your browser does not render page correctly, please read the page content below
Unlocking Potential: An
    Economic Valuation of
   Energy Storage in Ontario

A Report by Power Advisory LLC Commissioned by Energy Storage Canada
July 2020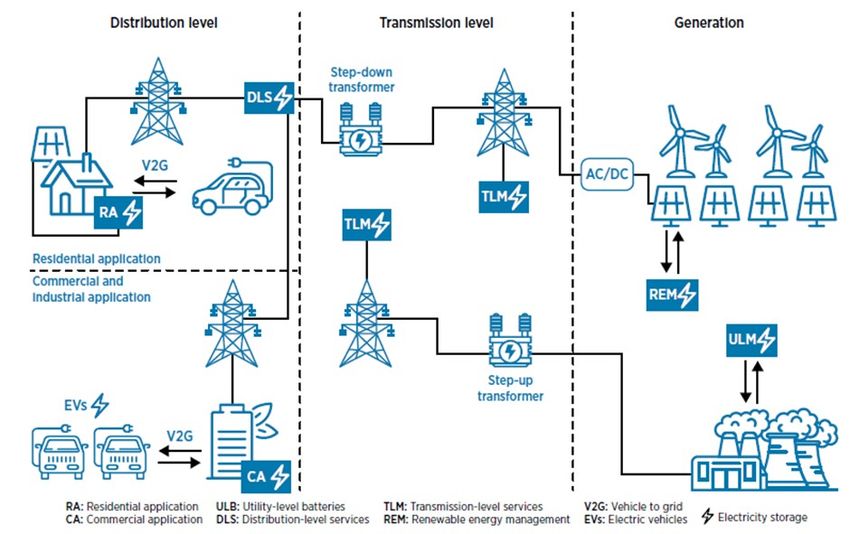
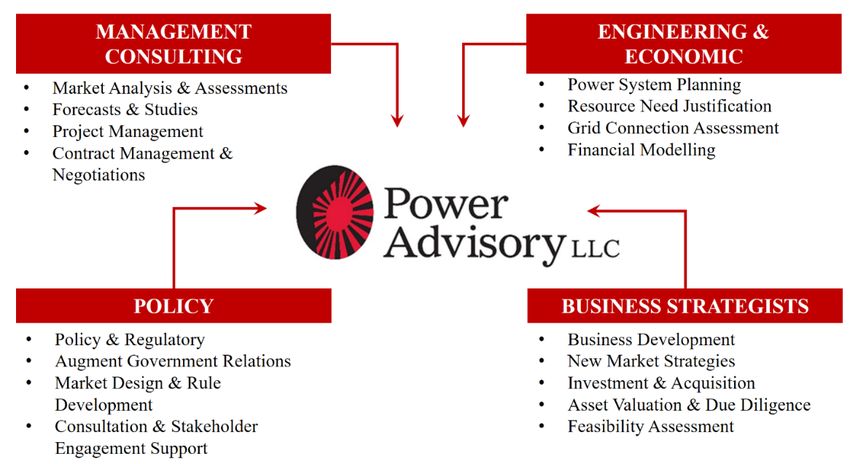
ENERGY STORAGE CANADA
Energy Storage Canada (ESC) is the national association for the energy storage industry in Canada.
Our membership represents all players along the energy storage value chain – technology
providers, project developers, investors and operators, utilities, electricity distribution companies
and NGOs. We represent some of the largest energy companies in Canada as well as some of the
smallest and most innovative clean-tech organizations.

ESC focuses on advancing opportunities and building the market for energy storage through
advocacy, networking and stakeholder education. Our mission is to advance the energy storage
industry in Canada through collaboration, education, policy development and research. ESC takes
an unbiased view with respect to the range of available storage technologies and is supported by
the contributions of our active members.

For more information visit www.energystoragecanada.org

POWER ADVISORY LLC
Power Advisory is an established electricity market-focused management consulting firm. We
specialize in market analysis, market design, policy development, business strategy, power
procurement, regulatory and litigation support, and project development and feasibility
assessment in North American electricity markets. We offer considerable experience advising
industry associations, generators, energy storage providers, transmitters, distributors, technology
providers, investors, financial institutions, customers, regulators, government agencies, and
governments on a wide range of matters across North American electricity markets, with robust
and in-depth experience in Ontario.

For more information visit https://poweradvisoryllc.com/

1
EXECUTIVE SUMMARY
Energy storage can provide immediate, tangible savings, and benefits across Ontario’s power
system. Some of the savings are attributed to the inherent characteristics of energy storage, while
others are a result of several unique characteristics of Ontario’s electricity market and regulatory
structure.

Over the next decade, this report shows that the introduction of at least 1,000 MW of energy
storage can provide as much as $2.7 billion in total savings for Ontario’s electricity customers, and
that the savings could reach upwards of $4 billion (see Figure 1). While these savings account for
only a small portion of total system costs, they are nevertheless material. In large part, these
savings are a direct result of more efficient utilization of the province’s long-term generation
assets, many of which were added to the system over the last decade or are currently being
refurbished for the coming decades.

From a net savings perspective, based on an installed cost of $200,000 per MW per year, energy
storage can provide $774 million to $2 billion in savings under a base case and a high estimate
case, respectively. These savings will help lower costs to Ontario’s electricity customers over the
next decade. Energy storage assets can also be designed with operating lives of 20 years or more,
and could therefore provide savings to Ontario extending beyond the 10-year horizon.

The potential savings from energy storage are categorized into three service types:

    •   Wholesale Market: Energy storage can provide a range of wholesale market savings,
        including energy arbitrage, reduced prevalence of Surplus Baseload Generation, reduced
        need for flexibility and cost-guarantee procurement mechanisms, lower ancillary service
        costs, and increased participation in Capacity Auctions. In total, energy storage can
        provide $1.1 billion to $3.1 billion in gross savings in the wholesale market.

    •   Maximize Transmission and Distribution Investment: Energy storage investments can
        be made at specific locations on the grid to better utilize existing transmission and
        distribution assets. Based on current power system planning outlooks and historical
        investment trends, energy storage can provide $457 million to $840 million in gross
        savings over the next decade.

    •   Direct-to-Customer Savings: Energy storage can help electricity customers manage
        individual costs by shifting peak consumption, resulting in lower Time-of-Use rates and
        reduced demand charges. Energy storage can also help shift renewable energy output –
        largely from solar generators – from low-value to high-value hours.

Energy storage can provide a number of more qualitative benefits – many of which will also
produce savings, but have not been estimated as part of this report. The benefits include reduced
greenhouse gas emissions, lower transmission congestion, increased electricity exports and
import values and improved power quality.

2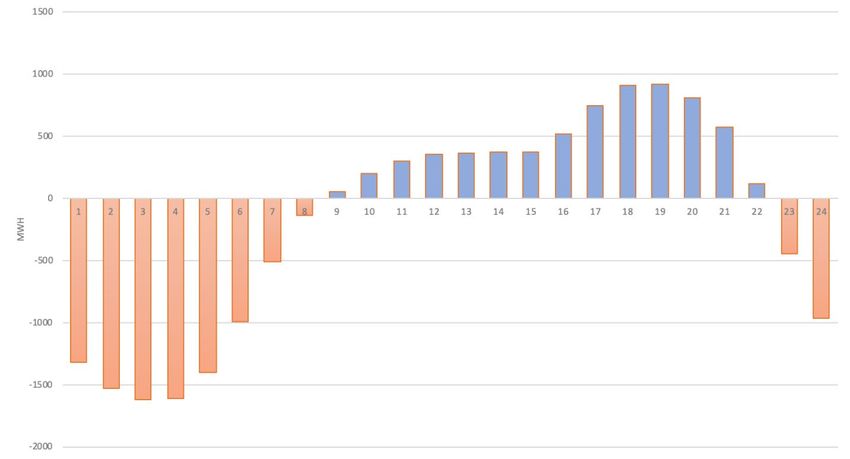
Ultimately, energy storage can help manage many of the unique characteristics of Ontario’s
electricity grid, as well as the operational challenges that have accompanied the transition from a
traditional grid to one with fewer emissions and greater variability. It can do that while lowering
system costs by increasing the utilization of existing investments. While this analysis highlights
the value of energy storage in Ontario, more detailed modeling should be considered as part of
the next steps.

 $4,500,000,000

 $4,000,000,000

 $3,500,000,000

 $3,000,000,000

 $2,500,000,000

 $2,000,000,000

 $1,500,000,000

 $1,000,000,000

    $500,000,000

             $0
                      Low (Current    Low (Full     Base (Current    Base (Full    High (Current    High (Full
                         Value)    Potential Value)    Value)     Potential Value)    Value)     Potential Value)

                              Electricity Market Clearing Price           Curtailed Energy Output
                              Operating Reserve                           System Flexibility
                              Generator Cost Guarantee                    Regulation Services
                              Capacity Auction                            Deferred Transmission Investments
                              Deferred Distribution Investments

                   Figure 1. Energy Storage Value in Ontario Under Low, Base, and High Scenarios

Energy storage can offer savings immediately, but a variety of barriers are hindering realization of
its full value in Ontario. These barriers can begin to be addressed in the following ways:

     1. Given the current inability to fully integrate energy storage within Ontario’s electricity
        market, and in order to unlock the system-wide value of energy storage now, the
        Independent Electricity System Operator (IESO) should contract for the full suite of
        services energy storage can deliver, and should enable the co-optimized operation of
        these storage resources. This would allow for full realization of the savings potential for
        customers, which cannot be achieved within the current market design and structure.

3
2. In parallel, the IESO, the regulators and utilities should establish enduring, cost-effective
       and competitive methods to integrate energy storage. This will need to entail:

           a. relying on current proposals for Capacity Auctions and ensuring energy storage’s
              future participation;

           b. determining how to optimize existing assets by, for example, co-locating energy
              storage with operating renewable generation and other baseload generation
              facilities;

           c. ensuring that the Ontario Energy Board (OEB) and the IESO coordinate efforts to
              fully extract all value from non-wires solutions and wholesale market
              participation; and

           d. establishing an OEB-IESO committee with a clear and reasonable timeline and set
              of objectives for the full integration of energy storage.

    3. Building off recent changes to default supply rates for applicable electricity customers,
       and of deferral of Global Adjustment (GA) charges for other customers, both electricity
       pricing for customers and GA cost allocation among customer classes should be
       reformed. This will need to entail:

           a. recognizing that the current fixed-cost recovery method offsets a portion of the
              potential savings from integrating energy storage;

           b. encouraging the IESO and OEB, along with stakeholders and the province, to
              determine a method of recovering fixed costs that is both fair and transparent,
              but also relies on efficient price signals; and

           c. recognizing that price signals are the most transparent means of extracting
              energy storage’s system-wide benefits.

    4. OEB consultations should be launched in an effort to better incent rate-regulated utilities
       to deploy non-wires solutions, by providing guidance around asset planning, cost
       allocation and renumeration, among other issues. The consultations would result in
       guidance from the OEB to utilities and energy storage providers on matters such as
       planning, cost allocation, remuneration, and pathways for regulated utilities to partner
       with the private sector.

4
Table of Contents
Energy Storage Canada ......................................................................................................................................... 1
Power Advisory LLC ................................................................................................................................................ 1
Executive Summary ................................................................................................................................................ 2
List of Figures ......................................................................................................................................................... 6
List of Tables ............................................................................................................................................................. 7
1. Introduction ....................................................................................................................................... 8
2. Value of Energy Storage Services and Products in Ontario.......................................... 11
2.1 Wholesale Market Services in Ontario........................................................................................... 14
2.2 Electricity Infrastructure Savings in Ontario .............................................................................. 23
2.3 Direct-to-Customers Savings in Ontario ....................................................................................... 28
3. Qualitative Benefits...................................................................................................................... 33
3.1 Environmental Benefits ....................................................................................................................... 33
3.2 Reduced Transmission Congestion Benefits ............................................................................... 34
3.3 Increase Export and Import Value Benefits................................................................................. 34
3.4 Power Quality Improvement Benefits ........................................................................................... 34
4. Conclusions ..................................................................................................................................... 36
4.1 Overall Value and Viability of Energy Storage in Ontario ...................................................... 36
4.2 Recommendations ................................................................................................................................. 38
APPENDIX A – Overall Approach ................................................................................................................. 40
APPENDIX B – Additional References ........................................................................................................ 42
APPENDIX C – Wholesale Market Savings Calculation ........................................................................ 45
5List of Figures Figure 1. Energy Storage Value in Ontario Under Low, Base, and High Scenarios .............................. 3 Figure 2. Energy Storage Value Attributes .......................................................................................................... 8 Figure 3. Time Scale of Energy Storage Technologies .................................................................................. 10 Figure 4. Energy Storage Value in Ontario Under Low, Base, and High Scenarios ............................ 12 Figure 5. Ontario Demand Compared to Nuclear, Hydro, and Wind Energy Output ....................... 18 Figure 6. Supply Curve in Ontario ......................................................................................................................... 20 Figure 7. Illustrated Example of Energy Storage Scalability ........................................................................ 25 Figure 8. System Service as Percentage of Total Expenditures.................................................................. 27 Figure 9. Historic and Forecast Distribution Capital Expenditure ............................................................. 28 Figure 10. Demand Charges for Select Ontario LDCs ................................................................................... 30 Figure 11. Reduction in Customer Peak Load .................................................................................................. 31 Figure 12. Class A GA Costs .................................................................................................................................... 32 Figure 13. Net Savings from 1,000 MW of Energy Storage, 2021-2030................................................. 37 Figure 14. Components of Valuation Study ...................................................................................................... 40 Figure 15. Energy Storage Applications Throughout Electricity Grid………………………………….………42 Figure 16. Versatility of Energy Storage ............................................................................................................. 43 Figure 17. Summary of Valuation Studies from U.S. ...................................................................................... 44 6
List of Tables
Table 1. Quantitative and Qualitative Values Evaluated in this Report .................................................. 11

Table 2. Energy Storage Savings under Current and Future Framework ............................................... 13

Table 3. Wholesale Market Quantitative Assessment 2021-2030 ............................................................ 15

Table 4. Negative HOEP and SBG in 2019 ......................................................................................................... 17

Table 5. Negative Prices in Ontario Compared to Neighbouring Jurisdictions................................... 19

Table 6. Electricity Infrastructure Quantitative Assessment 2021-2030 ................................................. 23

Table 7. Ontario Planning Sub-Regions Used in Analysis............................................................................ 26

Table 8. Direct to Customer Quantitative Assessment ................................................................................. 28

7
1. Introduction
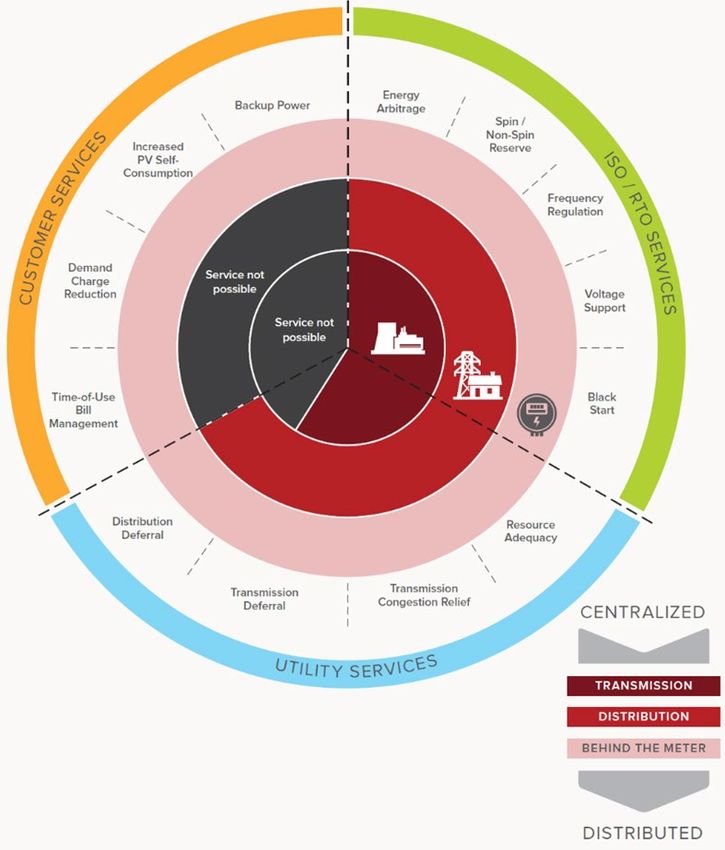
The characteristics and capabilities of energy storage resources are well documented in academic
literature, think-tank research reports, and studies across multiple jurisdictions. For example, as illustrated
in Figure 2 from the Rocky Mountain Institute, energy storage can provide as many as 13 services between
customers, grid operators (including utilities), and market operators. 1 Future designs and services in
electricity markets will provide new areas of participation for energy storage.
In Ontario, energy storage can help maximize the benefits of existing generation and grid infrastructure.
For example, energy storage can increase capacity factors of existing generation (i.e. hybrid energy
systems) and shift energy production to hours when it is most needed. Energy storage also serves as an
effective non-wires solution to eliminate or defer wires investment (i.e. transmission and distribution).
Figure 2. Energy Storage Value Attributes
1 Garrett Fitzgerald, James Mandel, Jesse Morris, and Hervé Touati. The Economics of Battery Energy Storage: How multi-use, customer-sited batteries
deliver the most services and value to customers and the grid. Rocky Mountain Institute, September 2015. Retrieved from:
https://rmi.org/insight/economics-battery-energy-storage/.
8The purpose of this report, commissioned by Energy Storage Canada (ESC) and written by Power Advisory
LLC (Power Advisory), is to quantify the benefits for Ontario’s electricity customers (i.e. ratepayers) that
will be realized if energy storage is fully leveraged in Ontario by:
1) Enabling energy storage to provide multiple services, particularly relative to the wholesale
market;
2) Permitting energy storage to compete on a level playing field in the IESO’s planned market
reforms through the Market Renewal Program (MRP), Capacity Auctions, and other procurement
mechanisms that may arise for resource adequacy; and
3) Facilitating use of energy storage and non-wires solutions in transmission and distribution
planning.
Due to their high degree of flexibility and controllability, energy storage resources are well-suited to
providing services in the wholesale market, particularly ancillary services such as frequency regulation and
operating reserves. More recently, energy storage is increasingly being used to defer infrastructure
investments due to its modularity (e.g. cell batteries) and ability to enhance system capacity. Customer-
sited energy storage has also become widely used to manage electricity costs as technology costs have
fallen. The main technology types considered in this report include: electrochemical (i.e. battery);
electromechanical (e.g. flywheel, compressed air energy storage, capacitor banks, and pumped hydro);
and power-to-gas. These technologies have all been deployed in Ontario:
• Batteries are one of the most widely used energy storage technologies and are the most
versatile form of energy storage as they can provide a range of services, spanning the wholesale
market, infrastructure deferrals, and energy management for customer-sited systems.
• Flywheels function by electrically driving a motor to spin a rotating disc mass (i.e. the flywheel)
at high speeds creating kinetic energy. The most notable characteristic of flywheels is that they
can cycle very quickly and are less prone to degrading, even with a large number of cycles over
time, than are batteries.
• Compressed air energy storage (CAES) is a form of energy storage that uses a compressor to
pressurize atmospheric air and drive it into a vessel for storage. The most common types of
vessels include underground caverns, reservoirs and mines.
• Pumped hydro is the most prevalent and proven form of energy storage technology,
representing a significant majority of installed capacity worldwide. It functions by pumping
water from a lower reservoir to an elevated reservoir to store energy in the gravitational
potential of the water. To discharge, the water from the upper reservoir is released creating
kinetic energy to run a turbine and generate electricity. Because vast amounts of water can be
stored in reservoirs, pumped hydro systems can store large amounts of energy.
9• Capacitor banks use the magnetic field between plates as a storage medium and, similar to
flywheels, can charge and discharge very quickly. Capacitor banks have no moving parts and
have essentially no maintenance.
• Power-to-Gas is a flexible technology that uses the electrolysis of water to convert electrical
energy into hydrogen. Power-to-Gas can be used to provide ancillary services such as rapid
frequency response for electrical grid support, or utilized with a fuel cell to provide electrical
power for operating reserve. The technology also enables the movement of energy from the
electrical grid to the natural gas grid and back. The hydrogen produced from a Power-to-Gas
process can also be blended into natural gas grids or combined with CO2 to create renewable
natural gas by methanation.
Storage technology is highly varied, and different technologies are suitable for specific purposes or use
cases. For example, the response time and duration of each energy storage technology can range from
real-time and sub-second increments, to durations of days, weeks and months, as illustrated in Figure
3. 2 Certain energy storage technologies are highly versatile, providing multiple services over the course
of any given day and of their useful life. As illustrated in Figure 16 (see Appendix B) energy storage can
use its withdrawal and injection capability to supply energy, capacity, and/or ancillary services
depending on system needs throughout the day.
Figure 3. Time Scale of Energy Storage Technologies
2Figure 3 is adapted from: IRENA (2020), Electricity Storage Valuation Framework: Assessing system value and ensuring project viability,
International Renewable Energy Agency, Abu Dhabi. Retrieved from: https://irena.org/publications/2020/Mar/Electricity-Storage-Valuation-
Framework-2020
102. Value of Energy Storage Services and Products in Ontario
This report evaluates different services and products that may be provided by energy storage. Each of
these services provides value for Ontario’s electricity grid and customers, as shown in Table 1. While the
bulk of this report focuses on quantitatively assessing the value energy storage may provide, certain
qualitative attributes are also considered in Section 3.
As demonstrated in this section of the report, the calculated gross savings for a baseline of 1,000 MW of
energy storage deployed in Ontario is between $1.5 billion and $4.0 billion (all figures are in nominal
$CDN) between 2021 and 2030. Our approach to calculating gross savings considered three different
scenarios: a low scenario representing a conservative view of value, a base scenario that we view are
realistic assumptions, and a high scenario representing an optimistic view of value. The calculated gross
savings are premised on several changes in regulatory design, and in market design and structure, to fully
unlock the value of energy storage and to enable provision of multiple services, particularly as they relate
to the wholesale market. We present gross savings for each scenario under current value and full potential
value to demonstrate the benefit of regulatory and market design changes. A further discussion on the
assumptions used as part of the calculation can be found in Appendix C.
As we elaborate in Section 4 of this report, given the current inability to fully integrate energy storage
within Ontario’s electricity market, and in order to unlock the system-wide value of energy storage now,
the IESO should contract for the full suite of services energy storage can deliver, and should enable the
co-optimized operation of these storage resources. This would allow for the full realization of the savings
potential for customers, which cannot be achieved within the current market design and structure.
Table 1. Quantitative and Qualitative Values Evaluated in this Report
Wholesale Market Electricity Infrastructure Direct to Customers
Quantitative Estimate: Quantitative Estimate: Quantitative Estimate:
• Real-time energy (peak/off- • Transmission upgrade deferral • Time-of-Use bill management
peak arbitrage and Surplus (i.e. capacity, local, regional) • Demand charge reduction (e.g.
Baseload Generation • Distribution upgrade deferral Global Adjustment, etc.)
reduction) • Renewable output
• Ancillary services: Qualitative: maximization
o Operating reserve • Power quality enhancements
o System flexibility (excess (harmonics, end of line voltage Qualitative:
30-minute operating drops, frequency droop) • Power reliability/quality
reserve • Reliability services (cold load improvement
o Regulation service pick up, outage management,
• Capacity voltage stability)
• Distributed energy resource
Qualitative: output management
• Environmental benefits
• Transmission congestion relief
(i.e. north-to-south congestion)
• Electricity exports/imports
11A recently completed summary by Balducci et al. (2018) compiled results of energy storage valuations
studies from across the U.S. 3 Given the wide range of results, the potential benefits of energy storage
are clearly case-specific and dependent on local or regional market conditions. This report therefore fully
accounts for the unique characteristics of Ontario’s electricity market. However, the valuations arrived at
– and given due consideration of region-specific conditions - are believed to be comparable to findings
from previous studies conducted in other markets.
$4,500,000,000
$4,000,000,000
$3,500,000,000
$3,000,000,000
$2,500,000,000
$2,000,000,000
$1,500,000,000
$1,000,000,000
$500,000,000
$0
Low (Current Low (Full Base (Current Base (Full High (Current High (Full
Value) Potential Value) Value) Potential Value) Value) Potential Value)
Electricity Market Clearing Price Curtailed Energy Output
Operating Reserve System Flexibility
Generator Cost Guarantee Regulation Services
Capacity Auction Deferred Transmission Investments
Deferred Distribution Investments
Figure 4. Energy Storage Value in Ontario Under Low, Base, and High Scenarios
The valuations shown above can be realized through the implementation of a new regulatory and market
framework – one which addresses existing limitations on realization of the full value of energy storage
resources in Ontario. Key among these limitations are:
• Global Adjustment (GA) charges that offset reductions in wholesale energy market clearing
prices;
3Patrick J. Balducci, M. Jan E. Alam, Trevor D. Hardy, and Di Wu. Assigning value to energy storage systems at multiple points in an electrical grid.
The Royal Society of Chemistry, 2018. Retrieved: https://pubs.rsc.org/en/content/articlehtml/2018/ee/c8ee00569a. See Figure 17, Appendix B.
12• A uniform, province-wide Hourly Ontario Energy Price (HOEP) and a five-minute Market Clearing
Price (MCP) that undermine the local price signals needed to drive investment and consumption
decisions;
• Congestion Management Settlement Credits (CMSC) that reduce economic efficiency across the
wholesale electricity market;
• IESO Dispatch Scheduling and Optimization (DSO) limitations that may not fully unlock energy
storage’s unique operating characteristics;
• Capacity Auction constraints that may limit the types of resources allowed to participate;
• Supply of operating reserve (OR) (a form of ancillary services) constraints that may prevent
energy storage from fully participating;
• Opaque procurement of regulation services (a form of ancillary services) that does not provide
clear price signals on the cost of such services;
• Regulatory uncertainty and financial disincentives for regulated utilities to invest in energy
storage services directly, or to partner with unregulated private-sector energy storage partners
(who in turn can attract merchant revenues and other value streams to augment customer
savings); and
• Time-of-use (TOU) pricing under the Regulated Price Plan (RPP) that may not offer the necessary
price spread for the economic operation of an energy storage asset.
Some of these limitations are under consideration through the IESO’s MRP, which will result in the
implementation of Locational Marginal Prices (LMPs) for energy and OOR, elimination of CMSC payments,
and more expansive Capacity Auctions. But there is no immediate prospect for the elimination of a
number of these limitations, notably high GA payments and a lack of clear regulatory guidance to utilities
to pursue non-wires solutions.
Table 2. Energy Storage Savings under Current and Future Framework
Segment Service Current Framework Future Framework
Wholesale Real-Time Two-schedule system, uniform LMPs and dispatch tool upgrades
Market Energy prices, CMSC payments, high GA
payments – some limits from DSO
regarding energy storage
Capacity Limited Capacity Auctions Expanded Capacity Auctions and
resource adequacy procurement
Operating Current limitations of dispatch Full optimization with real-time
Reserve algorithm energy and regulation services
Regulation Inconsistent and opaque Competitive procurement of
Services procurement regulation services and full
optimization with real-time energy
and regulation service
System Increase procurement of 30-minute Flexible ramping product or storage
Flexibility OR (30R) to provide flexibility participation in 30R
13Electricity Transmission Limited investment due to Clear regulatory framework with
Infrastructure Deferral regulatory uncertainty and negative respect to the treatment and
incentive for utilities procurement of non-wires solutions
Distribution Limited investment due to Clear regulatory framework with
System regulatory uncertainty and negative respect to the treatment and
Deferral incentive for utilities procurement of non-wires solutions
Direct to TOU Bill TOU pricing under RPP TOU with enhanced Critical Peak
Customers Management Pricing options for customers
Demand Fixed Demand Charges Tiered Demand Charges (i.e.
Charges Class A GA Cost Structure different charge for usage by season
and hour of the day), or Interruptible
Demand Charges
Renewable Management of production to cost Better market signals on when
Output allocation renewable output should be shifted
Maximization to times of the market that are most
valued
2.1 Wholesale Market Services in Ontario
Energy storage resources can provide multiple services in Ontario’s wholesale electricity market:
• Energy arbitrage and reduction in Surplus Baseload Generation: Energy storage resources
engage in energy arbitrage, which entails charging in low-value (i.e. low-price) hours and
discharging in high-value hours. As discussed at length in this report, Ontario has a significant
amount of Surplus Baseload Generation (SBG) in off-peak hours. Energy storage can shift a
percentage of this surplus energy to peak hours, reduce the need to dispatch high-cost
resources, and lower market clearing prices for the benefit of all customers.
• Operating Reserve: Energy storage resources can participate in the OR market, 4 both as a load
(e.g. dispatchable load) when charging in low-value hours, and as a generator.
• System Flexibility: Given the capability of energy storage resources to react nearly
instantaneously to real-time conditions, they can provide greater flexibility to grid and market
operators and reduce the need for procurement mechanisms targeting flexibility.
• Regulation Services: Energy storage resources often provide frequency control services5 (i.e.
regulation services) in wholesale electricity markets around the world. As noted, energy storage
assets are typically designed to react nearly instantaneously to conditions on the grid, making
them an ideal resource for regulation services.
• Capacity: Given the ability of energy storage to participate in the wholesale electricity markets,
it can also participate in system operator-led capacity procurements, such as auctions and
contracts, to ensure power-system resource adequacy. Capacity Auctions and procurement
contracts provide energy storage assets with an additional revenue stream – very often tied to
4OR is an electricity supply or demand reduction that can be dispatched on short notice in the event of unexpected discrepancy between generation
and load.
5 In order to synchronize generation on the electricity grid, the frequency of the electrical current must be maintained within tight tolerance bounds.
14requirements to be available during defined hours or days – while also helping to meet system-
wide reliability requirements.
Table 3. Wholesale Market Quantitative Assessment 2021-2030
Wholesale Methodology Findings
Market
Real-time • Estimate (at high level) energy arbitrage • System-wide savings from reduced
Energy value between daily peak and off-peak market clearing price in peak hours range
(arbitrage/SBG) prices. from $413 million to $1.09 billion.
• High-level offer curve shows how energy • Savings from reduced curtailed energy
arbitrage can reduce overall system costs. output range from $500 million to $1.5
Savings become more pronounced as billion.
Ontario moves towards LMPs and a
decrease in GA charges.
OR • Calculate the impact of storage resources • Reduced OR costs when energy storage is
lowering OR supply curve, while able to generate can provide much
generating within both the 10-minute OR greater value, potentially $100+ million,
and 30R markets. but requires further system modeling to
estimate more precisely.
System • Calculate costs of IESO's OR Flexibility • The reduced need for flexibility
Flexibility Mechanism and reduce it by amount of procurement can provide $11.7 million to
(excess 30R) storage installed on the system. The IESO $39.5 million in savings.
currently procures 200 MW of additional
30R when it requires greater flexibility. The
introduction of storage may be able to
reduce the need for this procurement.
Regulation • As regulation services are increased, • A reduction in regulation costs can
Services storage can potentially reduce regulation provide $39.3 million to $236.3 million in
costs. savings.
Capacity • Storage will compete in upcoming • Energy storage participation in the
Capacity Auctions and offer below Capacity Auction can provide up to $124
forecasted clearing price. million in savings.
2.1.1 Energy Arbitrage and Reduction in SBG
Energy storage provides system-wide savings to all customers when engaging in energy arbitrage by
lowering peak prices. Our analysis found that in 2019, if 1,000 MW (4,000 MWh) of energy storage with a
90 per cent efficiency rating (i.e. for every MW of charging, the unit will discharge 0.9 MW) participated
in Ontario’s wholesale electricity market, it would have provided between $31 million to $84 million in
system-wide savings in the form of lower on-peak market clearing prices. This is a high-level estimate
and is not based on a dynamic, simulated dispatch model. Over the 2021-2030 timeframe, these savings
range from $413 million to $1.09 billion. Note that these savings do not flow directly to energy storage
facilities but instead flow to all customers in the form of reduced energy prices in the wholesale market.
152.1.1.1 What is Energy Arbitrage and How Does it Relate to Energy Storage?
Energy storage resources in Ontario and other wholesale electricity markets can engage in what is known
as energy “arbitrage”. Arbitrage is the buying of a good in a low-price market and the selling of it in a
higher price market – and earning the spread between the two. In the context of energy storage facilities,
it means charging or storing energy in low price hours and selling that stored energy at a later point when
prices are higher. While some generators are capable of storing energy – some hydroelectric generators,
for example, can pool a limited amount of water behind the dam and release it (generate) in later hours
– most facilities are incapable of large-scale storage. As a result, a significant portion of installed
generation capacity in Ontario – particularly baseload hydroelectric, wind, and nuclear – will continue to
generate in hours when demand and market clearing prices are low.
Ontario has a significant amount of inflexible installed generation capacity, which has led to many hours
when energy is either exported at low or negative prices or facilities are curtailed (i.e. their energy is not
accepted onto the grid by the system operator). Most curtailed energy continues to be paid its contracted
or rate-regulated amount. The lack of large-scale storage is among the factors that ensures that HOEP is
typically depressed in hours when demand is low and that baseload generation is high. Conversely, HOEP
increases in hours when costs are higher, and “peaking” generators are dispatched to meet greater
demand. Energy storage can reduce price volatility by shifting energy throughout the day or over multiple
days. On any given day, energy storage resources would be expected to charge in the early morning
hours when prices are low and to discharge later in the day when prices are higher – arbitraging the price
spread that is common in Ontario and other wholesale markets. 6
By actively participating in the wholesale electricity market, energy storage resources earn the spread
from buying energy in low-price hours and selling it in high-price hours. 7
Beyond simple arbitrage on an hourly basis, many energy storage resources can react quickly in response
to unexpected intra-hour changes on the grid that produce rapid and dramatic price spikes. Take
November 19, 2019, as an example. On that day, the five-minute market clearing price spiked to
$2,000/MWh between 8:00 and 9:00 A.M – up from $0/MWh just three hours earlier. In that hour alone,
prices spiked from $144/MWh to $2,000/MWh within five minutes. Energy storage resources can respond
rapidly to five-minute dispatch signals. As a result, they are capable of rapidly discharging (generating)
in response to prices, mitigating the financial impact of the price spike for electricity customers.
2.1.1.2 Ontario’s Ongoing SBG Problem
Ontario’s baseload generating resources often provide more energy output (i.e. supply) than there is
demand in the province. When this occurs, the province is experiencing SBG. In many instances, this is
resolved by exporting surplus energy to neighbouring jurisdictions such as New York, Michigan, and
Quebec. In other times, when SBG is greater than intertie capacity into other markets or when adjacent
markets are already sufficiently supplied by low marginal cost generation, the IESO must curtail specific
resources, predominantly energy from hydroelectric, nuclear, and wind generators. Typically, in hours of
6 The very lowest average HOEPs in 2019 are in hours 2, 3, 4, and 5, while the four highest average HOEPs are in hours 17, 18, 19, and 20.
7Note that this report’s arbitrage analysis does not include GA charges or other demand charges, which may impact the profitability of energy
arbitrage in Ontario.
16SBG – when nearly all of that surplus supply is coming from resources with low or zero marginal cost –
prices will trend to $0/MWh or negative.
For this analysis, SBG is defined as hours when energy output from nuclear, hydroelectric, and wind
generators is greater than domestic demand. This does not include energy that has been curtailed by the
IESO and, as a result, underestimates the actual number of SBG hours. Nonetheless, in 2019, there were
5,110 hours – or about 58 per cent of all hours in the year – when energy output from these baseload
generators in Ontario was greater than provincial demand. SBG conditions were prevalent in nearly all
hours when HOEP was $0/MWh or below. In total there were 1,733 hours when HOEP was $/MWh or
negative, with SBG occurring in 1,709 of those hours.
Table 4. Negative HOEP and SBG in 2019
Total Number of Hours in % of All Hours
2019
Hours where HOEP is $0/MWh or less 1733 20%
Hours total SBG (nuclear, hydro and wind 5110 58%
output greater than Ontario demand)
Number of hours of limited SBG (i.e. 2865 33%
nuclear and hydro energy output
greater than Ontario demand)
Number of hours when HOEP is $0/MWh 1709 20%
and SBG was also occurring
As noted previously, hours where SBG is prevalent typically correspond with hours when prices are
$0/MWh or below. Figure 5 highlights this. The early morning hours experience the most severe SBG
conditions. These hours also have the lowest average HOEP. Conversely, hours with highest average HOEP
are the same hours when demand is met by dispatching higher-cost generators – predominantly gas-
fired generators, peaking hydroelectric generating units, and imports. Figure 5 below plots the difference
between demand in Ontario and energy output from nuclear, hydroelectric, and wind generators. In hours
where the chart is negative, Ontario demand is, on average, below output from these resources and the
province is experiencing SBG. Conversely, in hours where the chart is positive, demand is being met by
energy output from higher-cost generators.
17Figure 5. Ontario Demand Compared to Nuclear, Hydro, and Wind Energy Output
Additionally, nearly all variable generators (VGs) – wind and solar – are paid nearly their full contracted
price in hours when they are curtailed by the IESO. Most hydroelectric generators are made financially
whole to a similar extent. The IESO does not publish detailed data on curtailed energy but does provide
an annual total of 3.2 TWh of curtailed energy in 2019. Regarding VGs specifically, 2.6 TWh of energy was
curtailed, accounting for 18 per cent of the total energy output from all VGs. While the IESO does not
publish granular data, most if not all of that curtailment would have occurred in hours when prices were
$0/MWh or negative and SBG was prevalent. In these cases, electricity customers are paying for energy
that, to a large extent, goes to waste. If all of that energy came from generators with a Feed-in-Tariff
contract, the cost of the curtailed energy from VGs was more than $348 million in 2019 alone. Our analysis
assumes that this cost can be reduced by $50 to $150 million annually, but note that there is little granular
data upon which to base a full assessment of savings. The planned closing of the Pickering Nuclear
Generating Station in the mid-2020s may also reduce the prevalence of SBG in Ontario.
2.1.1.3 Energy Storage and Ontario’s Negative Price Phenomenon
Ontario’s more than decade-long generation capacity surplus – with a large portion of that capacity
installed as baseload resources with $0/MWh or low marginal cost – has resulted in a steady decrease in
HOEP. More specifically, the number of hours in which HOEP is $0/MWh or negative has increased
through that time. Ontario’s wholesale electricity market has a number of unique features, making a direct
comparison to other wholesale markets in North America difficult. It is nevertheless worth noting that the
Ontario wholesale market experiences $0/MWh or negative prices far more often than neighbouring
jurisdictions (see Table 6).
18Table 5. Negative Prices in Ontario Compared to Neighbouring Jurisdictions
IESO NYISO MISO ISO-NE PJM
Hours in 2019 when wholesale
electricity prices were $0/MWh or 1,733 21 2 52 4
less
2.1.1.4 How Does Energy Storage Provide Savings in the Wholesale Market?
Energy storage’s value in the wholesale electricity market comes from moving energy from low-value to
high-value hours. In doing so, it provides system-wide savings for all customers. While this is not unique
to Ontario, the province’s supply mix and market conditions, as detailed in the previous section, make
this value proposition particularly pronounced in Ontario. Energy storage’s full value is particularly
noticeable when compared against a typical supply curve in Ontario.
A supply curve is a set of offers from generators stacked from lowest to highest based primarily on their
marginal cost of production. When generators offer into the wholesale electricity market at their marginal
cost, they offer at the cost it takes to produce the next unit of energy. HOEP is set at the price of the last
generating resource required to meet demand, and all generators are then paid this price.
As discussed in previous sections, Ontario has a large amount of installed generation capacity with low
or zero marginal cost – including nuclear, hydroelectric, and VGs. In low-demand hours, such as the
overnight and early morning hours, energy output from those resources is often greater than demand –
with that output either being exported at low prices or curtailed by the IESO. In these hours, demand
from an energy storage resource is expected to have little impact on HOEP, as the increase in demand
will likely be met by zero or low marginal cost generators. Conversely, in high demand hours, demand is
often met by higher-cost thermal units and, as a result, stored energy from low-price hours can undercut
these facilities and, in the process, reduce HOEP paid by all customers. This is a system-wide savings for
all customers.
The following figure provides an example of a shift in the demand curve in off-peak hours due to energy
storage charging, and a corresponding decrease in demand in peak hours when an energy storage
resource would discharge. Note that in reality, when an energy storage resource discharges (generates)
it would move the supply curve, not demand, but the impact on market clearing prices would be the
same.
19Figure 6. Supply Curve in Ontario
2.1.2 Savings in the Operating Reserve Markets
Energy storage resources are expected to participate as loads in the OR market when charging and as
generators when sitting in stand-by mode and capable of generating. Given the low operating and
opportunity cost of energy storage resources when participating as a load during low-price hours, we
estimate that they would reduce the market clearing price of OR paid by all customers. Over the 2021-
2030 timeframe these savings could reach up to $4.8 million.
OR is stand-by power that IESO can dispatch in response to unexpected conditions on the grid – a sudden
outage at a generation facility, for example. Currently, there are three types of OR: 10-minute spinning
(10S); 10-minute non-spinning (10N); and, 30-minute reserve (30R). It is expected that energy storage
resources can participate in the OR market and supply all three types of OR.
The analysis assumes that energy storage resources participate in the 10S market as a load in the hours
when they are charging – although energy storage can also act as a generator. Given that OR and the
energy markets are co-optimized, the system-wide value of savings in these low-price hours is limited.
Energy storage resources are capable of participating in all OR markets, but were only assessed in the
10S market for this analysis. Due to the near instantaneous response time of energy storage, it can easily
meet the 10-minute response time requirements of 10S OR in all hours of the day as a generator, even
though the storage resources would technically not be spinning.
2.1.3 Savings Through Reduced use of Flexibility Mechanism
Our analysis assumes that at least some – if not all – of the procurement related to the IESO’s Flexibility
Mechanism may not be needed given energy storage’s inherent ability to quickly respond to unexpected
20changes on the grid. Over the 2021-2030 timeframe these savings could range from $11.6 million to $39.5
million.
Ontario’s electricity grid has undergone significant changes over the last decade. As part of these changes,
the province has introduced a large number of VGs. Due to the variable nature of these resources – their
energy output is based on ambient weather conditions that can change instantaneously – their large-
scale introduction has resulted in the need for greater system-wide flexibility. In 2016, the IESO began a
public consultation on how ensure greater flexibility in order to manage VGs.
In 2018, the IESO formalized its approach, which sees it procure 200 MW of additional 30R in hours when
it forecasts the need for greater flexibility. The IESO has not publicly provided data on how often it uses
this Flexibility Mechanism or on its total cost. While the IESO initially expected that it would not require
the Flexibility Mechanism past 2023, it now expects it to use it indefinitely. Energy storage can reduce the
need for this form of procurement.
2.1.4 Reducing the Cost to Ratepayers of Cost Guarantee Programs
Our analysis suggests that energy storage could reduce the need for and reliance on the Real-Time
Generator Cost Guarantee (RT-GCG) program within the wholesale market, given the ability of energy
storage to react quickly to unexpected events without requiring hours to reach a “warm” state. Over the
2021-2030 timeframe these savings could range from $43.4 million to $173.7 million.
The IESO operates a number of programs that guarantee the start-up and other costs for gas-fired
generators to ensure these facilities are available to the IESO to maintain grid reliability. Cost guarantee
programs such as the RT-GCG have been a part of Ontario’s electricity market since 2003 and are also
common in other wholesale electricity markets. The Market Surveillance Panel – a panel overseen by the
OEB that monitors, investigates, and reports on the wholesale electricity market – has repeatedly analysed
the guarantee programs and provided recommendations to reduce costs associated with them. It has
quantified IESO RT-GCG payments to generators in 2019 at $33 million.
An increase in energy storage capacity in Ontario should reduce the need and reliance on guarantee
programs, particularly the RT-GCG. Energy storage has well known capabilities to react to unexpected
and rapid changes in demand or supply in real-time. Furthermore, unlike gas-fired generators, once
energy storage has been charged in off-peak hours, it can react nearly instantaneously and requires
neither start-up costs nor hours of time to reach a safe operating state. Gas-fired generators also require
minimum run times, resulting in them operating for longer periods of time than may be economic, and
adding to the SBG challenges described earlier.
2.1.5 Reducing the Cost of Providing Regulation Services
Energy storage resources are particularly well-suited to provide regulation service. The Hornsdale Power
Reserve facility in Australia, for example, has provided more accurate and responsive regulation services
at a lower cost than traditional thermal generators. Over the 2021-2030 timeframe these savings could
range from $39.4 million to $236.3 million.
21In order to maintain the reliability of the grid, the IESO must ensure that energy output from generators
matches total load. In order to correct for variations, the IESO contractually procures regulation services.
Resources supplying regulation services are paid to have their energy output adjusted by the IESO in real-
time as needed to maintain the reliability of the grid. In 2019, the IESO paid more than $60 million for
regulation services, and it has stated publicly that it intends to procure a greater amount of such services
in the future.
Energy storage resources can provide effective regulation services due to their fast-response capabilities.
As mentioned, in Australia the Hornsdale Power Reserve – a 100 MW Tesla storage facility – has provided
more accurate and responsive regulation service than traditional thermal generators. Additionally, it has
been able to provide this service at a lower cost – as much as 91 per cent cheaper in certain instances. 8
Similarly, in Ontario, the NRStor two MW Minto Flywheel facility has demonstrated a performance that is
two-times more effective than traditional assets.
2.1.6 Savings in the Capacity Auction from Greater Energy Storage Participation
Energy storage resources can offer a fixed amount of capacity as part of the IESO’s Capacity Auctions.
Currently, Capacity Auctions are limited to demand response (DR) resources, but future Capacity Auctions
will permit participation from other select resource types, including some forms of energy storage. This
analysis assumes that energy storage facilities participate in Capacity Auctions from 2023 to 2030. Based
on a current forecast for clearing prices and procurement amounts, energy storage facilities are expected
to reduce the Capacity Auction clearing price by five per cent annually, providing $124 million in savings.
IESO estimates of needed supply capacity to be procured through Capacity Auctions are prone to
uncertainty. Further, even though some energy storage resources will be permitted to participate within
Capacity Auctions, it is not certain when energy storage resources will fully participate. Instead, energy
storage resources may offer only a portion of their available surplus capacity that is not being used to
provide other services (i.e. arbitrage, regulation, reliability, etc.).
In addition to stand-alone energy storage, there is opportunity for energy storage to be co-located with
existing VGs (approximately 7,000 MW of which are in operation in Ontario) and other generation sites
to provide additional capacity toward resource adequacy requirements. Recent studies 9 have indicated
the value of co-locating energy storage with VGs, including cost synergies and market value synergies,
while recognizing the need to consider operational and siting constraints and the need to address market
and regulatory uncertainty that currently hinders hybrid generation systems.
8 See Arena Insights Forum presentation, November 2018. https://arena.gov.au/knowledge-bank/arena-insights-forum-november-2018-lsp-
summary/
9A. Gorman, A. Mills, M. Bolinger, A. Wiser, N.G. Singh, E. Ela, E. O’Shaughnessy. Motivations and options for deploying hybrid generator-plus-
battery projects within the bulk power system. The Electricity Journal, Volume 33, Issue 5. 2020. Retrieved from
https://www.sciencedirect.com/science/article/pii/S1040619020300312
222.2 Electricity Infrastructure Savings in Ontario
Energy storage resources can reduce costs in the transmission and distribution sectors in Ontario by:
• Deferment of Transmission Assets: The installation of energy storage resources at specific
locations on the grid can increase the utilization of existing transmission assets and defer new
investments required for system needs based on regional planning requirements.
• Deferment of Distribution Assets: Energy storage resources can increase the utilization of
existing distribution assets and defer new investments throughout a distributor’s service
territory and also augment distribution system planning.
Table 6. Electricity Infrastructure Quantitative Assessment 2021-2030
Electricity Methodology Findings
Infrastructure
Deferment of • Review regional planning documents and • Savings from deferred transmission
Transmission identify system needs for thermal capacity investment range from $314 million to
Assets overload $556 million
• Assess deferment potential of traditional
electricity infrastructure (e.g. transmission
station) by deploying energy storage
resources
• Cost savings derived from avoided
amortization payment of traditional
electricity infrastructure until a utilization
threshold is achieved (i.e. percentage of
excess demand to total traditional
investment capacity)
Deferment of • Determine amount of gross capital • Savings from deferred distribution
Distribution expenditures that are spent on system investment range from $142 million to
Assets expansions using the system service $284 million
category of distributor spending
• Forecast future capital expenditures based
on historic relationship of capital
expenditures to load growth
• Calculate cost savings of deferred capital
expenditures using energy storage
facilities located within the distributor
service territory
2.2.1 Electricity Infrastructure and Non-Wires Solutions
Energy storage can be used by grid owners and operators as non-wires solutions to address power system
needs. Compared to traditional transmission and distribution investments, non-wires solutions provide
greater flexibility as well as the ability to offset installed costs with additional revenue streams (derived
from wholesale markets and direct-to-customer savings). Energy storage may be an attractive solution
for utilities if the savings from deferred investments are stacked with other value streams.
23Realizing cost savings from the deferment of traditional transmission and distribution (T&D) investments
is not fully enabled in Ontario’s current regulatory framework. Regulated utilities do not have sufficient
guidance for the treatment of revenues derived from wholesale markets through the operations of energy
storage solutions. Given this lack of clarity, utilities discount these potential revenues, and therefore
energy storage solutions may be deemed uneconomic compared to traditional utility T&D investments.
Regulated utilities, including some ESC members, have a responsibility to consider least-cost options
within their distribution system plans, including balancing investments in operations and maintenance
with capital expenditures. Further guidance would be helpful for the entire sector. For example, instead
of making an investment in a traditional wires solution, a utility could contract for services from an
unregulated entity if the services obtained meet reliability and system needs. Under this arrangement, a
utility could procure services from an energy storage operator, the owner of which would have the
flexibility to offer excess capabilities (such as supply of ancillary services) to the wholesale market or other
customers. The unregulated energy storage operator would be incented to maximize revenues from other
value streams, in order to provide the most competitive offering to regulated utilities, and would bear
the risks associated with those additional revenues.
While Ontario’s Local Distribution Companies (LDCs) are subject to performance-based regulation, their
revenue requirements and return expectations are primarily based on capital expenditures. LDCs do not
earn a regulated rate of return when implementing service-based solutions. In contrast, other
jurisdictions 10 have recognized the need to re-align regulated utility revenue-setting mechanisms and
profit incentives, to ensure they do not impede identification and adoption of innovative solutions, such
as those available from energy storage.
The analysis suggests that the gross savings potential for deferred regional T&D investments could range
from $315 million to $556 million over the next decade. For deferred distribution capital expenditures,
gross savings could range from $142 million to $284 million over the same time period.
2.2.2 Energy Storage Deferment Potential for Electricity Infrastructure
Most T&D assets are constructed to meet peak power system needs. Energy storage can be used to
reduce capacity overloads during peak demand periods and increase the utilization of the existing power
system. This defers the need for new T&D investments to meet demand growth expectations and offers
potential savings for Ontario electricity customers.
Energy storage-based T&D capacity reductions come in various sizes and configurations. For example, a
large energy storage facility could be sited at an existing transmission station to remove the capacity
overload of its transformers. Alternatively, an aggregation of energy storage alongside customers could
be used to reduce demand and strain on the distribution system. When the energy storage facilities are
not reducing peak demand on a regional or local power system, the energy storage facilities could provide
additional supply and services, within wholesale markets and/or direct to customers.
10 See for example discussions held by the OEB at its consultations related to utility remuneration in August and September 2019:
https://www.oeb.ca/industry/policy-initiatives-and-consultations/utility-remuneration.
24You can also read


