Final Draft Burwood East Retail Centre - Economic Impact Assessment - Whitehorse City Council
←
→
Page content transcription
If your browser does not render page correctly, please read the page content below
Final Draft
Burwood East Retail Centre
          Economic Impact Assessment

                             July 2016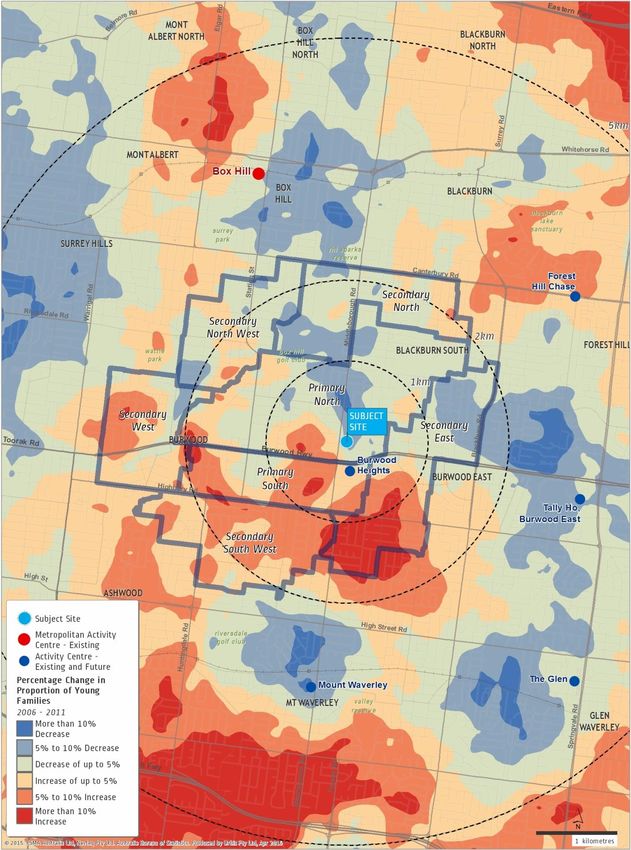
URBIS STAFF RESPONSIBLE FOR THIS REPORT WERE:

Director                  Jeff Armstrong
Senior Consultant         Catrin Griffiths
Consultant                Dene MacLeod
Job Code                  MPE1-2215
Date                      September 2015 (minor updates July 2016)

© Urbis Pty Ltd
ABN 50 105 256 228

All Rights Reserved. No material may be reproduced without prior permission.

You must read the important disclaimer appearing within the body of this report.

URBIS
Australia Asia Middle East
urbis.com.au
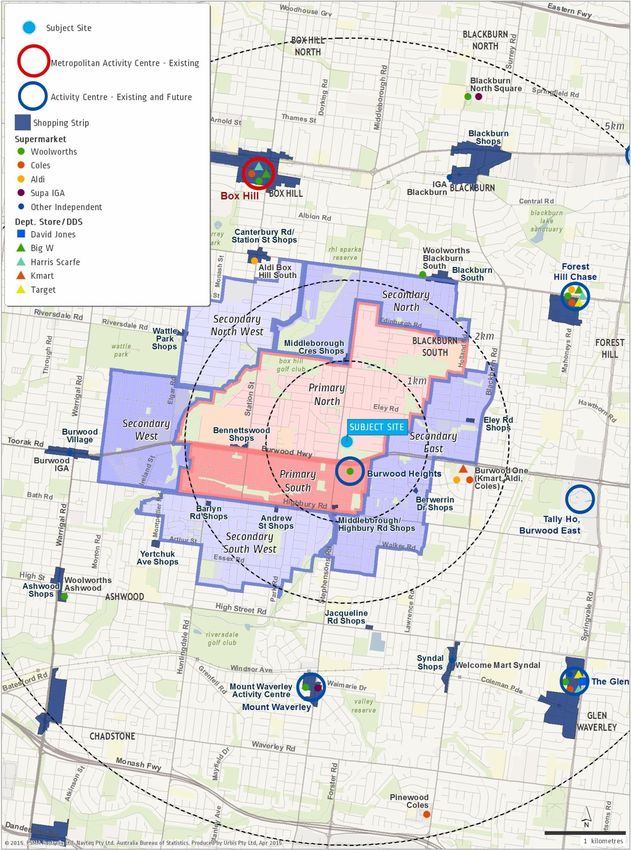
TABLE OF CONTENTS

Executive Summary ..................................................................................................................................... i

Introduction .................................................................................................................................................. 1

1          Site Context and Proposed Development ..................................................................................... 2
1.1        Location and Site Attributes ...............................................................................................................2
1.2        Historical Context...............................................................................................................................2
1.3        Proposed Development .....................................................................................................................3

2          Trade Area Market ........................................................................................................................... 4
2.1        Catchment Definition .........................................................................................................................4
2.2        Population Forecasts .........................................................................................................................7
2.2.1      Municipality Population Forecasts .....................................................................................................7
2.2.2      Trade Area Population .......................................................................................................................8
2.3        Socio-Economic Characteristics ..................................................................................................... 10
2.3.1      Trade Area Trends.......................................................................................................................... 10
2.3.2      House Prices .................................................................................................................................. 13
2.4        Trade Area Retail Spending ........................................................................................................... 20
2.4.1      Per Capita Retail Spending ............................................................................................................ 20
2.4.2      Total Retail Spending ..................................................................................................................... 20

3          Retail Supply ..................................................................................................................................21
3.1        Current Offer in Centres ................................................................................................................. 21
3.1.1      Centres in the Broader Region ....................................................................................................... 21
3.1.2      Centres in the Local Region ........................................................................................................... 23

4          Market Need & Demand Analysis.................................................................................................35
4.1.1      Market Growth ................................................................................................................................ 35
4.1.2      Supermarkets ................................................................................................................................. 35
4.2        A Distinctly Progressive Local Centre ............................................................................................ 38
4.3        Improvements to the Brickworks Site ............................................................................................. 39

5          Trading Impact Assessment .........................................................................................................40
5.1        Burwood East Retail Centre Turnover Potential ............................................................................. 40
5.2        Impact Assessments ...................................................................................................................... 42
5.3        Methodology ................................................................................................................................... 42
5.4        Impacts ........................................................................................................................................... 43

6          Net Community Benefit Analysis .................................................................................................46

Disclaimer ..................................................................................................................................................48

URBIS
BURWOOD EAST RETAIL EIA JULY 2016
Executive Summary
The key findings and conclusions of the Economic Impact Assessment for the proposed Burwood East
Retail Centre are as follows:
Proposal
Frasers Property Australia is proposing to develop the 20.5 hectare former brickworks site in Burwood
East to include a mix of housing and a new shopping centre and social hub. The shopping centre
component of the development, referred to as the Burwood East Retail Centre in this report, is
planned to provide around 10,530 sq.m of leasable floorspace including approximately an expected
9,630 sq.m of shopfront uses, including a 4,500 sq.m full-line supermarket. The balance of the
subject site is earmarked for development of around 950 dwellings that will provide a range of
housing choices for the market.
Market Analysis
With good levels of population density in the area, the centre will serve a sizeable catchment with
around 40,000 residents within the next 3-4 years and close to 43,000 residents by 2021. The
Frasers Property Australia development alone will provide another 2,500 residents in the primary
sector of Burwood East Retail Centre’s trade area who will generate significant demand for retail uses
and services.
The socio-economic profile of trade area residents indicates a generally established and older aged
market with lower incomes but likely good asset wealth. The trade area is in a process of change
with an increasing ethnic population (notably persons from Asia) and improving incomes in areas in
proximity to Burwood East. In the future, the expectation is for an increasing rate of regeneration and
gentrification of older households, with the expectation of new families and better income households
moving into the area.
Currently (2014), residents generate some $500 million (incl. GST) in expenditure on retail goods and
services. With forecast population growth and increases in real spending per capita, the available
resident retail spending market is forecast to grow to some $565 million by 2018, and $615 million by
2021 (expressed in constant 2014 dollars incl. GST).
The growing and changing market will generate demand for a greater range of retail spaces and
better quality shopping environment of retail and services in the area. The Burwood East Retail
Centre can serve as an integral piece of infrastructure to address future market demand and provide
a higher quality retail and social hub that delivers a superior level of amenity and physical space to
that of other centres in the area.
Existing Retail Supply
A detailed review of the existing supply of retail facilities and services in the area indicates the area
includes a range of shopping centres and shopping strips providing mainly day-to-day convenience
retail and services needs.
The larger sub-regional centres (Forest Hill and Burwood One) have recently been redeveloped,
however the majority of the smaller neighbourhood centres are represented by older format
supermarket based centres and small to mid-sized shopping strips, many of which are quite
dated in their physical appearance and have issues with the level of amenity in the offer.
In this regard there is a market need for a good quality local shopping centre that provides a
significantly better experience for shoppers and the local community.
URBIS
BURWOOD EAST RETAIL EIA JULY 2016 EXECUTIVE SUMMARY i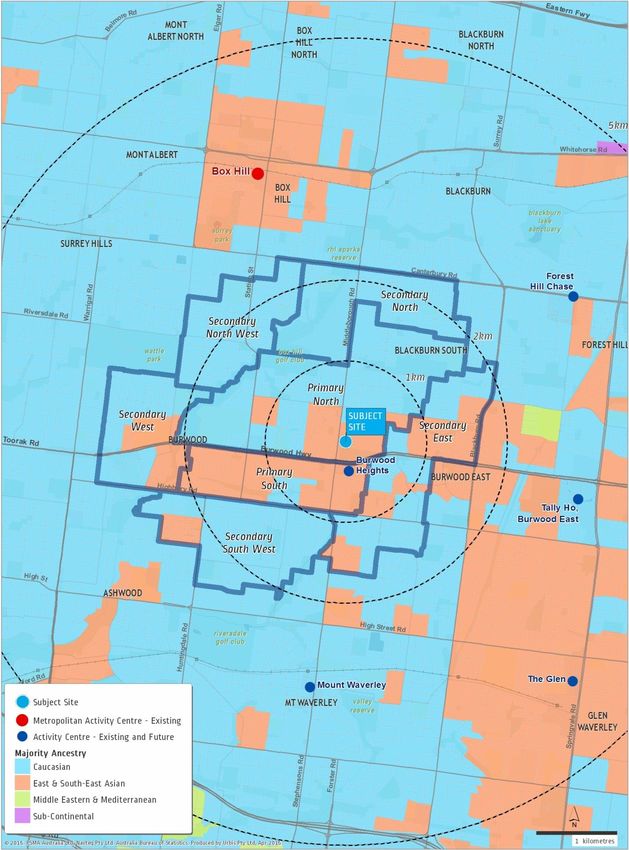
Market Need and Demand
The proposed Burwood East Retail Centre development addresses many market needs and demand
including:
Completing the overall offer in the broader Burwood East activity centre that would satisfy the
variety of daily/weekly needs of households. This includes a mix of retail, services, medical and
community uses complementing the existing Burwood Heights offer. Notably, the development
addresses the need for another full-line supermarket in a market where there is a lower than
typical supply of supermarket floorspace and generally above benchmark trading stores.
A highly convenient shopping destination with a good provision of carparking and easy site
ingress and egress.
A unique and appealing environment which would provide a superior ambience and capitalises on
the natural features of the area (e.g. planned adjoining parkland), including a high amenity food
and beverage dining precinct.
The development would also vastly improve the visual appeal, amenity and profile of the area.
This will have an immediate positive impact for residents in the adjoining houses and the overall
growth and role of the Burwood Heights activity centre.
Trading Impact Assessment
There is market capacity to support the proposed Burwood East Retail Centre development and the
9,100 sq.m of retail tenants have the potential to achieve $74 million (2014 dollars, including GST) in
turnover in 2018, which is the assumed opening year of the development. This retail turnover
includes $57 million of turnover by food tenants and $17 million of turnover by non-food tenants.
Market shares required to support the potential turnover are 17% from the primary trade area and
10% overall from the main trade area. These market shares are consistent with the market
penetration of centres with a similar retail role and scale.
The assessed trading impacts are within manageable levels for the affected centres. All centres
would continue to achieve an average trading level similar to or above their current estimated trading
level. The centre expected to accrue the highest percentage impact is the existing Burwood Heights
shopping centre. This centre will continue to trade at a level some 6% above the average for a
supermarket based centre (based on the Urbis Retail Averages for supermarket based centres, which
are generally well managed centres) and the majority of the impact is expected to be on the
estimated strong trading Woolworths supermarket.
In volume terms, the highest impact is expected to fall on Burwood One. This centre is currently the
highest order shopping centre in the catchment and would draw well from the Burwood East trade
area. The introduction of a new centre at Burwood Heights will therefore result in some transfer of
spending away from Burwood One but the one-off impact is within an acceptable and sustainable
range. Burwood One’s turnover productivity in 2018 is estimated to be around $7,240 per sq.m (2014
dollars) which is 1.5% higher than the existing estimated average trading level of $7,130 per sq.m.
Of note, the sizeable expansion of the Burwood One centre in 2012 is understood to have not had an
adverse impact on other centres in the area, including Burwood Heights shopping centre.
Forecast retail spending market growth due to population growth and improving incomes in the trade
area would be expected to largely offset the impacts and provide the opportunity for existing centres
to make improvements in response to the new competition. In fact, the affected centres, as is the
case in any healthy competitive environment, have the opportunity to recapture lost market share
through, for example, refinements to the tenant mix, upgrades to the centre’s presentation/signage
and/or expansion of retail floorspace.
It is also relevant to note that the Burwood East Retail Centre development will have a lower overall
impact compared with the previously approved Reading proposal. The amount of retail turnover
generated by the development will be half that forecast for the Reading proposal.
The impacts on neighbourhood scale centres estimated in the previous assessment were within a
similar range to that assessed by Urbis for the Frasers Property Australia development. This is not
surprising given the previous scheme included a similar range of food & grocery and convenience
retail as is being proposed for the Frasers Property Australia development.
ii EXECUTIVE SUMMARY
URBIS
BURWOOD EAST RETAIL EIA JULY 2016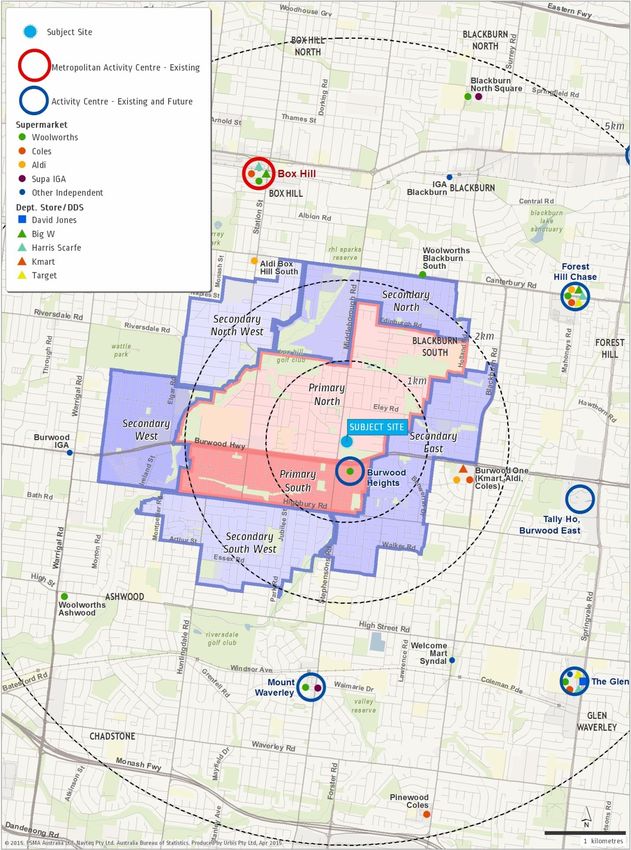
Net Community Benefits
With no loss of services expected at other centres the introduction of a new range of services would have
an overall net community benefit. The proposed Burwood East Retail Centre development would have
the following benefits:
More retail floorspace available in the catchment brings with it more choice and more competitive
pricing in the products and services offered to existing residents. The additional population growth
within the local area as well as the existing strong trading supermarket at Burwood Heights drive
demand for additional retail floorspace in the vicinity. In addition, we understand Frasers Property
Australia plans to secure retailers with a point of difference from the existing Burwood Heights centre
and other centres in the area in order to serve a broad spectrum of day to day needs, including a
lifestyle, health and wellbeing precinct and food and beverage precinct.
The Frasers Property Australia development proposal will improve a site that has sat dormant for
almost twenty years and been a blight on the local area. Frasers Property Australia’s masterplan,
which includes 950 dwellings, a town centre and new public space, will improve the overall amenity of
the Burwood Heights activity centre. The activity generated by the development will attract more
visitors to the area as a whole which will have flow-on benefits to the balance of the Burwood Heights
centre in terms of commercial activity and improved perceptions of safety and security. The
development is also expected to act as a catalyst for new investment in the area.
The Frasers Property Australia development proposes a well designed and integrated retail and
social hub that will provide a higher level of amenity than other centres in the area. Most of the
existing centres consist of ageing shopping centres and shopping strips that straddle main roads (e.g.
Blackburn South, which is bisected by Canterbury Road). It will also provide an important piece of
infrastructure that will address the need for another supermarket, more retail floorspace and services
and cater to the demand generated by the new residents that will occupy the 950 dwellings and
existing residents in the area.
Many of the existing activity centres in the area are not necessarily well equipped to respond to
change in consumer needs and demand and to deliver an overall desired improved level of amenity
(e.g. upgrades to the presentation, quality of retailers, etc.). Without significant improvements to the
centres over time and introduction of a new higher quality development as proposed by Frasers
Property Australia, the community will be increasingly underserved and will likely direct an increasing
share of their expenditure to centres further away. This outcome reduces the levels of local activity
and associated benefits as well as results in residents travelling longer distances for their regular
shopping and services requirements. This can have adverse economic, social and environmental
impacts.
The addition of a planned range of non-retail uses, lifestyle and wellbeing uses and community
services will increase the community’s opportunity for linked trips within the Burwood Heights activity
centre. Non-retail uses are yet to be finalised but could include gym/personal training, childcare
centre, medical centre/hub – which add to the overall vitality of the centre, help support the retail
shops and bring new services and greater choice to the market.
A positive impact on employment opportunities, both locally and in the broader economy. The
employment generated by the development falls into two broad categories:
Total ongoing employment generated from the operation of the centre, both in the supermarket
and the specialty shops, offices and community uses. There would also be flow-on employment
(multiplier effects generated by increased demand for goods and services as a result of increased
consumption by the employees at the centre.
Employment generated during the construction phase of the project and its flow-on effects on
employment. The flow-on employment results from increased demand for materials, services and
products from a range of suppliers during the construction of the centre.
On balance the Frasers Property Australia development, including the proposed retail centre, is an
appropriate development that addresses market needs and demand and will overall provide a net
community benefit.
URBIS
BURWOOD EAST RETAIL EIA JULY 2016 EXECUTIVE SUMMARY iii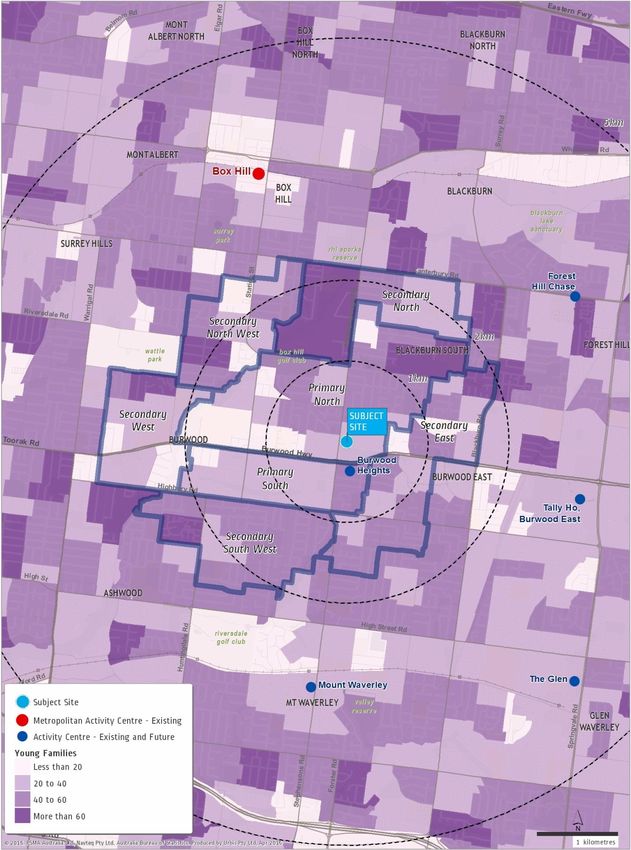
Introduction
Urbis has been commissioned by Frasers Property Australia to prepare an Economic Impact Assessment
(EIA) for the proposed Burwood East Retail Centre development.
The key objectives of the EIA report are as follows:
Assess the market need and demand for the proposed development.
Assess the potential economic impacts and community benefits of the proposed development.
Frasers Property Australia is proposing to develop the 20.5 hectare former brickworks site to include a
mix of housing and a new shopping centre and retail and social hub. The shopping centre component of
the development, referred to as Burwood East Retail Centre in this report, is planned to provide around
10,530 sq.m of leasable floorspace including approximately an expected 9,630 sq.m occupied by
shopfront uses.
In 2008 the City of Whitehorse approved a masterplan for the site put forward by Burwood Developments
Pty Ltd (which was a subsidiary of Reading Properties Pty Ltd). Compared with the masterplan proposed
by Frasers Property Australia, the Burwood Square development scheme included less housing and a
significantly larger shopping centre comprising 36,600 sq.m retail floorspace, a 17 screen cinema
complex, and a range of other specialty uses and entertainment facilities on the site totalling 8,260 sq.m.
In preparing the EIA for the Frasers Property Australia proposal Urbis has reviewed the previous EIA
report prepared by Deep End Services (titled Burwood East Economic Impact Assessment, dated 7 July
2008) for Burwood Developments’ scheme and provided comparisons between the findings of the two
EIAs.
The report is structured as follows:
Section 1 reviews the subject site, including location attributes, the new proposed master plan and
the Burwood Heights Activity Centre Structure Plan.
Section 2 defines the trade area for proposed Burwood East Retail Centre, reviews trade area
demographics and forecasts the current and future trade area population and retail spending market.
Section 3 reviews the existing and proposed retail supply in the region of relevance to Burwood East.
Section 4 assesses the need and demand for the shopping centre, market capacity for a new
supermarket, an impact assessment of the development on other centres and potential economic and
community benefits associated with the proposed Burwood East Retail Centre.
URBIS
BURWOOD EAST RETAIL EIA JULY 2016 INTRODUCTION 1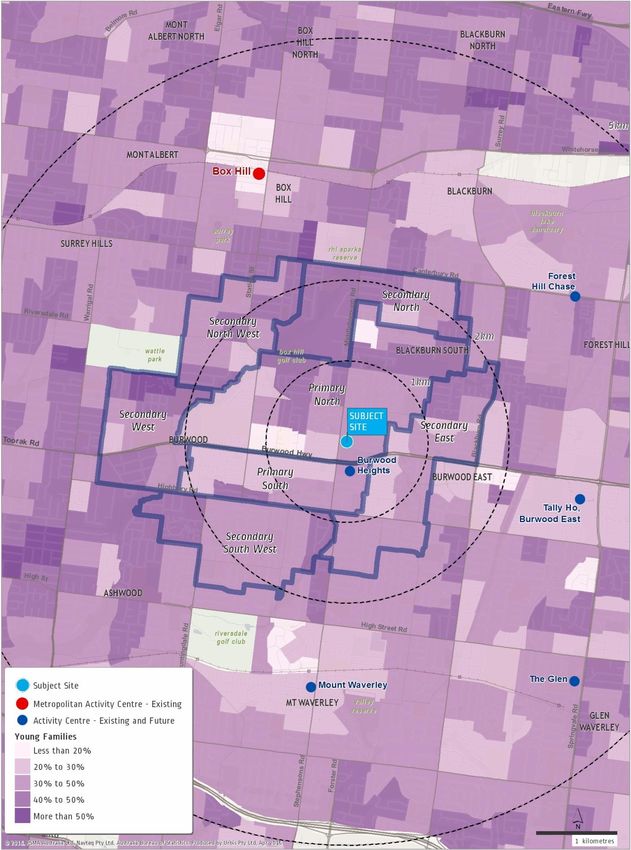
1 Site Context and Proposed Development
This section of the report reviews the site context, including its history, former development application,
location attributes and planning context.
1.1 LOCATION AND SITE ATTRIBUTES
The subject site is located on the eastern side of Middleborough Road and near the intersection with the
Burwood Highway. The site is located within the Burwood Heights Activity Centre, which also comprises
the Burwood Heights shopping centre and offices of the RSPCA. A vacant development site, which is
earmarked for medium to higher density residential, is located on the north-east corner of the Burwood
Highway and Middleborough Road intersection.
Middleborough Road carries good volumes of vehicle traffic past the subject site (some 24,000 vehicles
per day according to VicRoads data), which is supported by its role as a key north-south thoroughfare in
the region and several key drawcard retailers (e.g. Bunnings and Masters hardware stores) and an
employment hub (Clarice Road) in the vicinity of the site.
1.2 HISTORICAL CONTEXT
Formerly occupied by a brickworks, the 20.5 hectare subject site has remained vacant for almost two
decades.
The site was purchased by Reading Entertainment in 1995. Reading gained approval for a sizeable
mixed use development project including higher density housing and a shopping centre of some 22,000
sq.m retail floorspace. The shopping centre was planned to include a discount department store,
supermarkets, a range of mini-majors and specialty shops as well as a large cinema complex, other
entertainment/leisure facilities (e.g. bowling) and a dining precinct along with offices and public space,
totalling some 63,560 sq.m in floorspace.
This development project never advanced past the planning phase. The site was ultimately sold to
Australand (now Frasers Property Australia) in 2014 and the new owners are planning a revised form of
development on the site which includes a range of housing, shopping centre and complementary uses
and public space.
Several planning documents relate to the site, of which the key document is the Burwood Heights Activity
Centre Structure Plan, June 2006. Key points to note are as follows:
The site is designated as a major strategic redevelopment site, which is supported by its Priority
Development Zone (PDZ). Burwood Heights as a whole was designated as a Major Activity Centre
under Melbourne 2030 and the centre remains classified as an Activity Centre under Plan Melbourne
(2014).
The plan encourages mixed use development with retail, commercial, housing, entertainment and
leisure uses on the former brickworks site while recognising appropriate regard should be given to the
existing retail hierarchy.
Community feedback offered broad support for development to occur at the former brickworks site
while raising local issues (e.g. traffic management).
2 SITE CONTEXT AND PROPOSED DEVELOPMENT
URBIS
BURWOOD EAST RETAIL EIA JULY 2016
1.3 PROPOSED DEVELOPMENT
The masterplan for the former brickworks site proposes significant improvements, including a mix of
housing providing around 950 dwellings, shopping centre, new public space and complementary
commercial and community facilities.
The key features of the proposed development are as follows:
The majority of the site will be developed to accommodate some 950 dwellings providing the market
with variety of housing choices.
A new town centre and retail and social hub will be developed on a site fronting Middleborough Road
and extending from the existing RSPCA site. The centrepiece of the town centre will be a new
shopping centre providing 10,530 sq.m of leasable floorspace including an expected 9,630 sq.m of
shopfront uses. The shopfront uses include:
A 4,500 sq.m full-line supermarket.
A 1,200 sq.m large format liquor store.
Approximately 3,400 sq.m of retail specialty shops, including a dining precinct taking advantage
of the adjoining proposed parkland.
Approximately 530 sq.m of non-retail shopfront uses.
A range of commercial and community facilities, such as a gym, commercial offices and medical
centre, are also being considered as part of the overall suite of uses on the site to provide a multi-
functional town centre that satisfies the range of retail, leisure and services needs of the community in
one location (the broader Burwood Heights Activity Centre).
Sufficient provision of carparking to support the range of uses on the site, split across an at-grade
carpark and basement carparking.
New parkland which would extend along the eastern side of the town centre.
New road infrastructure, including a link road / main boulevard providing access to the town centre
from Middleborough Road and the Burwood Highway.
The proposed development contributes to the strategic principles for the Burwood Heights Activity Centre
(e.g. role and function, movement, form, open space and environment, etc.) as outlined in the Burwood
Heights Structure Plan.
URBIS
BURWOOD EAST RETAIL EIA JULY 2016 SITE CONTEXT AND PROPOSED DEVELOPMENT 3
2 Trade Area Market
This section defines a suitable catchment for the proposed Burwood East Retail Centre site and outlines
forecast population growth and demographic change within the catchment and broader region.
2.1 CATCHMENT DEFINITION
The proposed trade area served by a supermarket based centre on the Burwood East Retail Centre site
has been defined based on the following considerations:
The location and quality of competing shopping centres and precincts.
The accessibility of the centre, having regard to the road network.
The geographical and physical barriers to access, e.g. contours of the land, parks and rivers.
The trade area to serve the proposed centre is shown in Map 2.1. The trade area is typical of
supermarket based centres, which have a strong local catchment usually within 2 to 2.5 km of the centre,
reflecting the local convenience offer.
The subject site is located on the eastern side of Middleborough Road, near the corner of Burwood
Highway. The key factors influencing the trade area of the centre are as follows:
The extent of competitive retail supply is less to the north and west of the subject site. In particular,
there are few conveniently located options for supermarket and associated shopping in the west. The
trade area therefore would naturally have a skew in these directions.
Burwood Heights and Burwood One shopping centres would have the most influence on the trade
area. These centres are described below:
Burwood Heights Shopping Centre located on the corner of Burwood Highway and
Middleborough road, within 250 metres of the subject site. The supermarket based centre has a
mid-sized full-line Woolworths supermarket of 3,129 sq.m, and adjacent strata titled specialty
retail along Burwood Highway.
Burwood One is located 1.7 km from the proposed Burwood East Retail Centre, on the corner of
Burwood Highway and Blackburn Road. While the centre is anchored by a Kmart (8,100 sq.m),
Coles (5,500 sq.m) and Aldi (1,500 sq.m) provide a strong convenience based retail offer that
restricts the trade area from the east. Residents living to the east of Burwood One are unlikely to
drive past that centre in order to use the Burwood Heights Activity Centre on a frequent basis.
The mostly grid-like road network in the region will facilitate access to a shopping centre on the
subject site. Of note:
Middleborough Road carries good volumes of vehicle traffic past the subject site, supported by its
role as a key north-south thoroughfare in the region and proximity of major retailers (i.e. Masters
and Bunnings hardware stores) and the Clarice Road business hub to the north.
Eley Road is a key local collector road, which is located just north of the site and connects with
Blackburn Road in the east and Station Street in the west.
4 TRADE AREA MARKET
URBIS
BURWOOD EAST RETAIL EIA JULY 2016The trade area covers the suburbs of Blackburn South, Box Hill South, Burwood and Burwood East, while
the southern part of the trade area also extends down into parts of Mount Waverley.
The primary trade area extends to the south to Highbury Road, west to Gardiners Creek and north
to the industrial precinct on Middleborough Road with the north and south sectors split by Burwood
Highway. The north and the east of the primary trade area will be limited by the access to
Middleborough Road from this region. However, access to Middleborough Road along Eley Road
allows the primary north sector to extend further north east.
The secondary trade area generally reflects the 2 km radius around the subject site, not extending
past Canterbury Road to the north or Blackburn Road to the east. The southern area of the trade
area is limited by the contours of the land; with the large hill provide a significant barrier for
convenience based trade. The trade area also extends further west, a benefit of the higher order
nature of Burwood Highway.
Overall the centre is expected to serve a trade area typical in geographic extent to most supermarket
based centres. With good levels of population density in the area including future residents on the
Frasers Property Australia site itself, the centre will serve a sizeable catchment and with exposure to
passing traffic on Middleborough Road it will also have the potential to capture good levels of trade from
beyond the trade area.
URBIS
BURWOOD EAST RETAIL EIA JULY 2016 TRADE AREA MARKET 5BURWOOD EAST RETAIL CENTRE TRADE AREA MAP 2.1
6 TRADE AREA MARKET
URBIS
BURWOOD EAST RETAIL EIA JULY 20162.2 POPULATION FORECASTS
The Burwood East area was first developed along with many other middle ring suburbs of Melbourne in
the post-war housing boom. The region has nearly reached the end of its first lifecycle. New residents
are moving in and regenerating existing housing stock. New medium density developments are
increasing the pace of change.
In order to review the market demand and supply gaps for uses at Burwood East, it is first necessary to
understand the growth in population at a regional and local level, and the corresponding change in socio-
economic characteristics.
2.2.1 MUNICIPALITY POPULATION FORECASTS
Our regional population forecast covers the municipalities of Whitehorse and Monash (Table 2.1). They
are based on:
Victoria in Future 2014 (VIF), released by the Victorian Government in April 2014;
This update changed the forecast growth in municipalities in Victoria, and importantly increased
the population forecast for both the Whitehorse and Monash, in which the proposed Burwood
East trade area in contained.
Number and trends of new dwelling approvals (NDAs);
.id population forecasts for the cities of Monash and Whitehorse, updated in early 2014;
.id forecast small area population growth considering drivers of population change (i.e. births,
deaths, migration and residential development).
A review of residential developments in the local area.
However, looking at these sources, there is a disparity between the population growth provided by the
Government and forecast.id. Acknowledging that forecast.id forecasts population at the small area level,
we have updated some of the key assumptions made in population drivers, primarily in the residential
property development, including an update to include the planned 950 new dwellings on developable land
surrounding the proposed shopping centre on the former brickworks site.
Overall, after taking the midpoint of these two sources, the municipalities are forecast to add around
2,900 people per annum, on average, to 2026.
LGA Population Forecasts
MONASH AND WHITEHORSE MUNICIPALITIES TABLE 2.1
Population (no.) Annual Pop'n Growth (no.) Annual Pop'n Growth (%)
LGA 2011 2016 2021 2026 2011-16 2016-21 2021-26 2011-16 2016-21 2021-26
Forecast.id
1
City of Monash 178,000 185,000 192,000 197,500 1,400 1,400 1,100 0.8% 0.7% 0.6%
2
City of Whitehorse 157,700 167,600 173,400 177,800 1,980 1,160 880 1.2% 0.7% 0.5%
VIF 2014
City of Monash 177,300 187,900 193,800 201,000 2,120 1,180 1,440 1.2% 0.6% 0.7%
City of Whitehorse 157,500 167,500 175,500 182,500 2,000 1,600 1,400 1.2% 0.9% 0.8%
Midpoint Estimates
City of Monash 177,300 186,100 192,550 198,900 1,760 1,290 1,270 1.0% 0.7% 0.7%
City of Whitehorse 157,500 167,450 174,350 180,050 1,990 1,380 1,140 1.2% 0.8% 0.6%
Total 334,800 353,550 366,900 378,950 3,750 2,670 2,410 1.1% 0.7% 0.6%
1. Updated April 2014 by forecast.id
2. Updated January 2014 by forecast.id
Source : forecast.ID ; Victoria In Future 2014, Department of Transport, Planning and Local Infrastructure; Urbis
URBIS
BURWOOD EAST RETAIL EIA JULY 2016 TRADE AREA MARKET 72.2.2 TRADE AREA POPULATION
Table 2.2 shows that as of June 2013, the Burwood East Retail Centre trade area had a resident
population of 37,350, including 13,250 in the primary trade area and 24,100 in the secondary sectors.
Key points to note include:
Over the previous five years, the resident population of the trade area has grown at 1.4% per annum
or 500 new residents annually. This growth compares with the 2.0% per annum across Greater
Melbourne. The availability of developable land along major arterials in the trade area (especially
Burwood Highway and Middleborough Road) and the increase in higher density dwellings are the
primary drivers of growth since 2008. The progressive regeneration of suburbs would also be
contributing to the overall growth pattern in the area.
The primary north sector currently contains nearly double the population of the primary south sector
and is expected to account for the largest share of growth of any sector in the trade area over the
foreseeable future. The Burwood East development therefore will be well positioned and accessible
to where the market will be growing.
Population growth in the main trade area is forecast to increase to an average of 1.4% or 550 new
residents per year to 2016 and a significantly stronger 1.9% or 750 residents per year from 2016 to
2021 and 664 residents per year from 2021 to 2026. This forecast is based on municipal projections
outlined in Section 2.2.1 and subsequent distribution of growth based on future infill dwellings and
larger developments in the local catchment.
The primary trade area is forecast to grow to an average of 1.8% or 250 new residents per year to
2016 and increase to 3.1% or 450 residents per year from 2016 to 2021.
The majority of trade area growth is accounted for by the Frasers Property Australia Burwood East
development, which is expected to introduce some 950 dwellings into the primary north sector after
2016. This results in a 2021 trade area population of almost 43,000, with the future growth of the
region heavily influenced by the Burwood East development.
Deakin University Students
There are 23,000 students currently enrolled at the Deakin University Burwood Campus and an additional
2,000 staff. Whilst this total includes part time students this represents a sizeable daily population
entering the Burwood East area.
The Deakin University Travel Survey 2012 notes that some 20% of students and 60% of staff arrive at
campus as sole occupants of a car, with a further 10% of students and 6% of staff arriving by tram. The
third most popular mode of transport is walking, with 9% of students and 4% of staff using this option
(suggesting they live in the catchment).
8 TRADE AREA MARKET
URBIS
BURWOOD EAST RETAIL EIA JULY 2016Resident Population
BURWOOD EAST RETAIL CENTRE TRADE AREA TABLE 2.2
Population Annual Population Growth (no.) Annual Population Growth (%)
2013 2016 2021 2026 2013-16 2016-21 2021-26 2013-16 2016-21 2021-26
Primary:
North 8,650 9,100 11,020 12,910 150 384 378 1.7% 3.9% 3.2%
South 4,600 4,900 5,240 5,520 100 68 56 2.1% 1.4% 1.0%
Total Primary 13,250 13,990 16,260 18,440 247 454 436 1.8% 3.1% 2.5%
Secondary:
North 3,320 3,440 3,920 4,320 40 96 80 1.2% 2.6% 2.0%
East 7,210 7,380 7,580 7,760 57 40 36 0.8% 0.5% 0.5%
South West 5,450 5,610 5,800 5,930 53 38 26 1.0% 0.7% 0.4%
West 3,380 3,530 3,800 3,940 50 54 28 1.5% 1.5% 0.7%
North West 4,750 5,050 5,390 5,680 100 68 58 2.1% 1.3% 1.1%
Total Secondary 24,100 25,000 26,490 27,630 300 298 228 1.2% 1.2% 0.8%
Main Trade Area 37,350 38,990 42,750 46,070 547 752 664 1.4% 1.9% 1.5%
1. As at June
Source : ABS; ; Urbis
The forecast increasing population growth in the region is supported by the numerous residential projects
in the trade area. Assumed key residential developments include:
TRADE AREA SECTOR DEVELOPMENT (> 50 DWELLINGS) SIZE ( EST. ESTIMATED TIMING
DWELLINGS)
Primary North Frasers Property Australia – Burwood 950 2017-2024
East
The Easton – 393 Burwood Highway 80 2017-2019
Aries Apartments – 112-124 50 2015-2017
Middleborough Road
Secondary North Hay Street – Former St Leo’s Site 300 2017-2020
988 Canterbury Road 60 2015-2017
Secondary West 47-49 McIntyre Street 50 2016-2018
Source: Urbis
URBIS
BURWOOD EAST RETAIL EIA JULY 2016 TRADE AREA MARKET 92.3 SOCIO-ECONOMIC CHARACTERISTICS
2.3.1 TRADE AREA TRENDS
Currently socio-economic characteristics of trade area residents reflect an established area with mainly
low to medium density housing.
At a high level, the trade area is regenerating into a more diverse region with the age and ethnicity of
residents changing significantly between 2006 and 2011, as shown in Table 2.3 and Appendix A
(detailed). Maps 2.2 to 2.7 also show some of the key demographic features of trade area residents in
2011, but also the change in demographics over the previous five years (2006). Across the trade area:
The area is becoming younger and the regeneration trend is on its way. A high proportion of
residents are aged over 65 (18%) relative to the Melbourne average (13%). Offsetting this high level
of seniors is a notable representation of university students (13.8% of the population which compares
with an average of 6.5% across Melbourne), influenced by Deakin University. Since 2006 the
proportion of those aged over 60 years old has decreased across the main trade area (25% to 23%),
reducing the average age of residents. Over the same period, the proportion of those of university
age/young adults (approximately 20-29 years), has increased in the primary sectors (15.3% to 21.9%)
and the main trade area as a whole (13.8% to 17.4%).
The next phase of change is expected to be the introduction of younger families which will be
replacing the long standing families and empty nesters in the area and moving into new housing
developments, including Frasers Property Australia’s Burwood East development.
Map 2.5 shows an increase in the proportion of young families in the south and west of the trade
area, and a decrease in the northern sectors. This is likely influenced by schooling decisions.
Homes in the Mount Waverley Secondary College school zone to the south are particularly in
demand by families with school aged children or younger. We expect this trend to continue as
other schools serving the catchment (e.g. Ashwood College, Forest Hill Secondary College)
improve in perception along with the regeneration trend.
The older and university student populations contribute to slightly lower incomes. Incomes
per capita in the main trade area ($32,900) are slightly below the Melbourne average ($34,300),
partially driven by the lower than average labour force participation, reflecting the general age of
residents. This is despite a larger than average proportion of workers in white collar occupations.
Income growth across the trade area is also well below that seen across Melbourne from 2006 to
2011.
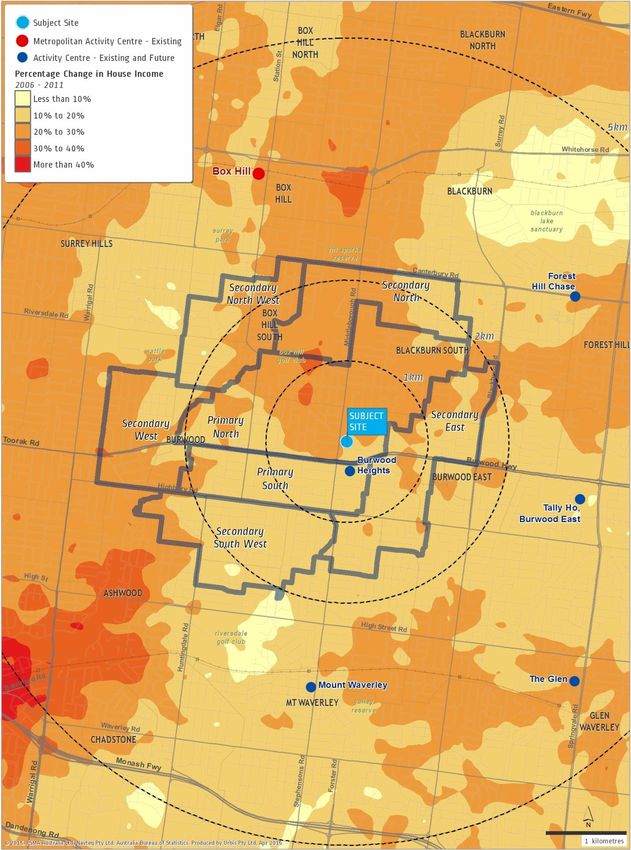
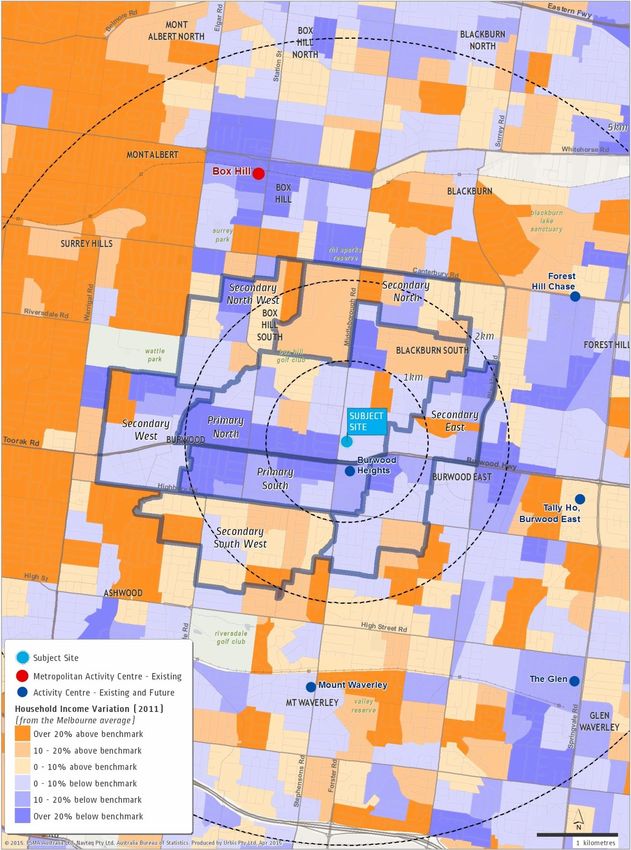
Household incomes are well below the Melbourne average, as can be seen in Map 2.6. Along
Burwood Highway, to the west of the subject site, there is a large region of lower than average
income earners, generally being students with little to no income.
However incomes are improving in the area, notably in the suburbs in close proximity to the
Burwood East Retail Centre site, as shown in Map 2.7. This trend is expected to continue and be
more broad reaching in terms of geographic coverage as the area progresses through a process
of regeneration and gentrification. Recognising the change occurring in areas from, for example,
Glen Iris to Ashburton, this process is expected to progressively pick up pace in suburbs further
east (including Burwood East) in the coming years. The growth in house prices discussed later in
this section highlights this change is gaining momentum.
Owner occupiers still prevalent but renters are moving in. The majority of households in the
trade area are owner occupied and remain well above the Melbourne average (42% vs. 34% for
Melbourne overall). However, this has decreased from 2006 across the main trade area (-3.4%), a
bigger change than seen across Melbourne (-2.2%). A similar shift has been seen in occupiers who
hold a mortgage, where this metric for the main trade area has decreased while Melbourne has
remained relatively flat on average. The balance shows a large increase in rented properties (21% to
27% from 2006 to 2011), which can be partially explained by a growing university student population
and reflected in the increase in the migration patterns of trade area residents.
10 TRADE AREA MARKET
URBIS
BURWOOD EAST RETAIL EIA JULY 2016 University students are moving in. The proportion of family households in 2006 in the primary
trade area (67%) was well below the Melbourne average of 72% and has further decreased to 64% in
2011, with more group and lone person households, which again reflects in part, the take up of
university accommodation in the area.
More ethnically diverse. The trade area has become increasingly more ethnic, with a large shift in
the proportion of residents born overseas especially from Asia, and in particular, China. Some 24%
of main trade area residents were born in Asia, of which 10% were born in China. This proportion is
highest in the primary south sector, with 38% born in Asia, of which 19% were born in China.
According to Deakin, the Burwood campus currently has over 6,000 international student
enrolments, of which over 40% originate from China. However, this number has declined since
2011, where the campus had 7,000 international students enrolled at the campus.
Map 2.2 shows the communities with Asian ancestry focussed around the Box Hill and Glen
Waverley activity centres, as well as along Burwood Highway around Deakin University.
In summary, the socio-economic profile of trade area residents indicates a generally established and
older aged market with lower incomes but likely good asset wealth. The trade area is in a process of
change with an increasing ethnic population (notably persons from Asia) and improving incomes in areas
in proximity to Burwood East. In the future, the expectation is for an increasing rate of regeneration of
older households, with new families and better income households moving into the region.
URBIS
BURWOOD EAST RETAIL EIA JULY 2016 TRADE AREA MARKET 11Trade Area Demographics
BURWOOD EAST RETAIL CENTRE TRADE AREA, 2006 & 2011 TABLE 2.3
Characteristics Primary Trade Area Main Trade Area Melbourne
Income 2006 2011 06-11 2006 2011 06-11 2006 2011 06-11
Average Per Capita Income ($) 24,963 29,882 +19.7% 27,252 32,868 +20.6% 27,079 34,303 +26.7%
Variation from Melbourne -7.8% -12.9% +0.6% -4.2%
Average Household Income ($) 60,602 73,505 +21.3% 67,525 83,462 +23.6% 66,669 86,412 +29.6%
Variation from Melbourne -9.1% -14.9% +1.3% -3.4%
Age
0-19 22% 20% -1.6% 23% 23% -0.1% 26% 25% -0.8%
20-29 15% 22% +6.6% 14% 17% +3.3% 15% 15% +0.9%
30-39 14% 11% -2.9% 14% 12% -2.6% 16% 15% -0.6%
40-49 12% 12% +0.7% 13% 14% +0.5% 15% 14% -0.2%
50-64 15% 13% -1.3% 16% 16% -0.0% 17% 17% +0.5%
65+ 22% 21% -1.5% 20% 18% -1.1% 13% 13% +0.4%
Average Age 41.2 40.2 -2.4% 40.4 39.6 -1.9% 37.0 37.3 +0.9%
Housing Tenure
Owner 44% 41% -2.9% 46% 42% -3.4% 36% 34% -2.2%
Purchaser 29% 27% -2.1% 32% 30% -1.9% 38% 38% +0.1%
Renter 26% 31% +5.0% 21% 26% +5.3% 26% 28% +2.0%
Household Structure
Family Households 67% 64% -3.7% 72% 70% -2.5% 72% 72% +0.1%
Non-Family Households 33% 36% +3.7% 28% 30% +2.5% 28% 28% -0.1%
Group 6% 8% +2.0% 5% 6% +1.6% 4% 5% +0.3%
Lone Person 26% 28% +1.7% 23% 24% +0.9% 24% 23% -0.4%
Migration
Different Address 1 year ago 15% 18% +2.5% 14% 15% +1.2% 15% 15% +0.1%
Different Address 5 year ago 35% 39% +4.1% 34% 37% +2.5% 39% 39% +0.4%
Occupation
White Collar (%) 76% 78% +1.8% 78% 80% +2.1% 71% 72% +1.5%
Labour Force Participation 56% 55% -0.7% 60% 59% -0.5% 65% 66% +0.6%
Birthplace
Australia 65% 57% -8.0% 66% 60% -6.3% 69% 67% -2.4%
Asia 18% 27% +9.7% 16% 24% +7.8% 9% 12% +3.2%
Europe 11% 9% -1.8% 10% 9% -1.4% 12% 11% -1.4%
Other 7% 7% +0.2% 7% 7% +0.0% 10% 10% +0.7%
Source : ABS Census of Population and Housing 2006 & 2011; Urbis
12 TRADE AREA MARKET
URBIS
BURWOOD EAST RETAIL EIA JULY 20162.3.2 HOUSE PRICES
Another indicator of socio-economic change is to review house price growth. This is particularly important
in terms of the retail spending potential of households as the change in house prices has one of greatest
impacts on their shopping habits. Good house price growth (and increasing wealth) generally results in
positive growth in retail expenditure.
Table 2.4 presents the average median price points for apartments and houses from RP Data, for
suburbs that are within the boundaries of the Burwood East Retail Centre trade area. The key points to
note from this analysis are as follows:
As at April 2014 the median house price in the region was between $700,000 and $850,000, well
above the Greater Melbourne median house price.
Over the last 12 months house price growth remained positive across the trade area, just shy of
double the change across Melbourne overall. Annual median house price growth over the last
decade in the trade area at 7.2% per annum exceeds the average growth rate observed in
Melbourne.
The median unit price in the trade area suburbs currently stands at around $550,000-$600,000,
higher than the Whitehorse and Monash municipalities and the Melbourne median ($445,000).
Median annual unit price growth has not been as strong as houses, but remained well above the
Melbourne change in median price over the last 12 and 36 months.
Housing Prices by Suburb
BURWOOD EAST RETAIL CENTRE TRADE AREA AS AT APRIL 2014 TABLE 2.4
Median Change in Median Price (%) Median
Number Sale Price (Annual) Asking Total
1 year 5 years
Sold (1 yr) (1 yr) 10 years Rent (1 yr) Dwellings
Houses
Mount Waverley 407 845,500 +14.3% +34.6% +7.5% 430 10,686
Box Hill South 113 800,000 +11.2% +41.6% +7.4% 430 2,385
Burwood 189 780,000 +4.0% +28.3% +6.4% 420 4,061
Blackburn South 127 719,000 +14.0% +43.8% +7.5% 400 3,379
Burwood East 109 715,000 +14.4% +42.3% +6.9% 400 3,378
Monash LGA 1,962 775,000 +15.8% +37.2% +7.2% 415 52,200
Whitehorse LGA 2,211 750,000 +13.8% +41.5% +7.2% 400 52,170
Gr. Melbourne 55,138 525,000 +8.2% +36.4% +5.6% 375 1,207,047
Units
Mount Waverley 176 620,000 +12.7% +31.9% +6.3% 400 3,327
Blackburn South 25 600,000 +16.4% +43.7% +7.4% 390 640
Box Hill South 65 585,000 +17.0% +50.1% +6.1% 360 955
Burwood 87 575,000 +8.6% +23.9% +4.2% 350 2,146
Burwood East 33 530,000 +9.1% +37.7% +5.2% 365 508
Monash LGA 855 549,000 +13.1% +33.1% +6.2% 380 18,534
Whitehorse LGA 1,018 536,500 +9.5% +33.5% +5.9% 355 21,500
Gr. Melbourne 24,079 445,000 +4.7% +26.4% +4.9% 360 530,692
Note: As at April 2014
Source : RP Data ; Urbis
URBIS
BURWOOD EAST RETAIL EIA JULY 2016 TRADE AREA MARKET 13MAJOR ANCESTRY BY STATISTICAL AREA 1 (SA1), 2011 MAP 2.2
Source: ABS Census 2011
14 TRADE AREA MARKET
URBIS
BURWOOD EAST RETAIL EIA JULY 2016NUMBER OF YOUNG FAMILIES, 2011 MAP 2.3 Source: ABS Census 2011 URBIS BURWOOD EAST RETAIL EIA JULY 2016 TRADE AREA MARKET 15
PROPORTION OF YOUNG FAMILIES (WITH CHILDREN AGED UNDER 15), 2011                   MAP 2.4

Source: ABS Census 2011

16   TRADE AREA MARKET
                                                                                              URBIS
                                                                   BURWOOD EAST RETAIL EIA JULY 2016
CHANGE IN THE PROPORTION OF YOUNG FAMILIES, 2006 - 2011 MAP 2.5 Source: ABS Census 2011 URBIS BURWOOD EAST RETAIL EIA JULY 2016 TRADE AREA MARKET 17
HOUSEHOLD INCOME VARIATION BY STATISTICAL AREA LEVEL 1, 2011 CENSUS             MAP 2.6

Source: ABS Census 2011

18   TRADE AREA MARKET
                                                                                           URBIS
                                                                BURWOOD EAST RETAIL EIA JULY 2016
CHANGE IN HOUSEHOLD INCOME, 2006-2011 MAP 2.7 Source: ABS Census 2011 URBIS BURWOOD EAST RETAIL EIA JULY 2016 TRADE AREA MARKET 19
2.4         TRADE AREA RETAIL SPENDING
The demographic characteristics that are particular to the trade area have a marked effect on the level of
retail spending generated by residents. High disposable incomes generated by a large and mobile
workforce not only are reflected in above average retail spending on a per capita basis, but also in the
types of goods and services residents direct their household budgets to.

2.4.1       PER CAPITA RETAIL SPENDING
Our per capita retail spending estimates are derived through reference to a range of information sources
including the Australian National Accounts (ANA), the ABS’ Retail Trade series, and MarketInfo 2012, a
widely used micro-simulation model by MDS Market Data Systems Pty Ltd. The model is based on
information from the national ABS Household Expenditure Survey (HES), the Census of Population and
Housing, as well as other information sources such as the ABS National Accounts. The model combines
propensity to spend on particular commodities with the demographics of a region to derive spending
estimates per capita on a small area basis.

The spending estimates outlined in this report include GST and are expressed in constant 2014 dollars
(i.e. inflation is not included).

2.4.2       TOTAL RETAIL SPENDING
As shown in Table 2.5, the total retail spending market in the Burwood East Retail Centre trade area is
estimated at $500 million in 2014. Given population growth and growth in real spending per capita the
available spending market is forecast to grow to some $565 million by 2018, and $615 million by 2021.

Retail Spending Market, 2014-2021
BURWOOD EAST RETAIL CENTRE TRADE AREA, $2014 INCL. GST                                                    TABLE 2.5

                           Food         Food              Home-   Bulky   Leisure/ Retail    Total         Annual
                                                Apparel
                           Retail      Catering           wares   Goods   General Services   Retail        Growth

2014                        208          68       57       38      51       58       20       499

2016                        219          72       61       42      55       63       21       532           2.6%

2018                        230          75       65       45      59       67       23       565           3.0%

2021                        248          82       72       50      65       74       25       615           2.9%

Source : ABS; MarketInfo 2012; Urbis

20     TRADE AREA MARKET
                                                                                                                        URBIS
                                                                                             BURWOOD EAST RETAIL EIA JULY 2016
3 Retail Supply
This section reviews the current retail offer within the region of relevance to Burwood East, including a
floorspace survey of key competitive centres and current provision of retail and non-retail uses.
This analysis draws upon the following:
Field work undertaken by Urbis in July 2014.
Shopping Centre News Publications (Big Guns 2014, Mini-Guns 2014, Little Guns 2014).
An understanding of proposed retail developments, as of August 2014.
3.1 CURRENT OFFER IN CENTRES
The main centres of competitive relevance to Burwood East are shown in Map 3.1.
We have reviewed the scale, mix, tenants and type of use (including retail and non-retail uses) in each
centre.
For those local and sub-regional centres of greatest competitive relevance, including Burwood Heights
shopping centre and Burwood One, Section 3.1.1 and Section 3.1.2 explore the composition and likely
performance of these centres and shopping strips in detail.
3.1.1 CENTRES IN THE BROADER REGION
We start with a review of centres located further distant to the trade area but that are likely used to a
reasonable degree by trade area residents. For these centres a higher level overview is provided,
focussing on their key strengths and market positioning. These centres include:
Forest Hill Chase – A large sub-regional centre with a good line up of anchor tenants including Big
W Target DDSs, Harris Scarfe, three supermarkets (Coles, Woolworths and Aldi) and a six screen
cinema complex operated by Hoyts. The Woolworths supermarket has recently been expanded and
the addition of Aldi and some strong fresh food retailers (Yang Yang Asian Grocery, Colonial Fruit
Company) has built the food and convenience shopping appeal of this centre.
Regional centres in the area, including Doncaster, The Glen, Knox, Chadstone and Eastland limit the
role the centre can play in the discretionary category of the retail market. The fashion offer is pitched
at the mid to budget end of the market.
Forest Hill Chase likely draws a reasonable amount of trade from Burwood East trade area. Its
influence on food and grocery shopping is probably limited to the north-eastern areas of the trade
area.
The Glen Shopping Centre – A relatively small regional centre which benefits from one of the only
David Jones stores in the eastern suburbs. The centre is also anchored by the two major
supermarkets (Coles, Woolworths) and Target & Harris Scarfe (homewares only). The fashion and
homewares mix is stronger at The Glen than Forest Hill Chase. It is part of a broader town centre
around the Glen Waverley train terminus which also features a sizeable shopping strip (focussed on
services, cafes and restaurants), cinemas (with an adjoining restaurant precinct) and Novotel hotel
which is understood to achieve high levels of occupancy. The IKON apartments project has been
successful and new high density residential projects are planned for the town centre.
Given the role of The Glen and position within the Glen Waverley Town Centre it would have limited
direct competitive relevance with a neighbourhood based centre at Burwood East.
URBIS
BURWOOD EAST RETAIL EIA JULY 2016 RETAIL SUPPLY 21 Box Hill Metropolitan Activity Centre – Box Hill is the major activity centre in the City of Whitehorse
and is host to a diverse range of land uses, including retail, office, education, community, medical,
entertainment and recreational facilities. Key activity generators within Box Hill include:
Box Hill Shopping Centre with more than 37,000 sq.m of retail floorspace. A report by MacroPlan
in 2010 estimated that the Box Hill CAA contains around 59,000 sq.m of retail floorspace in total.
Box Hill is a bustling food and convenience oriented centre which includes a large fresh food
market. Box Hill is one of the few centres in the area charging for parking.
The broader Box Hill activity centre has a large cluster of Asian restaurants (predominantly
Cantonese, Vietnamese, Korean, Taiwanese, Malaysian) which trade well into the evening. The
retail both within the centre and in the surrounding streets includes some specialty Asian retailers.
Box Hill Hospital is Eastern Health’s largest acute hospital, admitting more than 48,000 patients
each year and providing a wide range of healthcare services, including emergency care, general
and specialist medicine, intensive care, mental health services, maternity services, teaching and
research (the hospital is affiliated with Monash, La Trobe and Deakin Universities as a teaching
hospital). There is also a broad offer of medical suites in the town centre and in close proximity to
the hospital. The hospital is currently undergoing a $450 million major redevelopment, with a
brand new 10 storey building recently opened and refurbishment of the existing hospital complex
underway.
Box Hill Institute (TAFE) – occupies multiple buildings within the Box Hill activity centre. The
TAFE employs an estimated 2,000 staff and has in the region of 40,000 students enrolled across
three campuses in the activity centre. .
Box Hill is a major established office market with an estimated total stock of 128,000 sq.m of
office floorspace, which will increase further upon completion of the ATO office building at 913
Whitehorse Road (adding approximately 20,000 sq.m of floorspace).
Box Hill is likely to have a moderate draw from the north west of the trade area, and is also likely to
draw more strongly from Asian residents due to the offer within the broader town centre.
Mount Waverley Activity Centre (Stephensons Road) – This is a large neighbourhood activity
centre located immediately south of the Mount Waverley station based around a good Ritchies IGA
supermarket (which includes several in-store concessions) and a small and old format Woolworths
supermarket.
In addition to the usual range of convenience and services based retailers and food and beverage,
the precinct includes some operators serving discretionary retail needs (e.g. Fella Hamilton). The
overall offer is well aligned to the slightly better incomes in the area. The precinct is served by a good
sized at-grade carpark conveniently/centrally positioned to the main retail area of the precinct.
Mt. Waverley is likely to draw some trade from the secondary south of the trade area.
22 RETAIL SUPPLY
URBIS
BURWOOD EAST RETAIL EIA JULY 20163.1.2 CENTRES IN THE LOCAL REGION We have undertaken a more detailed assessment of shopping centres and strips in the local region. This review includes the following main centres: Burwood Heights Shopping Centre Middleborough Road/Mirabella Crescent Shops (Houston Shops) Box Hill South (Corner of Station Street and Canterbury Road) Blackburn South (Canterbury Road) Burwood One Shopping Centre Bennettswood Shops (Corner Station Street and Burwood Highway) Burwood Village (Corner Toorak Road and Warrigal Road) Middleborough Road/Canterbury Road Shops Ashwood (High Street Road and Warrigal Road) Several small local shopping strips are also covered in the analysis: Benwerrin Drive, Burwood East Andrew Street/Highbury Road, Burwood East Yertchuk Avenue/Arthur Street, Ashwood Highbury Road/Huntingdale Road, Burwood Middleborough Road /Highbury Road, Burwood East Eley Road near Blackburn Road, Blackburn South URBIS BURWOOD EAST RETAIL EIA JULY 2016 RETAIL SUPPLY 23
You can also read