Analytical Brief on Energy Sufficiency in the National Context: Lithuania - Cactus
←
→
Page content transcription
If your browser does not render page correctly, please read the page content below

Analytical Brief on Energy Sufficiency in the National Context: Lithuania

Analytical Brief On Energy
           Sufficiency in the National
               Context: Lithuania
 Analytical brief prepared as part of the
            EUKI 2020 project
"Consolidating Ambitious Climate Targets
       with end-Use Sufficiency”
                (CACTUS)
                   Authors: Viktorija Bobinaite, Inga Konstantinaviciute, Ausra Pazeraite (LEI)

  CACTUS is a project on energy sufficiency and its integration into climate and energy strategies in the Central and
                        Eastern European context funded by the European Climate Initiative EUKI.
    It sensitises key scenario builders, policy makers and wider EU and climate and energy stakeholders on energy
                  sufficiency, and explores its integration in Hungarian and Lithuanian scenario models.
 Since the Summer 2020, the négaWatt association has been coordinating the implementation of the Cactus project
  with its partners REKK, LEI and the Fraunhofer ISI, and with the financial support of the EUKI fund of the German
                                            Ministry of the Environment BMU.

Analytical Brief on Sufficiency: Lithuania              2
© Cactus Project (2021 February)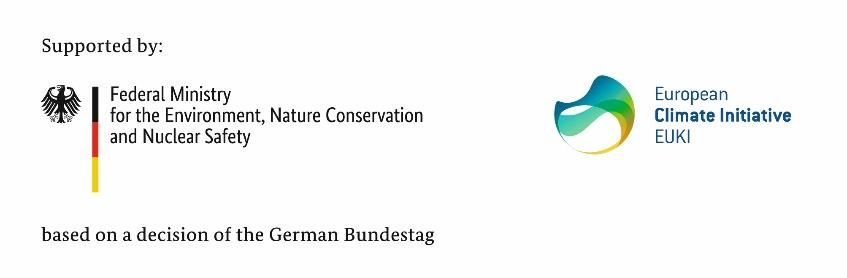
Table of contents

Introduction ................................................................................................................................................ 5
1. Overview of Energy Sector ...................................................................................................................... 6
1.1. General Information on Lithuania ......................................................................................................... 6
1.2. Overview of the Energy Sector in Lithuania ........................................................................................... 6
1.3. Legislation on Climate and Energy Policy with a Focus on Energy Demand ............................................ 7
1.4. Dashboard to Characterize Demand and Identify Sufficiency Gap and Potential ...................................10
2. Building Sector – Trends, Potentials and Strategies ...............................................................................13
2.1. Households ..........................................................................................................................................13
   2.1.1. Average floor area of dwellings .....................................................................................................13
   2.1.2. Average household size .................................................................................................................14
   2.1.3. Floor area per capita .....................................................................................................................15
   2.1.4. Energy consumption by fuel and by end use ..................................................................................15
   2.1.5. Energy consumption per capita .....................................................................................................17
   2.1.6. Share of energy expenditure in total household expenditure ..........................................................17
   2.1.7. Share of under-occupied and over-crowded dwellings ...................................................................18
   2.1.8. Decomposition of energy consumption changes in households ......................................................19
   2.1.9. Indicators of energy poverty ..........................................................................................................20
2.2. Tertiary Sector .....................................................................................................................................23
   2.2.1. Final energy consumption by fuel ..................................................................................................23
   2.2.2. Energy consumption per employee and per value added ...............................................................24
   2.2.3. Decomposition of energy consumption changes in tertiary sector ..................................................26
2.3. Energy and Climate Policy Goals Related to Building Sector ..................................................................27
   2.3.1. NECP 2030 ....................................................................................................................................27
   2.3.2. National Energy Independence Strategy till 2050...........................................................................28
2.4. Main Obstacles and Drivers to Energy Sufficiency.................................................................................28
   2.4.1. Regulatory aspects ........................................................................................................................28
   2.4.2. Behavioural, social and cultural obstacles and drivers ...................................................................29
2.5. Possible Improvements in Building Sector ............................................................................................29
3. Transport Sector – Trends, Potential and Strategies ..............................................................................31
3.1. Passenger Transport ............................................................................................................................31
   3.1.1. Final energy consumption .............................................................................................................31
   3.1.2. Passenger km per capita ...............................................................................................................32
   3.1.3. Number of passenger cars .............................................................................................................32
   3.1.4. Modal split in passenger transport ................................................................................................33
   3.1.5. Composition of vehicles by age......................................................................................................34
   3.1.6. Share of public and private transport ............................................................................................34
   3.1.7. Decomposition of energy consumption variation in passenger transport .......................................35
3.2. Freight transport ..................................................................................................................................35
   3.2.1. Final energy consumption .............................................................................................................36
   3.2.2. Energy consumption per tkm .........................................................................................................36
   3.2.3. Structure of freight transport ........................................................................................................37
   3.2.4. Composition of freight transport by age ........................................................................................37
   3.2.5. Decomposition of energy consumption variation in freight transport .............................................38

Analytical Brief on Sufficiency: Lithuania                                  3
© Cactus Project (2021 February)

3.3. Energy and Climate Policy Goals Related to Transport Sector ...............................................................38
   3.3.1. NECP 2030 ....................................................................................................................................38
   3.3.2. National Energy Independence Strategy till 2050...........................................................................39
3.4. Main Bottlenecks and Drivers to Energy Sufficiency .............................................................................39
   3.4.1. Regulatory aspects ........................................................................................................................39
   3.4.2. Behavioural, social and cultural drivers .........................................................................................40
3.5. Possible Improvements in Transport Sector .........................................................................................40
4. Conclusions ............................................................................................................................................42
5. Data table list .........................................................................................................................................44
6. Bibliography ...........................................................................................................................................45

Analytical Brief on Sufficiency: Lithuania                                 4
© Cactus Project (2021 February)
Introduction
The CACTUS project aims at strengthening climate mitigation actions in Central Eastern European countries
(Lithuania and Hungary) by supporting the integration of energy sufficiency in national scenarios and policies.
Within the CACTUS, the energy sufficiency is understood as “a situation in which everyone has affordable
access to the energy services they need, in which the energy services we want are equitably shared, and in
which the environmental limits of the planet are respected”1. Energy sufficiency is about a fairer consumption
and prioritizing energy uses which provide a genuine service, and dropping superfluous ones. Investigating
ways to further reduce energy demand beyond energy efficiency options is key, considering energy
consumption and greenhouse gas (GHG) emissions trends.
Responding the aim of the CACTUS project, this analytical brief on sufficiency in the national context of
Lithuania represents the outcomes of activities (A I.2) “Analysis of existing national scenarios overview of
demand related actions and identification of gaps in which sufficiency potentials are not yet tapped” and (A
I.3) “Analysis of the national context: identifying socio-cultural barriers and specificities that may alter the
way we apprehend sufficiency action”. More specifically, it provides an analysis of the obstacles towards
climate goals, a gap analysis on sufficiency related indicators not or partly covered in Lithuania, as well as a
research analysis aiming at identifying key variables that may affect the way sufficiency assumptions have to
be apprehended in target countries, e.g., social trends, policies, cultural habits, economic organisation,
structure of the energy system etc. and integration in the two analytical briefs from A I.2.
Until today, energy policies have been mostly focusing on the reduction of energy prices to increase
competitiveness and tackle energy poverty rather than structural changes towards more efficiency and the
apprehension of the need for behavioral change to avoid rebound effects. Efforts on energy efficiency were
not structural enough to counterbalance consumption trends which resulted in the rise of energy
consumption.
In 2019, the building sector accounted about 40% in the final energy consumption (FEC) in Lithuania. The
building sector as one of key emitting sectors has mitigation potential linked to actions on energy demand
reduction.
Currently, the transport sector is the largest energy consuming sector in Lithuania. In 2019, transport sector
accounted 40.9% in the total FEC. Due to a significant increase of fuel consumption the transport sector has
become one of the most important sources of GHG emissions. Seeking to implement GHG reduction targets,
transport will be the most challenging sector; therefore, it is necessary not only to increase the consumption
of renewable and alternative fuels but also to investigate how to promote sustainable mobility.
Sufficiency can play an important role in this respect; therefore, it is necessary to analyze how sufficiency can
go in hand with the alleviation of energy poverty and how behavioral changes can decrease energy
consumption in Lithuania.
Thus, the first chapter of this analytical brief provides general information about Lithuania and its energy
sector. The second chapter analyses the developments of energy use and its key drivers, the indicators
providing insights on energy sufficiency potentials, the national energy and climate policy goals related to
the building sector (household and tertiary) as well as regulatory aspects and behavioral, social and cultural
drivers to energy sufficiency. The third chapter analyses the developments of energy use and its key drivers,
the indicators providing insights on energy sufficiency potentials, the national energy and climate policy goals
related to the transport sector consisting of passenger and freight, as well as the regulatory aspects and the
behavioral, social and cultural drivers to energy sufficiency. Finally, conclusions are made.

1
    Progress within boundaries (energysufficiency.org)

Analytical Brief on Sufficiency: Lithuania               5
© Cactus Project (2021 February)
1. Overview of Energy Sector 1.1. General Information on Lithuania General information. The Republic of Lithuania is a central European country situated on the southeast cost of the Baltic Sea. Its area is 65,284 km2. Capital is Vilnius. Country has borders with Latvia, Belarus, Poland and Kaliningrad region (Russia). Climate. Climate is moderately warm as it is in mid-latitudes, transitioning from marine to continental. Continental climate is noticeable in the eastern part of the country. Lithuania is in a zone of mild temperature climate with moderately warm summers and moderately cold winters. The average temperature is about 17oC in July and about -5oC in winter. However, there are very hot summer days when weather warms up to 30oC, as well as very cold winter days when it cools down to -20oC and -30oC at night. Mostly precipitation falls in summer. The lowest rainfall is in spring, as anticyclones predominate. Economic situation. Lithuania is a country with already high and still improving living standards. Its gross domestic product (GDP) per capita grew by 5% a year during 2005-2019, except, in 2009 when due to the global economic crisis it dropped by 17%. In 2019, GDP per capita was 17.5 thousand EUR and accounted to 82% of EU average level [1]. However, there is a gap of GDP per capita within the counties. The largest GDP per capita is in Vilnius and is 144% of the national average, while the smallest GDP per capita is in Taurage where it is only 56% of the national average [2]. Real GDP grows by 3.5% [3]. Inflation is moderate (2.5%). Unemployment rate was high in 2010 (17.8% of labour force) but shrinked to normal rate at 6.3% in 2019. Demographic situation. The demographic situation deteriorates in Lithuania. In 2019, 2.8 million people lived in the country [4] compared to 3.4 million people in 2005. This is because of a negative net migration and a negative natural change of population. During 2005-2019, 0.64 million people emigrated from the country. In 2019, net migration got positive again for the first time since 1994 and accounted for 10.8 thousand people. Due to the natural change of population Lithuania lost 0.18 million people during 2005-2019 : the country suffers from an annual decrease of 3.4% in the number of births. Moreover, the population of the country gets older. 1.2. Overview of the Energy Sector in Lithuania Responding to the structural transformations of the economy after 1990 and the cyclical development of the national economy, the dynamics of primary energy consumption (PEC) show significant reductions of consumption of all forms of fuels and energy after 1990, in 2000 and 2010. During the last decade, the PEC grew about 1.2% a year. In 2019, the PEC was 7.8 Mtoe. Oil and oil products have been the most important fuels in Lithuania over the last decades. Their share was of 39% in 2019. They are followed by natural gas, with a share of 24% in 2019, while the use of natural gas is reducing. Contribution of renewable energy sources (RES) into the country’s primary energy balance increases and accounts today for about 20%. Since Ignalina nuclear power plant shutdown in 2009, Lithuania has been importing significant shares of its electricity (10.3% in 2019). Until 2008, the FEC has increased by 3.9% per annum. In 2009, the FEC was 9.5% less than in the previous year. The most observable impact of the economic recession was in the construction sector where the FEC decreased by 34.9% and in the transport sector - by 18.5%. Since 2010 the FEC has increased, mainly influenced by the increase in the energy demand in transport and industry sectors. In 2019, the FEC was 5.6 Mtoe. The transport sector is the largest energy consuming sector (40.9% of FEC) while the residential and tertiary sectors accounted 25.9% and 11.2%, respectively. Analytical Brief on Sufficiency: Lithuania 6 © Cactus Project (2021 February)
The overall FEC increases slowlier than the final electricity consumption (FElC). In 2019, FEC was 148% higher
than in 2000, and FElC was 170% higher (Fig. 1).

                                     220

                                     200

                                     180
                  Index (2000=100)

                                     160

                                     140

                                     120

                                     100

                                     80

                                     60

                                                                                                                                      2013
                                           2000
                                                  2001
                                                         2002
                                                                2003
                                                                       2004
                                                                              2005
                                                                                     2006
                                                                                            2007
                                                                                                   2008
                                                                                                          2009
                                                                                                                 2010
                                                                                                                        2011
                                                                                                                               2012

                                                                                                                                             2014
                                                                                                                                                    2015
                                                                                                                                                           2016
                                                                                                                                                                  2017
                                                                                                                                                                         2018
                                                                                                                                                                                2019
                                                                   GDP                  Final energy                       Final electricity

                   Figure 1. GDP, FEC and FElC indexes (Source: Lithuanian Statistics database)

During the period 2000-2019, FEC and FElC have been growing slowlier than GDP. Therefore, in 2019, GDP
was 212% of the level in 2000.

1.3. Legislation on Climate and Energy Policy with a
   Focus on Energy Demand
Lithuania follows the goals and targets set in EU Climate & Energy Package 2020 and Climate and Energy
Framework 2030 and responding them takes relevant obligations and supporting measures. Moreover, it
takes into account the national circumstances. Therefore, the national climate and energy policy considers
the country's dependence on fossil fuels imported from unreliable and volatile markets, poorly diversified
energy supply, high and variable energy prices, increasing energy demand, unsustainable energy
consumption, changing climate, rising emissions, untapped potential for competitiveness, growth and
employment opportunities. Responding to them, the National Energy Independence Strategy [5] sets some
short- to long-term goals that are summarized in Fig. 2.

Analytical Brief on Sufficiency: Lithuania                                                         7
© Cactus Project (2021 February)
Figure 2. National energy policy goals till 2050 [5]
In response to the overall goals of the National Strategy for the Development of Renewable Energy Sources
[6] to increase the share of RES in the total FEC to 23% and in the transport sector to 10% by 2020, the Law
on Renewable Energy Sources [7] sets the following sectoral targets for the development of RES in the
country:
▪ install 500 MW nominal capacity of new wind power plants (excluding those with a capacity not
exceeding 30 kW), 355 MW nominal capacity of biomass-fired power plants, 141 MW nominal
capacity of hydroelectric power plants and 10 MW nominal capacity solar power plants;
▪ increase the efficiency of heat production and transmission in order to achieve at least 70% of RES
(biomass) in the district heating (DH) sector, and increase the share of RES in heating in households
to at least 80% by 2020.
The updated Law on Renewable Energy Sources [8] aims at increasing the share of energy from RES in
relation to the country's total FEC to at least 38%, and the share of electricity from RES in total electricity
consumption to 38% by 2025. The law introduces sectoral measures to promote the production of energy
from RES. The sector-specific RES development measures contributing to the achievement of RES targets are
set out in the National Renewable Energy Action Plan [9].
The Law on Energy Efficiency [10] confirms the goal of improvement of energy efficiency (EE) by 2020, 2030
and 2050. It requires the economic sectors to consume 1.5% less energy (taking into account the average FEC
during 2010-2012) each year till 2020 and 0.8% less energy (taking into account the average FEC during 2016-
2018) each year till 2030 and 2050. A top-down approach is applied when implementing the EE targets in
practice. The Minister of Energy decides on the calculation and supervision of the mandatory energy savings,
and then imposes these to the other Ministries involved. Therefore, the Ministry of Economy and Innovation,
the Ministry of Environment, the Ministry of Transport and the Ministry of Agriculture are responsible for the
implementation of EE measures in industry, service and household, transport and agriculture sectors for the
purpose to achieve the mandatory energy savings of at least 5,456 GWh (469 ktoe), 10,366 GWh (891 ktoe),
10,912 GWh (938 ktoe) and 645 GWh (56 ktoe), respectively after 2020. Till 2018, Lithuania had made some
progress to achieve its EE targets. The cumulative savings in 2014-2018 have been of 511 ktoe while the
estimated annual savings required for 2014-2018 were 538 ktoe. This indicates a 95% rate of energy savings
Analytical Brief on Sufficiency: Lithuania 8
© Cactus Project (2021 February)achievement for 2014-2018. However, the total cumulative savings required by 2020 target is 1,004 ktoe;
therefore, the progress towards the cumulative savings required by 2020 was still 51% [11].
The Energy Efficiency Action Plan [12] is a document required by the EU to all Member States every three
years. It reports the national progress towards the EU overarching efficiency targets on an annual basis, and
introduces a set of sectoral measures facilitating the reduction of energy consumption.
The Long-term Strategy for the Renovation of the National Building Stock (draft) envisages to upgrade 2.5
million m2 of public and residential building until 2020, using EU structural funds and state budget funds. This
should enable to save at least 43 ktoe (500 GWh) of thermal energy. The overall goal of the FEC savings is
287 ktoe (3,336 TWh) during 2015-2020. In order to achieve this goal, EE measures are implemented. It is
plan to upgrade around 2,500-3,000 buildings during 2020-2030.
The Programme for Renovation (Modernization) of Multifamily Houses [13] (PoRM2H) and the Programme
for EE Improvements in Public Buildings [14] (PoEEPB) are relevant instruments used for the improvement
of EE in the building sector. The aim of PoRM2H is the renovation of multi-family houses built with reference
to technical construction standards valid before 1993 and the reduction of thermal energy consumption by
86 ktoe (1,000 GWh) per year and GHG emissions by 230 kt CO2eq per year by 2020. During the period 2013-
2020 2,627 multifamily houses have been renovated. The PoEEPB aims at renovating at least 700,000 m2 of
public buildings, consisting of 470,000 m2 of central government and 230,000 m2 of municipal buildings, and
thus saving 5 ktoe (60 GWh) of primary energy per year and reducing GHG emissions by 14 kt CO2eq per year
by 2020.
In response to the requirements of the EU and international agreements, Lithuania in the framework of the
Law on Financial Instruments for Climate Change Management [15] approved the National Climate Change
Management Policy Strategy for the Period until 2020 [16]. There it sets quantified annual GHG reduction
targets for the economic sectors. The specific short-term climate change mitigation objective for the plants
covered by the EU emission trading system (EU-ETS) is to achieve that GHG emissions would not exceed 8.53
Mt CO2eq. by 2020. The GHG target should be achieved through the implementation of RES technologies and
EE improving solutions. Therefore, economical and cost-effective emission reduction solutions are
implemented in industrial enterprises, efforts are made to increase the share RES in DH sector by 60% and
the share of RES-E to 21% of the country's total electricity consumption. Efforts are also made to to
modernize the electricity generation, transmission and distribution infrastructures and to increase the
possibilities to respond efficiently to demand changes. The specific short-term objectives for climate change
mitigation in the non-ETS sectors are to ensure that GHG emissions do not exceed annual GHG targets and
that total emissions would not increase by more than 15% in 2020 compared to 2005, and would not exceed
18.34 Mt CO2eq.
In 2018, Lithuania has submitted to the European Commission the National Energy and Climate Action Plan
[17] (NECP). The NECP sets out Lithuania's national goals for which the country will contribute to the
implementation of the EU's energy and climate policy goals in 2030, as well as related policies and measures.
Table 1 summarizes the national targets.
The National Energy Independence Strategy [18] (NEIS) formulated clearly descriptive goals and directions
for the development of RES and EE improvement until 2050. Primary and final energy intensity should be 1.5
times lower in 2030 than in 2017 and by 2050 to about 2.4 times lower than in 2017. EE shall be further
fostered in three directions:
▪ the renovation of multi-family houses and public buildings to save about 224-258 ktoe (2.6-3 TWh)
of energy in renovated buildings by 2020 and about 430-516 ktoe (5-6 TWh) by 2030;
▪ the development of low-energy and energy efficient industries, with the latest and environmentally
friendly technologies and equipment;
Analytical Brief on Sufficiency: Lithuania 9
© Cactus Project (2021 February)the improvement of EE in the transport sector by renewing the vehicle stock, to move to modern and
efficient public transport, the optimization of transport and alternative fuel infrastructures and the
electrification and use of alternative fuels.
Table 1. EU and National Energy and Climate Policy Targets [17]
EU Lithuania
Targets
2020 2030 2020 2030
GHG emission target, % 20 40 EU level
GHG emission target for EU-ETS, % 21 43 EU level
GHG emission target for non EU-ETS, % 10 30 15 9
RES target, % 20 32 23 45
RES target for transport, % 10 14 10 15
EE target, % 20 32.5 EU level
PEC, Mtoe 1474 1273 6.5 5.4
FEC, Mtoe N/A 956 4.3 4.5
Final energy savings, TWh (EED, Article 7) 11.67 27
1.4. Dashboard to Characterize Demand and Identify
Sufficiency Gap and Potential
The up-to-date climate and energy strategies (including the NECP and the NEIS) requesting for the economic
sector specific achievement of targets, disclose a path towards them up to 2030 and 2050; but show a poor
energy demand characterisation, as is highlighted in Table 2. Table 2 is the result of activity I.2 of the CACTUS
project, through which the sufficiency gap is described in a table.
The information and data collected from the NECP and the NEIS show that little is known in the public
strategies about key indicators of energy consumption and their expected developments till 2030 and 2050,
especially when analysing the sector specific energy demand (i.e., in buildings and transport). Nonetheless,
the assumptions on the developments of high-level indicators of energy consumption (including GDP and
population) are clearer for medium-term (2030) but they are almost missed for long-term (2050). When
describing the energy consumption, the NECP and the NEIS take into account that the number of population
will reduce and the economy will grow up to 2050.
The table highlights that the concept of energy sufficiency is not included in the NECP and the NEIS; therefore,
there is no data nor assumptions for energy sufficiency related indicators. A set of sector-specific energy
consumption and sufficiency related indicators had been identified during CACTUS I.2 activity. It includes 10
energy sufficiency related input indicators for residential buildings, 3 – for tertiary buildings, 6 – for
passenger transport, 3 – for freight transport and 11 energy consumption output indicators. Moreover 10
country level energy consumption, production and GHG emissions output indicators have been identified.
The assumptions of energy sufficiency, its potential and gap are investigated in further sections of the
analytical brief by analysing historical trends of indicators based on other sources of information.
Analytical Brief on Sufficiency: Lithuania 10
© Cactus Project (2021 February)Table 2. Dashboard to Characterise Demand and Identify Sufficiency Gap and Potential (results of CACTUS activity I.2)
Indicator Unit Comments Base year 2017 NECP 2030 NEIS 2050
Population persons 2828403 [1] 2727000 [1] -
GDP, constant prices (2005) million EUR 28568.7 [1] 37996.4 [1] 58565.8 [1]
Energy PEC Mtoe 6.5 [1] 5.5 [1] -
consumption PE intensity kgoe/EUR 0.27 [2] 0.14 [2] -
FEC Mtoe 5.3 [1] 4.5 [2] 5.83 [1]
FE intensity kgoe/EUR 0.19 [1] 0.12 [1] 0.08 [1]
Buildings Share of buildings in FEC % 39.4 [2] 40.77 [2] -
only space
Heat ktoe 1322.2 [1] 1082.2 [3] -
Consumption heating
in buildings household and
Electricity ktoe 528.4 [5] - -
tertiary sector
Residential FEC Mtoe 1.5 [1] 1.3 [1] -
FEC per capita toe/person 0.5 [1] 0.5 [1] -
heat price
Heat EUR/MWh 47.5 [2] - -
without VAT
Average
average
prices
Electricity EURct/kWh electricity price 9.088 [2] - -
without VAT
on electricity,
Monthly energy gas and other
% 4.4 [2] - -
expenditure fuels as % of
total
Number of dwellings 1459405 [1] - -
with climatic
Heat MWh/dw 8.72 [2] - -
corrections
Consumption
electrical
per dwelling
Electricity kWh/dw appliances, 1623.54 [2] - -
lighting
Average household size person/household 2.2 [1] - -
Floor area per person m2 35.42 [2] - -
Population living in 2018 data due
overcrowded % to change in 23.7 [1] - -
/undercrowded buildings methodologyIndicator Unit Comments Base year 2017 NECP 2030 NEIS 2050
Tertiary FEC Mtoe 0.6 [1] 0.5 [1] -
Employees in tertiary Mpersons 0.910187 [1] - -
FEC per employee toe/person 0.7 [1] - -
total electricity
Electricity per employee kWh/person 3633.65 [2] - -
per employee
excluding air
Transport Share of transport in FEC % 38 [1] 32.6 [1] -
transport
Electric share of energy
% 0 [2] 3.54 [2] -
transports consumption
Energy Road ktoe 1856 [1] - -
consumption Air ktoe 0.4 [1] - -
Share in road Passenger % 61 [4] - -
FEC Freight % 39 [4] - -
Passenger No. of cars per person No/1000 persons 483 [1] - -
Mobility State of the car stock % - - -
Cars Mp.km 31361 [1] - -
Passengers’ Buses Mp.km 2740 [1] - -
traffic Rail Mp.km 424 [1] - -
Rivers Mp.km 3 [1] - -
Freight Road Mt.km 39099 [1] - -
Freight
Mobility Trains Mt.km 15414 [1] - -
traffic
Rivers Mt.km 1 [1] - -
Energy Domestic PE production Mtoe 1.9 [1] 2.4 [1] -
production Share of RES in FEC % 26 [1] 45 [1] 80 [1]
RES-E in FEC % 18.3 [1] 59.2 [1] 100 [1]
GHG emissions GHG emissions % % to 1990 57 [1] 67 [1] 69.8 [1]
Share in GHG Buildings % 7.2 [1] 6.1 [1] 6.5 [1]
emissions Transports % 28 [1] 23 [1] 19 [1]
References: [1] Official data contained in the NECP / NEIS; [2] Data retrieved from the NECP; [3] Data calculated from the NECP; [4] Based on background
calculation; [5] Data from Lithuanian Statistics database
Analytical Brief on Sufficiency: Lithuania 12
© Cactus Project (2021 February)2. Building Sector – Trends, Potentials
and Strategies
2.1. Households
There were 1,357 thousand households in the country in 2017 and they consumed 1.46 Mtoe of energy. This
is 0.6% less energy than in 2019. In 2019, the households accounted for 25.9% of FEC and emitted 4.4% of
total GHG emissions (excluding LULUCF). There were 1,483,041 dwellings in 2019 and this is 14% more than
in 2005. In 2019, dwellings of public ownership accounted to 2% and dwellings of private ownership – to 98%
of total dwellings. The share of dwellings of municipal ownership made 92% in the structure of dwellings of
public ownership. In that year the total floor area of dwellings was 102,430.8 thousand m 2. According to
Lithuanian Statistics (2019), slightly more than half (59%) of the country’s population lived in multi-
apartment buildings and 41% in one-dwelling houses. 75% of dwellings were constructed before 1991
following Soviet-era building codes. All these buildings are in low EE classes (E and F).
This chapter analyses several indicators of the households that could be relevant to make insights on energy
sufficiency potentials in the country. This includes the average floor area of dwelling and per capita over time,
average household size and distribution of household by living mode, energy consumption by fuel, end use
and per capita. This is followed by relative energy expenditure data and several indicators of energy poverty.
2.1.1. Average floor area of dwellings
The average floor area of dwellings has a tendency to increase in Lithuania (Fig. 3).
100.0
90.0
80.0
70.0
60.0
m2
50.0
40.0
30.0
20.0
10.0
0.0
2005 2006 2007 2008 2009 2010 2011 2012 2013 2014 2015 2016 2017 2018
Lithuania EU
Figure 3. Average floor area of dwellings in Lithuania during 2005-2018 (Source: ODYSSEE database)
It was 61.3 m2 in 2005 but 68.9 m2 in 2018. In Lithuania the average floor area of dwellings was by 24%
lower than in EU. However, it increased faster in Lithuania (0.9% a year) than EU (0.3% a year). Therefore, in
the European context, the average floor area of dwellings in Lithuania was historically particularly in line with
the trends that a sufficiency approach would entail. Following the linear upward trend of the average floor
area of dwellings, we estimate that Lithuania could achieve the current EU level not earlier than in 2048 if
the current dynamics were to go on. Up to 2050 the average floor area of dwellings may increase in
Lithuania with smaller EE potential in comparison to average EU where the downward trend of the
indicator should be supported to exploit energy sufficiency potential. Nevertheless, it is the role of the
CACTUS project to explore an acceptable limitation of this upward trend, in particular by looking into new
build and readapting buildings when renovating.2.1.2. Average household size
The intergenerational living style predominated till 1990's has been outgoing; therefore, the households
become smaller in Lithuania (Fig. 4).
2.7
2.6
2.5
person/household
2.4
2.3
2.2
2.1
2.0
2005 2006 2007 2008 2009 2010 2011 2012 2013 2014 2015 2016 2017 2018
Lithuania EU
Figure 4. Average household size in Lithuania during 2005-2018 (Source: EUROSTAT database)
If a household consisted of 2.5 persons in 2005, during a decade it reduced and today is made up of 2.2
persons and is slightly smaller than in EU (2.3). This is due to the fact that more often people choose to live
single and families – without children and separately from their parents (Fig. 5).
50
Distribution of households, %
40
30
20
10
0
2005 2006 2007 2008 2012 2016
Single person Single person with children
Couple without children Couple with children
Other households with children Other households without children
Figure 5. Distribution of households by living mode 2005-2016 (Source: Lithuanian Statistics database)
Over the period the share of households consisting of one person increased from 34.2% (2005) to 39.4%
(2016) and the share of couples without children grew from 17.9% (2005) to 19.8% (2016). Moreover, the
share of households consisting of a couple, children and other persons reduced from 23.9% (2005) to 16.9%
(2016). Besides, the share of households consisting of a single person with children increases, i.e., from 4.3%
(2005) to 5.7% (2016). Surely, this could be a sensitive part of society in terms of consumption of sufficient
Analytical Brief on Sufficiency: Lithuania 14
© Cactus Project (2021 February)amount of energy services, especially if this is a low-income (per capita) household, as that households may
have difficulties to purchase and use enough appliances, as well as they may have difficulties when paying
for energy services on time.
Thus, the figures demonstrate that historical developments of households size and living modes of
Lithuanian households could be barriers for energy sufficiency; with present trends kept in future, it may
be difficult to improve energy sufficiency level in the country. The CACTUS project should therefore explore,
by comparing with sufficiency strategies in France or Germany, whether and how these trends could be
tempered, or reversed.
2.1.3. Floor area per capita
Residential and non-residential buildings cover about 63% and 37% of the total building floor area in
Lithuania, respectively [19]. In 2019, the total floor area of residential buildings accounted to 102,430.8
thousands m2.
40.00 3.40
Floor area per capita, m2/capita
35.00 3.30
30.00 3.20
Population, million
3.10
25.00
3.00
20.00
2.90
15.00
2.80
10.00 2.70
5.00 2.60
0.00 2.50
Floor area per capita Population
Figure 6. Floor area per capita and population in Lithuania during 2005-2019 (Source: Lithuanian Statistics
database)
The floor area per capita increases by 2.4% a year and was of 36.66 m 2 in 2019 (Fig. 6), compared for
example to 41 m2 in France. The main factors of this change are the reducing population that leaves dwellings
empty due to emigration or natural change of population, as well as households decisions to live in large and
newly built dwellings. The upward trend of the floor area per capita requests for stabilisation, otherwise,
following its linear upward trend it could further increase and become a serious obstacle to energy
sufficiency in future.
2.1.4. Energy consumption by fuel and by end use
Despite the aforementioned developments, the energy consumption of fuels reduces slowly (by 0.4% a year)
in Lithuanian households (Fig. 7). However, the reduction is interrupted by fuel consumption increases of
2.0% a year during 2007-2010 and of 3.0% a year during 2015-2018. Totally, 1.42 Mtoe of energy was
consumed in households in 2019.
Analytical Brief on Sufficiency: Lithuania 15
© Cactus Project (2021 February)1.80
1.60
1.40
1.20
1.00
Mtoe
0.80
0.60
0.40
0.20
0.00
2005 2006 2007 2008 2009 2010 2011 2012 2013 2014 2015 2016 2017 2018 2019
Liquid fuels Solid fuels Natural gas Peat Biomass Electricity Heat
Figure 7. Energy consumption by fuel during 2005-2019 (Source: Lithuanian Statistics database)
Biomass and DH dominates in the energy consumption structure with the shares of 32.4% and 31.3%,
respectively in 2019 (Fig. 8). However, consumption of biomass and DH reduces by 1.3% a year. Consumption
of liquid fuels reduces too (by 0.5% a year). Electricity is the third important energy type with a clearly upward
trend. 0.25 Mtoe of electricity was consumed in 2019. Natural gas has tendency to substitute biomass. Its
consumption increases by 1.3% a year and totally 0.16 Mtoe was consumed in 2019. Consumption of solid
fuels and peat is negligible, i.e., 0.03 Mtoe and 0.01 Mtoe, respectively in 2019.
100%
90%
80%
70%
60%
50%
40%
30%
20%
10%
0%
2010 2011 2012 2013 2014 2015 2016 2017 2018 2019
Space heating Water heating Cooking Electrical appliances and lighting
Figure 8. Energy consumption by end use in Lithuania during 2010-2019 (Source: Lithuanian Statistics
database)
Historically, the households consumed about 70% of energy for space heating, 14% – in electrical
appliances and for lightening, 9% – for water heating and 7% – for cooking. There is an increasing trend of
energy consumption by electrical appliances and lighting (by 1.7% a year) and reducing trend – for hot water
preparation (by 2.7% a year), cooking (1.7%) and space heating (1.3%).
Analytical Brief on Sufficiency: Lithuania 16
© Cactus Project (2021 February)2.1.5. Energy consumption per capita
On average households consumed about 0.493 toe per capita in Lithuania and about 0.581 toe per capita in
EU during 2005-2018 (Fig. 9).
0.700
Energy consumption in households, toe/cap
0.600
0.500
0.400
0.300
0.200
0.100
0.000
2005 2006 2007 2008 2009 2010 2011 2012 2013 2014 2015 2016 2017 2018
Lithuania EU
Figure 9. Energy consumption per capita during 2005-2018 (Source: ODYSSEE database)
While EU households demonstrate stabilization of energy consumption per capita, Lithuanian households
has started increasing energy consumption per capita by 4.2% since 2015 and almost reached EU level in
2018.
Therefore, the latest developments of energy consumption per capita in Lithuania supports the relevance of
energy sufficiency implementation in the country to stabilize energy consumption per capita to EU level and,
later on, to transform the upward trend of the indicator.
2.1.6. Share of energy expenditure in total household
expenditure
In 2019, household consumption expenditure of electricity, gas and other fuels made 4% in Lithuania in
comparison to 3.8% in the EU (Fig. 10).
Analytical Brief on Sufficiency: Lithuania 17
© Cactus Project (2021 February)7.0
6.0
5.0
4.0
%
3.0
2.0
1.0
0.0
2005 2006 2007 2008 2009 2010 2011 2012 2013 2014 2015 2016 2017 2018 2019
Lithuania EU
Figure 10. Share of energy expenditure in total household expenditure during 2005-2019 (Source:
EUROSTAT database)
During a decade the share of energy expenditure in Lithuania and EU reduced by 2.6 and 0.5 percentage
points, respectively. Seeking to keep the share of energy expenditure at current level, especially under the
assumptions of increasing energy prices and taxes on energy, energy sufficiency could be important in
combination to RES use and EE improvements.
2.1.7. Share of under-occupied and over-crowded
dwellings
In EU every third dwelling is under-occupied and 25% of population live in under-occupied dwellings in
Lithuania but this share tends to increase (Fig. 11). The upward trend of under-occupancy means that an
increasing number of households live in dwellings which are too large (there is a surplus of rooms) for the
needs of the households living in there. The main reasons of the under-occupation are older individuals or
couples staying in their homes after their children have grown up and left, breakdowns of families as well as
income situation of households. In reference to EUROSTAT data, in 2019, 34.2% of people of 65 years and
over lived in under-occupied dwellings in Lithuania, but this share was 50.1% in EU. The under-occupancy
rate of people at age of 18-64 was 24.6% in Lithuania but 33.4% in EU in 2019. In Lithuania the under-
occupancy problem becomes evident both in rich and poor households. During 2010-2019, a share of people
below 60% of median equivalised income but living in the under-occupied dwellings increased from 6.8%
(2010) to 18.8% (2019), but this share was 22.8% in EU (2019); a share of people above 60% of median
equivalised income and living in the under-occupied dwellings increased from 9.1% (2010) to 25.9% (2019),
but this share was 38.3% in EU (2019) [20]. Therefore, energy sufficiency potentials could be found in the
households living in the under-occupied dwellings by solving the problems of under-occupancy in Lithuania.
The energy sufficiency potential could be exploited for not reaching the EU level.
Analytical Brief on Sufficiency: Lithuania 18
© Cactus Project (2021 February)60.0 60.0
Under-occupied dwellings, %
Over-crowded dwellings, %
50.0 50.0
40.0 40.0
30.0 30.0
20.0 20.0
10.0 10.0
0.0 0.0
2008
2005
2006
2007
2009
2010
2011
2012
2013
2014
2015
2016
2017
2018
2006
2010
2014
2018
2005
2007
2008
2009
2011
2012
2013
2015
2016
2017
Lithuania EU Lithuania EU
Figure 11. Share of under-occupied and over-crowded dwellings during 2005-2018 (Source: EUROSTAT, EU-
SILC survey)
In contrast, there is a share of population who live in the over-crowded households that do not have at their
disposal a minimum number of rooms (Fig. 11). This share is higher in Lithuania than EU average. The problem
is common in households consisting of two adults with three and more children (50%) and poor households.
The statistics shows that in 2019 the over-crowding rate was 27.3% in Lithuanian and 26.7% in average EU
household below 60% of median equivalised income. Therefore, it is expected that there is little or no
possibilities to search for energy sufficiency solutions in this segment until EU levels are caught up, as
people might live tight and even need better access to energy services here.
2.1.8. Decomposition of energy consumption changes in
households
The decomposition of energy consumption changes in Lithuanian households is provided in Fig. 12.
Analytical Brief on Sufficiency: Lithuania 19
© Cactus Project (2021 February)Figure 12. Main drivers of the energy consumption variation in households (Source: ODYSSEE database) During 2000-2018 energy consumption in households increased by 0.11 Mtoe. Larger homes, more dwellings, a request for assurance of comfort subject to climate change and household behaviour towards use of energy are identified as some of the main driversin the increasing residential energy consumption. It is estimated that all together they increased energy consumption by 0.51 Mtoe in 2018 in comparison to 2000. The effect of more appliances used in households is estimated as negligible. Due to energy savings achieved from the implemented EE measures, the energy consumption reduced by 0.4 Mtoe. 2.1.9. Indicators of energy poverty There is a share of population in the EU which is unable to keep home adequately warm (Fig. 13). In EU 7% of population was unable to keep home adequately warm on average, but in Lithuania this share was 26.7% in 2019. This value is nearly four times higher than EU average. However, these figures should be interpreted carefully because each EU Member State formulates the problem related question differently in the EU-SILC survey. In case of Lithuania, the indicator could be overestimated after 2011 in comparison to its values before that year, because the formulation of the question in the survey had been changed twice, i.e., in 2011 and 2015. Analytical Brief on Sufficiency: Lithuania 20 © Cactus Project (2021 February)
40.0

                       Inability to keep home adeguately
                                                           35.0
                                                           30.0
                                                           25.0

                                     warm, %
                                                           20.0
                                                           15.0
                                                           10.0
                                                            5.0
                                                            0.0
                                                                  2007 2008 2009 2010 2011 2012 2013 2014 2015 2016 2017 2018 2019

                                                                                      Lithuania   EU

                Norway
                Sweden
                 Finland
               Slovakia
               Slovenia
              Romania
               Portugal
                 Poland
                 Austria
           Netherlands
                   Malta
               Hungary
           Luxembourg
              Lithuania
                   Latvia
                 Cyprus
                    Italy
                 Croatia
                  France
                   Spain
                 Greece
                 Ireland
                 Estonia
              Germany
              Denmark
                Czechia
               Bulgaria
               Belgium
                      EU
                               0.0                                5.0         10.0       15.0          20.0    25.0         30.0     35.0
                                                                        Inability to keep home adequately warm in 2019, %

           Figure 13. Inability to keep home adequately warm (Source: EUROSTAT, EU-SILC survey)

However, the share of population facing arrears on utility bills has been reducing in Lithuania and EU (Fig.
14).

Analytical Brief on Sufficiency: Lithuania                                              21
© Cactus Project (2021 February)
14.0
12.0
Arrears on utility bills, %
10.0
8.0
6.0
4.0
2.0
0.0
2007 2008 2009 2010 2011 2012 2013 2014 2015 2016 2017 2018 2019
Lithuania EU
Figure 14. Arrears on utility bills during 2007-2019 (Source: EUROSTAT, EU-SILC survey)
There are still households in the EU that have difficulties in satisfaction of basic needs [21]. In 2019, almost
6.1% of households could not pay for heating, electricity, gas, water, etc. on time, due to financial difficulties.
However, this share has fallen in the EU from 10.2% in 2013. In 2019, 7.5% of households in Lithuania
experienced problems paying their utility bills on time during the last 12 months and this share has been
decreasing from 13.2% in 2013.
An important instrument to address energy poverty in Lithuania is heating compensation, which provides
financial assistance to households who cannot afford sufficient heating.
Analytical Brief on Sufficiency: Lithuania 22
© Cactus Project (2021 February)2.2. Tertiary Sector
In Lithuania the tertiary sector consists of wholesale and retail trade, maintenance of motor vehicles and
motorbikes, repairing of household equipment, hotels and restaurants, financial intermediation, real estate
management and rent, public management and defense, mandatory social security, education, health
treatment and social work, other public, social and individual services, as well private households related
activities. The tertiary sector creates more than half of the total value added. In 2019, the share of value
added in tertiary sector accounted 68.3%. In addition, the tertiary sector employed 932,447 persons,
consumed 0.63 Mtoe of energy (accounted 11.2% of the FEC) and emitted 1.6% of total GHG emissions
(excluding LULUCF) in 2019. The following chapters present the tertiary sector -specific indicators that back
relevant energy sufficiency assumptions and provide insights on energy sufficiency potentials.
2.2.1. Final energy consumption by fuel
Tertiary sector consumes about 0.6 Mtoe of energy a year but consumption increased by 0.2 Mtoe during
2015-2018 (Fig. 15).
0.70
0.60
0.50
0.40
Mtoe
0.30
0.20
0.10
0.00
2005 2006 2007 2008 2009 2010 2011 2012 2013 2014 2015 2016 2017 2018 2019
Liquid fuels Solid fuels Natural gas Peat Biomass Electricity Heat
Figure 15. Energy consumption by fuel during 2005-2019 (Source: Lithuanian Statistics database)
Electricity and DH accounts for 76% of total energy consumption and mainly cause changes in it. Certainly,
some small developments were caused by use of natural gas, the share of which increased from 9.1% in 2005
to 11.6% in 2019, and solid fuels, the share of which increased from 8.8% in 2005 to 4.5% in 2019.
Analytical Brief on Sufficiency: Lithuania 23
© Cactus Project (2021 February)2.2.2. Energy consumption per employee and per value
added
1.2
Energy consumption per employee,
1
0.8
toe/emp
0.6
0.4
0.2
0
2005 2006 2007 2008 2009 2010 2011 2012 2013 2014 2015 2016 2017 2018
Lithuania European Union
Figure 16. Energy consumption per employee during 2005-2018 (Source: ODYSSEE database)
On average, employee in tertiary sector consumes 0.72 toe of energy a year in Lithuania, while
consumption of energy in EU is by 29% higher (Fig. 16). There is a downward tendency of energy
consumption per employee in EU but no clear trend exists in Lithuania. In the last three years energy
consumption increased by 0.2 Mtoe a year in Lithuania. From the point of view of energy consumption per
employee, Lithuania outperforms the average EU; yet, this emerging trend could be even more enhanced
with the support of a sufficiency approach.
6000
Electricity consumption per employee,
5000
4000
kWh/emp
3000
2000
1000
0
2005 2006 2007 2008 2009 2010 2011 2012 2013 2014 2015 2016 2017 2018
Lithuania European Union
Figure 17. Electricity consumption per employee during 2005-2018 (Source: ODYSSEE database)
On average employees use about 3,584 kWh of electricity a year in Lithuania but by 40.6% more in the EU
(Fig. 17). Since 2015, electricity consumption has been increasing by 2.0% in Lithuania. The electricity
Analytical Brief on Sufficiency: Lithuania 24
© Cactus Project (2021 February)consumption per employee in Lithuania is lower than the EU average, but tends now to stabilize. In this
context, energy sufficiency potential could be searched and exploited in order to foster further decrease.
120
100
Index (2005=100)
80
60
40
20
0
2005 2006 2007 2008 2009 2010 2011 2012 2013 2014 2015 2016 2017 2018
toe/emp kWh/emp
Figure 18. Indexes of electricity and energy consumption per employee during 2005-2018 (Source: own
calculations based on Lithuanian Statistics data)
Energy consumption per employee reduces faster than electricity consumption per employee and in 2018
was 80% and 88% of 2005 level, respectively (Fig. 18). Therefore, energy sufficiency potentials could be key
for specific (electricity) demand reductions.
0.025
Energy intensity of tertiary sector,
0.020
koe/EUR2010p
0.015
0.010
0.005
0.000
2005 2006 2007 2008 2009 2010 2011 2012 2013 2014 2015 2016 2017 2018
Lithuania EU
Figure 19. Energy intensity during 2005-2018 (Source: ODYSSEE database)
Energy consumption intensity improves faster in Lithuanian tertiary sector than in the EU, however, it
remains worse in comparison to EU average (Fig. 19). The gap between intensities was 18% in 2005 and 14%
in 2018; as made 0.018 koe/EUR2010PPP and 0.015 koe/EUR2010PPP, respectively. The energy sufficiency
approach could be relevant when reducing energy intensities in Lithuanian tertiary sector and approaching
the average EU levels.
Analytical Brief on Sufficiency: Lithuania 25
© Cactus Project (2021 February)120
Electricity intensity, kWh/kEUR2010p
100
80
60
40
20
0
2005 2006 2007 2008 2009 2010 2011 2012 2013 2014 2015 2016 2017 2018
Lithuania EU
Figure 20. Electricity intensity in commercial sector during 2005-2018 (Source: ODYSSEE database)
Electricity intensities are similar in Lithuania and EU – 90 kWh/kEUR2010PPP and 86 kWh/kEUR2010PPP in 2018,
respectively (Fig. 20). During the latter several years electricity intensities reduced.
2.2.3. Decomposition of energy consumption changes in
tertiary sector
During 2000-2018 energy consumption in tertiary sector increased by 0.19 Mtoe, as it is showed in Fig. 21.
Figure 21. Main drivers of the energy consumption variation in tertiary sector (Source: ODYSSEE database)
Analytical Brief on Sufficiency: Lithuania 26
© Cactus Project (2021 February)The economic activity of the sector strongly supported by the consumerism approach viable in the economy
when consuming goods and related services increased energy consumption the most, i.e. by 0.4 Mtoe; while
inappropriate behaviour towards energy consumption put on additional 0.12 Mtoe. Nonetheless, due to
developments in labour productivity energy consumption reduced by 0.28 Mtoe. Implemented EE
measures in service sector allowed reducing energy consumption by additional 0.06 Mtoe.
2.3. Energy and Climate Policy Goals Related to
Building Sector
2.3.1. NECP 2030
Seeking to follow the decarbonisation path of the national economy, the NECP 2030 expects to reduce GHG
by 25% (in comparison to 2017) in households and by 14% in service sector in 2030. Energy consumption
will reduce from 649.9 ktoe (2018) to 540.4 ktoe (2030) and 535.8 ktoe (2040) in service sector and from
1,486 ktoe (2018) to 1,307.5 (2030) and 1,209.6 (2040) in households. The reductions in energy consumption
will be achieved through the introduction of a list of existing and planned policy measures responding to
the application of new and less energy-intensive technologies, the increase of consumer awareness and
the change of behaviour (these are the agreements with energy suppliers on consumer education and
consulting). In particular, by the end of 2030, around 5,000 multi-apartment buildings will be renovated to
meet energy class C2 and to save 40% of energy. This means that nearly 500 multi-apartment buildings will
be renovated each year. Therefore, energy savings will be 310 ktoe (3.6 TWh) during 2021-2030. In addition,
960,000 m2 of public building area will be renovated to meet class C by 2030. This should increase energy
savings to 31 ktoe (0.36 TWh) during 2021-2030. Furthermore, 50,000 domestic boilers will be replaced in
households and other heat efficiency improvement measures will be implemented, resulting in savings of at
least 17 ktoe (200 GWh) per year. Related energy savings shouldbe 946 ktoe (11 TWh) during 2021-2030.
Moreover, the indoor heating and hot water systems in multi-apartment buildings will be modernised, with
estimated energy savings of 47.3 ktoe (0.55 TWh) during 2021-2030. Besides this, financial incentive for
private house owners will be provided for the renovation of their homes. Therefore, 1,000 private houses
will be renewed, resulting again in energy savings of 1.2 ktoe (13.5 GWh) a year and 63.6 ktoe (0.74 TWh)
during 2021-2030. Then, the energy suppliers will ensure the implementation of measures of consumer
education and consulting provided for in agreements concluded between them or through other persons
(including the introduction of smart metering). Energy savings shall be 258 ktoe (3 TWh) during 2021-2030.
50% of the savings will go to industrial end-users and the remainder to households. In terms of energy source,
electricity will account for 40% of energy savings, heat for 40% and natural gas for the remaining 20%. Finally,
energy companies will save energy according to the levels of energy specified in the energy savings
agreements by applying cost-effective energy efficiency improvement measures at the final energy
customers’ installations, equipment and transport. Energy savings should be 473 ktoe (5.5 TWh) during 2021-
2030. It is planned that this measure will apply to the services and industry sectors, assuming that the savings
measures will generate 50% electricity and 50% heat savings. The NECP proposes several measures to
address energy poverty within the internal energy market. These are financial support and legal
protections, as well as energy price related and consumer information, vulnerable people needs
prioritizing measures. However, their impacts on energy consumption in households suffering from energy
poverty is not assessed separately.
2
Technical regulation STR 2.01.09:2012 Energy performance of buildings. Energy performance certification
Analytical Brief on Sufficiency: Lithuania 27
© Cactus Project (2021 February)You can also read