01/2018 8 Poland Quarterly Statistics - Statistical analyses
←
→
Page content transcription
If your browser does not render page correctly, please read the page content below

Statistical analyses
                                     01/2018

              Poland Quarterly Statistics
Warsaw 2018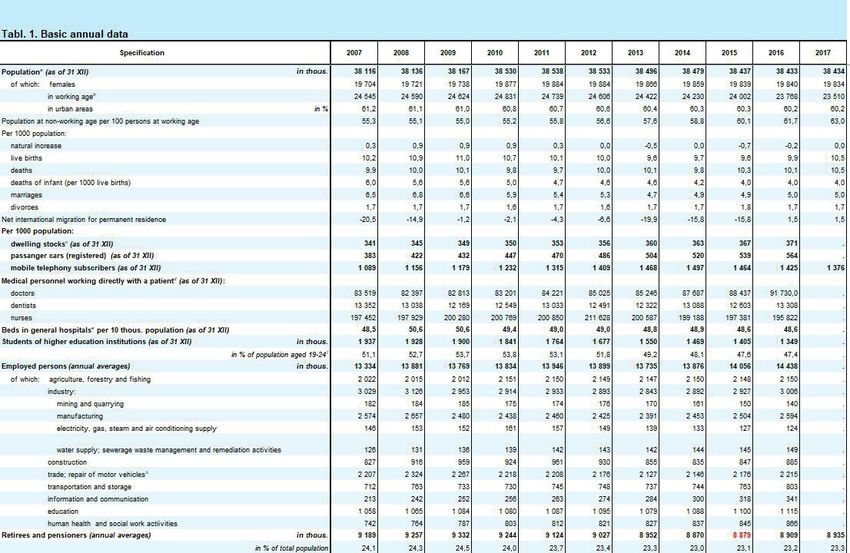
Statistical analyses
                       01/2018

Poland Quarterly Statistics
Statistics Poland
Warsaw, June 2018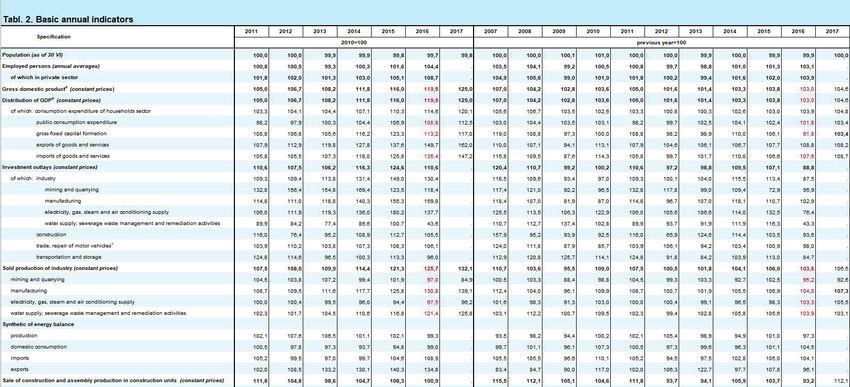
Content-related works
Statistics Poland, Statistical Products Department

supervised by
Renata Bielak

Editorial team
Katarzyna Kamińska, Anna Korczak-Żydaczewska, Wiesława Kościńska, Elżbieta Lisiak, Anna Pysznik, Leon Marmolak,
Urszula Wilczyńska, Jolanta Zakrzewska-Gralec

Icons used on the cover
Designed by Freepik, Kirenshastry and Pixel Perfect from Flaticon

Publication available on website
stat.gov.pl

When publishing Statistics Poland data – please indicate the source.
Contents
           Symbols................................................................................................................................................................................. 4

           Major abbreviations.......................................................................................................................................................... 4

           Socio-economic Situation of Poland in the 1st quarter of 2018....................................................................... 5

                 Executive summary.................................................................................................................................................... 5

                 Population..................................................................................................................................................................... 7

                 Labour market.............................................................................................................................................................. 8

                 Wages and salaries; social benefits....................................................................................................................... 12

                 Prices................................................................................................................................................................................ 15

                 Agriculture..................................................................................................................................................................... 19

                 Industry.......................................................................................................................................................................... 22

                 Construction................................................................................................................................................................. 25

                 Domestic market......................................................................................................................................................... 29

                 Transport........................................................................................................................................................................ 31

                 Financial results of non-financial enterprises................................................................................................... 33

                 Investment outlays..................................................................................................................................................... 38

                 Foreign trade................................................................................................................................................................ 39

                 State budget................................................................................................................................................................. 42

                 Gross domestic product........................................................................................................................................... 44

           Selected socio-economic indicators for Poland...................................................................................................... 46

                 Tabl. 1. Basic annual data......................................................................................................................................... 46

                 Tabl. 2. Basic annual indicators............................................................................................................................... 46

                 Tabl. 3. Selected quarterly indicators................................................................................................................... 46

           General Notes...................................................................................................................................................................... 47

           Methodological Notes...................................................................................................................................................... 49

                                                                                                                                                                                                             3
Symbols
Symbol Description
Dash (–) magnitude zero
Zero (0) magnitude not zero, but less than 0.5 of an unit
(0,0) magnitude not zero, but less than 0.05 of a unit
Dot (.) data not avaliable or not reliale
x not applicable
”Of which” indicates that not all elements of the sum are given
Colour red data in MS Excel tables altered in relation to the one published in the previous
editions
Major abbreviations
Abbreviation Complete name
NACE Statistical Classification of Economic Activities in the European Community
thous. thousand
mln million
mld billion
pp percentage point
zl, PLN zloty
USD Unite States dollar
EUR euro
CHF Swiss franc
EU European Union
kg kilogramme
pc. piece
l litre
hl hectolitre
t tonne
dt decitonne
sections of the NACE
Trade; repair of motor vehicles Wholesale and retail, trade; repair of motor vehicles and motorcycles
Accommodation and catering Accommodation and food service activities
4Socio-economic Situation of Poland in the 1st quarter of 2018
Executive summary
According to preliminary data, the growth rate of the gross domestic product (at annual average constant
prices of previous year), in the 1st quarter of 2018, amounted to 5.2%, in annual terms (compared to
the increase of 4.9% in the 4th quarter of 2017 and 4.4% a year before, respectively). After eliminating
the influence of seasonal factors, the gross domestic product (at constant prices with reference to
year 2010) increased by 5.0% in annual terms (compared to the growth of 4.6% a year before).
In the 1st quarter of 2018, the following trends were observed:
• The increase in the average paid employment in the enterprise sector, in annual terms, was slower
than in the previous quarters.
• The registered unemployment rate was lower than a year before. At the end of March, it amounted to
6.6%.
• The average monthly nominal and real gross wages and salaries in the enterprise sector grew,
in annual terms, at a rate similar to that observed in the 4th quarter of the previous year.
• The growth rates of average nominal gross retirement and other pensions from non-agricultural social
security system and from farmers were close to the ones recorded in the previous period. The dyna-
mics of purchasing power of pension benefits in both systems strengthened.
• On the agricultural market, procurement prices of the majority of basic agricultural products (except
for the prices of wheat, potatoes and pigs for slaughter) were higher than a year before. It is estimated
that overwintering of the winter crops was slightly worse than in the previous year. Preliminary results
of the survey conducted at the end of March 2018 indicate the growth in the livestock of pigs, in
annual terms.
• Prices of consumer goods and services increased, in annual terms, to a lesser extent than
in the 4th quarter of 2017. The growth rate of prices of food and non-alcoholic beverages as well as
goods and services related to dwelling slowed down. The price of goods and services related to the
transport were lower than the year before (when their growth was observed).
• The prices of sold production of industry grew, in annual terms, significantly slower than
in previous quarters of the last year. However, the dynamics of producer prices in construction acce-
lerated.
• The annual growth rate of sold production of industry was slower than in the previous quarter.
The sales grew in the majority of sections, with the exception of mining and quarrying. Production
growth was observed in all main industrial groupings, the highest in energy goods.
• Construction and assembly production increased, in annual terms, at a faster rate than in the previous
quarters. The increase was recorded in all construction divisions, the highest – in enterprises speciali-
sing in civil engineering.
• The annual growth rate of retail sales was slightly faster than in the 4th quarter of the previous year.
• The dynamics of sales in transportation and storage services slowed down.
5EXECUTIVE SUMMARY
• The value of exports constituted slightly below the level observed in the previous year. Imports
increased, in annual terms, at a significantly slower pace than the year before. The total turnover
balance was negative, in comparison to the positive ones in the last three years. In the period of
January–March 2018, the turnover, at constant prices, increased both in exports and imports.
• The financial results of the surveyed enterprises were lower than those achieved a year earlier.
The basic economic and financial relations deteriorated. Exporters noted weaker basic results than in
the 1st quarter of the previous year, but better than entities in total.
• Investment outlays of all surveyed enterprises increased after a slight decrease a year before. Outlays
on buildings and structures rose at a faster pace than outlays on purchases.
• The state budget revenue, in the period January–March 2018, amounted to PLN 88.5 bn, and expen-
diture to PLN 85.3 bn (respectively 26.4% and 21.5% of the amounts assumed in the Budget Act
for 2018); as a result, a deficit was recorded in the amount of PLN 3.1 bn which constituted 7.5%
of the plan.
6Population
According to preliminary estimates, at the end of the 1st quarter 2018, the population of Poland amounted
to 38412 thous. persons, i.e. by 22 thous. fewer than at the end of the previous year and by approx. 4.5 thous.
less than a year before. The pace of actual decrease, in the 1st quarter of 2018, amounted to minus 0.01%
(in the corresponding period of the previous year, it was minus 0.03%). In comparison with the 1st quarter
of the previous year, the number of births decreased, however the number of deaths increased. It is esti-
mated that the net of international migrations for permanent residence remained unchanged.
Based on the preliminary data, in the period of three months of 2018, approx. 96 thous. of live births were
registered, i.e. by approx. 4 thous. fewer than in the corresponding period of the previous year. The birth
rate decreased by 0.4 points in relation to the 1st quarter of the previous year and amounted to 10.0 ‰.
The number of deaths increased by 1 thous. to approx. 118 thous. The death rate reached the level of
12.3‰ and was by 0.1 point higher than in the same period of the previous year.
The natural increase (the difference between the number of live births and deaths in total) remained
negative and amounted to minus 22 thous. It is estimated that in the 1st quarter of 2018, on average the
population number decreased by 23 persons for each 10 thous. people (in the 1st quarter of the previous
year – 18 persons).
In the period of January–March 2018, approx. 0.4 thous. infants (i.e. children below 1 year of age) died.
The infant death rate increased by 0.2 point, and amounted to 4.3‰.
According to the preliminary estimates, in the period of January–March 2018, approx. 15 thous. marriages
were contracted (similarly as a year before), of which religious marriages accounted for almost one third.
The marriage rate remained unchanged and amounted to 1.6‰. Divorce was adjudicated in relation to
nearly 17 thous. of marriages (by almost 1 thous. fewer than a year before); the divorce rate remained at
the level of 1.8‰. Judicial separations were pronounced in respect of over 0.4 thous. marriages (slightly
fewer than a year before).
Chart 1. Expectation of life
age
85
81,8
80
75 74,0
70
65
60
1980
1981
1982
1983
1984
1985
1986
1987
1988
1989
1990
1991
1992
1993
1994
1995
1996
1997
1998
1999
2000
2001
2002
2003
2004
2005
2006
2007
2008
2009
2010
2011
2012
2013
2014
2015
2016
2017
year of birth
males females
7Labour market
In the 1st quarter of 2018, the average paid employment in the national economy1 amounted to
8931 thous. persons and was by 2.7 % higher than in the corresponding period of the previous year.
The average paid employment in the enterprise sector2, grew, in annual terms, at a slower pace than
in the previous periods. In the labour offices there were registered less unemployed persons than a year
before and simultaneously were removed from the unemployment rolls fewer unemployed persons. The
number of registered unemployed persons and the unemployment rate, at the end of March 2018, were
lower than a year before.
Table 1. The employed persons and the average paid employment in the national economy1
Specification 2017
a – corresponding period Q1 2018
of previous year=100 Q1 Q2 Q3 Q4
Employed persons (end of period)
in thous. 9138 9169 9204 9245 9400
a 103.5 103.4 103.4 103.3 102.9
Average paid employment in thous. 8694 8718 8796 8855 8935
a 103.2 103.1 103.8 103.3 102.8
Chart 2. Average paid employment in the enterprise sector
corresponding period of previous year=100
105
104
103
102
101
100
Q1 Q2 Q3 Q4 Q1 Q2 Q3 Q4 Q1
2016 2017 2018
1 Excluding economic entities employing up to 9 persons, and private farms in agriculture as well as budget entities,
conducting activity in the scope of national defence and public safety.
2 In economic entities employing more than 9 persons.
8LABOUR MARKET
The average paid employment in the enterprise sector, in the period of January–March 2018, amounted
to 6191.1 persons, i.e. it increased by 3.7% in comparison with the one observed a year before (against
a rise of 4.4% in the corresponding period of the previous year). The growth in employment, higher than
the average increase in the enterprise sector, was recorded in professional, scientific and technical activi-
ties (of 8.5%), transportation and storage (of 6.7%), administrative and support service activities (of 4.6%),
as well as in construction and accommodation and catering (of 4.5% each). Employment also went up
(within the range of 3.7% – 1.7%) in information and communication, trade; repair of motor vehicles,
manufacturing and water supply; sewerage, waste management and remediation activities. The decline
in paid employment in mining and quarrying as well as in the real estate activities (of 0.8% each), and
electricity, gas, steam and air conditioning supply (of 0.7%) continued.
Among divisions with a considerable share in employment, the highest increase in average paid
employment, as compared to the 1st quarter of the previous year, was observed in enterprises dealing
with land and pipeline transport (of 8.6%), specialised construction activities (of 6.5%), manufacture
of machinery and equipment n.e.c. (of 5.7%) as well as wholesale and retail trade and repair of motor
vehicles and motorcycles (of 5.4%). The decline in paid employment in enterprises dealing with manu-
facture of wearing apparel (of 2.4%) and mining and coal and lignite (of 1.5% against a drop of 9.2%
in the 1st quarter of the previous year).
The number of unemployed persons registered in labour offices, at the end of March 2018, amounted
to 1092.2 thous. and it was lower as compared to the one recorded in March 2017 (by 232 thous.,
i.e. by 17.5%). The registered unemployment rate amounted to 6.6%, i.e. it decreased by 1.4 percentage
points in annual terms.
Chart 3. Registered unemployment
thous. %
1 750 12
1 500
10
1 250
8
1 000
6
750
4
500
2
250
0 0
OCT
OCT
JUN
SEP
JUL
NOV
JUN
SEP
AUG
JUL
NOV
AUG
FEB
APR
DEC
FEB
APR
DEC
FEB
JAN
MAR
MAY
JAN
MAR
MAY
JAN
MAR
2016 2017 2018
number of unemployed persons (left scale) unemployment rate (right scale)
9LABOUR MARKET
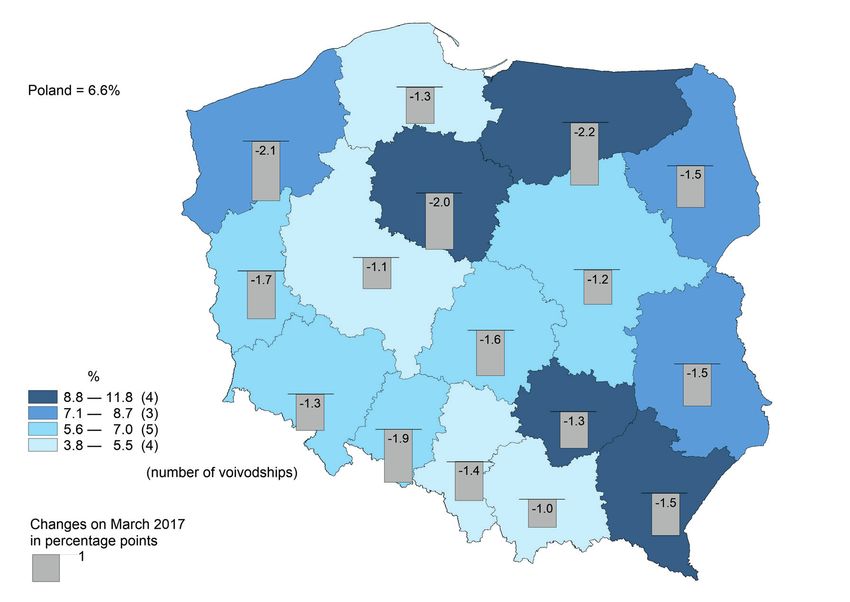
The unemployment rate in voivodships figured within the range from 3.8% in wielkopolskie to 11.8%
in warmińsko-mazurskie. In comparison with March of the previous year, the unemployment rate decre-
ased in all voivodships, especially in warmińsko-mazurskie, zachodniopomorskie and kujawsko-pomor-
skie (within the range from 2.2 percentage points to 2.0 percentage points).
Table 2. Registered unemployed persons and unemployment rate
Specification 2017
a – corresponding period Q1 2018
of previous year=100 Q1 Q2 Q3 Q4
Registered unemployed persons in total
(end of a period) in thous. 1324.2 1151.6 1117.1 1081.7 1092.2
a 82.7 82.7 84.4 81.0 82.5
Newly registered unemployed persons
in thous. 520.5 414.3 491.2 488.8 455.7
a 86.7 85.8 92.6 87.8 87.5
Unemployed persons removed from
unemployment rolls in thous. 531.5 586.9 525.7 524.2 445.2
a 94.4 85.0 87.8 96.1 83.8
Unemployment flow (inflow – outflow) -11.0 -172.6 -34.5 -35.4 10.5
Unemployment rate (end of a period) in % 8.0 7.0 6.8 6.6 6.6
Map 1. Registered unemployment rate
as of the end of December 2017
10LABOUR MARKET
At the end of March 2018, the share of women in the structure of registered unemployed persons was
higher than that of men and amounted to 54.1% (by 1.4 percentage points more than a year before).
In comparison with March of the previous year, the percentage of previously employed persons increased
(by 0.5 percentage point to 86.9%) as well as persons without occupational qualifications (by 0.1 percen-
tage point to 30.9%). However, there was a decrease in the percentage of persons without benefit rights
(by 0.3 percentage point to 85.1%) and of graduates (by 0.3 percentage point to 3.4%).
Among unemployed persons with a specific situation on the labor market, compared to the end of March
of the previous year, the share of the following categories (in the number of the registered unemployed
persons in total) decreased:
• long-term unemployed persons3 (by 1.4 percentage points to 53.1%),
• persons aged over 50 (by 1.1 percentage points to 27.3%),
• unemployed persons aged below 30 (by 0.8 percentage point to 26.0%, of which the share of persons
aged below 25 was lower by 0.8 percentage point than a year before and amounted to 12.1%).
The percentage of unemployed persons with at least one child under 6 years of age increased
(by 2.1 percentage points to 19.7%).
The following categories did not change significantly:
• unemployed disabled persons (6.1%),
• unemployed persons benefiting from social assistance (2.3%),
• unemployed persons with a disabled child under 18 years of age (0.2%).
In the 1st quarter of 2018, the number of newly registered unemployed amounted to 455.7 thous.
and it was by 12.5% lower than a year before (against a decline of 13.3% in the corresponding period
of the previous year). Persons registering for another time still constituted the most numerous group,
and their share in the newly registered persons in total was higher than in the corresponding period
of the previous year (by 0.3 percentage point to 84.0%). The percentage of unemployed persons resi-
ding in rural areas and unemployed persons without occupational qualifications also increased. However,
the percentage of long-term unemployed persons, persons terminated for company reasons, persons
previously not employed and graduates, decreased.
In the period of three months of 2018, 445.2 thous. persons were removed from the unemployment regi-
ster, i.e. 16.2% less than a year before (against a drop of 5.6% in the corresponding period of the previous
year). The main reason for deregistering was still taking up a job, as a result of which 221.8 thous. persons
were removed from the unemployed rolls, i.e. less than a year before, when 256.0 thous. persons were
removed. Both the number of persons who undertook non-subsidised and subsidised job decreased.
The share of persons removed due to taking up a job in the total number of removed persons incre-
ased by 1.6 percentage points, in annual terms, and amounted to 49.8%. However, the share of persons
removed from unemployment rolls due to other causes, among others persons who acquired retirement
and other pension rights, and persons who did not confirm their readiness for taking up a job, decreased.
In the 1st quarter of 2018, 424.7 thous. job offers were submitted to labour offices4, i.e. by 1.3% fewer
than a year before. Offers from the public sector accounted for 11.2% of all offers (against 14.2%
in the corresponding period of the previous year). The number of offers in the public sector declined
(by 22.2%) and grew in the private sector (by 2.2%). At the end of March 2018, job offers which were not
embraced for longer than a one month accounted for 22.5% of all offers (against 20.0% a year before).
From among all offers, 7.3% referred to traineeship, 4.4% were addressed to disabled persons and 0.3%
– to graduates.
3 Long-term unemployed persons include persons remaining in the register of a poviat labour office for a total of over
12 months, within the last 2 years, excluding periods of internship and vocational training at the workplace.
4 It concerns the vacant places of employment and places of occupational activation.
11Wages and salaries; social benefits
In the 1st quarter of 2018, the average monthly nominal gross wage and salary in the national economy1
amounted to PLN 4622.84, i.e. by 6.2% more than in the corresponding period of the previous year.
The increase of the average monthly nominal gross wages and salaries in the enterprise sector2, in annual
terms, was similar to the one observed in the 4th quarter of the previous year. The nominal gross retire-
ment and other pensions from non-agricultural social security system and of farmers increased in a similar
pace as in the previous period. Dynamics of the purchasing power of retirement and other pensions
improved in both systems.
In the period of January–March 2018, the average monthly nominal gross wage and salary in the enter-
prise sector reached the level of PLN 4700.11 and it was by 7.1% higher than in the corresponding period
of the previous year (against an increase of 7.6% in the 4th quarter of 2017 and of 4.5% a year before).
Average wages and salaries grew in all sections, most significantly in electricity, gas, steam and air condi-
tioning supply (by 10.2%, after a decrease observed a year before), administrative and support service
activities (by 8.8%) and accommodation and catering (by 8.5%). Wages and salaries in mining and quar-
rying increased to the smallest extent (by 1.3%, of which a decrease of 1.6% in mining of coal and lignite
was recorded). The growth in wages and salaries occurred in most divisions with a significant share in
employment, of which the highest increase was recorded in civil engineering (of 9.9%), manufacture of
food products (of 8.4%) and manufacture of other non-metallic mineral products (of 8.1%). Wages and
salaries went up to the least extent in divisions: land and pipeline transport (by 5.3%) and construction of
buildings (by 5.9%).
Chart 4. Average monthly gross wages and salaries in enterprise sector
corresponding period of previous year=100
108
107
106
105
104
103
102
101
100
Q1 Q2 Q3 Q4 Q1 Q2 Q3 Q4 Q1
2016 2017 2018
nominal real
1 Including entities employing up to 9 persons.
2 In entities employing more than 9 persons.
12WAGES AND SALARIES; SOCIAL BENEFITS
Table 3. Average monthly gross wages and salaries in the enterprise sector
2017 2018 2017
Q1 2018
Specification Q1 Q2 Q3 Q4
in zl corresponding period of previous year=100
Total 4390.54 4700.11 104.5 105.4 106.0 107.6 107.1
of which:
Industry 4409.12 4706.18 104.1 105.9 105.2 106.8 106.7
mining and quarrying 6361.60 6442.24 104.4 108.9 97.7 112.7 101.3
manufacturing 4181.48 4484.06 105.2 106.1 106.6 107.3 107.2
electricity, gas, steam and
air conditioning supply 6999.86 7710.81 99.0 106.7 102.9 102.9 110.2
water supply; sewerage,
waste management and
remediation activities 4052.15 4254.63 102.7 103.8 103.4 104.1 105.0
Construction 4265.74 4593.84 105.6 104.0 107.4 109.3 107.7
Trade; repair of motor vehicles 4147.98 4443.36 106.7 106.8 107.2 110.9 107.1
Transportation and storage 3895.47 4155.67 103.7 104.4 105.1 107.0 106.7
Accommodation and catering 3193.42 3465.80 104.8 106.6 107.0 104.3 108.5
Information and communi-
cation 7885.30 8503.27 103.6 103.6 106.9 102.4 107.8
Real estate activities 4657.91 4957.51 105.2 107.5 105.1 108.9 106.4
Professional, scientific and
technical activitiesa 6572.87 7073.90 100.7 102.8 102.5 108.6 107.6
Administrative and support
service activities 3132.49 3406.91 104.6 107.3 108.1 110.9 108.8
a Excluding divisions: Scientific research and development, as well as Veterinary activities.
In the period of January–March 2018, the amount of wages and salaries in the enterprise sector was
by 11.1% higher than in the corresponding period of the previous year (a growth of 9.1% a year before
was observed).
The purchasing power of the average monthly gross wage and salary in the enterprise sector,
in the 1st quarter of 2018 was by 5.6% higher than a year before (while in the 4th quarter of the previous
year the growth amounted to 5.5%, and in the 1st quarter of the previous year – to 2.5%).
13WAGES AND SALARIES; SOCIAL BENEFITS
Table 4. Retirees and pensioners and average monthly gross benefit
2017
Specification Q1 2018
Q1 Q2 Q3 Q4
Average number of retirees and
pensioners:
in thous. persons 8913.5 8907.9 8900.3 9019.0 9166.8
from non-agricultural social
security system 7730.3 7730.9 7729.3 7849.0 7995.6
of farmers in thous. persons 1183.2 1177.0 1171.0 1170.0 1171.2
corresponding period
of previous year=100 100.1 100.0 99.9 101.1 102.8
Average retirement and other
pension:
from non-agricultural social
security system:
in zl 2109.47 2129.56 2138.83 2173.72 2183.62
corresponding period
of previous year=100 101.7 102.2 102.3 103.7 103.5
of farmers:
in zl 1188.16 1202.26 1202.27 1207.44 1214.59
corresponding period
of previous year=100 100.6 101.5 101.6 102.1 102.2
The average monthly nominal gross retirement and other pension from the non-agricultural social secu-
rity system, in the period of January–March 2018, reached the level of PLN 2183.62 and increased by 3.5%
in comparison with the corresponding period of the previous year. In the 1st quarter of 2018, the average
monthly real retirement and other pension from the non-agricultural social security system grew by 1.5%
in annual terms.
The average monthly nominal gross retirement and other pension of farmers, in the period of January–
March 2018, amounted to PLN 1214.59, i.e. by 2.2% more than in the corresponding period of the previous
year. In the 1st quarter of 2018, the purchasing power of the gross average retirement and other pension
of farmers increased by 0.2% in annual terms.
In the period of January–March 2018, the gross amount of unemployment benefits (excluding social
security contributions), amounted to PLN 362.3 mln, i.e. it dropped by 16.3% as compared to the corre-
sponding period of the previous year.
The value of pre-retirement benefits and allowances amounted to PLN 369.2 mln and was by 33.1% lower
than in the corresponding period of the previous year.
Benefits from the Bridging Pension Fund were received on average by 23.2 thous. persons, and the total
amount of the paid out benefits amounted to PLN 182.1 mln (in the corresponding period of the previous
year, it was 20.3 thous. persons and PLN 152.4 mln, respectively).
14Prices
In the period January–March 2018, the growth in consumer prices was lower than in the last quarter
of 2017. In March 2018, the prices of consumer goods and services increased in annual terms to a
slightly lesser degree than in February 2018. Among others, it was the dynamics of prices of goods and
services related to dwelling that slowed down. However, the growth rate of prices of food and non-alco-
holic beverages accelerated. Clothing and footwear prices as well as the prices of goods and services
related to the transport, similarly as in previous months, were lower than the previous year. The dynamics
of producer prices in industry in annual terms, in the 1st quarter of 2018, significantly weakened
in comparison with the one observed in the previous periods; whereas the increase in prices of construc-
tion and assembly production accelerated. In March 2018, after a slight drop in the previous month,
the prices of sold production of industry were higher than in the previous year. The growth of producer
prices in construction maintained.
Chart 5. Price indices
corresponding period of previous year=100
105
104
103
102
101
100
99
98
97
JUN
SEP
OCT
JUL
SEP
OCT
AUG
NOV
JUN
JUL
AUG
NOV
FEB
APR
DEC
DEC
JAN
MAR
MAY
FEB
APR
FEB
JAN
MAR
MAY
JAN
MAR
2016 2017 2018
sold production of industry construction and assembly production consumer goods and services
The prices of sold production of industry, in the 1st quarter of 2018, increased by 0.2% as compared to the
corresponding period of the previous year. In March 2018, an increase of 0.5%, in annual terms, in prices
of sold production of industry was observed (after a drop of 0.1% in February 2018).
The prices of sold production of industry in March 2018 were by 0.5% higher than those recorded
in December 2017. The price increase was observed in all sections, of which the largest in mining and
quarrying (of 1.2%). Prices in the manufacturing section grew by 0.5%, in water supply; sewerage, waste
management and remediation activities – by 0.3%, and in electricity, gas, steam and air conditioning
supply, the increase amounted to 0.1%.
15PRICES
Table 5. Price indices of sold production of industry and construction and assembly production
2017 2018
Q1 Q2 Q3 Q4 Q1 MAR
Specification
DEC
corresponding period of previous year=100
2017=100
Prices of sold production
of industry 104.4 102.8. 102.8 101.7 100.2 100.5 100.5
mining and quarrying 129.3 123.1 118.9 108.6 99.3 99.7 101.2
manufacturing 103.8 102.1 102.3 101.5 100.2 100.6 100.5
electricity, gas, steam and air
conditioning supply 99.7 100.7 100.7 99.6 99.2 99.3 100.1
water supply; sewerage,
waste management and
remediation activities 103.3 102.8 102.6 102.0 101.1 101.0 100.3
Prices of construction and
assembly production 100.3 100.4 100.5 101.2 101.7 101.9 100.5
Among the manufacturing divisions, the prices increased significantly, among others in manufacture
of basic metals (by 3.7%), beverages (by 2.3%), paper and paper products (by 2.1%) and of other non-
-metallic mineral products (by 1.2%). Higher than in the previous year were also prices in manufacture
of chemicals and chemical products and electrical equipment (by 1.1% each), vehicles, trailers and semi-
-trailers (by 1.0%) as well as of products of wood, cork, straw and wicker (by 0.7%). The prices of metal
products (by 0.5%), furniture (by 0.4%), machinery and equipment (by 0.3%) as well as rubber and plastic
products (by 0.1%) also went up, to a lesser extent. However, a decline was observed in among others,
the prices of: manufacture of computer, electronic and optical products (of 0.4%), food products
(of 0.5%) and also coke and refined petroleum products (of 0.8%). The prices in the manufacture of other
transport equipment also decreased (by 1.4%)
In the 1st quarter of 2018, the prices of construction and assembly production increased by 1.7%
compared to the corresponding period of the previous year. In March 2018, the prices of construction
and assembly production were by 1.9% higher than year before, and in comparison to December 2017,
they increased by 0.5%.
There was observed a growth of 1.5% of prices of consumer goods and services, in the 1st quarter of 2018,
in comparison to the corresponding period of the previous year (against a growth of 2.2% a year before,
respectively).
In March 2018, an increase in prices of consumer goods and services, in annual terms, amounted to
1.3% (of which prices of goods grew by 1.1%, and services – by 2.0%). The growth in the prices of food
and non-alcoholic beverages as well as goods and services related to dwelling had the greatest impact
on the level of the total price index, which influenced its increase by 0.90 percentage point
and 0.42 percentage point, respectively. Declines in the clothing and footwear prices as well as in
the prices of goods and services related to transport reduced the total price index by 0.20 percentage
point and 0.17 percentage point, respectively.
Prices of consumer goods and services, in March 2018, were similar to the ones recorded in December
2017 (against to a growth of 0.7% a year before). The prices of alcoholic beverages and tobacco increased
(by 0.8%), as well as food and non-alcoholic beverages and goods and services in the scope of restaurants
and hotels (0.7% each). The growth of prices was also noted in goods and services related to health (0.6%),
recreation and culture, and education (0.4% each), as well as dwelling (0.2%). However, the consumers
paid less for clothing and footwear (3.1%), goods and services related to transport (1.9%) and commu-
nication (1.2%) than in December 2017. The increase in prices of food and non-alcoholic beverages had
the greatest impact on the consumer price index, which raised the total price index by 0.18 percentage
16PRICES
point. Declines in the prices of clothing and footwear as well as goods and services in the field of transport
reduced the total price index by 0.17 percentage point, and 0.16 percentage point, respectively.
The increase in prices of food and non-alcoholic beverages, in March 2018 compared to December 2017,
amounted to 0.7%, of which food prices grew by 0.7% and non-alcoholic beverages – by 1.2%. More than
in December 2017, consumers paid for, among others, fruit (by 8.4%), vegetables (by 2.2%), wheat flour,
groats and cereals and bread (1.4% each), as well as rice (1.2%). The prices of fish and seafood (by 0.9%),
pasta products and couscous (by 0.5%) as well as meat (on average by 0.1%) also increased, of which
the highest growth was observed in the price of poultry meat – of 1.8%. In turn, the prices of sugar
(by 14.5%), oil and fats (by 3.2%, including butter prices decreased by 6.3%), as well as articles in the group
"milk, cheese and eggs" (on average, by 1.3%) dropped.
Clothing and footwear prices were still lower than in December 2017 (by 2.9% and 3.7%, respectively).
Prices associated with dwelling increased by 0.2% compared to December 2017. The charges for refuse
collection, sewage collection and water supply were also increased (by 2.6%, 0.6% and 0.3%, respec-
tively). The prices of electricity, gas and other fuels were reduced (by 0.4% on average), of which gas
(by 2.1%) and liquid and solid fuels – by 0.2%. Electricity prices were not changed; however, the prices
of heat energy rose (by 0.3%). The prices related to furnishings, household equipment and routine house-
hold maintenance also increased to the similar extent (by 0.3%).
Articles and services connected with health were more expensive than in December 2017 (increase
of 0.6%). Fees for dental (by 1.6%), medical (by 1.3%) and hospital and sanatorium services (by 1.1%) were
raised. Prices of pharmaceutical products increased slightly (by 0.1%).
Prices of goods and services related to transport decreased by 1.9% compared to December 2017. A drop
in prices of fuels and lubricants for personal transport equipment was observed (on average, of 1.6%,
of which liquid gas 5.8% cheaper, petrol –1.3%, and diesel oil – 1.0%) as well as prices of motor cars
by 1.1%. The consumers also paid less for transport services (8.0%) in comparison to December 2017.
Table 6. Price indices of consumer goods and services
2016 2017
Q1 Q2 Q3 Q4 Q1 MAR
Specification
DEC
corresponding period of previous year=100
2017=100
Total 102.0 101.8 101.9 102.2 101.5 101.3 100.0
Food and non-alcoholic
beverages 103.4 103.4 104.6 105.6 103.9 103.7 100.7
Alcoholic beverages and
tobacco 101.1 100.8 101.0 100.9 101.1 100.9 100.8
Clothing and footwear 94.5 94.7 94.7 95.3 95.9 96.3 96.9
Dwelling 101.1 101.5 101.6 102.1 101.7 101.6 100.2
Health 100.9 100.6 101.3 101.9 101.7 101.4 100.6
Transport 109.8 104.2 100.9 100.6 98.3 98.1 98.1
Communication 98.8 100.9 101.5 101.5 101.1 100.6 98.8
Recreation and culture 99.7 102.3 102.0 101.6 101.7 101.0 100.4
Education 100.8 100.9 101.1 101.8 102.1 102.2 100.4
Restaurants and hotels 101.9 102.0 102.3 102.7 102.9 102.9 100.7
Miscellaneous goods and
services 103.3 102.6 101.9 100.9 99.8 99.6 99.6
17PRICES
The prices of communication goods and services were by 1.2% lower than in December 2017. The prices
of bundled telecommunication services increased (by 0.9%). The cost of postal services was also higher
(by 0.4%). In turn, the mobile telephony services charges decreased by 2.7% and internet access provision
services by 0.1%.
Prices connected with recreation and culture, in March 2018, were higher than in December of the
previous year (growth of 0.4%). The prices of newspapers and periodicals increased (by 2.1%) as well as the
prices of tickets for cinemas, theaters and concert halls (by 0.6%). However, the decrease was observed in
the prices of audio-visual, photographic and information processing equipment (1.9%), package holiday
(0.7%) and books prices (0.6%).
There was an increase in prices of consumer goods and services calculated using the moving average
method, in the period April 2017 – March 2018, in comparison with the previous twelve months and it
amounted to 1.9% (against growth of 2.0% in March 2017 – February 2018). Consumer prices according to
the Harmonized Index of Consumer Prices (HICP)1 increased by 1.4% in the reference period.
1 The Harmonized Index of Consumer Prices (HICP) is computed according to the unified methodology of the European
Union. The basis of compiling the HICP for Poland constitutes an observation of prices of representatives of consumer goods
and services and the weights system based on the structure of consumption in the households sector (in 2018 – the structure
of consumption from 2016 in prices from December 2017). Grouping of consumer goods and services is presented on the
basis of the European Classification of Individual Consumption by Purpose (ECOICOP).
18Agriculture
On the agricultural market, in the 1st quarter 2018, the average procurement prices of most of the major
agricultural products were higher than a year before. Only the procurement prices of wheat, potatoes
and pigs were lower.
Table 7. Procurement of cerealsa
JUL 2017 – MAR 2018
Specification the share of procure-
JUL 2016 –
in thous. tonnes ment harvests in %
–MAR 2017=100
in 2017
Cereal grainsb 8156.5 99.8 29.4
of which:
Wheat 5895.5 96.6 50.5
Rye 724.5 117.4 27.1
a Without the procurement realised by natural persons. b Basic cereals including cereal mixed and excluding cereals
designated for sowing.
Chart 6. Average procurement prices of cereal grain and average marketplace prices of potatoes
PLN per 1 dt
120
100
80
60
40
20
0
OCT
OCT
JUN
SEP
JUL
NOV
JUN
SEP
AUG
JUL
NOV
AUG
FEB
APR
DEC
FEB
APR
DEC
FEB
JAN
MAR
MAY
JAN
MAR
MAY
JAN
MAR
2016 2017 2018
wheat rye potatoes
19AGRICULTURE
Table 8. Procurement of basic animal productsa
JAN–MAR 2018
Specification
in thousand tonnes JAN–MAR 2017=100
Animals for slaughterb 924.4 109.3
of which:
cattle (with calves) 57.0 105.4
pigs 328.9 111.0
poultry 537.8 108.8
Milkc 2827.1c 103.0
a Excluding procurement accomplished by natural persons. b It comprises cattle, calves, pigs, sheep, horses, and poultry, converted
into meat, including fats in post-slaughter warm weight. c In millions of litres.
Since the beginning of this season, i.e. since July 2017 until March 2018, the procurement of basic cereals
(with cereal mixed excluding sowing seed) amounted to 8156.5 thous. tonnes and stood at a level close
(by 0.2% lower) to the one observed a year before. The procurement of basic cereals constituted 29.4%
of the production of 2017 (compared to 23.8% a year before).
In the 1st quarter of 2018, as a result of increased national supply of major species of animals,
the total procurement of animal for slaughter (in warm post-slaughter weight) was by 9.3% higher than
in the corresponding period of the previous year and amounted to 924.4 thous. tonnes.
Seasonal changes in prices of cereals were minor. The average procurement prices of wheat did not signi-
ficantly change in comparison with the corresponding period of the previous year (declined by 0.4%);
however, the procurement prices of rye increased (by 1.9%). In marketplace turnover, the prices of basic
types of cereals were higher than in the 1st quarter of the previous year.
On the pig market, in the 1st quarter of 2018, the average procurement prices were by 9.6% lower, and
on marketplaces – similar to the ones observed a year before. In March 2018, the relation of procurement
prices of pigs to the marketplace prices of rye was 7.1 (compared to 8.2 a year before). The average price
of piglets for further breeding in marketplace turnover was by 10.2% higher in the 1st quarter 2018 than
in the corresponding period of the previous year.
Table 9. Average prices of major agricultural products
Procurement prices Marketplace prices
JAN–MAR 2018 JAN–MAR 2018
Specification
JAN–MAR JAN–MAR
in zl in zl
2017=100 2017=100
Wheata – per dt 66.70 99.6 80.84 106.9
Ryea – per dt 57.69 101.9 65.41 109.0
Potatoesb – per dt 53.34 89.2 87.03 105.2
Animals for slaughter (in live weight) – per kg:
of which:
cattlec (excluding calves) 6.46 103.7 7.04 101.3
of which young cattle 6.63 103.0 7.38 101.0
pigs 4.44 90.4 4.82 100.0
poultry 3.59 102.3 . x
Piglet – per head . x 188.45 110.2
Milk per hl 137.21 103.9 . x
a In procurement; excluding cereals designated for sowing. b On marketplace – edible. c On marketplace – average weighted price
of cattle for slaughter calculated with the adoption of the structure of procurement quantity of young cattle and cows for slaughter.
20AGRICULTURE
The average procurement prices of poultry for slaughter were by 2.3% higher in the 1st quarter of 2018
than a year before.
The average prices of cattle and young cattle for slaughter stood on both markets at a level higher than
in the previous year (in procurement – by 3.7% and 3.0%, respectively, and on marketplaces – by 1.3%
and 1.0%, respectively).
The prices of milk, in the 1st quarter of 2018, despite an increased supply (of 3.0%), were higher than
a year before (by 3.9%). In marketplace turnover, the average price of a dairy cow (approx. PLN 2995)
stood at the level of the previous year, and the price of a one-year heifer (approx. PLN 2160) was by 10.8%
lower than a year before.
Chart 7. Average procurement prices of animals for slaughter and of milk
PLN per 1 kg PLN per 1 l
8,00 1,60
7,00 1,40
6,00 1,20
5,00 1,00
4,00 0,80
3,00 0,60
2,00 0,40
1,00 0,20
0,00 0,00
OCT
OCT
JUN
SEP
JUL
NOV
JUN
SEP
AUG
JUL
NOV
AUG
FEB
APR
DEC
FEB
APR
DEC
FEB
JAN
MAR
MAY
JAN
MAR
MAY
JAN
MAR
2016 2017 2018
cattle pigs poultry milk (right scale)
The relations of retail prices of the majority of the selected means of production to the procurement
prices of rye in the 1st quarter 2018 were better than in the 4th quarter of the previous year. However,
a significant deterioration of the relation of prices of means of production to the procurement prices of
pigs and milk was observed.
21Industry
In the 1st quarter of 2018, the sold production of industry1 was by 5.6% higher than a year before
(compared to the increase of 7.3% in the corresponding period of the previous year and of 8.5%
in the 4th quarter of the previous year).
Chart 8. Sold production of industry (constant prices)
monthly average of 2015=100
125
120
115
110
105
100
95
90
FEB
AUG
FEB
OCT
AUG
FEB
JAN
MAR
MAY
MAR
MAY
OCT
JUN
JAN
JUN
JAN
MAR
APR
JUL
DEC
NOV
APR
JUL
DEC
NOV
SEP
SEP
2016 2017 2018
seasonally unadjusted production trend
In the period of January–March 2018, there was an increase, in annual terms, of sales in the section with
the greatest share in the sold production of industry in total – in manufacturing (of 5.5%), as well as
in electricity, gas, steam and air conditioning supply (of 9.2%), and also in water supply; sewerage, waste
management and remediation activities (of 2.4%). However, the decline in sales in mining and quarrying
has been maintained (1.8%).
In the period of January–March 2018, the production in all main industrial groupings was higher than
a year before. The production of energy increased by 9.7%, of intermediate goods and of durable
consumer goods – each by 6.5%, of non-durable consumer goods – by 3.5% and capital goods – by 2.3%.
Labour productivity in industry, measured by sold production of industry per one paid employee,
in the 1st quarter of 2018, was by 2.8% higher than a year before, with an increase of 2.7% in average paid
employment and of 6.7% – in average monthly gross wages and salary.
1 At constant prices; in enterprises employing more than 9 persons.
22INDUSTRY
Table 10. The dynamics (at constant prices) and the structure (at current prices)
2017 2018 2017
Wyszczególnienie
JAN–MAR APR–JUN JUL–SEP OCT–DEC JAN–MAR
Specification
corresponding period of previous year=100 structure in %
Total 107.3 104.2 106.4 108.5 105.5 100.0 100.0
Mining and quarrying 96.7 94.5 88.3 92.4 98.2 3.2 3.5
Manufacturing 108.2 104.4 107.1 109.8 105.5 86.3 86.2
Electricity, gas, steam and air
conditioning supply 103.7 107.5 108.8 103.3 109.3 8.3 8.1
Water supply; sewerage, waste
management and remediation
activities 104.9 103.7 102.4 101.8 102.4 2.2 2.2
In the 1st quarter of 2018, an increase in sold production, in annual terms, was recorded in 26 (out of 34)
divisions of industry, whose share accounted for 79.3% of sold production of industry in total.
Out of 283 industrial products and industrial product groups observed in the three months of 2018,
the production of 160 of them was higher than a year before. The production of 123 products and product
groups was lower than a year before.
Table 11. Indices (at constant prices) and structure (at current prices) of sold production of industrya
2017 2018 2017
Specification JAN–MAR APR–JUN JUL–SEP OCT–DEC JAN–MAR
corresponding period of the previous year=100 structure in %
Industry 107.3 104.2 106.4 108.5 105.5 100.0 100.0
of which:
Mining of coal and lignite 92.1 88.5 77.7 84.4 100.2 1.7 1.8
Manufacture of food products 108.1 105.6 106.7 106.4 106.4 16.2 16.1
Manufacture of beverages 98.6 105.2 99.2 105.7 102.5 1.2 1.2
Manufacture of wearing apparel 104.1 96.7 97.7 113.7 97.5 0.5 0.6
Manufacture of products of wood,
cork, straw and wicker 108.4 103.1 104.8 108.9 107.3 2.7 2.6
Manufacture of paper and paper
products 106.0 103.1 109.5 110.2 110.7 3.3 3.0
Manufacture of coke and refined
petroleum products 97.2 97.4 102.3 109.7 114.3 5.1 4.7
Manufacture of chemicals and che-
mical products 106.5 101.7 106.8 103.3 99.5 4.5 4.8
Manufacture of pharmaceutical
products 106.3 94.7 96.4 119.8 79.9 0.8 1.1
Manufacture of rubber and plastic
products 110.3 105.0 110.2 112.9 105.2 6.5 6.5
Manufacture of other non-metallic
mineral products 110.7 105.2 105.0 113.2 108.1 3.5 3.4
Manufacture of basic metals 111.1 108.4 113.2 113.6 105.7 4.4 4.2
Manufacture of metal products 112.4 107.9 108.9 113.6 112.0 6.9 6.5
a In enterprises employing more than 9 persons.
23INDUSTRY
Table 11. Indices (at constant prices) and structure (at current prices) of sold production of industrya (cont.)
2017 2018 2017
Specification JAN–MAR APR–JUN JUL–SEP OCT–DEC JAN–MAR
corresponding period of the previous year=100 structure in %
Manufacture of computer, electronic
and optical products 104.6 104.0 111.2 105.8 98.1 2.6 2.9
Manufacture of electrical equipment 101.9 104.1 109.8 106.4 109.5 4.2 4.1
Manufacture of machinery and
equipment n.e.c. 113.8 112.9 103.9 119.1 109.0 3.2 3.1
Manufacture of motor vehicles,
trailers and semitrailers 112.1 103.4 107.4 108.4 99.4 11.0 11.9
Manufacture of other transport
equipment 114.7 101.3 97.6 106.7 101.6 1.4 1.5
Manufacture of furniture 109.2 104.1 106.7 109.4 108.2 3.3 3.2
a In enterprises employing more than 9 persons.
In the 1st quarter of 2018, industrial entities2 obtained worse financial results than a year before. Financial
result from the sales of products, goods and materials decreased by 7.1% to PLN 24.6 bn, gross financial
result dropped by 9.7% to PLN 25.2 bn and net financial result - by 10.6% to PLN 20.8 bn. Less favourable
than a year before the net results were recorded in all sections: water supply; sewerage, waste manage-
ment and remediation activities – lower by 23.4%, mining and quarrying – by 16.5%, manufacturing –
by 11.9% and in electricity, gas, steam and air conditioning supply – by 3.6%. Among the sections of
manufacturing, worse than a year before net financial result was obtained, among others, in manufacture
of coke and refined petroleum products, motor vehicles, trailers and semi-trailers, chemicals and chemical
products, rubber and plastic products, metal products and furniture. On the other hand, an increase was
recorded in net financial results, among others, in manufacture of electronic equipment, basic metals and
food products.
Profitability rate from sales in industry in total got worse from 7.6% a year before to 6.8%. A worsening
was observed in gross turnover profitability rate (from 7.7% a year before to 7.3%) and in net turnover
profitability rate (from 6.4% to 5.6%). Cost level indicator increased from 92.3% to 93.3%. The financial
liquidity indicators were lower than a year before – of the first degree (34.5% against 35.8%) and of the
second degree (104.5% against 106.2%). The share of enterprises with net profit in the industrial enter-
prises in total decreased in annual terms (from 74.4% to 74.1%) and the share of their revenues in the total
revenues also went down (from 86.5% to 85.8%).
Investment outlays3 in industry, in the 1st quarter of 2018, amounted to PLN 13.3 bn and were by 4.6%
lower than in the corresponding period of the previous year (following a drop of 1.0% a year before).
A deep decrease of outlays was recorded in the section of electricity, gas, steam and air conditioning
supply, at an increase in outlays in the other sections.
2 Data concern economic entities keeping accounting ledgers and employing 50 persons and more.
3 Data on investment outlays and estimated value are provided in current prices.
24Construction
In the 1st quarter of 2018, the construction and assembly production1 performed domestically was
by 26.1% higher than in the corresponding period of the previous year (when an increase of 3.9% was
observed).
Chart 9. Construction and assembly production (constatnt prices)
monthly average of 2015=100
160
140
120
100
80
60
40
FEB
AUG
FEB
AUG
FEB
JAN
MAR
MAY
OCT
MAY
OCT
MAR
JUN
JAN
MAR
JUN
JAN
APR
JUL
DEC
NOV
APR
JUL
DEC
NOV
SEP
SEP
2016 2017 2018
seasonally unadjusted production trend
Table 12. Indices (at constant prices) and structure (at current prices) of construction and assembly
production
2016 2017 2016
Specification JAN–MAR JAN– JUN JAN–SEP JAN–DEC JAN–MAR
corresponding period of previous year = 100 structure in %
Total 103.9 107.6 112.9 112.1 126.1 100.0 100.0
construction work:
investments 102.2 107.4 113.6 113.7 126.5 65.9 65.7
repairs 107.2 107.9 111.7 109.4 125.4 34.1 34.3
Construction of buildings 106.7 103.6 107.8 107.5 123.6 39.8 40.5
Civil engineering 102.0 114.8 122.2 116.7 141.4 31.1 27.7
Specialised construction activities 102.1 104.9 108.1 111.1 115.9 29.1 31.8
1 At constant prices; in construction enterprises employing more than 9 persons.
25CONSTRUCTION
In the period of January–March 2018, the construction and assembly production increased in annual
terms in all construction divisions. In enterprises dealing mainly with the construction of buildings,
the production increased by 23.6%. A high growth was observed in entities specialising in the develop-
ment of building projects (of 52.1%), and the sales in entities performing mainly construction of residen-
tial and non-residential buildings increased to a lesser extent (by 20.6%).
In entities specialising in the construction of civil engineering, the production was by 41.4% higher than
in the period of January–March 2017, which was mostly influenced by a high increase in sales of works
in enterprises dealing mainly with the construction of roads and railways (of 62.0%). A growth in produc-
tion was also observed in entities specialising in construction of other civil engineering projects n.e.c.
(by 29.8%) and in works connected with the construction of utility projects (by 10.3%).
In the division of specialised construction activities, the construction and assembly production was
by 15.9% higher than in the 1st quarter of the previous year, and it increased to the greatest extent in
entities dealing mainly in the demolition and site preparation (by 43.6%). An increase was also observed
in entities dealing mainly building completion and finishing (of 27.1%), remaining other specialised
construction activities (of 12.8%), as well as electrical, plumbing and other construction installation
(of 11.6%).
In the structure of construction and assembly production in total by types of constructions, the share of civil
engineering works increased in annual terms in the 1st quarter of 2018, and the share of railways, suspen-
sion and elevated railways, and highways, streets and roads was higher than a year before, and among
others, that of complex constructions on industrial sites was lower. The share of buildings in the produc-
tion in total decreased and there was a decline in the share on residential buildings at the same time with
a minor increase in the share of non-residential buildings.
Table 13. Structure (at current prices) of construction and assembly production by types of constructions
Structure in %
Types of constructions
Q1 2017 Q1 2018
Grand total 100.0 100.0
Buildings in total 62.5 61.0
residential buildings 21.9 20.2
of which:
one-dwelling buildings 2.7 2.0
two- and more dwelling buildings 17.7 17.4
non-residential buildings 40.6 40.8
of which:
office buildings 5.1 5.5
wholesale and retail trade buildings 9.2 8.0
industrial buildings and warehouses 17.2 17.6
buildings for public entertainment, education, hospital or institutional care 6.0 6.7
Civil engineering works 37.5 39.0
of which:
highways, streets and roads 9.8 10.8
railways, suspension and elevated railways 2.5 4.0
bridges, elevated highways, tunnels and subways 2.4 2.5
harbours, waterways, dams and other waterworks 0.9 0.8
long-distance pipelines, communication and electricity lines 5.6 5.3
local pipelines and cables 6.3 6.8
of which waste water treatment plants 0.6 1.3
complex constructions on industrial sites 8.0 6.9
sports and recreation structures 0.7 0.8
other civil engineering works n.e.c. 1.2 1.0
26CONSTRUCTION
In the 1st quarter of 2018, financial situation of enterprises2 conducting activity in the scope of construc-
tion was better than in the corresponding period of 2017. The enterprises achieved positive gross and net
financial results against the negative results a year before, which was affected by an improvement in the
entities specialising in civil engineering. In the entities mainly dealing with construction of buildings and
specialised construction activities, the net and gross financial results were lower than in the 1st quarter
of the previous year. Profitability rate from sales in construction in total increased from minus 1.1% to
0.7%. An improvement was observed in gross turnover profitability rate from minus 0.4% to 1.4% and
net turnover profitability rate from minus 1.1% to 0.8%. Total cost level indicator grew to 98.6% from
100.4% a year before. A decrease was recorded in financial liquidity indicators: of the first degree – from
53.8% to 40.8% and of the second degree – from 120.1% to 108.4%. The share of entities with net profit
in the surveyed construction entities in total was higher than in the 1st quarter of the previous year
(it amounted to 53.7% against 49.4% a year before) and the share of their revenues in the revenues of all
construction entities (71.9% against 68.0%).
Investment outlays3 in construction, in the 1st quarter of 2018, were by 16.1% higher than in the corre-
sponding period of the previous year (after a drop by 4.2% a year before).
In the 1st quarter of 2018, more dwellings were completed than a year before. The number of dwellings
for which permits have been granted or which have been registered with a construction project was
higher. There were also more dwellings in which construction has begun.
Chart 10. Dwellings completed
in thous.
80
70
60
50
40
30
20
10
0
Q1 Q2 Q3 Q4 Q1 Q2 Q3 Q4 Q1
2016 2017 2018
dwellings completed
dwellings in which construction has begun
dwellings for which permits have been granted or which have been registered with a construction project
2 Data concern economic entities keeping accounting ledgers and employing 50 persons and more.
3 Data on investment outlays and estimated value are provided in current prices.
27You can also read