Take the Q Train: Value Capture of Public Infrastructure Projects - Hoover Institution
←
→
Page content transcription
If your browser does not render page correctly, please read the page content below
Take the Q Train: Value Capture of Public
                            Infrastructure Projects ∗
  Arpit Gupta †           Constantine Kontokosta ‡                  Stijn Van Nieuwerburgh §

                                           May 16, 2019

                                                Abstract

      We analyze the impact of the Second Avenue Subway (Q-train) construction on local
      real estate prices, which capitalize the benefits of transit spillovers. We find evidence
      of higher real estate prices in the vicinity of areas served by the new Q-train, relative
      to other areas in Manhattan’s Upper East Side. Only 30% of the private value created
      by the subway leads is captured through property taxes, and is insufficient to cover
      the cost of the subway. Value capture through targeted property tax increases can help
      close the funding gap.

          Keywords: Public Finance, Land Value Taxation, Urban Development, Value Cap-
      ture

  ∗ We gratefully acknowledge support from the Lincoln Institute, as well as conference participants at the
CREFR Spring Conference, and the PREA Institute Conference in NYC. We thank Yuan Lai and Michael
Leahy for superb research assistance.
   † Department of Finance, Stern School of Business, New York University, 44 W. 4th St, New York, NY
10027, arpit.gupta@stern.nyu.edu.
   ‡ Marron Institute for Urban Management, New York University, 60 5th Ave, 2nd Floor, New York, NY
10011, ck2218@nyu.edu.
   § Department of Finance, Graduate School of Business, Columbia University, Uris Hall 809, 3022 Broad-
way, New York, NY 10027; NBER; CEPR; svnieuwe@gsb.columbia.edu.

                                                    1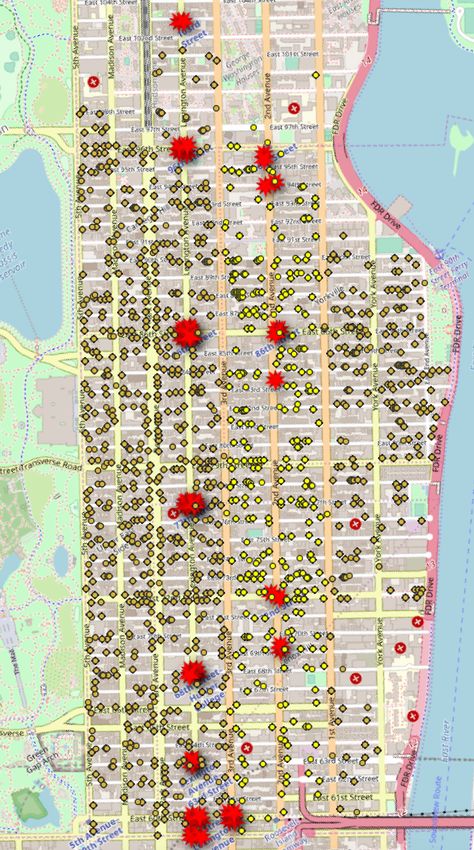
1    Introduction
The growth in major urban centers generates demand for infrastructure improvements,
an important component of which is public transport infrastructure. However, the costs
of building these urban public transportation improvements is high in the United States.
Subway investments, which offer the prospect of carrying the most passengers in the
densest locations, carry particularly large costs. Recent extensions of the 7 and the Q
subway lines in New York City cost about $2.5 billion per mile of construction. These
high costs make it essential to measure the benefits of additional subway construction in
order to assess whether this construction is worthwhile.
    Prior literature has documented several potential benefits of subway construction
projects like the 2nd Avenue Subway (or Q-train), on which we focus our analysis. This
line can be expected to improve access to workplaces and amenities due to shorter com-
muting times (Kahn and Baum-Snow, 2000, 2005; Severen, 2018). Improvements in com-
muting times itself can boost labor force participation, particularly among women (Black,
Kolesnikova, and Taylor, 2014). Additionally, the reduced traffic congestion on roads
and other public bus transportation lines can be expected to reduce pollution (Ander-
son, 2014). In our context, congestion on the 4-5-6 subway line which runs parallel to the
newly constructed Q line can be expected to improve. Other associated benefits of transit
linkages include less drunk driving (Jackson and Owens, 2011), improved retail, as well
as noise and crime reductions around stations (Bowes and Ihlanfeldt, 2001). However,
these diffuse and varied benefits are difficult to quantify, and so complicate a straight-
forward cost-benefit calculation. The public return to infrastructure investment, defined
narrowly as the user fees net of operational expenditures and more broadly to include the
incremental property, sales, and labor income tax revenues, captures only a part of the to-
tal benefit of infrastructure investment because it ignores these positive externalities the
infrastructure generates for the private sector. A failure to appropriately account for these
benefits will result in important infrastructure investments remaining unfunded.
    Our analysis provides an alternate measure to assess the benefits of infrastructure im-
provements. We take the approach that real estate values in the vicinity of public trans-
portation hubs capitalize the present value of all future benefits that accrue to households
and business from transportation gains. To perform this calculation, we must measure
how residential and commercial real estate asset values change after the extension of pub-
lic transportation.
    We focus on the 2nd Avenue Subway construction as it represents the most substan-
tial investment in public subway infrastructure in the United States in the past several

                                             2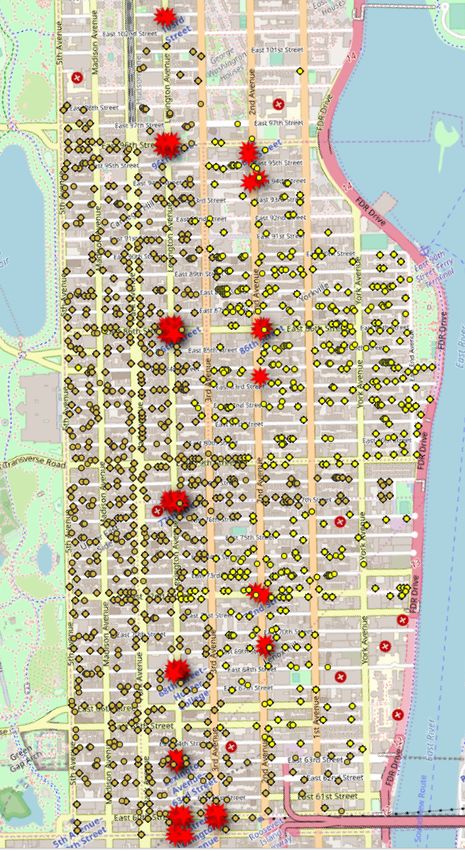
decades. We define geographical areas that are “treated” by the subway extension in
three ways. Our baseline treatment definition considers the 2nd Avenue corridor. The
second treatment is defined as the area within a 0.3 mile walking distance from one of
the three new subway stops that were added as part of the expansion. The third treat-
ment definition considers buildings whose distance to the nearest subway station on any
subway line is reduced after the opening of the new 2nd Avenue subway stations. We
compare the changes in real estate values in the treated areas with the changes in corre-
sponding control areas on the Upper East Side in a difference-in-difference setup. Our
analysis in the time-series accounts for both anticipatory effects of the construction, as
well as the possible negative disamenities resulting from the construction process itself.
   Our key result is that we find evidence that the construction of the 2nd Avenue Sub-
way has had any measurable improvements in real estate values. Our benchmark difference-
in-difference specification estimates a 10.8% increase in prices when comparing the ten
years before 2013 to the 6 years after along the avenue corridor of the subway itself. Since
the subway opened in 2017, this allows for substantial anticipation effects. Allowing for
six additional years of anticipation effects during the construction phrase raises the es-
timate to 14.9%. We also estimate specifications which control more finely for building
amenity effects through the use of building fixed effects or unit-specific characteristics
through a repeat-sales approach. Though smaller, at 2–6% price increases, these estimates
still suggest substantial value creation in the area around subway construction.
   A key challenge with out identification approach is to identify the relevant set of prop-
erties which are potentially affected by the subway construction. Our baseline approach
selects all properties between 59th street and 100th street, and between First and Third Av-
enues (the “2nd Avenue corridor”) in comparison with all other properties on the Upper
East Side. We conduct several robustness tests on our treatment definition, and find very
comparable results. One alternate approach identifies the treatment area on the basis of
walking distance to the new subway stops, using a 0.3mi walking distance limit to iden-
tify treated properties. This approach yields very comparable results, of price impacts
between 4–8%. Another treatment definition focuses on the change in walking distance
as a result of the subway construction, and so identifies several properties that are dis-
tant from the subway itself but experienced a gain in walking times. This definition, too,
yields similar price effects of between 3–9%.
   While our estimates are consistent with prior literature, as documented in the follow-
ing section, we emphasize that these results suggest that a considerable component of the
public investment in the subway system have accrued to private landlords and owners.
To the extent that the property tax system is able to recoup some of these expenses, this

                                             3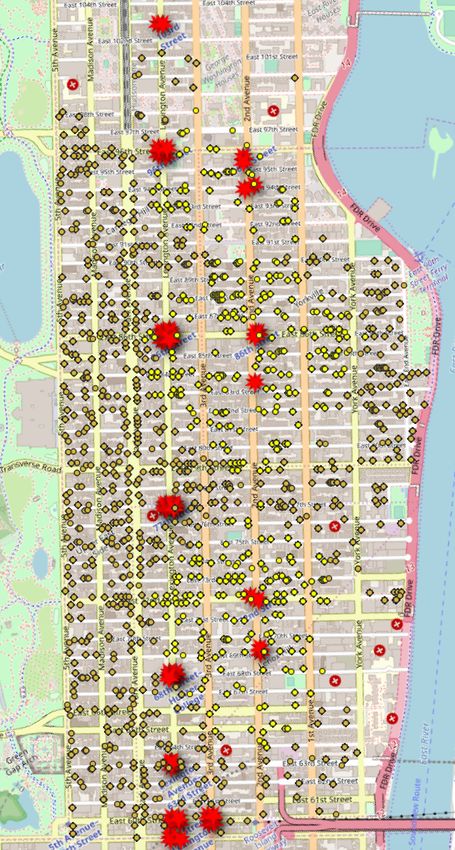
provides a natural mechanism for local governments to finance these investments. How-
ever, there are good reasons to think that existing property tax systems will be incomplete.
We show that the New York City property tax code only recuperates about 30% of market
value increase in present value. As a result; though the subway itself generated more
value than the already quite high cost of construction—this value is largely accruing to
private landowners, rather than the city government.
    This motivates the possibility for additional value capture taxes which may help re-
coup an additional component of the investment cost, and thereby make possible addi-
tional public infrastructure investments. Our findings, therefore, are quite policy relevant
given ongoing debates in New York City on the future extension of the 2nd Avenue Sub-
way line, the repair of the L line, and the East Side access. They also have ramifications
for the broader debate on how to finance an upgrade to U.S. infrastructure assets and how
to provide new infrastructure in developing countries whose governments have limited
borrowing and taxation capacities. Given that infrastructure projects entail enormous ex-
penditures of public resources, it is essential to have a full accounting of the total benefits
resulting from these infrastructure expansions, which our work helps to provide.

2    Literature Review
Bom and Ligthart (2014) conduct a meta-regression analysis, summarizing decades of re-
search measuring the effects of public infrastructure spending on economic output. The
authors find that on average for the United States, a 1% increase in the public capital stock
(about $134 billion in 2015) would increase private-sector economic output by 0.03% in the
short term ($12.7 billion) and by 0.12% in the long term ($18.7 billion). The Congressional
Budget Office estimates the effect of the same-size expansion at 0.06% ($9.2 billion). The
literature finds a wide range of estimates for the return on infrastructure investment, de-
pending on the assumptions made on the efficiency of an expansion of the public capital
stock, the strength of the crowd-out effect on private investment, and the timing vis--vis
the business cycle.
    The literature tends to find modest to strong increases in the value of residential estate
after the completion of transportation linkages. Recent studies have found price premi-
ums for real estate surrounding transit hubs of between 2% and as much as 45% for resi-
dential and between 8% and 40% for commercial properties. In a study of San Jose, Cali-
fornia, Cervero and Duncan (2002) find that commercial properties within 0.25-mile of a
station that was part of the regional commuter system achieved $25 per square foot rental

                                              4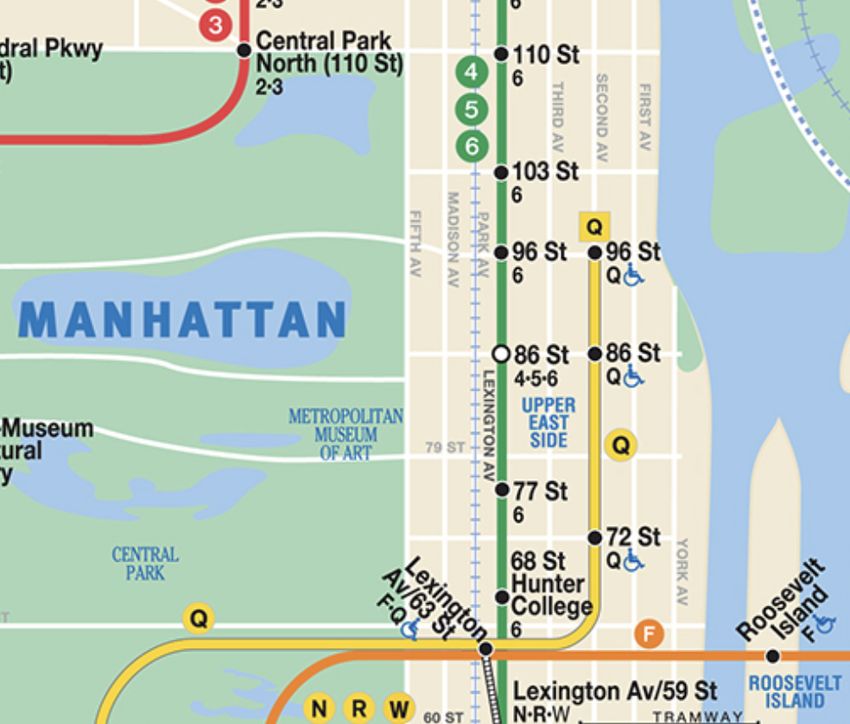
premiums. Hess and Almeida (2007) find a 2-5% premium, on average, for homes proxi-
mate to a light rail station in Buffalo, New York. Similar work in Chicago finds that prices
of residential properties closer to a new rapid transit line appreciated approximately 7%
more than properties further away during the period from 1986 to 1999 (McMillen and
McDonald, 2004). Earlier work on Chicago is by McDonald and Osuji (1995) and more
recent work by Diao, Leonard, and Sing (2017). The direct price effects of new subway
stations have also been studied for Toronto (Dewees, 1976), Taipei (Lin and Hwang, 2004),
and sixteen cities among which Atlanta, Boston, Chicago, Portland, and Washington DC
by Kahn and Baum-Snow (2005). Other papers have examined the impacts of subway
construction on the broader subway network. Fesselmeyer and Liu (2018) finds a 1.5-2%
increase in real estate prices around pre-existing subway lines in Singapore, compared
with 2-3.2% direct effects on the new lines.
    A few studies have identified negative relationships between distance to transit sta-
tions and prices, based on the assumption that negative externalities of transit stations
(e.g. crowding, noise, crime) are then reflected in lower relative real estate values (Bowes
and Ihlanfeldt, 2001; Pan and Zhang, 2008).
    Our paper is the first to study recent subway expansion in New York City. As argued,
this expansion was the most expensive per-mile expansion in U.S. transportation history.
The urban density and pre-existing transportation network make for a different and inter-
esting context, as does the interaction between the ownership market (condos and coops)
and the rental market.

3    Background
Elevated rail lines were formerly running on 2nd and 3rd Avenues in New York, as a
part of citywide system of “el” trains operated by privately managed and jointly funded
companies. This network was gradually replaced with underground subways. A pro-
posed 2nd Avenue Subway, in particular, was a major component of a proposed subway
expansion as a part of a fully publicly owned and operated managed entity, the Indepen-
dent Subway System (IND). Ultimately, the IND, along with two other private companies,
were combined and placed under government control. The elevated 2nd and 3rd Avenue
lines were torn down in anticipation of a new underground 2nd Avenue Subway. How-
ever, construction hit numerous difficulties across several decades, including the Great
Depression, World War II, and the NYC funding crisis in the 1970s.
    The most recent, and successful, period of construction on the 2nd Avenue Subway

                                               5
Figure 1: Time Line of Construction
is highlighted in Figure 1. MTA approval for the subway and funding for design and
engineering began in 2000, while a bond issue for its funding was approved in 2005. Cru-
cially, the Department of Transportation authorized funding for Phase 1 construction in
2006. This was followed by the beginning of construction in 2007. Construction of the
subway tunnel was completed in 2011. By 2013, it was clear that the end of construc-
tion was on the horizon and a Community Information Center was opened. The grand
opening of the subway was on January 1, 2017. The three new Q-line stops have been in
operation since that date.
Figure 2 highlights the subway line itself in the context of the local area. The Q line
runs for 8.5 miles, including the 1.8 mile stretch of the completed Phase 1 2nd Avenue
Subway extension between 59th Street and 96th Street. The construction included three
new subway stations on 2nd Avenue at 72nd Street, 86th Street, and 96th Street.
4 Empirical Specification
One key empirical challenge is that the value of real estate depends on a myriad of factors
beyond the opening of a new subway line. Other changes in the local economic environ-
ment may confound the effects from the transit improvements on real estate values. To
6Figure 2: Subway Map on the Upper East Side of Manhattan
address this challenge, we propose a differences-in-differences analysis, comparing val-
uations on the 2nd Avenue corridor before and after the subway extension, relative to
outcomes in a control group.
In our baseline specification, we define the treatment group to be all the land parcels
between 59th street and 100th street and between First Avenue and Third Avenue, taking
the midpoint of the avenues as the demarcation line. This is what we call the 2nd Avenue
corridor. Our control group consists of three corridors that make up the rest of the Upper
East Side. The Lexington Avenue corridor is the collection of parcels between 59th street
and 100th street and between Third and Park Avenues. The Madison Avenue corridor is
the collection of parcels between 59th street and 100th street and between Park and Fifth
Avenues. Finally, the York Avenue corridor is the collection of parcels between 59th street
and 100th street to the East of the midpoint of First Avenue. Because of the geography of
Manhattan, this is a smaller area.
This choice of baseline treatment and control group is driven by a trade-off between
minimizing the treatment effect on the control group and maximizing the similarity in
terms of common drivers of real estate valuations. By differencing out trends in real es-
tate values in the control group, we remove common drivers in real estate value that
affect the entire area (Upper East Side) and are left with the pure effects of the subway
7extension. The Lexington Avenue corridor is geographically the closest to the 2nd Av-
enue and may be affected the strongest by the neighborhood trends that affect real estate
valuation on 2nd Avenue other than the subway extension. However, the Lexington Av-
enue control group may also be directly affected by the subway extension. Residents in
the Lexington corridor benefit from the new subway line, either because it directly short-
ens their commutes or because it alleviates congestion on the 4-5-6 subway line, which
runs under Lexington avenue and parallel to the Q line. The resulting improvement in
transportation from the 2nd Avenue subway extension would support real estate values
in the Lexington Avenue corridor. Removing those effects would tend to bias downward
our estimate of the value created by the subway extension. A countervailing effect that
would tend to bias our treatment effects estimation upward is that the subway expansion
may have made 2nd Avenue more competitive in terms of attracting residential, retail,
and other commercial tenants away from Lexington Ave.
Residents living in the York Avenue corridor also potentially benefit from the Q line
extension. Indeed, for most of them, the new 2nd Avenue subway stations are the clos-
est ones. We consider York Avenue corridor residents to be in the control group in our
baseline specification because they are fairly far from the new subway stations, but study
different treatment definitions below where this group is part of the treatment group.
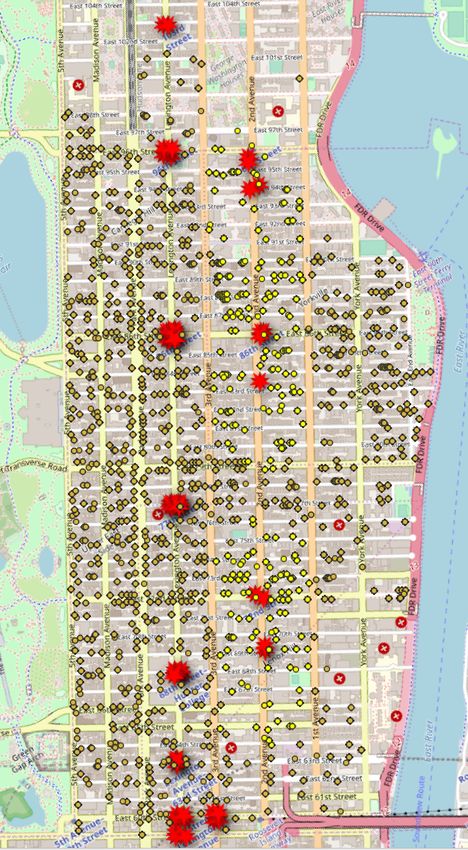
Figure 3 indicates the buildings where we have at least one apartment transaction in
our sample. Apartments in treated buildings are colored in bright yellow while buildings
in the control sample are in light yellow. The large stars indicate subway stations (and all
their entrances), including the three new stops on the 2nd Avenue subway.
A second important research design question is when to draw the demarcation line
between the before and after period. The subway went into operation on January 1st,
2017. While there was considerable uncertainty about the exact opening date until the
last minute, eventual project completion was long anticipated. Construction started in
April 2007. In 2011, the original 2013 completion date was pushed back to December 2016.
Tunnel excavation began in May 2010 and blasting concluded in March 2013. Forward-
looking developers and property owners willing to tolerate the inconvenience of the con-
struction project could capture some of the potential future benefits by acting prior to the
subway opening. These anticipatory effects may be reflected in real estate prices, which
are forward looking in that they reflect the discounted value of future rents. In our bench-
mark analysis, we strike a middle ground and take January 1st 2013 as the demarcation
line between the before and after. This allows for four years of anticipation effects prior
to the inauguration of the new subway line. A subway community information center
was opened in the middle of 2013, signaling that project completion itself was no longer
8Figure 3: Map of Baseline Treatment and Control
9in doubt. This choice also provides a large enough sample in the before and after period.
This specification can be expressed as:
ln(yit ) = α + γ1 · Treatmentit + δ1 · Postit + β 1 · Treatment × Postit + X it0 · θ + ε it
In which yit reflects the sale price of a unit i in period t in real terms. The key parameter
of interest is β 1 , which corresponds to the relative price increase on properties in the
treatment definition (for instance, the 2nd Avenue corridor), in the period 2013-2018.
To investigate the presence of additional anticipation effects, several empirical specifi-
cations split the “Pre” period into January 2003-December 2006 and January 2007-December
2012. We call the latter period the Construction Period. In those specifications, real estate
prices in the Construction and Post periods are estimated relative to the omitted 2003-06
period. This specification can be expressed as:
ln(yit ) = α + γ1 · Treatmentit + δ1 · Postit + β 1 · Treatment × Postit + X it0 · θ
+ δ2 · Construction Periodit + β 2 · Treatment × Construction Periodit + ε it
The additional parameter of interest is β 2 , which corresponds to the relative price
increase in the construction period (2007-12) relative to the earlier period (2003-06); which
is a period why may incorporate anticipatory price effects or disamenity effects resulting
from the construction itself.
The controls X include: indicators for condo and studio, the year built, number of
bedrooms, floor, walking distance to Grand Central, walking distance to Central Park; as
well as indicators if these variables are missing. In our repeat-sale specification, we subset
on transactions which have a prior sale, and include the log sale amount of the prior sale
as an additional covariate.
5 Data
For the purposes of our project, we build a new data set of all residential transactions on
New York City’s Upper East Side from January 2003 until March 2019. The two primary
data sources are the New York City deeds records and StreetEasy. The deeds records
have information on the the sale price, sale date, address, as well as a tax ID (the BBL
code). From StreetEasy we collect information on all past residential real estate sales on
the Upper East Side via web scraping. We add properties between 96th Street and 100th
Street, which StreetEasy considers to be part of East Harlem. We also eliminate properties
10that are above 100th Street along Fifth Avenue, which StreetEasy considers to be part of
the Upper East Side. StreetEasy has apartment unit and building characteristics, which
are absent in the deeds records.
We obtain the exact address of the building, latitude and longitude, apartment unit
name (e.g. 17A), the number of bedrooms, number of bathrooms, an indicator variable for
condo, an indicator variable of coop, an indicator variable for studio, the square footage of
the unit, the year of construction of the building, the transaction date, and the transaction
price. We infer the floor of the unit based on the apartment unit name. There is also a text
field describing the transaction in more detail.
We only use transactions of condo and co-op units. We eliminate transactions that are
commercial space, storage units, maid’s rooms, parking spots, garage based on the text
field. We eliminate units that have zero bathrooms and zero bedrooms but are not studios.
Importantly, we remove all “sales” which are neither reported as “sold” nor as “closing
registered.” Cross-checking against the deed records database indicates that these “sales”
are not sales but merely removed listings.
We express all transaction prices in real terms by scaling by the Consumer Price In-
dex based in December 2017. We then eliminate all transactions with a real price below
$100,000 and above $10 million. Transactions below $100,000 (in 2017 dollars) are unlikely
to be arms-length transactions for actual apartment units. Transactions above $10 million
are unlikely to be affected by the 2nd Avenue subway and will distort sample averages.
The final sample contains 51,770 transactions.
Table 1 illustrates basic summary statistics from our data. The top panel reports prop-
erties on the 2nd Avenue Corridor, which are treated according to our baseline treatment
area definition. The bottom panel reports properties in the baseline control group (Madi-
son Ave, Lexington Ave, and York Ave corridors). We have 20,813 sales in the treatment
group and 30,957 in the control group, so that 40.2% of transactions are treated observa-
tions.
The average property on 2nd Ave costs $1.11m, is about 1034 square feet large, costs
$1067 per sqft, has 1.5 bedrooms bathrooms, and is in a building that is 46 years old at the
time of transaction. The treatment group has 40% condos and 60% coops. Buildings in
the control group cost substantially more. The typical sale price is $1.86mi or $1,244 per
sqft, are 200 sqft larger, have 1.8 bedrooms and 1.8 bathrooms, and are older (59 years).
There is a smaller fraction of studios (7% vs. 12%), while the condo-coop breakdown tilts
more towards coops at 30%-70%.
Our difference-in-difference analysis accounts for the level differences in prices across
the two sets of properties. However, if there are changes over time in property charac-
11Table 1: Summary Statistics
Panel A: Treatment Group
N Mean St.Dev p1 p25 p50 p75 p99
saleprice 20813 1110000 1050000 190000 512000 767000 1300000 5660000
sqft 14009 1033.931 585.9456 392 670 857 1250 3141
ppsf 14009 1066.764 444.6545 333.6384 780.7929 978.4375 1284.618 2451.471
bedrooms 20793 1.473 1.006 0 1 1 2 4
bathrooms 20193 1.517 0.851 1 1 1 2 5
condo 20813 0.395 0.489 0 0 0 1 1
coop 20813 0.605 0.489 0 0 1 1 1
studio 20813 0.123 0.329 0 0 0 0 1
building age 20807 46.08 24.315 1 29 45 57 105
vintage2 20813 0.055 0.227 0 0 0 0 1
closest pre 20813 0.324 0.114 0.057 0.245 0.313 0.395 0.551
closest post 20813 0.184 0.084 0.007 0.115 0.186 0.247 0.364
dist change 20813 0.14 0.129 0 0.01 0.112 0.252 0.429
treat2 20813 0.805 0.396 0 1 1 1 1
treat3 20813 0.787 0.409 0 1 1 1 1
treat4 20813 0.726 0.446 0 0 1 1 1
Panel B: Control Group
N Mean St.Dev p1 p25 p50 p75 p99
saleprice 30957 1860000 1800000 204000 654000 1200000 2360000 8740000
sqft 16524 1269.866 811.7698 382 730 1052 1590.5 3920
ppsf 16524 1244.108 614.8637 322.5515 838.8815 1099.734 1474.1 3385.767
bedrooms 30918 1.882 1.094 0 1 2 2.431 5
bathrooms 30010 1.849 1.039 1 1 1.5 2.5 5
condo 30957 0.307 0.461 0 0 0 1 1
coop 30957 0.693 0.461 0 0 1 1 1
studio 30957 0.069 0.253 0 0 0 0 1
building age 30949 59.137 27.944 1 42 56 84 109
vintage2 30957 0.041 0.198 0 0 0 0 1
closest pre 30957 0.343 0.223 0.022 0.162 0.282 0.503 0.851
closest post 30957 0.265 0.143 0.022 0.158 0.245 0.357 0.603
dist change 30957 0.077 0.127 0 0 0 0.13 0.429
treat2 30957 0.22 0.414 0 0 0 0 1
treat3 30957 0.342 0.474 0 0 0 1 1
treat4 30957 0 0 0 0 0 0 0
teristics of transacted properties which differ between treatment and control group, then
that could affect the estimate of the subway extension. Therefore, our main specifications
will control for property characteristics. We focus on whether we observe convergence in
prices. If the value gap for the 2nd Avenue Corridor is driven by scarce access to public
transportation options, we expect price convergence after subway construction.
126 Results
6.1 Corridors: Baseline Treatment and Control
Table 2 highlights our main effects. Recall that our estimation follows a difference-in-
difference specification. The dependent variable is the natural log of the real sale price
for apartment units including condos and coops. The key independent variables are the
difference-in-difference interactions. The Post variable captures the price impact after
January 2013, and so accounts for any general time-series increase in price; relative to the
entire pre-period of January 2003-December 2012. Our specifications suggest that these
time trends are generally important. In column 1, for instance, the coefficient on Post is
0.0895, suggesting that the post-period is associated with log prices that are higher by
nearly 9% in real terms on average. This variable accounts for the general increase in
valuation of UES apartments. Comparably, the treatment coefficient captures the value
differential associated with being “On 2nd Avenue” in general. As discussed in the data
section, this effect is quite negative. Properties in the 2nd Avenue corridor generally
transact for 47% less than properties in the control group, i.e, in the rest of the Upper East
Side, without considering additional controls.
Table 2: Main Difference-in-Difference Results - Baseline Treatment Definition
(1) (2) (3) (4) (5)
VARIABLES Log Price Log Price Log Price Log Price Log Price
Post x On 2nd Ave 0.143*** 0.108*** 0.0480*** 0.149*** 0.0636***
(0.0151) (0.00976) (0.00852) (0.0115) (0.0102)
Constr. Period x On 2nd Ave 0.0844*** 0.0296***
(0.0117) (0.0102)
Post 0.0895*** 0.105*** 0.110*** 0.169*** 0.168***
(0.00965) (0.00624) (0.00538) (0.00739) (0.00642)
On 2nd Ave -0.470*** -0.236*** -0.278***
(0.00910) (0.00610) (0.00866)
Constr. Period 0.116*** 0.104***
(0.00739) (0.00643)
Observations 51,770 51,770 51,770 51,770 51,770
R-squared 0.068 0.612 0.738 0.617 0.741
Controls NO YES YES YES YES
Building FE NO NO YES NO YES
Notes: Post is an indicator variable for the period after January 1st 2013. Constr. Period is an indicator variable for the construction
period between January 1st 2007 and December 31, 2012. On 2nd Ave is an indicator variable for a unit located in the Second Avenue
Corridor as defined in the main text. Controls include: an indicator variable for a condo transaction; an indicator variable for a studio;
number of bedrooms; number of bathrooms; the floor of the building; the year of construction; distance to Central Park; distance to
Grand Central Terminal; as well as indicators if the control variables are missing. Standard errors in parentheses.
*** pOur key variable of interest is the interaction variable of Post × On 2nd Ave. This
captures the differential price impact of being on the 2nd Ave corridor after 2013, the
time period when subway completion was either imminent or achieved. This period
captures at least some of the anticipatory effects of subway completion on real estate
values, namely those between January 1st 2013 and subway opening on January 1st of
2017. It also contains the subsequent price effects in 2017, 2018, and the first quarter of
2019. The coefficient on the interaction term in column 1 suggests that the 2nd Avenue
Subway resulted in a statistically significant price rise of 14.3% for properties transacting
on the avenue. This number is in line with the estimates from the literature discussed
above and suggests that the construction of the subway was associated with a substantial
increase in value. In other words, we observe convergence in prices. Subway construction
closes nearly 1/3 of the gap in valuations between the 2nd Ave corridor and the rest of
the Upper East Side.
This treatment effect persists in column 2, in which we add a number of important con-
trols to account for the differences in property characteristics documented above. Con-
trols include an indicator variable for a condo transaction; an indicator variable for a
studio; number of bedrooms; number of bathrooms; the floor of the building; the year
of construction; distance to Central Park (an important recreational amenity); distance to
Grand Central Terminal (an important central business district); as well as indicators if
the control variables are missing. These control variables boost the R2 value from 6.8% in
column 1 to to 61.2% in column 2. The lower coefficient (in absolute value) of “On 2nd
Ave” indicates that about half of the unconditional difference in valuations between the
treatment and control group disappears once we control for characteristics. More impor-
tantly, the estimate of Post × On 2nd Ave remains large and precisely estimated at 10.8%.
It indicates even faster convergence of property prices than in column 1: nearly 1/2 of
the price difference between 2nd Ave properties and properties in the rest of the UES is
eliminated around the time of subway completion.
One possibility is that there are additional property characteristics beyond those in-
cluded in column 2, and unobserved to us, that matter for real estate values. If the preva-
lence or the valuation of such latent characteristics changes differentially for treatment
and control groups, then we could incorrectly attribute to the second avenue subway
construction what instead are compositional changes to the pool of units transacted. One
conservative way of dealing with this concern is to include building fixed effects. We es-
timate such a specification in column 3 of Table 2.1 This specification is comparing trans-
1 The coefficient on the treatment variable itself is not separately identified from the building fixed effects
so we drop it in the specifications with building fixed effects.
14actions in the same building. Our sample is dominated by transactions in large buildings;
92% of observations are in buildings that contain at least five transactions in the Pre and
at least five transactions in the Post period. Thus, we should have enough power to iden-
tify the building fixed effects accurately. Adding building fixed effects increases the R2
to 73.8%. After controlling for building fixed effects, property values are 4.8% higher on
second Avenue in the Post relative to the Pre period and relative to the control group. The
estimate is significant at the 1% level and economically large.
6.2 Additional Anticipation Effects
We consider the possibility of additional anticipation effects as far back as 2007 when the
decade-long subway construction endeavor first got under way. We include an indicator
variable “Constr. Period” which takes the value of 1 for transactions between January
2007 and December 2012, allowing for six more years of potential anticipation effects. This
being also the period of heaviest construction, it is plausible that this period experienced
a reduction in property values due to disamenities (noise, pollution, closure of retail)
related to the construction activity itself. The interaction effect of Constr Period × On 2nd
Ave estimates the net effect of additional anticipation and disamenities on prices in the
2nd Ave corridor, relative to the omitted category of 2003-06. The coefficient on Constr.
Period itself shows the price impact associated with this period in general, relative to the
omitted category of 2003-2006. Under this specification, the Post × On 2nd Ave coefficient
measures the price change between the period 2013-2019 and the earlier period 2003-2006
(rather than relative to 2003-2012 in columns 1 and 2).
Column 4 of Table 2 shows that the construction period was associated with a sub-
stantial increase in real estate values in general on the Upper East Side. Prices were 11.6%
higher in real terms in 2007-12 relative to 2003-06, after controlling for property character-
istics. Properties on the 2nd Ave corridor appreciated by 8.4% relative to properties in the
control group. The point estimate is statistically significant and demonstrates the pres-
ence of additional anticipation effects, strong enough to outweigh the disamenity effects
from construction.
In the Post period, properties on 2nd Ave are 14.9% more valuable than in 2003-06, rel-
ative to the control group. In sum, subway construction triggered an initial appreciation
of 8.4% in 2007-12 and a further appreciation of 6.5% (14.9%-8.4%) in 2013-2019.
Figure 4 illustrates this result graphically. It plots the coefficient estimates from a dy-
namic difference-in-differences specification, in which each calendar year is allowed to
have its own treatment effect. Breaking up the baseline treatment effect year-by-year sug-
15Figure 4: Dynamic Treatment Effects - Baseline Treatment
gests that we do not see an initial price effect in the years 2005–2007, our control period,
in the treatment corridor. We begin to see positive price coefficients in our construction
period of 2007–2012; and see even higher coefficients after the beginning of our “post”
period from 2013 onwards. The sharp rise in 2013, at which point a community center
was built and final construction seemed imminent, provides additional justification for
our decision to use this year as the cutoff for the post period. This dynamic analysis
further suggests that we see even higher estimates for 2017–2019, after the subway has
become fully functional. At this point, prices appear to have stabilized and suggest that
the market has largely priced in the subway construction impact.
In column 5 of Table 2, we add building fixed effects to the specification of column
4. The early anticipation effect is smaller at 3.0% but remains statistically different from
zero. However, property values in the Post period remain 6.4% higher than in the 2003-
06 period on 2nd avenue, compared to the control group. This is an economically and
statistically significant difference.
6.3 Repeat Sales
In Table 3, we perform a repeat-sales analysis. This commonly used approach in real
estate valuation compares the prices of properties with the previous price paid for the
same property. It has the virtue of holding all else constant about properties, with the
limitation that we are only able to analyze properties that do, in fact, repeatedly transact
16in this period. The analysis repeats the full-sample analysis on the subset of apartments
that transacts at least twice.2 In all, we have 17,810 repeat sales representing 34.4% of the
total number of transactions.
The repeat-sales results in a smaller estimate of the treatment effect. The main spec-
ification in column 2, with controls included, results in a 3.5% value creation estimate
from the subway extension, compared to a 10.8% effect for the full sample. Adding build-
ing fixed effects in column 3 lowers the point estimate on the interaction effect to 1.6%,
compared to 4.8% for all transactions.
In column 4 we add the log real sale price of the previous transaction of the same
unit, i.e., from the first leg of the repeat sale. The previous price helps control for apart-
ment unit or building characteristics not already included in the control variables. The
treatment effect attenuates further to 0.2% and is no longer significant. One explanation
for the attenuation after including the lagged price is that unobserved building or apart-
ment characteristics upwardly biased the treatment effect in column 2. Note however,
that these missing characteristics would have had to differentially impact valuations in
the treatment and control groups after 2013 relative to before 2013. For example, if there
are more swimming pools in buildings on 2nd Ave after 2013 than before 2013, but no
change in swimming pools for the control group, then the estimated relative value cre-
ation on 2nd Ave could be due to swimming pools rather than to the subway. This is
unlikely to be a concern for the repeat sales sample since we are effectively controlling for
any fixed characteristics such as swimming pools by looking at sales of the same unit in
the same pre-existing building. An alternative interpretation of the attenuation is that we
are over-controlling by including lagged prices. Lagged prices could (partially) incorpo-
rate the value created by the subway extension. We would then be attributing to missing
characteristics what is really a subway treatment effect. This concern is more severe the
more recent is the previous transaction. Given the evidence we found for early anticipa-
tion effects, even repeat-sale transactions where the prior transaction took place as early
as 2007 could suffer from the over-controlling problem.
Columns 5–7 revisit the breakdown of the Pre period into the (omitted) 2003-2006
and the construction period from 2007-2012. For this subsample of repeat sales, the early
anticipation effect may well be the net effect of a strongly negative disamenity effect and
2 When determining whether a transaction in our 2003-2019 data set is a repeat sale, we look for transac-
tions in StreetEasy before January 2003 to avoid additional selection on properties that transact twice within
the 2003-2019 time frame. Despite the limited data coverage prior to 2003, this results in several hundred
additional repeat sales. Also, if a property is the subject of two (or more) repeat sales, both (all) repeat-sales
transactions for which the second leg of the trade pair is in our sample period 2003–2019 enter the repeat
sales subsample.
17a modestly positive anticipation effect. The repeat-sale sample clearly suggests a stronger
role for disamenities related to construction in the 2007-2012 period. The interaction effect
Post x On 2nd Ave is 0.9% (insignificant) in column 5 and essentially zero in columns 6
and 7. In sum, relative prices for repeat sales on 2nd avenue fell from the baseline 2003-
2006 period to the 2007-12 period, and then recovered in the 2013-19 period to 2003-06
levels. The same concern of over-controlling applies to the analysis in columns 5–7.
The complement of the repeat-sales subsample, namely units that transact only once
in the sample, shows much stronger price gains from subway construction than the full
sample.
Table 3: Repeat Sales Subsample - Baseline Treatment Definition
(1) (2) (3) (4) (5) (6) (7)
VARIABLES Log Price Log Price Log Price Log Price Log Price Log Price Log Price
Post x On 2nd Ave -0.00353 0.0352*** 0.0159 0.00182 0.00971 -0.00694 -0.0188
(0.0223) (0.0128) (0.0113) (0.00951) (0.0179) (0.0164) (0.0133)
Constr. Period x On 2nd Ave -0.0327* -0.0295* -0.0337**
(0.0189) (0.0166) (0.0141)
Post 0.0386*** 0.111*** 0.111*** 0.0320*** 0.207*** 0.182*** -0.0176*
(0.0147) (0.00853) (0.00752) (0.00636) (0.0124) (0.0111) (0.00939)
On 2nd Ave -0.348*** -0.183*** -0.0530*** -0.158*** -0.0302***
(0.0157) (0.00915) (0.00687) (0.0155) (0.0116)
Constr. Period 0.135*** 0.0973*** -0.0663***
(0.0129) (0.0112) (0.00971)
Lagged Log Sale Price 0.587*** 0.600***
(0.00487) (0.00498)
Observations 17,810 17,810 17,810 17,810 17,810 17,810 17,810
R-squared 0.053 0.690 0.802 0.830 0.693 0.803 0.831
Controls NO YES YES YES YES YES YES
Building FE NO NO YES NO NO YES NO
Notes: Post is an indicator variable for the period after January 1st 2013. Constr. Period is an indicator variable for the construction
period between January 1st 2007 and December 31, 2012. On 2nd Ave is an indicator variable for a unit located in the Second Avenue
Corridor as defined in the main text. Control variables are the same as in Table 2. Standard errors are in parentheses.
*** pa 13.1% larger appreciation for units in newer buildings in the treatment area after sub-
way construction than for older buildings. The appreciation is 9.9% for older buildings
and 23.0% for newer buildings. The additional 13.1% is precisely estimated despite the
relatively small share of transactions in buildings built after 2003.
Table 4: Heterogeneous Treatment for New vs. Old Buildings
(1)
VARIABLES Log Price
Post x On 2nd Ave 0.0989***
(0.00987)
Post x On 2nd Ave x Vintage 2 0.131***
(0.0350)
Post x Vintage 2 -0.227***
(0.0293)
Post 0.114***
(0.00630)
On 2nd Ave -0.232***
(0.00606)
Vintage 2 0.381***
(0.0151)
Observations 51,770
R-squared 0.617
Controls YES
Building FE NO
Notes: “Vintage2” is an indicator variable which is 1 for units in buildings constructed in 2003 or later and zero otherwise. All other
variables are as in Table 2. Standard errors in parentheses. *** priod, followed by York Ave, Lex Ave, and Madison Ave. The null effect on Lexington Ave
suggests that the potential benefits from reducing congestion on the 4-5-6 line did not ma-
terialize, or were offset by increased by reductions in prices due to increased competition
in the real estate market on 2nd Ave.
Column 2 shows a strong 15.2% capital gain on 2nd Ave, relative to Madison Ave and
relative to the pre-construction era of 2003-06. The gain of 8.7% in the construction period
again underscores early anticipation effects. Lexington Ave shows no change in either
period, relative to Madison. In contrast, property prices on York Ave appreciate in the
2007-12 period relative to Madison Ave (3.7%). The area continued to improvement rela-
tive to Madison in the Post period so that prices caught up further (4.9%). This suggests
that York Ave may have been at least partially affected by the subway extension. We
study this possibility in detail below.
Table 5: Unpacking the Control Group
(1) (2)
VARIABLES Log Price Log Price
Post x On 2nd Ave 0.110*** 0.152***
(0.0141) (0.0165)
Post x On Lexington Ave -0.0125 -0.0245
(0.0156) (0.0184)
Post x On York Ave 0.0295* 0.0492***
(0.0158) (0.0186)
Constr. Period x On 2nd Ave 0.0874***
(0.0166)
Constr. Period x On Lexington Ave -0.0215
(0.0184)
Constr. Period x On York Ave 0.0373**
(0.0185)
Post 0.102*** 0.162***
(0.0119) (0.0141)
On 2nd Ave -0.534*** -0.574***
(0.0130) (0.0156)
On Lexington Ave -0.257*** -0.243***
(0.0105) (0.0144)
On York Ave -0.432*** -0.447***
(0.0185) (0.0207)
Constr. Period 0.110***
(0.0139)
Observations 51,770 51,770
R-squared 0.619 0.624
Controls YES YES
Building FE NO NO
Notes: “Post” is an indicator variable for the period after January 1st 2013. “Constr. Period” is an indicator variable for the construction
period between January 1st 2007 and December 31, 2012. “Within .3 Miles” is an indicator variable which is 1 for a transaction located
within 0.3 miles of one of the three new subway stations on the Second Avenue subway and 0 otherwise. Controls include: an
indicator variable for a condo transaction; an indicator variable for a studio; number of bedrooms; number of bathrooms; the floor of
the building; the year of construction; distance to Central Park; distance to Grand Central Terminal; as well as indicators if the control
variables are missing. Standard errors in parentheses.
*** p7 Alternative Treatment Definitions
7.1 Distance to New Stations
One drawback of our baseline definition of treatment is that we assume that all properties
along the 2nd Avenue Corridor are equally treated by new subway construction. This
may not be the case if areas far from the subway stops, along 2nd Ave, do not find much
of a benefit from using the new subway. To analyze this possibility, we consider a second
treatment definition which includes all properties which are within 0.3 miles of one of
the three new 2nd Avenue subway stops. Distance is defined by walking distance as
calculated by Google Maps.3 If these are the properties which benefit the most from the
subway construction, they should expect the greatest property price appreciation. But, it
is also possible that the disamenities during the construction period were greatest close
to the subway stops.
Table 1 refers to this alternative treatment definition as “treat2”. It shows that 51.7%
of the transactions on the 2nd Avenue corridor and 16.8% of the transactions in the Madi-
son, Lexington, and York Ave corridors fall within 0.3 miles of one of the new subway
stations. In other words, this treatment is strongly but not perfectly correlated with our
baseline treatment. Figure 5 shows the treated and control buildings. The 0.3-mile dis-
tance requirement draws diamond-shaped areas around the three new subway stations.
Table 6 revisits our main difference-in-differences estimation for this alternative treat-
ment definition. The structure of this table is identical to that of Table 2 for the baseline
treatment definition based on the corridors. In our favorite specifications in columns 2
and 3, we find a strongly positive and statistically significant increase in value due to the
subway for those properties that are within 0.3 miles of one of the three new Q-line sta-
tions. The headline increase is 8.1% while the increase with building fixed effects is 3.9%.
The comparable numbers for the baseline treatment were 10.8% and 4.8%. This compari-
son suggests that properties in the 2nd Avenue corridor that are not within 0.3 miles from
a new station benefitted slightly more from the subway than properties in the Lexington
Ave or York Ave corridors that are within 0.3 miles of a new station.
Columns 4 and 5 suggest that the value gain in the Post period reflects the continuation
from a relative appreciation during the construction period. Prices in the treatment area
appreciated by 11.9% (5.8%) more than the control group, relative to the 2003-06 period,
in the specification without (with) fixed effects.
3 For
each one of our buildings, we feed in the street address into the Google Maps API and obtain the
distance to each subway station entrance (multiple per station) on the Upper East Side, to Central Park, and
to Grand Central Terminal.
21Table 6: Treatment Based on Distance to New Stations
(1) (2) (3) (4) (5)
VARIABLES Log Price Log Price Log Price Log Price Log Price
Post x Within .3 Miles 0.0615*** 0.0813*** 0.0394*** 0.119*** 0.0579***
(0.0151) (0.00971) (0.00838) (0.0115) (0.00999)
Constr. Period x Within .3 Miles 0.0705*** 0.0325***
(0.0116) (0.0100)
Post 0.113*** 0.109*** 0.111*** 0.176*** 0.167***
(0.0102) (0.00657) (0.00566) (0.00776) (0.00673)
Within .3 Miles -0.351*** -0.155*** -0.193***
(0.00905) (0.00599) (0.00859)
Constr. Period 0.123*** 0.101***
(0.00783) (0.00674)
Observations 51,770 51,770 51,770 51,770 51,770
R-squared 0.045 0.605 0.738 0.611 0.740
Controls NO YES YES YES YES
Building FE NO NO YES NO YES
Notes: “Post” is an indicator variable for the period after January 1st 2013. “Constr. Period” is an indicator variable for the construction
period between January 1st 2007 and December 31, 2012. “Within .3 Miles” is an indicator variable which is 1 for a transaction located
within 0.3 miles of one of the three new subway stations on the Second Avenue subway and 0 otherwise. Controls include: an
indicator variable for a condo transaction; an indicator variable for a studio; number of bedrooms; number of bathrooms; the floor of
the building; the year of construction; distance to Central Park; distance to Grand Central Terminal; as well as indicators if the control
variables are missing. Standard errors in parentheses.
*** pon the Second Avenue subway line (8 stations in total). Distance is calculated as walking
distance based on Google Maps. We calculate the reduction in distance to the nearest
subway station entrance triggered by the opening of the three new Q-line stations.
Table 1 reports that for the average unit in the 2nd Ave corridor, the closest station was
0.324 miles away before the Q-line extension and 0.184 miles after, for an average distance
reduction of 0.14 miles (225 meters). For the residents of the other three corridors, the av-
erage reduction was smaller at 0.077 miles (124 meters). The latter is the combination of
a zero reduction for all residents of the Madison corridor and most residents of the Lex-
ington corridor, on the one hand, and a large reduction for the residents on the York Ave
corridor, on the other hand. We define an apartment as treated if there is a strictly positive
distance reduction to the nearest subway station on the Upper East Side. Table 1 refers
to this alternative treatment definition as “treat3”. It shows that 78.7% of the transactions
in the 2nd Avenue corridor and 34.2% of the transactions in the Madison, Lexington, and
York Ave corridors are in a building which experiences a change in distance to the near-
est station. Again, this treatment is strongly but not perfectly correlated with our baseline
treatment. Figure 6 shows the treated and control group buildings according to this sec-
ond alternative treatment definition. The largest change with the baseline and the first
alternative treatment is that all properties east of Second Avenue are now treated.
Table 7 shows the difference-in-difference estimates. For our main specifications in
columns 2 and 3, we find a similar effect from the subway extension: 9.0% without and
3.3% with building fixed effects. In columns 4 and 5 we find a significantly positive effect
in the Construction period, and a continuation in the Post period. Prices in properties
with an improvement in distance to the closest subway station end up 13.9% (5.4%) above
2003-06 levels in the specification without (with) building fixed effects.
Further investigation, reported in Appendix Table 11, breaks down the treatment
group into units that experienced a reduction in distance (i) between 0 and 0.10 miles,
and (ii) greater than 0.10 miles. The latter group consists mostly of units east of 2nd Ave.
The 9.0% overall price effect is the average of estimated gains in the former group, and
5.7% in the latter group. While one might think that units experiencing a larger gain are
“more intensively” treated, we find that the gains are largest for those who experience
a modest reduction in distance. This includes residents on Third Ave and even some on
2nd Ave. For several far east residents, it is possible that the 2nd Ave subway remains
too far away to be useful. Far east residents may continue to use alternate transportation
options.
23Table 7: Treatment Based on Change in Distance to Nearest Station
(1) (2) (3) (4) (5)
VARIABLES Log Price Log Price Log Price Log Price Log Price
Post x Change in Dist. 0.0643*** 0.0897*** 0.0327*** 0.139*** 0.0536***
(0.0146) (0.00972) (0.00835) (0.0115) (0.00994)
Constr. Period x Change in Dist. 0.0945*** 0.0391***
(0.0116) (0.00999)
Post 0.102*** 0.0983*** 0.112*** 0.155*** 0.165***
(0.0105) (0.00701) (0.00602) (0.00831) (0.00718)
Change in Dist. -0.524*** -0.134*** -0.183***
(0.00878) (0.00771) (0.00976)
Constr. Period 0.103*** 0.0954***
(0.00843) (0.00719)
Observations 51,770 51,770 51,770 51,770 51,770
R-squared 0.096 0.602 0.738 0.607 0.740
Controls NO YES YES YES YES
Building FE NO NO YES NO YES
Notes: “Post” is an indicator variable for the period after January 1st 2013. “Constr. Period” is an indicator variable for the construction
period between January 1st 2007 and December 31, 2012. “Change in Dist.” is an indicator variable which is 1 for a transaction of a
unit for which the distance to the nearest subway station became smaller after the addition of the three new subway stations on the
Second Avenue subway and 0 otherwise. Controls include: an indicator variable for a condo transaction; an indicator variable for
a studio; number of bedrooms; number of bathrooms; the floor of the building; the year of construction; distance to Central Park;
distance to Grand Central Terminal; as well as indicators if the control variables are missing. Standard errors in parentheses.
*** pTable 8: Combination Treatment
(1) (2) (3) (4) (5)
VARIABLES Log Price Log Price Log Price Log Price Log Price
Post x All Treats 0.101*** 0.100*** 0.0455*** 0.129*** 0.0626***
(0.0164) (0.0106) (0.00922) (0.0125) (0.0109)
Constr. Period x All Treats True 0.0593*** 0.0345***
(0.0127) (0.0110)
Post 0.114*** 0.118*** 0.116*** 0.191*** 0.175***
(0.00889) (0.00576) (0.00494) (0.00683) (0.00591)
All Treats -0.448*** -0.187*** -0.217***
(0.00988) (0.00660) (0.00937)
Constr. Period 0.135*** 0.106***
(0.00687) (0.00593)
Observations 51,770 51,770 51,770 51,770 51,770
R-squared 0.057 0.606 0.738 0.611 0.740
Controls NO YES YES YES YES
Building FE NO NO YES NO YES
Notes: “Post” is an indicator variable for the period after January 1st 2013. “Constr. Period” is an indicator variable for the construction
period between January 1st 2007 and December 31, 2012. “Change in Dist.” is an indicator variable which is 1 for a transaction of a
unit for which the distance to the nearest subway station became smaller after the addition of the three new subway stations on the
Second Avenue subway and 0 otherwise. Controls include: an indicator variable for a condo transaction; an indicator variable for
a studio; number of bedrooms; number of bathrooms; the floor of the building; the year of construction; distance to Central Park;
distance to Grand Central Terminal; as well as indicators if the control variables are missing. Standard errors in parentheses.
*** p8.1.1 Owner-occupied Residential Buildings
Imputing the value of owner-occupied residential real estate occurs in three steps.
Step 1: Transacted Units For each apartment in the baseline treatment area for which
we observe at least one sale, we use the dynamic difference-in-differences specification
with controls to impute an annual valuation for 2003 (or year of construction if later) until
2012. The imputation uses the actual apartment and building attributes. We compute its
average value over the 2003-06 and the 2003-2012 periods.
Step 2: Other Units in Buildings with Transactions Even though we observe more than
16 years of transactions in a liquid market, many condo and coop units never transact in
our sample. Our valuation model should be excellent for calculating the value of apart-
ment units that do not trade in buildings where we see other units trade. For some of
these units we obtain information on number of bedrooms, bathrooms, square foot, and
floor. This could be because these units are for sale at some point, and therefore in our
data set, but not actually sold (listing removed). Or it could be that the unit is for rent and
those characteristics are available as part of the rental listing.4 Even if unit characteristics
are missing, we know how many units each building has and thus how many units we
are missing. We may be able to infer characteristics on missing units.5 At the very least
we can use the average characteristics of the observed units to impute the aggregate value
of the missing units. We do so for each year and produce average values for 2003-06 and
2003-2012.
Step 3: Units in Buildings without Transactions The valuation model should also be
reasonably accurate for valuing units in owner-occupied buildings in the treatment area
where we do not observe any transactions, if at least we have basic information on the
number of units in the building and the year of construction. Here we use data from the
New York City Department of Finance to supplement data from StreetEasy to make sure
we cover every lot.
4 This could be because the building is a mixed owner- and renter-occupied building, or because some
condo owners rent out their unit (e.g., investment property).
5 We can infer from the apartment units we see transact, which units we are missing on each floor, and
use the apartment numbers to infer bedrooms and bathrooms. For example, if we see transactions for
apartments #20A and #22A, and both are 2-bedroom, 2-bathroom units, we can safely assume that apart-
ment #21A, which we are missing in the sample, is also a 2-bedroom, 2-bathroom unit, and we know it is
on the 21st floor. We then use the number of bedroom, number of bathroom, floor, and building attributes
to value this unit.
26You can also read