DHL New Zealand Lions Series 2017 - Economic impact and benefits analysis of the DHL New Zealand Lions Series 2017 - New Zealand Major Events
←
→
Page content transcription
If your browser does not render page correctly, please read the page content below

12.02.18

DHL New Zealand
Lions Series 2017
Economic impact and benefits
analysis of the DHL New
Zealand Lions Series 2017

                                                 www.pwc.co.nz
                               Strictly private and confidential
                                                FINAL REPORT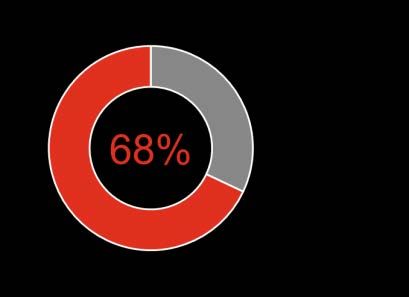
Susan Sawbridge – Manager, Major Events Strategy
Ministry of Business Innovation and Employment
PO Box 1473
Wellington

12 February 2018

Post-Series evaluation of the DHL New Zealand Lions Series 2017

Dear Susan,

We are pleased to provide our report on the post-Series evaluation of the DHL New Zealand Lions Series 2017. It has been a pleasure to work with you on this
assignment and we look forward to working with you again soon.

This report is provided in accordance with the terms of our consultancy agreement, dated 27 April 2017 and variation of consulting services agreement dated 27
June 2017, and is subject to the restrictions set out in Appendix A of this report.

If you have any queries please do not hesitate to contact us.

Yours sincerely,

Brendon O’Connor                                                                          Craig Rice
Director                                                                                  Partner
brendon.j.oconnor@nz.pwc.com                                                              Craig.rice@nz.pwc.com
(09) 355 8608                                                                             (09) 355 8641
DHL New Zealand Lions Series 2017 – Evaluation Report                                                                                                            2
We wish to thank the following organisations and individuals who provided information
                                                        and support for this study:
                                                        -   Ministry of Business, Innovation and Employment
                                                        -   New Zealand Rugby
                                                        -   All Blacks Hospitality
                                                        -   Sport New Zealand
                                                        -   British and Irish Lions
                                                        -   Whangarei District Council
                                                        -   Auckland Tourism Events and Economic Development
  Acknowledgements                                      -   H3 Group
                                                        -   Rotorua Lakes Council
                                                        -   Wellington Regional Economic Development Agency
                                                        -   Christchurch City Council
                                                        -   Tourism New Zealand
                                                        -   New Zealanders and individuals from across the world who responded to the surveys.

DHL New Zealand Lions Series 2017 – Evaluation Report                                                                                            3
What you’ll find inside:
Page Page
00 Executive Summary 05 Appendices
01 Background and overview 16 Appendix A – Restrictions 60
02 Results 20 Appendix B – Economic modelling approach 61
03 Broader benefits 39 Appendix C – Detailed results and other 71
04 Summary 55 information
DHL New Zealand Lions Series 2017 – Evaluation Report 400
Executive Summary
DHL New Zealand Lions Series 2017 – Evaluation Report 5Introduction and background The British and Irish Lions (the Lions) is a rugby team consisting of players from England, Scotland, Ireland and Wales. Every four years, the Lions tour in the Southern Hemisphere visiting either New Zealand, South Africa or Australia. The DHL New Zealand Lions Series 2017 (the Series) consisted of 10 matches taking place from 3 June 2017 to 8 July 2017. In total, 342,000 seats were filled to watch matches across seven venues from Whangarei to Dunedin, with over 53,000 of the seats filled by international visitors. The Lions also spent time in other parts of New Zealand. New Zealand Rugby was both the event owner and organiser for the Series, with responsibility to plan and deliver the Series. Government investment was limited to leverage and cultural activities. This report has been commissioned by the Ministry of Business, Innovation and Employment (MBIE) to measure the impact of the Series on New Zealand and the host city economies. The evaluation focuses on the economic and broader benefits to New Zealand and host cities from hosting the Series. 03 June 07 June 10 June 13 June 17 June 20 June 24 June 27 June 01 July 08 July New Zealand Blues Crusaders Highlanders Maori All Blacks Chiefs All Blacks Hurricanes All Blacks All Blacks Provincial Barbarians Whangarei Auckland Christchurch Dunedin Rotorua Hamilton Auckland Wellington Wellington Auckland DHL New Zealand Lions Series 2017 – Evaluation Report 6
Key results at a glance

                                                         GDP          FTE
                                                        $194m*        2,507
                       25,760                                       supported
                    International
                                                                      Indirect
                       visitors                          Indirect       FTE
                                                          GDP           743
                                                          $83m
                 56,260
             domestic travellers
                                                                      Direct
                                                         Direct        FTE
                                                          GDP         1,764
                         545,000                         $110m

                       international
                        guest nights
*Figures may not add due to rounding.
DHL New Zealand Lions Series 2017 – Evaluation Report                            7
Overall approach
To analyse the economic impact of the Series, we 1. Understanding of attendance and spend
collected expenditure data relating to hosting the We developed and launched three online surveys to capture origins of match attendees, their typical
Series and expenditure data relating to international length of stay and expenditure patterns. Two surveys were for international visitors, the other for
and domestic tourism from match attendees. This domestic tourists.
was completed with three surveys (two series
2. Visitor spending
specific surveys and one additional screener
question in the International Visitor Survey) and The sample of match attendee information from the online survey was calibrated with ticketing data.
direct correspondence with New Zealand Rugby and This provided us with the total spending of Series attendees at the matches including associated tourism,
city-hosts. hospitality and related activities. This formed the basis for the total direct expenditures of the Series from
tourism.
The expenditure data was modelled using multiplier
analysis to estimate the direct, flow-on and total 3. Hosting and leverage activities spending
economic impacts of the Series in terms of GDP The direct expenditure on hosting the Series and associated leverage activities was also obtained from
impacts to the New Zealand and host city New Zealand Rugby and host cities.
economies. An employment impact was also
4. Total economic impacts (direct and flow-on)
estimated. This represents the employment in full-
time equivalent units that supported the GDP The incremental portion of the total direct expenditures were then modelled using multiplier analysis to
impact. Like the GDP impact, the employment estimate the direct, flow-on2 and total economic impacts of Series expenditure.
impact was also measured in terms of the direct, 5. Analysis of broader benefits
flow-on and total economic impact.
Finally, the analysis included a recognition of positive lasting benefits stemming from the Series in terms
The broader benefits from the Series were also of civic pride and reputational benefits. This was captured through two online surveys of New Zealand
analysed through two quantitative surveys – one for adults and UK and Ireland adults.
international and one for domestic audiences. 1
Further detail on our methodology and approach can be found in Appendix B – Economic modelling
Our approach is described in the following five approach.
steps:
1. A total of five surveys were completed for this project. An outline of four of the Series-specific surveys is included in Appendix B.
DHL New Zealand Lions Series 2017 – Evaluation Report 2. Flow-on or indirect impacts occur when businesses involved in hosting the Series or tourism and hospitality businesses purchase goods and services
from other industries. Refer to page 25 for further details. 8Overall approach
Key assumptions Limitations
For the national economic impact, we considered the incremental expenditure We have relied on a number of different data sources including surveys of ticket
relating to the Series, spend which is additional to what would normally have purchasers from New Zealand and offshore. In the analysis of the economic
been spent. We have made the following assumptions around the incremental benefits of the Series, we have relied on the information provided to us from the
expenditure: survey respondents as being accurate, however there is potential that bias may
exist and figures are over-inflated. To confirm reasonableness of the survey
• All expenditure in New Zealand relating to hosting the Series is incremental data we cross-checked the average expenditure values to other sources (eg Stats
expenditure to New Zealand. NZ’s visitor expenditure data).
• All expenditure from the British and Irish Lions is incremental expenditure We have also used a number of different sources of information for our study. It
to New Zealand. would be preferable to use a single dataset to ensure consistency but due to the
• All expenditure from international visitors who came to New Zealand to wide range of information needed for the study, multiple sources have been
follow the British and Irish Lions as the main reason for their trip is used. Therefore there could be some inconsistencies and discrepancies between
incremental expenditure to New Zealand. the various datasets which may impact our modelling and estimates.
• There is no domestic tourism expenditure in the national economic impact Margins of error and confidence intervals are not standard reporting metrics
analysis. Domestic tourism expenditure is expected to be expenditure which for economic impact assessments. Instead, we use sensitivity testing as a simple
is displaced from consumption of other goods or services within New way to show a range for our GDP and FTE estimates and magnitude of likely
Zealand’s boundaries. impact. We also completed sensitivity testing on key assumptions to establish a
• Hosting and leverage activity is incremental expenditure to a host city but range of possible outcomes. These were:
not incremental to New Zealand.
1) The number of visitors who self-reported that the Series was the reason for
their trip.
2) The expenditure of visitors while they were in New Zealand.
DHL New Zealand Lions Series 2017 – Evaluation Report 9Overall approach
Economic impact analysis involves estimation of the total economic impact of • Domestic travel includes car hire, local public transport and intercity
an event or industry, through analysis of the event or industry’s expenditure. ground and air transportation.
This involves estimating how a change in demand for goods and services in one • Accommodation includes expenditure on hotels, motels and other types
industry creates demand in other industries and the economy as a whole. These of accommodation.
relationships are described by input-output tables (developed by Stats NZ),
• Food & beverages includes spend at restaurants, bars and cafes, as well as
from which input-output multipliers are derived. The multipliers characterise
groceries and spend at the matches.
the sector-by-sector average change in output generated, when there is extra
demand in one sector. • Attractions, activities and other includes expenditure on New Zealand
attractions such as museums.
Applying the GDP and employment multipliers, to the tourism expenditure and
actual expenditure associated with hosting and leverage activities for the Series, • Retail shopping includes expenditure in retail stores around the country.
generates an estimate of the direct and total economic impact of the Series.
• Entertainment & hospitality includes costs such as beverage costs,
This was completed on a line-by-line budget level for all expenditure relating to catering costs and the hiring of bands/cultural groups.
the Series, regardless of whether the investment was made by the government
or New Zealand Rugby. • Venue costs are anything that relates to match or event venues. This
includes construction costs, equipment hire costs and ground restoration.
For reporting purposes, we have grouped the expenditure into the following
buckets: • Marketing costs are concerned with the advertising of the Series, this
includes fan engagement and All Blacks public events.
• International airfares include airfares that directly benefit New Zealand.
This was estimated using survey data, taking the proportion of international • Other is line items that have direct relevance to the series but can not be
visitors who travelled with Air New Zealand. specified in to one of the alternative categories. This includes match
officials’ charges, insurance and other project-related costs.
DHL New Zealand Lions Series 2017 – Evaluation Report 10National economic impact – Gross domestic product (GDP)
Figure 1: Total contribution to GDP by sector ($GDPm)
The Series directly contributed $110m to New
Zealand GDP in 2017. After flow-on effects are Category Subtotal
considered, the total contribution of the Series to Indirect
New Zealand GDP increases to $194m. These GDP International airfares $14.1m
impacts were derived from international tourists $83m Domestic travel $35.9m
and hosting the series. Accommodation $68.0m
Total Food & beverages $46.5m
The analysis reported here shows our standard GDP Attractions, activities and other $8.2m
GDP estimates (and FTE overpage). The impact $194m2 Retail shopping $2.0m
on our GDP (and FTE) results from our Direct Entertainment & hospitality $4.1m
sensitivity testing is included in section 2.2. 1 GDP Venue $8.7m
$110m Marketing $0.8m
Analysis of the sectors which make up the total Other $5.3m
contribution of the Series to New Zealand GDP
shows that accommodation (35%), food and Total $193.6m
beverages (24%) and domestic travel (19%) make
up close to 80% of the total GDP contribution.
Attractions,
Accom- Food & Domestic International Entertainment Retail Marketing &
activities and Venues
modation beverages travel airfares & hospitality shopping other
other 5%
35% 24% 19% 7% 2% 1% 3.0%
4%
1. No high sensitivity test for number of visitors. Refer to page 30 for further details.
2. Totals may not add due to rounding.
DHL New Zealand Lions Series 2017 – Evaluation Report 11National economic impact – Full time equivalents (FTE)
Figure 2: Total contribution to employment by sector
(FTE)
The GDP impact of $110m was supported by
1,764 FTEs. These jobs will have occurred in the Indirect Category Subtotal
lead up to the tour and during the tour itself. FTE
743 International airfares 103
Some could have been short-term positions
Domestic travel 247
created and some may be extensions of long-term
Accommodation 941
jobs (eg overtime). After flow-on effects are
considered, the total contribution of the Series to Total Food & beverages 843
New Zealand employment supported was over FTE Attractions, activities and other 113
Direct Retail shopping 28
2,500 FTEs in 2017. These impacts were derived 2,507
Entertainment & hospitality 50
from international tourists and hosting the series. FTE
Venue 110
1,764 Marketing 11
Accommodation makes up 38% of the total
employment contribution, while food and Other 62
beverages is much more labour intensive and Total 2,507
makes up 34% of the total employment
(compared to its GDP contribution).
Attractions,
Accom- Food & Domestic International Entertainment Retail Marketing &
activities and Venues
modation beverages travel airfares & hospitality shopping other
other 4%
38% 34% 10% 4% 2% 1% 3.0%
5%
*Figures may not add due to rounding.
DHL New Zealand Lions Series 2017 – Evaluation Report 12Regional economic impacts
Figure 4: Total economic impact for host cities
The impact of international tourists and the costs of hosting the Series,
can be disaggregated to the host cities and the rest of New Zealand. In
addition, there are further contributions to regional economies from Whangarei
$6.2m GDP
domestic tourism and host city spend on leverage activities, as this 96 FTE
spend is additional to the host city’s economy but not to New Zealand. 1 match
Auckland hosted three matches in total including two test matches, and Auckland
enjoyed the largest GDP impact. Auckland also has the largest stadium. $67.9m GDP
808 FTE
At the other end of the scale, Whangarei, which hosted the first match of Hamilton
3 matches
the Series in the smallest stadium, had the smallest economic impact of $10.7m GDP
156 FTE
the host cities studied.1 1 match
Figure 3: Total contribution to GDP and FTE employment
Rotorua
supported by region
$80.0m 900 $11.1m GDP
162 FTE
$70.0m 800 1 match
700
$60.0m
600
$50.0m Rest of NZ
500 $58.8m GDP
Wellington
GDP $40.0m FTE 779 FTE
$30.7m GDP
400
407 FTE
$30.0m
300 2 matches
$20.0m
200
$10.0m 100
Christchurch
$.0m 0 $8.3m GDP
Whangarei Auckland Rotorua Hamilton Wellington Christchurch Rest of NZ 100 FTE
FTE 1. Note Dunedin chose not to participate in this study 1 match
DHL New Zealand Lions Series 2017 – Evaluation Report 2. Venue capacity differs across the venues, see Appendix B for details 13
3. The rest of New Zealand impact relates to hosting the Series in Dunedin and international tourism expenditure outside the host cities eg
Queenstown, Nelson etc. The value for the rest of NZ is a balancing figure between the national impact and sum of the host city impacts.The Series has been a success for New Zealand, in the eyes of
New Zealanders surveyed
Awareness Viewership Perception Cultural programme
Kantar TNS completed a Almost all New 69% of New Zealanders The Series had a positive While the majority of
survey of 1,000 New Zealanders surveyed surveyed tuned in to a impact on surveyed New New Zealanders had
Zealand residents aged 18 (92%) were aware of the match during the Series. Zealanders’ perceptions some awareness of the
or over to gauge their DHL New Zealand Lions New Zealanders tuned in of the nation – festival events that were
perceptions of the Series. Series 2017; those aged to 5 matches on TV, on particularly in terms of held around the country
30 or over and pre-family average, with viewership being: (a) friendly and at the time of the Series,
households have the highest for the All Blacks hospitable for visitors; just over a quarter of
Note that the statistics
strongest awareness matches. and (b) able to host a those surveyed (27%)
reported are based on
(statistically significantly major event. 68% agreed attended at least one of
claimed behaviour. We
higher than their opposite with the former and 64% the events –
cannot verify what the
numbers). with the latter. notwithstanding
respondents stated.
attendance, the majority
agreed that the events
created a sense of
excitement.
DHL New Zealand Lions Series 2017 – Evaluation Report 14The Series has been a success for New Zealand, in the eyes of the surveyed
UK and Ireland audience
Kantar TNS completed a survey of 419 UK and Irish residents aged 18 or over to gauge their perceptions of the Series.
Note that the statistics reported are based on claimed behaviour. We cannot verify what the respondents stated.
Awareness Engagement Profile Friendliness Perception Cultural programme
Overall, 50% and 64% Ireland residents The Series has Friendliness of New In addition, the Series As a result, the majority
of UK and Ireland surveyed appear to be successfully promoted Zealanders and their has had a positive impact of UK and Ireland
residents surveyed more engaged with the New Zealand’s profile as sense of national pride on perceptions of New residents are more likely
respectively were Series than UK residents a major event host with also translated well to Zealand in general to consider New Zealand
aware of the 2017 DHL – with higher awareness 74% and 76% of international audiences. including friendly people, as a destination for a
New Zealand Lions of the Series and tuning surveyed UK and Ireland 61% of UK residents and being a popular holiday holiday and there are
Series with television, in to the games on TV; adults that were aware of 63% of Ireland residents destination and having good levels of stated
outside of broadcasting they are also more likely the series, agreeing that surveyed agreed that spectacular landscape interest to live and work
the games, generating to have tuned in to more the Series was a real New Zealanders were and scenery. 54% of UK in New Zealand. 20% of
most of the Series games (1.7 games on credit to New Zealand friendly and welcoming residents and 59% of UK residents, and 19%
awareness followed by average in the UK vs. 2.6 and its ability to host locals. Ireland residents of Ireland residents
word of mouth. games on average in world-class events. surveyed agreed that surveyed, are more likely
Ireland). New Zealand is a to consider New Zealand
popular destination. as a place to work while
23% and 20%
respectively are more
likely to consider New
Zealand as a place to
DHL New Zealand Lions Series 2017 – Evaluation Report live. 1501
Background and overview
DHL New Zealand Lions Series 2017 – Evaluation Report 16Introduction
Introduction
The British and Irish Lions (the Lions) is a rugby team consisting of players from England, Scotland, Ireland and Wales.
The Lions first toured New Zealand in 1888 and since then have built a long and storied history. Every four years, the Lions
tour in the Southern Hemisphere visiting either New Zealand, South Africa or Australia. The Lions last visited New Zealand
in 2005, playing 11 matches.
The 2017 DHL New Zealand Lions Series (the Series) consisted of 10 matches taking place from 3 June 2017 to 8 July 2017.
In total, 342,000 seats were filled to watch matches across seven venues from Whangarei to Dunedin. The Lions also
visited a number of other locations throughout their tour of New Zealand, which also contributed to the national economy.
Purpose of report
This report has been commissioned by the Ministry of Business, Innovation and Employment (MBIE) to measure the
impact of the Series on New Zealand and the host city economies*. The evaluation focuses on the economic and cultural
benefits to New Zealand from hosting the Series.
This report considers the direct and indirect (or flow-on) economic impacts and benefits of the event on:
• the New Zealand national economy
• New Zealand city economies (Auckland, Christchurch, Wellington, Hamilton, Whangarei and Rotorua).
It also considers the broader benefits of the Series through:
• the social and cultural benefits received by New Zealanders *All host cities have been evaluated as part of this report,
except Dunedin as Dunedin decided not to take part
• the reputational benefits received by New Zealand in key business and tourism markets: the UK and Ireland.
A wider suite of broader benefits arising from the Series have not been analysed in this report, but include branding and
promotion benefits for New Zealand. New Zealand’s ability to host major events such as the Series, was showcased to the
DHL New Zealand Lions Series 2017 – Evaluation Report 17
world, continuing the success of hosting the Rugby World Cup 2011, FIFA U20, Cricket World Cup 2015 and the World
Masters Games.Whangarei
03 June New Zealand Toll Stadium
Provincial Barbarians 1 match
Whangarei
Auckland
Matches in the Series were 07 June Blues
Auckland Hamilton
Eden Park
3 matches
FMG
spread around New Zealand Stadium
10 June Crusaders Waikato
with 8 matches played in the Christchurch 1 match
Rotorua
North Island and 2 in the 13 June Highlanders
Rotorua
International
Stadium
South Island Dunedin
1 match
17 June Maori All Blacks
All Blacks 08 July
Rotorua
The three All Blacks tests, the most high Wellington Auckland
Westpac
profile matches of the Series, were played in Stadium
two cities: 01 July
2 matches All Blacks
Wellington
• Auckland hosted the first and third tests
27 June
• Wellington hosted the second test. Hurricanes
Christchurch Wellington
Dunedin AMI Stadium
Forsyth Barr 1 match 24 June
Stadium All Blacks
1 match Auckland
Chiefs 20 June
Hamilton
DHL New Zealand Lions Series 2017 – Evaluation Report 18The Government invested in a New Zealand-wide cultural programme to run alongside the Series in order
to:
• showcase New Zealand culture, arts, innovation, landscapes, heritage, hospitality and way of life to
international visitors and the international audience through broadcast and visiting media
• create a nationwide focus and sense of celebration that enhances New Zealand’s international reputation
as a world-class major event host
• diversify visitor spending across sectors and regions
• encourage and support New Zealand Inc. agencies, industries, businesses and regions to leverage the
Overview of the cultural opportunities presented by the event
leverage programme • give visitors and New Zealanders an unforgettable Kiwi experience.
The intent was for government to support host cities in building a programme of activity and activation to:
• enhance the Series
• amplify game day experiences
• extract maximum visitor and local engagement with New Zealand values, experiences, products and
culture
• deliver legacy outcomes for New Zealand’s communities.
The programme included:
A schools Queens
Game-day
A nationwide programme, Wharf Fan
activation
Matariki rugby club Zone in
including
themed programmes Auckland and
adding a New
festival and fan Fan Zone in
Zealand lens
activities Wellington
DHL New Zealand Lions Series 2017 – Evaluation Report 1902
Results
DHL New Zealand Lions Series 2017 – Evaluation Report 20Snapshot of international visitors Snapshot of domestic tourists
During June and July 2017, more than 477,000 There were over 56,000 domestic tourists for the Series.5
international visitors travelled to New Zealand.1 Of that These are New Zealanders who travelled to a different city
number, approximately 25,760 or 5.4% of all international from the city or town they live in, to attend a Series match.
visitors specified the Series was the main purpose for their
trip to New Zealand.2,3
This is over 25% more than the number of international
visitors who came to New Zealand for the 2005 Series.4
On average, each international visitor for the Series:
On average, each domestic tourist:
• attended 1.9 matches 5
Attended 3.7 matches Stayed 22 days • spent 1 night in each city visited
2.1 Length of stay % of total
• visited with their spouse/partner (31%), relatives (26%)
or friends (32%).
Less than 1 week 11%
1-2 weeks 23%
2-3 weeks 33%
Attendance and More than 3 weeks
Minimum
33%
2
visitation Maximum
Median
Mean
365
18
22 1. Based on claimed behaviour from travellers at point of departure. The IVS asks
Survey data - Number of days travellers about the date they arrived in New Zealand, which is then used to
generate statistics on international visitor arrivals by arrival month.
To provide some additional insight into international http://archive.stats.govt.nz/browse_for_stats/population/Migration/iva.aspx
2. Refer to page 23 for tickets issued per game.
travellers, surveying suggests that international visitors for 3. Kantar TNS surveyed departing travellers as part of the IVS between June and
the Series most commonly: August 2017. Of those surveyed, 5.4% of total international visitors to New
Zealand stated that the Series was the main purpose of their trip to New Zealand.
• travelled with their husband, wife or partner (42%) or Note this is based on self-reported, or claimed, behaviour of 947 respondents to
friends (26%) the IVS. The percentage of travellers who came to New Zealand for the series
(information collected at point of departure for travellers between June and August
• visited for a holiday/vacation (71%) 2017) is applied to the number of international visitors who came to New Zealand
• arrived by plane at Auckland airport (86%) in economy in June and July 2017 (based on self-reported arrival dates).
4. Covec (2005) reported 20,400 international visitors came to New Zealand for the
class (75%) 2005 Lions Series.
• travelled as independent travellers (76%), rather than 5. PwC estimate based on TNS survey, New Zealand Rugby and All Blacks
DHL New Zealand Lions Series 2017 – Evaluation Report as a part of an organised group (24%). Hospitality data.
6. Average for domestic tourists only, not overall New Zealanders. That is the
average of New Zealanders who attended a match outside their home city.
21International guest nights
In our survey of international visitors, approximately 31%
of total international guest nights were spent in Auckland,
while over one-third were spent in other towns and cities
across New Zealand which did not host a match.
545,000
international
Figure 5: International guest nights by location
guest nights
2.1 Extrapolation of our survey data to the total number of
international visitors who travelled because of the Series
indicates that total additional guest nights were 545,000
immediately prior, during and after the Series.
Attendance and *WHA = Whangarei
Figure 6: Total international guest nights by location
visitation Place Total guest nights
Whangarei 9,220
Auckland 168,430
35% of international Hamilton
Rotorua
24,390
35,460
Wellington 78,030
guest nights were spent Christchurch 27,260
Dunedin 13,190
outside of the host cities Other towns / cities 189,000
544,980
*Totals may not add due to rounding.
**Results for the three Auckland matches and two Wellington matches
have been aggregated
DHL New Zealand Lions Series 2017 – Evaluation Report 22Ticketing breakdown for host cities Ticketing breakdown for host cities*
The charts below display the breakdown of tickets sold to host Venue Capacity Own city Other NZ International Unknown
origin and
city residents (own city), domestic tourists (other New Zealand), tickets not
and international visitors (overseas). The breakdown is based on issued
ticketing data from New Zealand Rugby. Whangarei 19,720 9,098 6,660 1,208 2,754
Auckland 143,282 83,451 33,607 25,446 778
Christchurch 20,635 12,285 5,269 1,956 1,125
Dunedin 28,296 15,009 7,224 1,975 4,088
Whangarei Auckland
Rotorua 28,193 3,260 20,203 3,141 1,590
Hamilton 29,984 13,401 12,207 3,356 1,020
7% Wellington 79,345 34,128 21,572 16,013 7,632
18%
Total guest nights for host cities
In addition to guest nights from international tourists, there are
tourism impacts for each host city from domestic tourists ie
54%
39% 24% New Zealanders who travel from their home city to another city
58%
to attend a match.
2.1 The charts below display the total guest nights (international
and domestic) for each host city.
Rotorua Hamilton 250,000 232,213
12% 12% 12% 200,000
188,996
Attendance and
Guest nights
-
150,000
109,132
visitation 42%
46% 100,000
50,000
60,155
37,551 30,917
23,475
16,162
76% -
Wellington Christchurch
22% 10% International tourist guest nights Domestic tourist guest nights
48%
63% Tickets sold to residents from the host city are assumed to
27% generate no additional guest nights for the host city. The number
of guest nights for domestic and international tourists are taken
from surveys of international and domestic ticket purchasers
30% (refer to Appendix B for further details).
DHL New Zealand Lions Series 2017 – Evaluation Report 23
*Source: New Zealand Rugby, All Blacks Hospitality, PwC analysisExpenditure by international tourists Expenditure by domestic tourists
We estimated average expenditure by international tourists We estimated average expenditure by domestic tourists
on a per person per night basis, using data collected from on a per person per night basis, using data collected from
our survey. On average, each international tourist spent our survey. On average, each domestic tourist spent the
$332 per person per night during their stay in New following on their trip to host cities per night:
Zealand.
$222
$255
$150
$170
2.1 $332
$216
Attendance and
visitation $306
$303
A breakdown of the expenditure into different categories Per person per night spend was highest in the two South
is included in Appendix C. Island matches. Analysis of the domestic tourism
expenditure data shows that the two biggest drivers of
spend were restaurants and bars, and overall transport
DHL New Zealand Lions Series 2017 – Evaluation Report costs (refer to Appendix C). 24We have estimated two measures of the Series’ In order to do business, firms must purchase inputs
contribution to New Zealand’s economy: from other industries. Flow-on or indirect
impacts occur when businesses involved in hosting
• Value added – the Series’ contribution to New the Series or tourism and hospitality businesses
Zealand’s GDP, which is calculated as the total purchase goods and services from other industries.
returns to labour and capital in the industry. For example, a restaurant must buy fresh produce,
2.2 • Employment – the number of FTEs which
may need to hire additional chillers and pay for
additional electricity, etc. The impact of supporting
supported the GDP impact. Some of these jobs businesses is included as indirect impacts.
will have occurred in the lead up to the tour and
National economic during the tour itself. Some could have been
short-term positions created and some may be
The total economic impact of the industry is
equal to the sum of its direct and indirect impacts.
extensions of long-term jobs (eg overtime).
impact In our approach, these are estimated as derivatives
In order to estimate the direct, indirect and total
economic impacts of the Series, we have used
of final expenditure by tourists and on hosting the multiplier analysis, using multiplier tables from
Series and are the direct economic impacts of the Butcher Partners.
Series.
In addition to its direct economic impacts, there are
flow-on or indirect effects elsewhere in the economy.
DHL New Zealand Lions Series 2017 – Evaluation Report 25Approach Assumptions1
Multiplier analysis starts with total incremental For the national economic impact, we considered the
expenditure on the Series, which we have collected incremental expenditure relating to the Series,
from a number of sources. spend which is additional to what would normally
have been spent. We have made the following
The total direct expenditures considered in this assumptions around the incremental expenditure:
study include all spending activities attributable to
the Series. • All expenditure relating to hosting the Series at a
national level is incremental expenditure to New
For the national economic impact, we considered Zealand. The Lions only tour the Southern
two expenditure streams and collected data on each Hemisphere every four years and last toured New
separately: Zealand in 2005, in this regard the 2017 spend is
additional to New Zealand. Furthermore, the
1. Hosting the Series Series has a stronger legacy to a routine
2.2 • We obtained expenditure data from New Zealand
international tour and has a larger profile in
relation to hosting the Lions.
Rugby and leverage activity organisers.
• All expenditure from the British and Irish Lions
2. Tourism expenditure from international visitors
National economic • We obtained expenditure data from the surveyed
is incremental expenditure to New Zealand.
• There is no domestic tourism expenditure in the
impact international visitors (see section 2.1 Attendance
and visitation).
national economic impact analysis. Domestic
tourism expenditure is expected to be
• We extrapolated the survey data using Stats NZ’s expenditure which is displaced from
International Visitor Survey and Series ticketing consumption of other goods or services within
data to total international tourists who came to New Zealand’s boundaries.
New Zealand because of the Series.
• We estimate the economic impact of the visitors
• We obtained expenditure data from the British who claimed the Series was the main reason for
and Irish Lions team. their trip to New Zealand. Visitors who stated the
Series was only a partial reason for their trip have
only been included in the sensitivity testing. This
means that our central estimate of the economic
DHL New Zealand Lions Series 2017 – Evaluation Report impact of the Series is conservative. 26
1. Further assumptions are outlined in Appendix B.Economic impact analysis involves estimation of • Accommodation includes expenditure on
the total economic impact of an event or industry, hotels, motels and other types of
through analysis of the event or industry’s accommodation.
expenditure.
• Food & beverages includes spend at
This involves estimating how a change in demand restaurants, bars and cafes, as well as groceries
for goods and services in one industry, creates and spend at the matches.
demand in other industries and the economy as a
• Attractions, activities and other includes
whole. These relationships are characterised by
expenditure on New Zealand attractions such
input-output tables, from which input-output
as museums.
multipliers are derived. The multipliers
characterise the sector-by-sector average change in • Retail shopping includes expenditure in retail
output required, when there is extra demand. stores around the country.
Applying the GDP and employment multipliers to
2.2 the actual expenditure associated with hosting and • Entertainment & hospitality includes
costs such as beverage costs, catering costs
leverage activities for the Series and tourism
expenditure, generates an estimate of the direct and the hiring of bands/cultural groups.
and total economic impact of the Series.
National economic This was completed on a line-by-line budget level
• Venue costs are anything that relates to
match or event venues. This includes
construction costs, equipment hire costs and
impact for all expenditure relating to the Series, regardless
of whether the investment was made by the ground restoration.
government or New Zealand Rugby. • Marketing costs are concerned with the
For reporting purposes, we have grouped the advertising of the Series, this includes fan
expenditure into the following buckets: engagement and All Blacks public events.
• International airfares include airfares that • Other is line items that have direct relevance
directly benefit New Zealand. This was to the series but can not be specified in to one
estimated using survey data, taking the of the alternative categories. This includes
proportion of international visitors who match officials’ charges, insurance and other
travelled with Air New Zealand. project-related costs.
• Domestic travel includes car hire, local
DHL New Zealand Lions Series 2017 – Evaluation Report public transport and intercity ground and air 27
transportation.The Series directly contributed $110m to New Zealand GDP in 2017. Employment of 1,764 FTEs
supported the GDP impact. Some of these jobs will have occurred in the lead up to the tour and
during the tour itself. Some could have been short-term positions created and some may be
extensions of long-term jobs (eg overtime). After flow-on effects are considered, the total
contribution of the Series to New Zealand GDP increases to $194m and total employment
supported increases to over 2,507 FTEs in 2017.
25,760
visitors
GDP FTE
$194m1 2,507
2.2 56,260
Indirect
domestic travellers Indirect FTE
National economic GDP 743
$83m
impact
545,000
Direct
international Direct FTE
GDP
guest nights $110m
1,764
68% of international visitors
surveyed were extremely likely to
DHL New Zealand Lions Series 2017 – Evaluation Report recommend New Zealand to others 28
1. Totals may not add due to rounding.Analysis of the sectors which make up the total contribution of the Series to New Zealand GDP shows that the
impact on accommodation (35%), food and beverages (24%) and domestic travel (19%) made up nearly 80% of the
total GDP contribution. Accommodation makes up 38% of the total employment contribution, while food and
beverages, relative to its GDP contribution, is much more labour intensive and makes up 34% of the total
employment.
Figure 7: Total contribution to GDP by sector
Category Subtotal
$5.28m $4.06m $2.04m $.82m
$8.23m 2% 1%
3% 0%
International airfares $14.1m 4%
Accommodation
Domestic travel $35.9m Food & beverages
$8.73m
Accommodation $68.0m Domestic travel
5%
Food & beverages $46.5m $14.08m
$68.00m
International airfares
35%
Attractions, activities and other $8.2m 7%
Venue
Retail shopping $2.0m Attractions, activities and other
Entertainment & hospitality $4.1m
2.2 Venue
Marketing
$8.7m
$0.8m
$35.90m
19%
Other
Entertainment & hospitality
Retail shopping
Other $5.3m $46.45m
Marketing
24%
National economic Total $193.6m
Figure 8: Total contribution to employment by sector
impact Category Subtotal
103
4%
62
2%
50
2%
28
1%
11
0%
Accommodation
International airfares 103 Food & beverages
110
Domestic travel 247 4% Domestic travel
113
Accommodation 941 5% 941 Attractions, activities and other
38%
Food & beverages 843 247 Venue
Attractions, activities and other 113 10% International airfares
Retail shopping 28 Other
Entertainment & hospitality 50 Entertainment & hospitality
Venue 110 Retail shopping
Marketing 11 843
Marketing
34%
DHL New Zealand Lions Series 2017 – Evaluation Report
Other 62 29
Total 2,507Sensitivity testing Sensitivity test 1: Expenditure values
We note that due to our survey approach, there is
Sensitivity testing is used to test the influence of the
some uncertainty in the average expenditure by
assumptions and key variables on the overall results.
category values that we have estimated. The largest
By changing these key variables we are able to
contributors to the economic impact were food and
establish a range of possible outcomes around our
beverages and accommodation, therefore we applied
standard GDP and employment impacts. We
a variation on the expenditure of international
completed two separate sensitivity tests.
tourists to see the effect on GDP and FTEs.
The first sensitivity test investigated how the GDP
and FTE impact changes if the expenditure on Figure 9: Sensitivity test 1
groceries, food and beverages, and accommodation Low High
changes.
Groceries, food -10% +10%
The second sensitivity test investigated how the GDP and beverages,
2.2 and FTE impact changes if the number of
international visitors travelling to New Zealand
accommodation
changes. The results of the sensitivity testing on key
expenditure categories (see Figure 10) show that the
National economic The results of these two tests are included on this
page and the following page. total contribution of the Series to New Zealand’s
GDP is likely to range between $183.1m and
impact $204.1m. The jobs required to support the GDP
impact is between 2,344 and 2,670 FTEs.
Figure 10: Sensitivity testing on expenditure
Low Standard Total High
GDP $183.1m $193.6m $204.1m
FTE 2,344 2,507 2,670
DHL New Zealand Lions Series 2017 – Evaluation Report 30Sensitivity test 2: International tourists Figure 11: Sensitivity test 2
Our analysis is reliant on self-reported behaviour as we Standard High
use the number of international tourists to extrapolate
% of 5.4% 7.0%
survey results and estimate GDP and FTE impacts.
international
477,000 international visitors came to New Zealand in visitors
June and July 2017. 5.4% of those international visitors Number of 25,760 visitors 33,392 visitors
cited the Series as the main reason for their trip international
(25,760 visitors), and a further 1.6% cited the Series as tourists
part of the reason for their trip (7,632 visitors). As
there is some uncertainty in this, we conducted a The results of the sensitivity testing on the number
sensitivity test that considered the effect on GDP to of international tourists (see Figure 12) shows that
2.2 include all the people visiting for the Series ie travellers
to New Zealand who stated the Series was either the
the total contribution of the Series to New Zealand’s
GDP is likely to be between $194 and $245m. The
main purpose for their trip or part of the purpose for jobs required to support the GDP impact could be as
their trip. high as 3,173 FTEs.
National economic Note we do not consider a low scenario on this self- Figure 12: Sensitivity testing on number of international
reported behaviour as it is unlikely that the true tourists
impact number of visitors is over-reported.
Standard High
GDP $193.6m $244.7m
FTE 2,507 3,173
DHL New Zealand Lions Series 2017 – Evaluation Report 31Approach Hosting & Leverage includes the following
categories: entertainment and hospitality, venue,
We followed a similar approach to the national marketing and other (refer to page 27 for
analysis for each of the economic impact definitions).
assessments of the host cities.
Tourism expenditure from international
We considered three expenditure streams and visitors
collected data on each separately:
• The total tourism expenditure in New Zealand
1. hosting and leverage for the Series from international visitors was used as the
basis.
2. tourism expenditure from international visitors
• The proportion of expenditure relating to
3. domestic tourism expenditure.
2.3 guest nights spent outside the host cities was
removed (ie the proportion of international
Hosting and leverage for the Series visitors’ expenditure in Queenstown is
removed).
• We obtained expenditure data directly from the
Regional economic event hosts. • The remaining expenditure is pro-rated to
each host city using total tickets sold for each
impact • We pro-rated the data provided at the national
level using the total match tickets sold per city as
city as an allocator.
the allocation method. Tourism expenditure from domestic
visitors
• We obtained expenditure data from each host
city that participated in this study. Each host city • We obtained expenditure data from domestic
was able to provide details on spend within its tourists for matches attended outside their
city – which was included in that city’s analysis. own home city.
“Hosting and leverage” includes expenditure that is • We extrapolated this data based on ticketing
a direct result of hosting or enhancing the Series. For data on the location of ticket purchasers.
example, marketing, venue hire and city dressing for
Summary slides are provided in the following
the Series itself as well as event spaces such as the
pages. More detailed results are available in
Fan Zones.
DHL New Zealand Lions Series 2017 – Evaluation Report Appendix C. 32Regional impact for Whangarei
Whangarei hosted the first match of the Series. Figure 13: Overall economic impact for Whangarei ($GDPm) Match 1 - Lions v Provincial Barbarians
Approximately 1,208 international visitors and GDP Direct Indirect Total Saturday 3 June
6,660 domestic tourists attended the match in Venue capacity: 19,720
Whangarei, which was equivalent to 16,162 Tourism $4.3m $1.4m $5.7m
additional guest nights. Hosting & Leverage $0.4m $0.1m $0.5m
Together with the spend from the British and
Total $4.7m $1.5m $6.2m
16,162
Irish Lions team, the impact from tourism
contributed $5.7m to the Whangarei economy
Figure 14: Overall economic impact for Whangarei (FTE)
Guest nights
(including flow-on effects). FTE Direct Indirect Total
Tourism 73 16 89
Including expenditure relating to hosting and Hosting & Leverage 5 1 7
leverage activities, the overall economic Total 78 17 96
contribution of the Series to Whangarei’s GDP
was $6.2m (including flow-on effects). 96 FTEs Figure 15: Sensitivity analysis for Whangarei
were required to support the GDP impact.
Low Standard Total High
Sensitivity testing on expenditure on
GDP $5.9m $6.2m $6.4m
accommodation, food and beverages and
groceries (+/- 10%) suggests a range for the total
FTE 90 96 101 1,208 6,660
contribution to Whangarei’s GDP of $5.9m to
$6.4m, and between 90 and 101 FTEs supported.
international domestic
visitors visitors
DHL New Zealand Lions Series 2017 – Evaluation Report 33Regional impact for Auckland
Auckland hosted three matches in the Series, Figure 16: Overall economic impact for Auckland ($GDPm) Match 2 - Lions v Blues - Wednesday 7 June
including two test matches. Approximately Match 7 - Lions v All Blacks - Saturday 24 June
25,446 international visitors and 33,607 GDP Direct Indirect Total Match 10 - Lions v All Blacks - Saturday 8 July
domestic tourists attended the matches in Tourism $36.6m $22.9m $59.4m Venue capacity: 48,709*
Auckland, which was equivalent to 232,213 Hosting & Leverage $5.1m $3.3m $8.4m
additional guest nights. Total $41.7m $26.2m $67.9m 232,213
Together with the spend from the British and
Irish Lions team, the impact from tourism
Figure 17: Overall economic impact for Auckland (FTE)
FTE Direct Indirect Total
Guest nights
contributed $59.4m to the Auckland economy
(including flow-on effects). Tourism 497 206 703
Hosting & Leverage 71 33 104
Including expenditure relating to hosting and Total 568 240 808
leverage activities, the overall economic
contribution of the Series to Auckland’s GDP was Figure 18: Sensitivity analysis for Auckland
$67.9m (including flow-on effects). 808 FTEs
were required to support the GDP impact. Low Standard Total High
GDP $65.1m $67.9m $70.7m
Sensitivity testing on expenditure on
accommodation, food and beverages and
FTE 764 808 851 25,446 33,607
groceries (+/- 10%) suggests a range for the total
contribution to Auckland’s GDP of $65.1m to
international domestic
$70.7m, and between 764 and 851 FTEs
supported.
visitors visitors
DHL New Zealand Lions Series 2017 – Evaluation Report *Refers to the capacity for the third test. Capacity can differ between matches as 34
the seating configuration can be altered.Regional impact for Christchurch
Christchurch hosted one match during the Series. Figure 19: Overall economic impact for Christchurch ($GDPm) Match 3 - Lions v Crusaders
Approximately 1,956 international visitors and Saturday 10 June
GDP Direct Indirect Total
5,269 domestic tourists attended the match in Venue capacity: 20,635
Wellington, equivalent to 37,551 additional guest Tourism $4.7m $2.7m $7.3m
nights. Hosting & Leverage $0.6m $0.3m $0.9m
Together with the spend from the British and
Total $5.3m $3.0m $8.3m
37,551
Figure 20: Overall economic impact for Christchurch (FTE)
Irish Lions team, the impact from tourism
contributed $7.3m to the Christchurch economy FTE Direct Indirect Total
Guest nights
(including flow-on effects).
Tourism 62 26 88
Including expenditure relating to hosting and Hosting & Leverage 8 4 12
leverage activities, the overall economic Total 70 30 100
contribution of the Series to Christchurch’s GDP
Figure 21: Sensitivity analysis for Christchurch
was $8.3m (including flow-on effects). 100FTEs
were required to support the GDP impact.
Low Standard Total High
Sensitivity testing on the expenditure on GDP $7.9m $8.3m $8.6m
accommodation, food and beverages and
groceries (+/- 10%) suggests a range for the
FTE 95 100 105
1,956 5,269
tourism contribution to Christchurch’s GDP of
$7.9m to $8.6m, and between 95 and 105 FTEs
international domestic
supported. visitors visitors
DHL New Zealand Lions Series 2017 – Evaluation Report 35Regional impact for Rotorua
Rotorua hosted one match during the Series. Figure 22: Overall economic impact for Rotorua ($GDPm) Match 5 - Lions v Maori All Blacks
Approximately 3,141 international visitors and GDP Direct Indirect Total Saturday 17 June
20,203 domestic tourists attended the match in Venue capacity: 28,193
Rotorua, equivalent to 60,155 additional guest Tourism $7.5m $2.8m $10.3m
nights. Hosting & Leverage $0.6m $0.2m $0.8m
Together with the spend from the British and
Total $8.1m $3.0m $11.1m
60,155
Figure 23: Overall economic impact for Rotorua (FTE)
Irish Lions team, the impact from tourism
contributed $10.3m to the Rotorua economy FTE Direct Indirect Total
guest nights
(including flow-on effects).
Tourism 123 30 152
Including expenditure relating to hosting and Hosting & Leverage 7 2 9
leverage activities, the overall economic Total 130 32 162
contribution of the Series to Rotorua’s GDP was
$11.1m (including flow-on effects). 162 FTEs were Figure 24: Sensitivity analysis for Rotorua
required to support the GDP impact.
Low Standard Total High
Sensitivity testing on the expenditure on
3,141 20,203
GDP $10.6m $11.1m $11.7m
accommodation, food and beverages and
FTE 152 162 172
groceries (+/- 10%) suggests a range for the
tourism contribution to Rotorua’s GDP of $10.6m
to $11.7m, and between 152 and 172 FTEs
international domestic
supported. visitors visitors
DHL New Zealand Lions Series 2017 – Evaluation Report 36Regional impact for Hamilton
Hamilton hosted one match during the Series. Figure 25: Overall economic impact for Hamilton ($GDPm) Match 6 - Lions v Chiefs
Approximately 3,356 international visitors and Tuesday 20 June
GDP Direct Indirect Total
12,207 domestic tourists attended the match in
Venue capacity: 29,984
Hamilton, equivalent to 30,917 additional guest Tourism $7.0m $3.0m $10.0m
nights. Hosting & Leverage $0.5m $0.2m $0.7m
Together with the spend from the British and
Total $7.5m $3.3m $10.7m
30,917
Irish Lions team, the impact from tourism
contributed $10.0m to the Hamilton economy
Figure 26: Overall economic impact for Hamilton (FTE)
Guest nights
(including flow-on effects). FTE Direct Indirect Total
Tourism 114 33 147
Including expenditure relating to hosting and
Hosting & Leverage 7 3 9
leverage activities, the overall economic
Total 120 36 156
contribution of the Series to Hamilton’s GDP was
$10.7m (including flow-on effects). 156 FTEs Figure 27: Sensitivity analysis for Hamilton
were required to support the GDP impact.
Low Standard Total High
Sensitivity testing on expenditure on
GDP $10.2m $10.7m $11.2m
accommodation, food and beverages and
groceries (+/- 10%) suggests a range for the
FTE 147 156 166 3,356 12,207
tourism contribution to Hamilton’s GDP of
$10.2m to $11.2m, and between 147 and 166 FTEs
international domestic
supported. visitors visitors
DHL New Zealand Lions Series 2017 – Evaluation Report 37Regional impact for Wellington
Wellington hosted two matches during the Series. Figure 28: Overall economic impact for Wellington ($GDPm) Match 8 - Lions v Hurricanes - Saturday 27 June
Approximately 16,013 international visitors and Match 9 - Lions v All Blacks - Saturday 1 July
GDP Direct Indirect Total
21,572 domestic tourists attended the matches in
Venue capacity: 39,916
Wellington, equivalent to 109,132 additional Tourism $19.6m $7.7m $27.2m
guest nights. Hosting & Leverage $2.4m $1.1m $3.5m
Together with the spend from the British and
Total $21.9m $8.7m $30.7m 109,132
Figure 29: Overall economic impact for Wellington (FTE)
Irish Lions team, the impact from tourism
contributed $27.2m to the Wellington economy Guest nights
(including flow-on effects). FTE Direct Indirect Total
Tourism 305 63 368
Including expenditure relating to hosting and
Hosting & Leverage 29 10 39
leverage activities, the overall economic
Total 334 73 407
contribution of the Series to Wellington’s GDP
was $30.7m (including flow-on effects). 407 FTEs Figure 30: Sensitivity analysis for Wellington
were required to support the GDP impact.
Low Standard Total High
Sensitivity testing on the expenditure on
accommodation, food and beverages and
groceries (+/- 10%) suggests a range for the
GDP
FTE
$29.4m
381
$30.7m
407
$32.0m
432 16,013 21,572
tourism contribution to Wellington’s GDP of
$29.4m to $32.0m, and between 381 and 432
international domestic
FTEs supported. visitors visitors
DHL New Zealand Lions Series 2017 – Evaluation Report 3803
Broader benefits
DHL New Zealand Lions Series 2017 – Evaluation Report 393.1 Domestic reputation DHL New Zealand Lions Series 2017 – Evaluation Report 40
In July 2017, Kantar TNS surveyed New Zealand residents to gauge their awareness
and perceptions of the recent Series and related festival events
Background Research approach
This section considers the reputational impact of the Series among the Kantar TNS designed and conducted a 10 minute online survey of New
domestic audience, addressing key questions including: Zealand residents aged 18 plus to answer these questions.
– awareness of the Series and festival events The survey ran in market from 17 to 23 July 2017 (the Series itself ended on 8
– attendance of Series matches and broadcast viewership July 2017).
– attendance of the related festival events 1000 people completed the survey; these people were randomly surveyed from
ConsumerLink’s online panel.
– perceptions of New Zealand, among those aware of the Series, on a range of
attributes of interest to MBIE. The data has been weighted by age, gender and region according to Stats NZ
population estimates, to ensure the sample is representative of the target
population.
Any tests of statistical significance have been conducted at the 90% confidence
level.
It should be noted that all responses are based on claimed behaviour /
attendance.
Summary slides are provided in the following pages. More detailed results are
available in Appendix C.
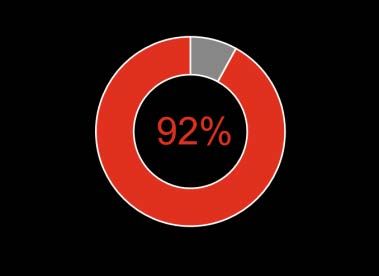
DHL New Zealand Lions Series 2017 – Evaluation Report 41At over 90% of New Zealand adults, awareness of the Series was strong, particularly
among those surveyed aged 30 or over and pre-family households
Prompted awareness of the DHL New Zealand Lions Statistically significant differences
Series 2017
Significantly higher among:
– 70+ years (97%)
– North Island residents (93%)
– Households without children (94%).
92% Significantly lower among:
– 18-29 years (87%)
– South Island residents (89%)
– Households with children of school age or less (90%)
– Other* ethnicity (87%).
Base: New Zealanders aged 18 plus | Sample size: n=1000 | *Other means neither New Zealand European nor Māori / Pasifika
DHL New Zealand Lions Series 2017 – Evaluation Report 42You can also read